Embed Size (px)
Citation preview
SPIE's 5th conference on Vibration Measurements by Laser Techniques : Advances and Applications, Ancona, Italy 18-21 June 2002 1
Holographic interferometers based on photorefractive crystals for vibration measurements
Marc Georgesa, Cédric Thizya, Sébastien Ryhonb, Gilles Pauliatc,
Philippe Lemairea, Gérald Roosenc
a Centre Spatial de Liège, Parc Scientifique du Sart Tilman, Avenue du Pré Aily, B-4031 Angleur
(Liège), Belgium, ph : 32-4-3676668, fax : 32-4-3675613,[email protected] b Optrion S.A., rue des Chasseurs Ardennais, B-4031 Angleur (Liège), Belgium, ph : 32-4-3729333,
[email protected] c Laboratoire Charles Fabry de l'Institut d'Optique/Centre National de la Recherche
Scientifique/Université Paris Sud, Bâtiment 503, 91403 Orsay Cedex, France, ph : 33-1-69358755, fax : 33-1-69413192, [email protected]
ABSTRACT
Photorefractive crystals offer many advantages over other classical holographic recording media. They allow fast in-situ processable holographic recording as well as indefinite reusability. Moreover high signal-to-noise ratio can be reached as well as high resolutions. We present several types of holographic instruments using such materials. Here we will emphasize their applications in vibration measurements. A first one is based on the classical stroboscopic technique, a second one uses a pulsed laser.
Keywords : Holographic interferometry, vibration measurement, photorefractive crystals
1. INTRODUCTION
Holographic Interferometry (HI)1,2
is method for measuring deformations of diffusive objects. For vibrations measurement, its non contact and whole field characteristics are advantages over the classical methods that use accelerometers attached on a limited number of points of the studied objects, perturbating so the measured values, as well as limiting the spatial sampling. The properties of the holographic recording medium used in HI are the key factors to the success of this technique. Traditional media (silver halide plates, thermoplastics) do not make the hologram immediately available because of their respective physico-chemical processing. This is why recent works in the holographic-based measurement techniques and in whole field vibration analysis turn to recording media allowing a quasi-instantaneous availability of the information, such as CCDs (speckle techniques3 and digital holography4) and photorefractive crystals5-7. The main interest of photorefractives in this case is that they do not constitute a limit regarding the holographic acquisition time since recordings can be performed at the nanosecond time scale, which is much faster than the natural barriers of frame transfer duration that face CCD-based systems.
Our works are based on photorefractive crystals (PRCs) of the sillenite family (Bi12SiO20 (BSO), Bi12GeO20 (BGO), Bi12TiO20 (BTO))8,9 that have proved they were promising recording materials for HI in the visible range (blue-green wavelengths). In these crystals charge migration appears, under the photoconduction effect, between illuminated and dark zones that result from the interference between two incident mutually coherent beams (object and reference). After charge trapping in crystal defects of the dark zones, a local space charge field is created and modulates the refractive index, through the linear electro-optic effect, creating a phase hologram. This process is dynamic and reversible. The hologram is building up with a certain time constant and reaches a saturation level. The two important figures of merit to consider in applications are the diffraction efficiency and the recording energy density.
First, the diffraction efficiency is simply the ratio between the diffracted beam intensity and the readout beam entering the crystal. PRCs have relatively small efficiencies compared to other media (10-3 to 10-4). Nevertheless this is
SPIE's 5th conference on Vibration Measurements by Laser Techniques : Advances and Applications, Ancona, Italy 18-21 June 2002 2
not a problem if one considers special properties ot the crystals such as coupling effect 7 or anisotropy of diffraction 5,10. Second, the energy density of recording is a constant of the materials when several experimental parameters are fixed (wavelength, angle between beams, value of external electric field). The energy density is the quantity of luminous energy by unit surface that is necessary to reach the saturation of holographic recording. For a BSO crystal with 50° between recording beams and no electric field, its value is about 10 mJ/cm2. This quantity is the product between the response time of the crystal and the total intensity of the recording beams. An important consequence is that the hologram can be recorded either with continuous or pulsed lasers. At the present state-of-the-art, one can say that PRCs have practically no limit in the response speed since they (at least) respond at the nanosecond scale.
Besides this dynamic behaviour, PRCs present interesting features. Mainly we can distinguish two separate configurations related to the polarization state of the diffracted beam, either anisotropy or isotropy of diffraction can occur. In function of the application we can choose the suitable diffraction behaviour. Each one of these processes is authorized by a suitable choice of the direction of the grating wave vector with respect to the crystallographic axes, the polarization states of the recording beams and the direction of an external electric field. In the applications described here, no external electric field is applied. The reason is that, without applied field, the diffraction is maximized at large angle between recording beams, what is more advantageous if one wants to use short focal lengths objectives in front of the crystal for observation of large objects (ref).
Pioneering experiments of vibration analysis using HI with sillenite PRCs consisted of time-averaged HI 12,13
. These works have shown that PRCs are particularily well suited for time-averaged HI. With conventional non-self processable media, the hologram has to be recorded when the object is close or at a resonant mode, what is a drawback because a large number of recordings with different holographic plates is necessary to obtain a few images of mode shapes. With PRCs, this is much simpler : the sinusoidal excitation frequency is scanned and, when the resonance is reached, the image of the mode immediately appears. Unhappily time-averaged is poorly adapted to quantitative measurement because of the non-sinusoidal fringe profile.
In this paper we present different holographic interferometers that have been developed with PRCs. Contrarily to the above discussed examples, we use real-time HI : a hologram is recorded in the crystal and furtherly readout when the object is moving due to vibration. One then observes the interference between the beam diffracted by the crystal (replica of the object state at the recording) and the beam directly transmitted through the crystal, showing the optical phase difference between the two object states at the recording and the readout. The advantage of the real-time method is that sinusoidal fringe profiles are obtained, allowing proper application of usual phase quantification techniques, such as the phase-shifting. In the following, we will describe two instruments. The first one uses a continuous Nd:YAG laser and stroboscopic readout (section 2). The second one uses a pulsed laser (YAG Q-switch), one pulse is used to record the hologram at any moment of its vibration and the second pulse at another instant of the vibration (section 3). For both examples we will describe the working principle as well as applications. We will conclude this paper by presenting the objectives of an EC-funded project (PHIFE) in the field of pulsed illumination HI for vibration analysis.
2. STROBOSCOPIC HOLOGRAPHIC INTERFEROMETRY WITH CONTINUOUS LASER
2.1. Working principle
The device presented here is a simple adaptation of an instrument developed for non-stroboscopic applications, mainly non-destructive testing 10,11
. We will briefly recall its working principle and some basic performances. The technique we use here is extremely straightforward and simple to implement, it is refered as self-diffraction and is associated to anisotropy of diffraction. The object and readout beams are continuously incident on the crystal. A hologram is then recorded within the response time, depending on the crystal sensitivity (function of the species and the geometry) and on the total incident intensities
8,9. If the object undergoes a deformation, one directly observes the
corresponding interferogram and the phase-shifting process can be started, if needed. This is called the self-diffraction because the readout beam is exactly the same than that serving during the recording. From that moment, a new hologram corresponding to the new object state is under recording, erasing the previous one. The interferogram is then vanishing within the response time, but generally we use beam intensities such that the response time is long enough to allow image capture by a frame grabber. It has to be noted that the diffraction efficiency is notably low so there is a strong difference between the transmitted object and the diffracted intensities. To overcome this difficulty, the crystal is used in the « anisotropy of diffraction » configuration : by suitably orientating a linear polarizer in front of the crystal, one can arrange that the diffracted wave has its polarization orthogonal to that of the direct wave. Then a polarizer is set
SPIE's 5th conference on Vibration Measurements by Laser Techniques : Advances and Applications, Ancona, Italy 18-21 June 2002 3
after the crystal in order to balance the intensities (for maximization of the fringe contrast) and reach high SNR interferograms
10,11.
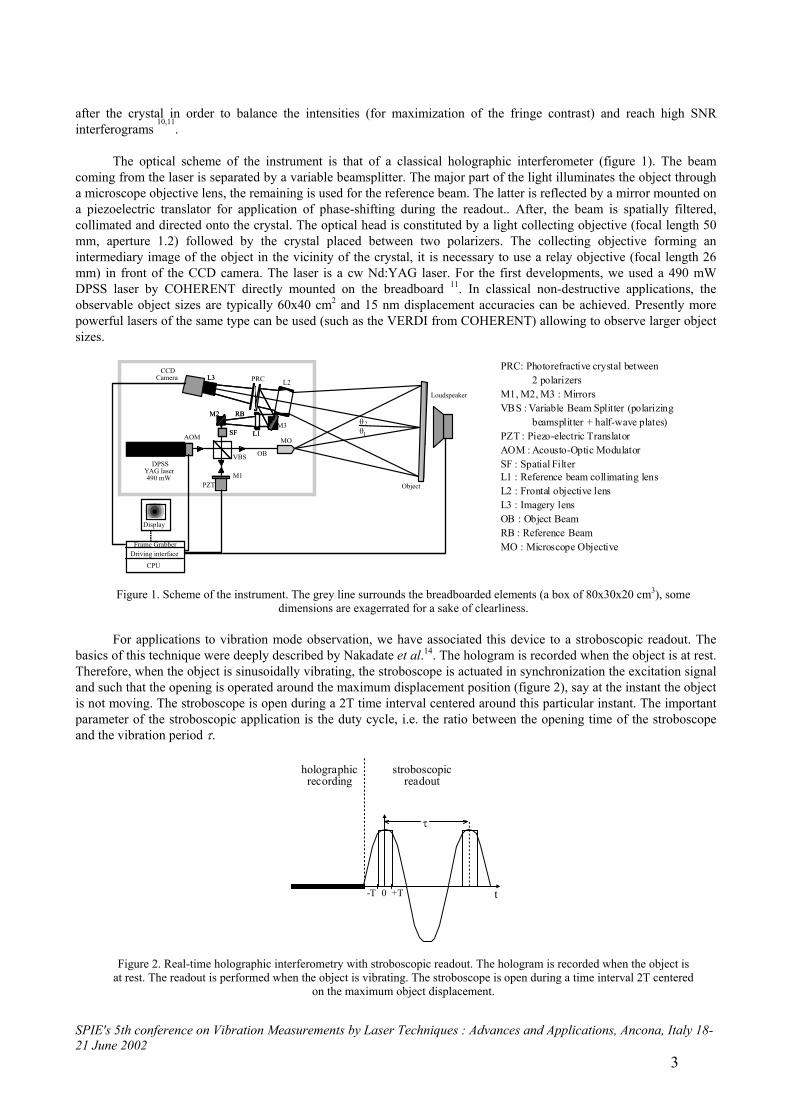
The optical scheme of the instrument is that of a classical holographic interferometer (figure 1). The beam coming from the laser is separated by a variable beamsplitter. The major part of the light illuminates the object through a microscope objective lens, the remaining is used for the reference beam. The latter is reflected by a mirror mounted on a piezoelectric translator for application of phase-shifting during the readout.. After, the beam is spatially filtered, collimated and directed onto the crystal. The optical head is constituted by a light collecting objective (focal length 50 mm, aperture 1.2) followed by the crystal placed between two polarizers. The collecting objective forming an intermediary image of the object in the vicinity of the crystal, it is necessary to use a relay objective (focal length 26 mm) in front of the CCD camera. The laser is a cw Nd:YAG laser. For the first developments, we used a 490 mW DPSS laser by COHERENT directly mounted on the breadboard 11. In classical non-destructive applications, the observable object sizes are typically 60x40 cm2 and 15 nm displacement accuracies can be achieved. Presently more powerful lasers of the same type can be used (such as the VERDI from COHERENT) allowing to observe larger object sizes.
Display
MO
VBS DPSS
YAG laser490 mW
RB
PRCCCD
Camera
Object
M2
M3
OB
AOM
PZT
L2
L1
L3
SF
Frame Grabber
CPU
Driving interface
M1
Display
RBM2
L1
L3
SF
Loudspeaker
Frame Grabber
CPU
Driving interface
θ1
θ2
PRC: Photorefractive crystal between 2 polarizersM1, M2, M3 : MirrorsVBS : Variable Beam Splitter (polarizing beamsplitter + half-wave plates)PZT : Piezo-electric TranslatorAOM : Acousto-Optic ModulatorSF : Spatial FilterL1 : Reference beam collimating lensL2 : Frontal objective lensL3 : Imagery lensOB : Object BeamRB : Reference BeamMO : Microscope Objective
Figure 1. Scheme of the instrument. The grey line surrounds the breadboarded elements (a box of 80x30x20 cm3), some dimensions are exagerrated for a sake of clearliness.
For applications to vibration mode observation, we have associated this device to a stroboscopic readout. The basics of this technique were deeply described by Nakadate et al.14. The hologram is recorded when the object is at rest. Therefore, when the object is sinusoidally vibrating, the stroboscope is actuated in synchronization the excitation signal and such that the opening is operated around the maximum displacement position (figure 2), say at the instant the object is not moving. The stroboscope is open during a 2T time interval centered around this particular instant. The important parameter of the stroboscopic application is the duty cycle, i.e. the ratio between the opening time of the stroboscope and the vibration period τ.
t0-T +T
τ
holographicrecording
stroboscopicreadout
Figure 2. Real-time holographic interferometry with stroboscopic readout. The hologram is recorded when the object is at rest. The readout is performed when the object is vibrating. The stroboscope is open during a time interval 2T centered
on the maximum object displacement.
SPIE's 5th conference on Vibration Measurements by Laser Techniques : Advances and Applications, Ancona, Italy 18-21 June 2002 4
The choice of the correct duty cycle is a compromise. On one hand, the higher the time interval 2T, the higher the quantity of light received by the CCD camera. Therefore, for a given power used to illuminate the object, the larger will be the observed area. On another hand, the smaller the duty cycle, the better the fringes contrast. This is obvious because if one increases the time interval 2T, the image of the object is no longer stable but integrates different states of the moving object (from times -T to T). Therefore the interferogram is blurred. In practice, duty cycles of 15 to 20% are used. Under these conditions and with a DPSS laser of 490 mW, typical object sizes of 25x25 cm2 can be reached in stroboscopic working mode. At the temporal level, during the stroboscopic readout, since a small portion of the light is used, the erasure time of the hologram (due to the photorefractive dynamic effect) is long, what is an advantage. Typically, one can have 1 minute for the stroboscopic readout. During this time we can then scan the excitation frequency step by step and see the mode appear. After this time, the hologram is too weak and the stroboscope has to be stopped to reacquire a fresh hologram of the object at rest, afterwards the stroboscopic readout is reactivated for further frequency scanning.
2.2. Applications
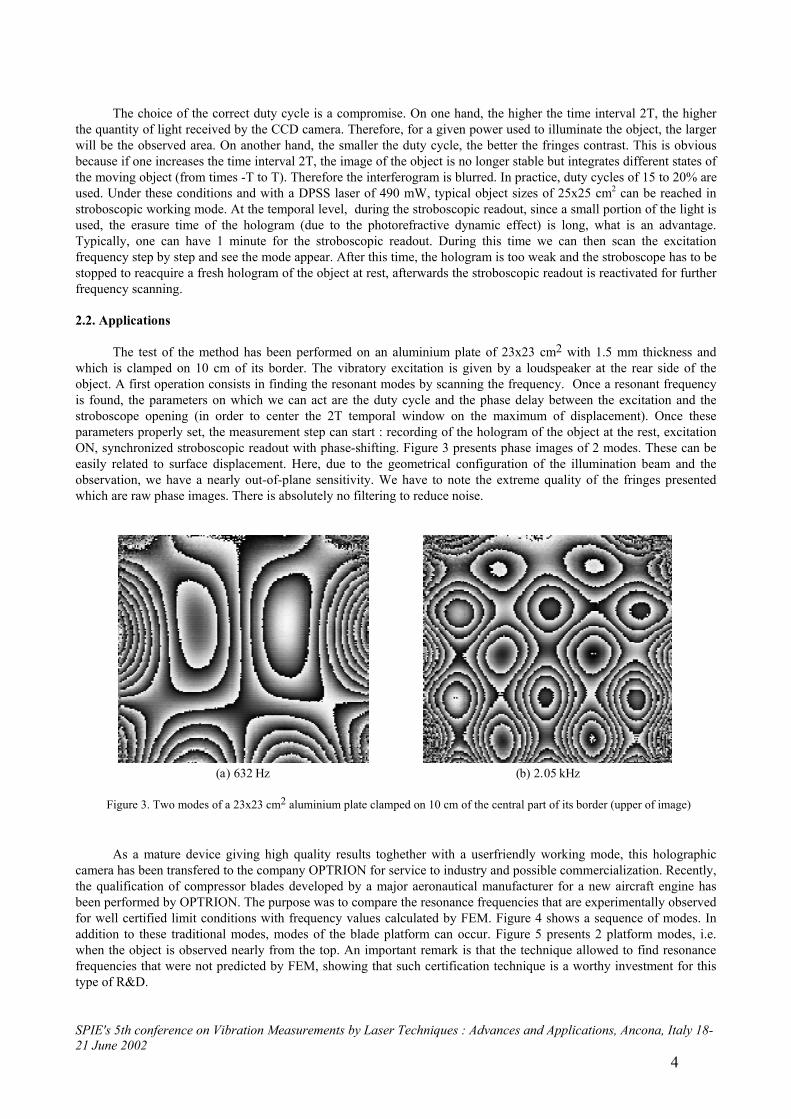
The test of the method has been performed on an aluminium plate of 23x23 cm2 with 1.5 mm thickness and which is clamped on 10 cm of its border. The vibratory excitation is given by a loudspeaker at the rear side of the object. A first operation consists in finding the resonant modes by scanning the frequency. Once a resonant frequency is found, the parameters on which we can act are the duty cycle and the phase delay between the excitation and the stroboscope opening (in order to center the 2T temporal window on the maximum of displacement). Once these parameters properly set, the measurement step can start : recording of the hologram of the object at the rest, excitation ON, synchronized stroboscopic readout with phase-shifting. Figure 3 presents phase images of 2 modes. These can be easily related to surface displacement. Here, due to the geometrical configuration of the illumination beam and the observation, we have a nearly out-of-plane sensitivity. We have to note the extreme quality of the fringes presented which are raw phase images. There is absolutely no filtering to reduce noise.
(a) 632 Hz (b) 2.05 kHz
Figure 3. Two modes of a 23x23 cm2 aluminium plate clamped on 10 cm of the central part of its border (upper of image)
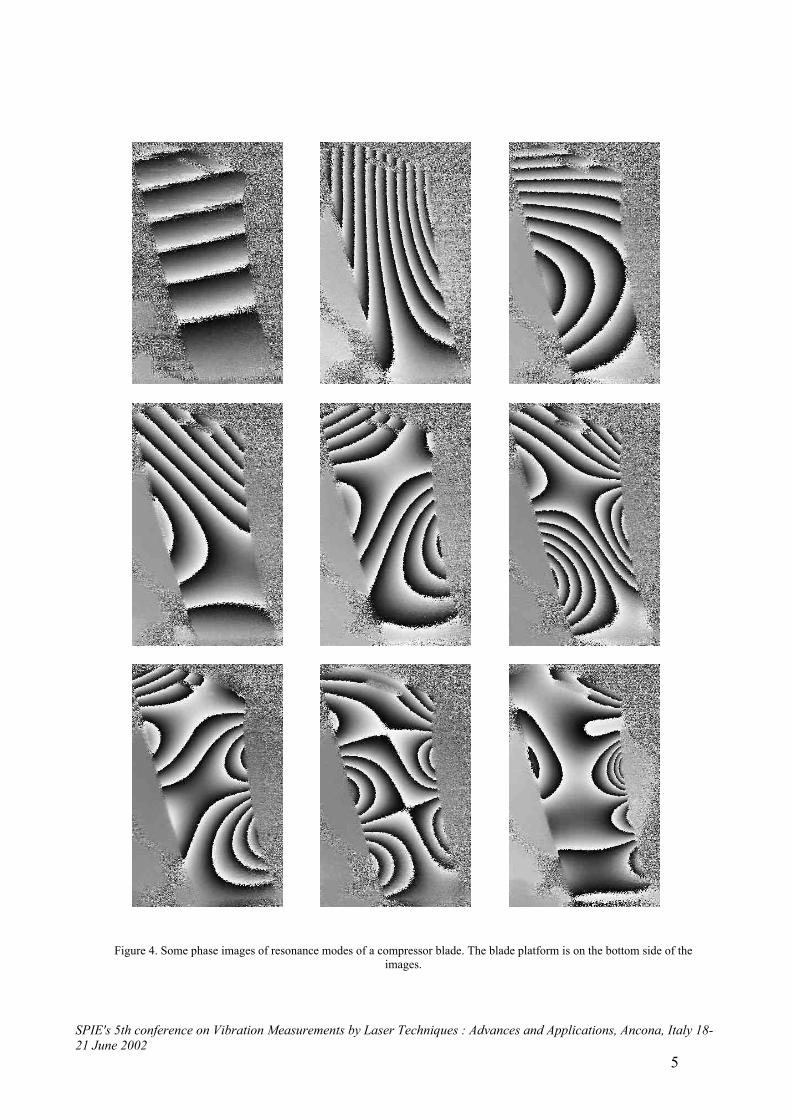
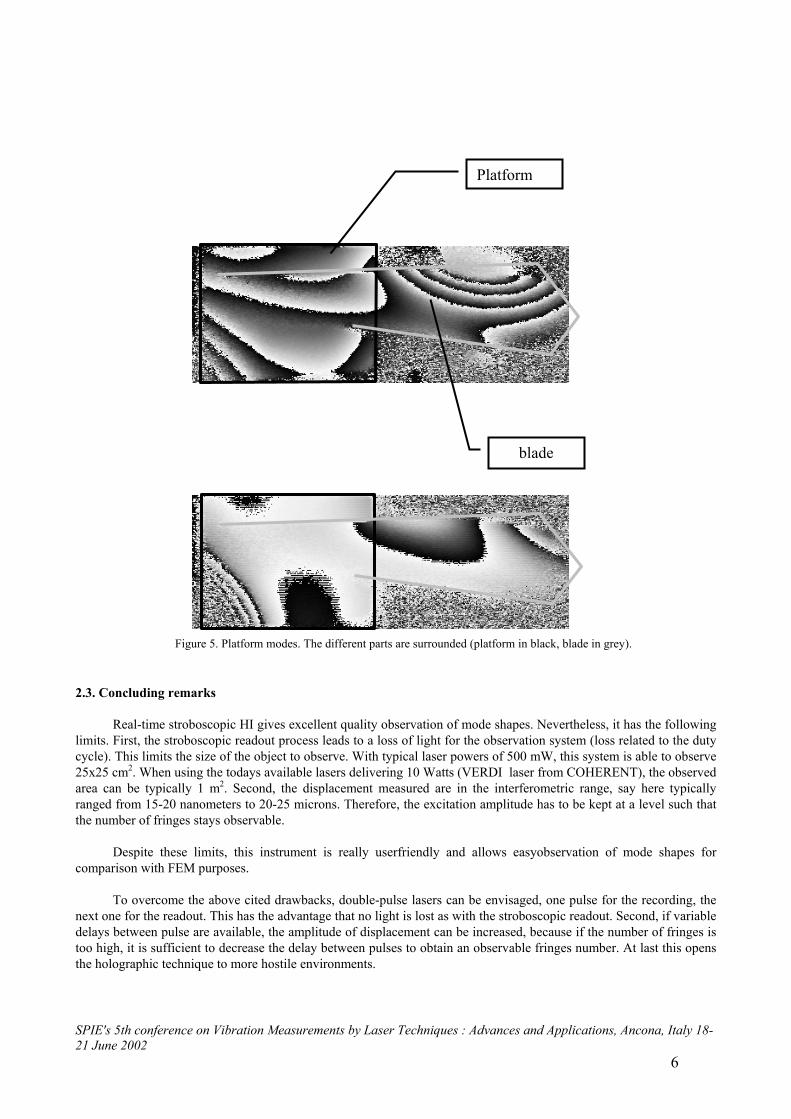
As a mature device giving high quality results toghether with a userfriendly working mode, this holographic camera has been transfered to the company OPTRION for service to industry and possible commercialization. Recently, the qualification of compressor blades developed by a major aeronautical manufacturer for a new aircraft engine has been performed by OPTRION. The purpose was to compare the resonance frequencies that are experimentally observed for well certified limit conditions with frequency values calculated by FEM. Figure 4 shows a sequence of modes. In addition to these traditional modes, modes of the blade platform can occur. Figure 5 presents 2 platform modes, i.e. when the object is observed nearly from the top. An important remark is that the technique allowed to find resonance frequencies that were not predicted by FEM, showing that such certification technique is a worthy investment for this type of R&D.
SPIE's 5th conference on Vibration Measurements by Laser Techniques : Advances and Applications, Ancona, Italy 18-21 June 2002 5
Figure 4. Some phase images of resonance modes of a compressor blade. The blade platform is on the bottom side of the images.
SPIE's 5th conference on Vibration Measurements by Laser Techniques : Advances and Applications, Ancona, Italy 18-21 June 2002 6
Figure 5. Platform modes. The different parts are surrounded (platform in black, blade in grey).
2.3. Concluding remarks
Real-time stroboscopic HI gives excellent quality observation of mode shapes. Nevertheless, it has the following limits. First, the stroboscopic readout process leads to a loss of light for the observation system (loss related to the duty cycle). This limits the size of the object to observe. With typical laser powers of 500 mW, this system is able to observe 25x25 cm2. When using the todays available lasers delivering 10 Watts (VERDI laser from COHERENT), the observed area can be typically 1 m2. Second, the displacement measured are in the interferometric range, say here typically ranged from 15-20 nanometers to 20-25 microns. Therefore, the excitation amplitude has to be kept at a level such that the number of fringes stays observable.
Despite these limits, this instrument is really userfriendly and allows easyobservation of mode shapes for comparison with FEM purposes.
To overcome the above cited drawbacks, double-pulse lasers can be envisaged, one pulse for the recording, the next one for the readout. This has the advantage that no light is lost as with the stroboscopic readout. Second, if variable delays between pulse are available, the amplitude of displacement can be increased, because if the number of fringes is too high, it is sufficient to decrease the delay between pulses to obtain an observable fringes number. At last this opens the holographic technique to more hostile environments.
blade
Platform

SPIE's 5th conference on Vibration Measurements by Laser Techniques : Advances and Applications, Ancona, Italy 18-21 June 2002 7
3. MULTIPLE EXPOSURE TECHNIQUE BASED ON PULSED LASERS
3.1. Preliminary remarks
The Laboratoire Charles Fabry de l'Institut d'Optique (LCFIO) developed a photorefractive holographic camera operating in the pulse regime 6,7. This instrument contains two CCD cameras allowing to capture two phase shifted images simultaneously during the holographic readout step. A preliminary measurement of the mean intensity of the image without interference fringes is however necessary to calculate the phase. Initially, this camera was designed for vibration analysis using a ruby laser. The main drawback is that the laser wavelength (694 nm) does not match the sensitivity range of BSO and BGO crystals. A copper doped BGO sample was specially grown 15 to increase the sensitivity at 694 nm. Despite the optimized doping, the diffraction efficiency was still low and the vibration interferograms obtained in these conditions were quite noisy. Nevertheless, measurement error of λ/15 has been obtained, which is quite acceptable.
Since then, the Centre Spatial de Liège (CSL) and LCFIO have carried on this work together 16. The laser used is a frequency doubled Q-switched YAG (COHERENT Infinity) whose wavelength is naturally adapted to sillenite crystals. For these new experiments, and for those described hereafter, the photorefractive crystal is a nominally undoped BGO sample 15. It is cut along the so-called beam coupling configuration : the beams enter the crystal by the (1 1 0) crystallographic face, the grating wave vector being along the 110[ ] axis. The input faces (3 cm x 3 cm) are anti-reflection coated; the crystal thickness is 1 cm. Such high optical window allows one to relax constraints related to imagery as well as to increase the amount of light collected by the imaging system.
3.2. Working principle
Since it is again the real-time HI method, a first pulse records the hologram of the object at some instant, the object is then visualised through the crystal whilst the hologram is reconstructed by the second pulse. Many constraints have to be taken into account:
1°) the crystal must receive a certain energy density to write the hologram (for BGO crystals, about 15 mJ/cm2). This energy is mainly brought by the reference beam, since the studied object generally scatters light. To obtain a hologram with satisfactory diffraction efficiency, the whole energy of the laser has to be used with the adequate ratio between object/reference beams energy.
2°) the second pulse must not degrade the hologram recorded by the first pulse, the energy in the reference arm must therefore be reduced for this second pulse.
3°) during the hologram readout, the CCDs must not be bloomed. The energy in the object arm must therefore be reduced too.
The last two points imply a decrease in the energy sent into the system for the readout, as well as a change in the ratio between objet/reference energies. The laser we used (COHERENT INFINITY) has a simple cavity and its energy cannot be modified from one pulse to the next one, which implied to implement an external system of balance in energy between the two pulses. It is based on Pockels cells (modifying the beam polarisations) and polarising beam splitters.
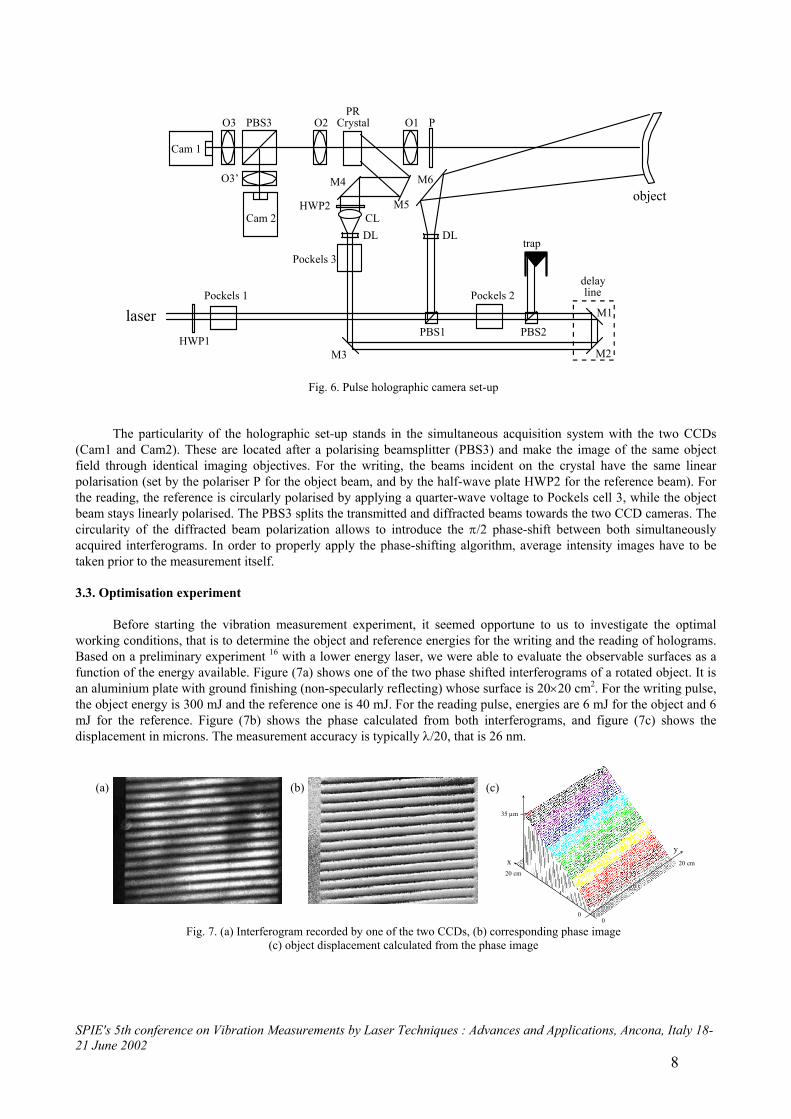
The experiment set-up is shown in figure 6. The laser beam is split into object and reference beams by a first polarising beamsplitter (PBS1). The energy balance for the first pulse is adjusted using the half-wave plate HWP1, the Pockels cells 1 and 2 are not activated. During the second pulse, a half-wave voltage is applied to the Pockels cells. Pockels cell 1 is adjusted such that a few mJ energy beam illuminates the object without blooming the CCDs (see 3° above). The remaining energy is sent in the reference arm, the Pockels cell 2 is then also charged with a half-wave voltage, what rotates the beam polarization and, through the second polarising beamsplitter (PBS2), redirect most of the energy into a trap. The energy in the reference is therefore low enough to read the hologram without recording a new one (see 2°). A delay line is introduced in the reference path (2 movable mirrors M1 and M2) so as to equalise the optical paths of both arms.
SPIE's 5th conference on Vibration Measurements by Laser Techniques : Advances and Applications, Ancona, Italy 18-21 June 2002 8
laserPBS2
Pockels 2
Pockels 3trap
P
HWP2
O1O2
Cam 1
Cam 2
PBS3O3
O3’
PRCrystal
object
DL
M6
PBS1
M1
M2M3
DLCL
M4
M5
delaylinePockels 1
HWP1
Fig. 6. Pulse holographic camera set-up
The particularity of the holographic set-up stands in the simultaneous acquisition system with the two CCDs (Cam1 and Cam2). These are located after a polarising beamsplitter (PBS3) and make the image of the same object field through identical imaging objectives. For the writing, the beams incident on the crystal have the same linear polarisation (set by the polariser P for the object beam, and by the half-wave plate HWP2 for the reference beam). For the reading, the reference is circularly polarised by applying a quarter-wave voltage to Pockels cell 3, while the object beam stays linearly polarised. The PBS3 splits the transmitted and diffracted beams towards the two CCD cameras. The circularity of the diffracted beam polarization allows to introduce the π/2 phase-shift between both simultaneously acquired interferograms. In order to properly apply the phase-shifting algorithm, average intensity images have to be taken prior to the measurement itself.
3.3. Optimisation experiment
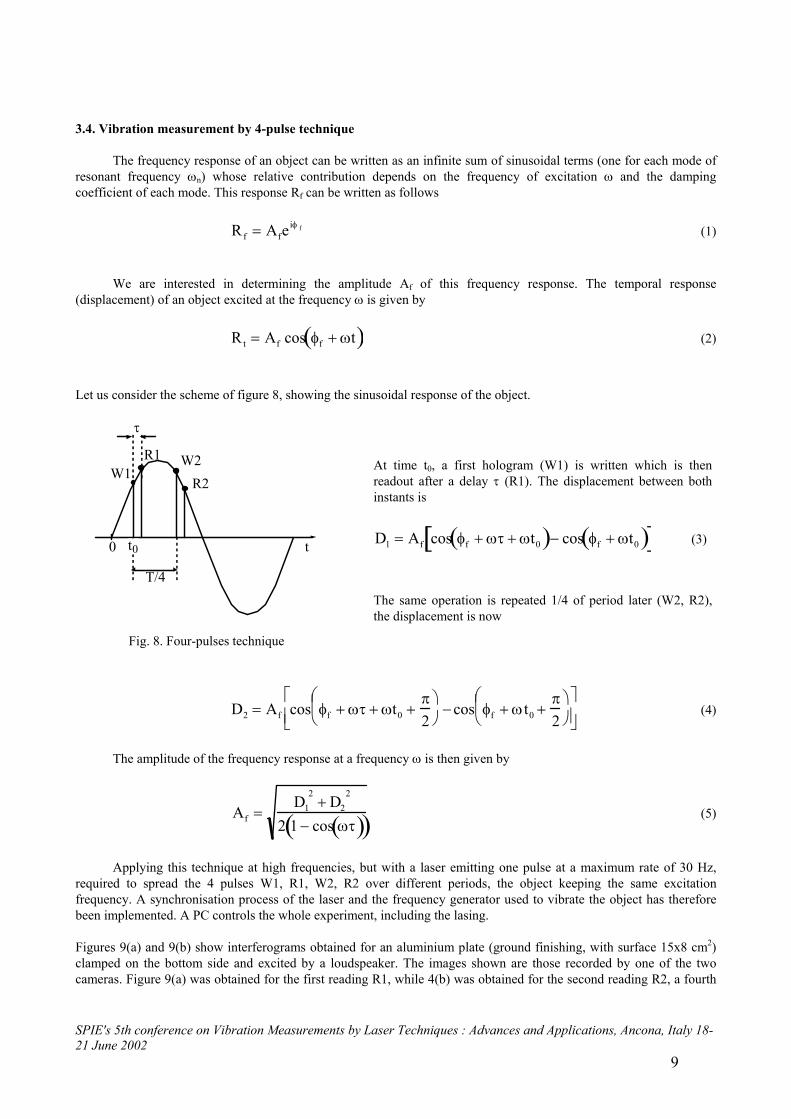
Before starting the vibration measurement experiment, it seemed opportune to us to investigate the optimal working conditions, that is to determine the object and reference energies for the writing and the reading of holograms. Based on a preliminary experiment 16 with a lower energy laser, we were able to evaluate the observable surfaces as a function of the energy available. Figure (7a) shows one of the two phase shifted interferograms of a rotated object. It is an aluminium plate with ground finishing (non-specularly reflecting) whose surface is 20×20 cm2. For the writing pulse, the object energy is 300 mJ and the reference one is 40 mJ. For the reading pulse, energies are 6 mJ for the object and 6 mJ for the reference. Figure (7b) shows the phase calculated from both interferograms, and figure (7c) shows the displacement in microns. The measurement accuracy is typically λ/20, that is 26 nm.
(a)
(b)
(c)
0
20 cm
x 20 cm
0
y
35 µm
Fig. 7. (a) Interferogram recorded by one of the two CCDs, (b) corresponding phase image
(c) object displacement calculated from the phase image
SPIE's 5th conference on Vibration Measurements by Laser Techniques : Advances and Applications, Ancona, Italy 18-21 June 2002 9
3.4. Vibration measurement by 4-pulse technique
The frequency response of an object can be written as an infinite sum of sinusoidal terms (one for each mode of resonant frequency ωn) whose relative contribution depends on the frequency of excitation ω and the damping coefficient of each mode. This response Rf can be written as follows
Rf = Afeiφ f (1)
We are interested in determining the amplitude Af of this frequency response. The temporal response (displacement) of an object excited at the frequency ω is given by
Rt = Af cos φf + ωt( ) (2)
Let us consider the scheme of figure 8, showing the sinusoidal response of the object.
W1W2R1
R2
T/4
τ
0 tt0
Fig. 8. Four-pulses technique
D2 = Af cos φf + ωτ + ωt0 +
π2
−cos φf + ωt0 +
π2
(4)
The amplitude of the frequency response at a frequency ω is then given by
Af =
D12
+ D22
2 1 − cos ωτ( )( ) (5)
Applying this technique at high frequencies, but with a laser emitting one pulse at a maximum rate of 30 Hz, required to spread the 4 pulses W1, R1, W2, R2 over different periods, the object keeping the same excitation frequency. A synchronisation process of the laser and the frequency generator used to vibrate the object has therefore been implemented. A PC controls the whole experiment, including the lasing.
Figures 9(a) and 9(b) show interferograms obtained for an aluminium plate (ground finishing, with surface 15x8 cm2) clamped on the bottom side and excited by a loudspeaker. The images shown are those recorded by one of the two cameras. Figure 9(a) was obtained for the first reading R1, while 4(b) was obtained for the second reading R2, a fourth
At time t0, a first hologram (W1) is written which is then readout after a delay τ (R1). The displacement between both instants is
D1 = Af cos φf + ωτ + ωt0( )− cos φf + ωt0( )[ ] (3)
The same operation is repeated 1/4 of period later (W2, R2), the displacement is now
SPIE's 5th conference on Vibration Measurements by Laser Techniques : Advances and Applications, Ancona, Italy 18-21 June 2002 10
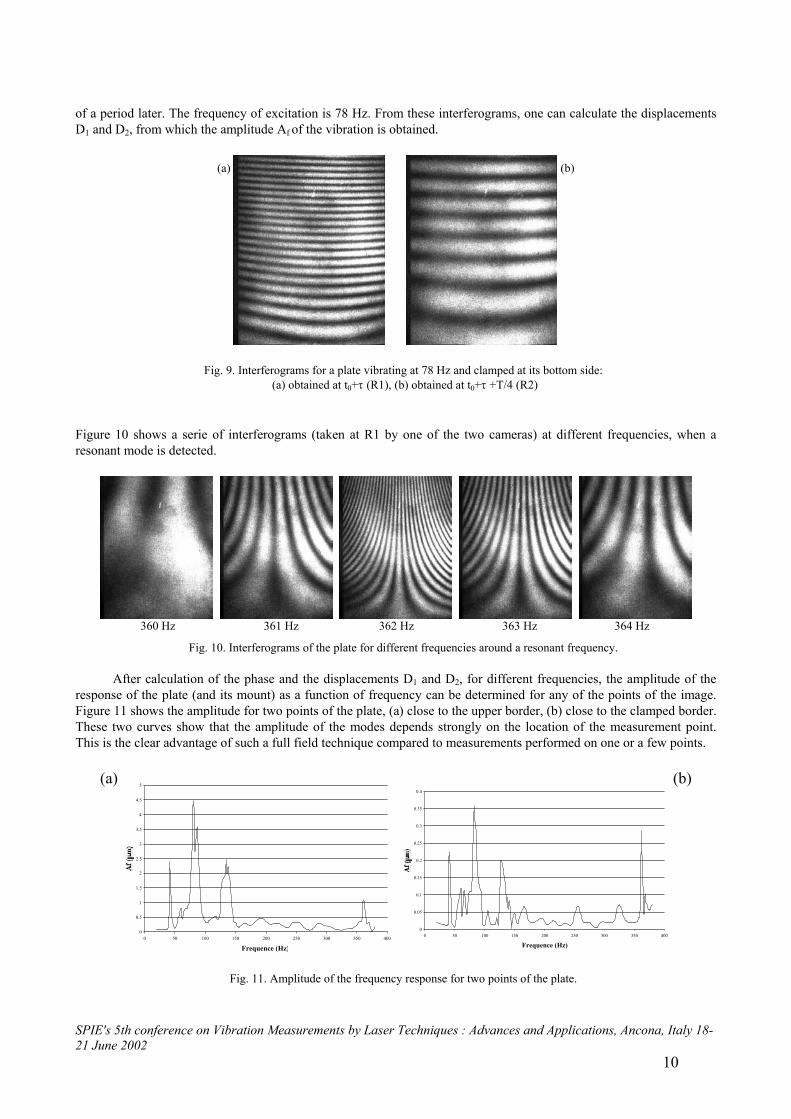
of a period later. The frequency of excitation is 78 Hz. From these interferograms, one can calculate the displacements D1 and D2, from which the amplitude Af of the vibration is obtained.
(a)
(b)
Fig. 9. Interferograms for a plate vibrating at 78 Hz and clamped at its bottom side: (a) obtained at t0+τ (R1), (b) obtained at t0+τ +T/4 (R2)
Figure 10 shows a serie of interferograms (taken at R1 by one of the two cameras) at different frequencies, when a resonant mode is detected.
360 Hz 361 Hz 362 Hz 363 Hz 364 Hz
Fig. 10. Interferograms of the plate for different frequencies around a resonant frequency.
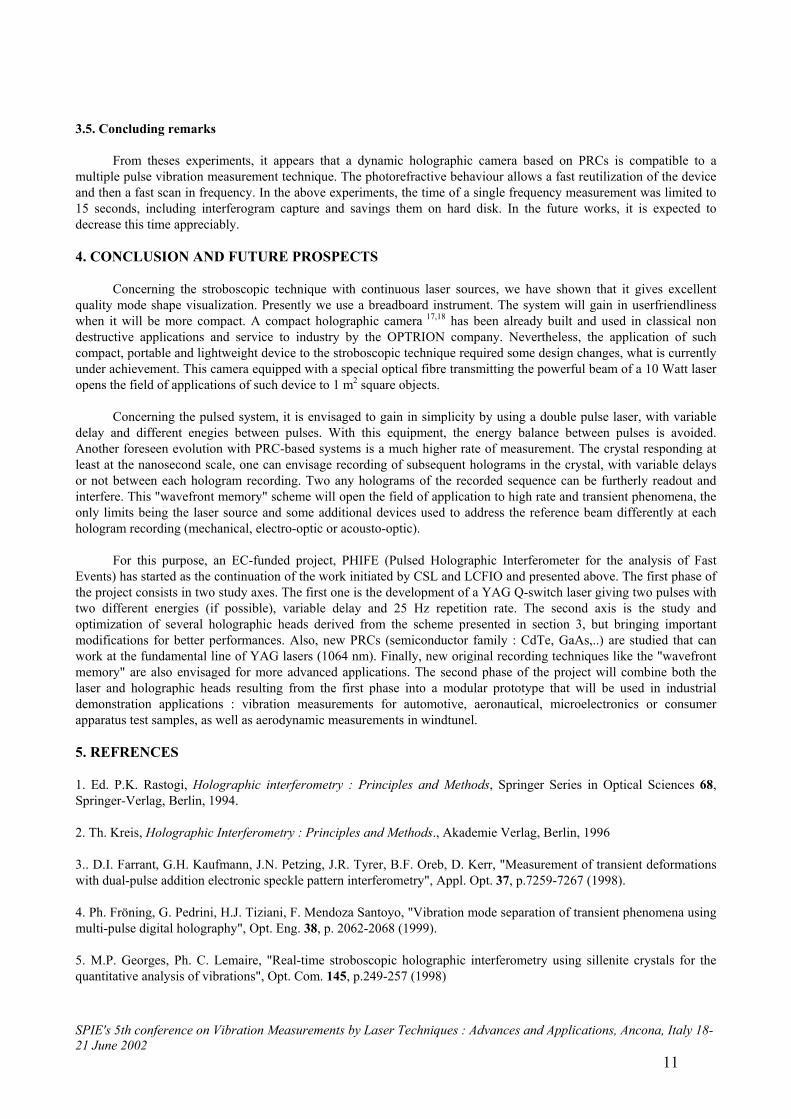
After calculation of the phase and the displacements D1 and D2, for different frequencies, the amplitude of the response of the plate (and its mount) as a function of frequency can be determined for any of the points of the image. Figure 11 shows the amplitude for two points of the plate, (a) close to the upper border, (b) close to the clamped border. These two curves show that the amplitude of the modes depends strongly on the location of the measurement point. This is the clear advantage of such a full field technique compared to measurements performed on one or a few points.
(a)
0
0.5
1
1.5
2
2.5
3
3.5
4
4.5
5
0 50 100 150 200 250 300 350 400
Frequence (Hz)
0
0.05
0.1
0.15
0.2
0.25
0.3
0.35
0.4
0 50 100 150 200 250 300 350 400
Frequence (Hz)
(b)
Fig. 11. Amplitude of the frequency response for two points of the plate.
SPIE's 5th conference on Vibration Measurements by Laser Techniques : Advances and Applications, Ancona, Italy 18-21 June 2002 11
3.5. Concluding remarks
From theses experiments, it appears that a dynamic holographic camera based on PRCs is compatible to a multiple pulse vibration measurement technique. The photorefractive behaviour allows a fast reutilization of the device and then a fast scan in frequency. In the above experiments, the time of a single frequency measurement was limited to 15 seconds, including interferogram capture and savings them on hard disk. In the future works, it is expected to decrease this time appreciably.
4. CONCLUSION AND FUTURE PROSPECTS
Concerning the stroboscopic technique with continuous laser sources, we have shown that it gives excellent quality mode shape visualization. Presently we use a breadboard instrument. The system will gain in userfriendliness when it will be more compact. A compact holographic camera 17,18 has been already built and used in classical non destructive applications and service to industry by the OPTRION company. Nevertheless, the application of such compact, portable and lightweight device to the stroboscopic technique required some design changes, what is currently under achievement. This camera equipped with a special optical fibre transmitting the powerful beam of a 10 Watt laser opens the field of applications of such device to 1 m2 square objects.
Concerning the pulsed system, it is envisaged to gain in simplicity by using a double pulse laser, with variable delay and different enegies between pulses. With this equipment, the energy balance between pulses is avoided. Another foreseen evolution with PRC-based systems is a much higher rate of measurement. The crystal responding at least at the nanosecond scale, one can envisage recording of subsequent holograms in the crystal, with variable delays or not between each hologram recording. Two any holograms of the recorded sequence can be furtherly readout and interfere. This "wavefront memory" scheme will open the field of application to high rate and transient phenomena, the only limits being the laser source and some additional devices used to address the reference beam differently at each hologram recording (mechanical, electro-optic or acousto-optic).
For this purpose, an EC-funded project, PHIFE (Pulsed Holographic Interferometer for the analysis of Fast Events) has started as the continuation of the work initiated by CSL and LCFIO and presented above. The first phase of the project consists in two study axes. The first one is the development of a YAG Q-switch laser giving two pulses with two different energies (if possible), variable delay and 25 Hz repetition rate. The second axis is the study and optimization of several holographic heads derived from the scheme presented in section 3, but bringing important modifications for better performances. Also, new PRCs (semiconductor family : CdTe, GaAs,..) are studied that can work at the fundamental line of YAG lasers (1064 nm). Finally, new original recording techniques like the "wavefront memory" are also envisaged for more advanced applications. The second phase of the project will combine both the laser and holographic heads resulting from the first phase into a modular prototype that will be used in industrial demonstration applications : vibration measurements for automotive, aeronautical, microelectronics or consumer apparatus test samples, as well as aerodynamic measurements in windtunel.
5. REFRENCES
1. Ed. P.K. Rastogi, Holographic interferometry : Principles and Methods, Springer Series in Optical Sciences 68, Springer-Verlag, Berlin, 1994.
2. Th. Kreis, Holographic Interferometry : Principles and Methods., Akademie Verlag, Berlin, 1996
3.. D.I. Farrant, G.H. Kaufmann, J.N. Petzing, J.R. Tyrer, B.F. Oreb, D. Kerr, "Measurement of transient deformations with dual-pulse addition electronic speckle pattern interferometry", Appl. Opt. 37, p.7259-7267 (1998).
4. Ph. Fröning, G. Pedrini, H.J. Tiziani, F. Mendoza Santoyo, "Vibration mode separation of transient phenomena using multi-pulse digital holography", Opt. Eng. 38, p. 2062-2068 (1999).
5. M.P. Georges, Ph. C. Lemaire, "Real-time stroboscopic holographic interferometry using sillenite crystals for the quantitative analysis of vibrations", Opt. Com. 145, p.249-257 (1998)
SPIE's 5th conference on Vibration Measurements by Laser Techniques : Advances and Applications, Ancona, Italy 18-21 June 2002 12
6. L. Labrunie, G. Pauliat, G. Roosen, J-C. Launay, "Simultaneous acquisition of π/2 phase-stepped interferograms with a photorefractive Bi12GeO20 crystal : application to real-time double-pulse holography", Opt. Lett. 20 (15), p. 1652-1654 (1995)
7. L. Labrunie, G. Pauliat, J-C. Launay, S. Leidenbach, G. Roosen, "Real-time double exposure holographic phase-shifting interferometer using a photorefractive crystal", Opt Comm. 140, p. 119-127 (1997).
8. Ed. P. Günter and J.-P. Huignard, Photorefractive Materials and their applications : Survey of Applications, Topics in Applied Physics 62, Springer-Verlag, Berlin, 1989.
9. M.P. Petrov, S.I. Stepanov and A.V. Khomenko, Photorefractive crystals in Coherent Optical Systems, Springer Series in Optical Sciences 59, Springer-Verlag, Berlin, 1991.
10. M.P. Georges and Ph.C. Lemaire, “Phase-shifting real-time holographic interferometry that uses bismuth silicon oxide crystals”, Applied Optics 34, p. 7497-7506 (1995)
11. M.P. Georges and Ph.C. Lemaire,"Real-time holographic interferometry using sillenite photorefractive crystals. Study and optimization of a transportable set-up for quantified phase measurements on large objects", Appl. Phys. B. 68, p. 1073-1083 (1999)
12. J.-P. Huignard, J.-P. Herriau and T. Valentin, “Time average holographic interferometry with photoconductive electrooptic Bi12SiO20 crystals”, Appl. Optics 16, p. 2796-2798 (1977)
13. A. Marrakchi, J.-P. Huignard and J.-P. Herriau, “Applications of phase conjugation in Bi12SiO20 crystals to mode pattern visualization of diffuse vibrating structures”, Optics Comm. 34, p. 15-18 (1980)
14. S. Nakadate, H. Saito and T. Nakajima, “Vibration measurement using phase-shifting stroboscopic holographic interferometry”, Optica Acta 33, p. 1295-1309 (1986)
15. This sample was grown by J.C Launay in the "Laboratoire de Chimie du Solide" in the "Université de Bordeaux" (France)
16. Marc P. Georges, Gilles Pauliat, Philippe C. Lemaire, Gérald Roosen, "Interférométrie holographique avec cristaux photoréfractifs en régime impulsionnel. Développements et résultats préliminaires", 10e séminaire SFO/HOLO3 : Nouveaux moyens optiques pour l'industrie, Bordeaux, France, 18-19 November 1998.
17 Marc P. Georges, Véronique S. Scauflaire, Ph. C. Lemaire, "Compact and portable holographic camera using photorefractive crystals. Application in various metrological problems", Appl. Phys. B 72, p. 761-765 (2001)
18. Marc P. Georges, Véronique S. Scauflaire, Ph. C. Lemaire, "Portable, high-resolution, and userfriendly holographic camera", Newsletter of SPIE's Interantional Technical Group on Holography Newsletter , May 2002, pages 1 and 10 (end of article)