Embed Size (px)
Citation preview

1
Holistic and timely monitoring of a Japanese science and technology innovation
system through an annual panel survey of experts and researchers
Masatsura Igami ([email protected])
National Institute of Science and Technology Policy,
Ministry of Education, Culture, Sports, Science, and Technology,
Kasumigaseki, Tokyo 100-0013, Japan
ABSTRACT
The National Institute of Science and Technology Policy (NISTEP) expert survey on Japanese
science, technology and innovation (STI) system is an annual panel survey administered to Japanese
experts and researchers at universities, public research institutions, and private firms. It intends to
track the status of STI in Japan through 57 questions related to Japanese STI system. The survey
provides a holistic view of the STI system in timely manner and qualitative information such as
diversity in basic research and usability of research funds, which is generally difficult to gauge based
on research and development statistics. Owing to the originality of the data, various governmental
councils and committees have referenced the survey’s results in their official documents, including
planning the fifth Science and Technology Basic Plan (STBP). This paper provides an overview of
the survey’s methodology and design, and discusses changes that have occurred in Japanese STI
during the fourth STBP’s implementation period between 2011–2015. Finally, directions for the
survey’s future development are discussed.

2
1. Introduction
Japan’s science and technology policies are promoted based on a Science and Technology Basic
Plan (STBP) that is formulated every five years. The fourth STBP (2011–2015) focused on the
period between FY2011 and FY2015, and served as the basis upon which a variety of policies was
implemented. The fifth STBP was launched in 2016. The effective implementation of the
plan-do-check-act cycle in science, technology, and innovation (STI) policies requires evidence
regarding how Japanese STI has changed over time.
Monitoring the status of STI is a challenging undertaking. First, its status does not change
overnight, thereby necessitating continuous monitoring in order to identify changes (i.e., continuity).
Second, assessing the national STI system requires a comprehensive point of view (i.e.,
comprehensive understanding). Third, there are often instances wherein quantitative data
documenting STI’s status are unavailable (i.e., measurability). Fourth, the timely monitoring of the
impact of various policies is needed (i.e., timeliness).
To determine the status of Japanese STI while taking continuity, comprehensive understanding,
measurability, and timeliness into consideration, the National Institute of Science and Technology
Policy (NISTEP) conducted a panel survey that targeted Japan’s leading researchers and experts,
whose views were assessed by means of a set of questions intended to gauge their levels of
satisfaction regarding issues related to STI. This survey can be likened to a health monitoring system,
wherein the status of Japanese STI is the subject being monitored, and the sensor used to monitor
this subject is the recognition of the country’s leading researchers and experts (i.e., combined
wisdom).
A well-known and similar survey is the Bank of Japan’s Tankan survey (also known as the
Short-Term Economic Survey of Enterprises in Japan), which examines how companies perceive
their business performance, status, and prospects in relation to economic conditions. The survey’s
results are critical, and greatly impact the stock market and policies related to it. The Cabinet
Office’s Economy Watchers Survey is similar. Hence, the methodology adopted in the present
study’s survey is widely used (i.e., the qualitative assessment of phenomena through cooperation
with individuals capable of observing those phenomena).
This paper provides an overview of NISTEP Teiten survey (also known as the NISTEP Expert
Survey on Japanese S&T and Innovation System), and discusses changes in the Japanese STI system
during the fourth STBP. Potential directions are then discussed for the future development of the
NISTEP Teiten survey.

3
2. Overview of NISTEP Teiten surveys conducted during the fourth STBP
2-1. Questions
The NISTEP Teiten surveys conducted during the fourth STBP attempted to determine the status
of Japanese STI and its situational changes according to 57 questions asked annually, in addition to
questions specific to certain years. The 57 questions can be categorized into either of research
personnel; research environment; industry-academia-government collaboration; basic research; and
innovation policy (see Figure 1). The survey was designed so that respondents would answer each
question based on a six-point scale ranging from “insufficient” to “sufficient.” Responses in the
previous year were fed back to respondents. When respondents changed their answer from the
previous year, we asked them to provide a short description indicating why they changed their
position.
Figure 1: Composition of the 57 NISTEP Teiten survey questions
2-2. Respondents
The survey’s respondents comprised two groups. The first included approximately 1,000
individuals who were presidents of universities or public research institutions (PRIs), principal
investigators of large funding programs, or researchers nominated by department heads at
universities or PRIs. To obtain an intergenerational perspective, we asked each department head to
nominate three candidates: a professor, associate professor, and assistant professor (or their
equivalents). Additionally, respondents were nominated to monitor how conditions differed
according to university size and department field.
The second group, the innovation overview group, comprised approximately 500 industry experts
(e.g., members of science and technology policy-related councils or subcommittees, executives in
charge of research and development at private firms, representatives of small or medium-sized
enterprises), individuals who bridge research and development with innovation, and those involved
in science and technology think tanks or mass media.

4
Based on the responses of the aforementioned researchers and experts, how did the status of
Japanese STI change between 2011–2015? The section 3 focuses on items wherein there were
significant increases or decreases in satisfaction when compared to the 2011 NISTEP Teiten survey.
It should be noted that the yearly response rates for these surveys were extremely high, averaging
86%.
2-3. Examples of questions and aggregate results
Figure 2 shows an example of a question and their aggregations. This example asks about the
status of the baseline funding for executing research and development at universities and PRIs
(Q1–18).
Figure 2(a) includes aggregation results for a given question broken down according to attribute;
the values at the top and bottom are for 2011 and 2015, respectively. The results show that the
satisfaction indices (i.e., values denoting satisfaction on a scale of 1–10) declined for many attributes,
especially in the public research institute. In Figure 2(b), respondents indicated why their levels of
satisfaction changed between years. By analyzing their responses, it is possible to understand the
specific contexts in which respondents’ attitudes changed.
The NISTEP Teiten survey report contains an analysis of all 57 questions. More detailed
aggregations according to attribute, as well as all open-ended responses, have been published in the
form of supplementary materials1.
Figure 2: Examples of questions and their aggregate results
(a) Aggregate results according to attribute
Note: Categorization of university group was done by scientific publication share in Japan. Group 1: 5% or more; Group 2: 1%
or more and less than 5%; Group 3: 0.5% or more and less than 1%; Group 4: 0.05% or more and less than 0.5%.
1 http://www.nistep.go.jp/research/scisip/nistep-teiten-data (in Japanese)
Index
change
Index
change
-0.47
(-0.1)
Natural
sciences
-1.06
(-0.46)
-1.57
(-0.77)Engineering
-0.53
(0.07)
Agricultural
sciences
-0.22
(-0.08)
G1-0.97
(-0.15)
Medical
sciences
-0.24
(-0.06)
G2-0.55
(-0.2)
G3-0.44
(-0.23)
G4-0.17
(0.07)
Q1-18: Status of the baseline funding for executing research and development at universities and
PRIs
University
Fie
ld o
f d
epar
tmen
t
Public research
institute
Un
iver
sity
gro
up
3 4 5 6
Index Index
2 2
Su
ffic
ien
t
Insu
ffic
ien
t
Su
ffic
ien
t
Insu
ffic
ien
t
3Attributes Attributes
4 5 62.7(748) 3.0(108)
4.0(122) 3.1(248)
1.7(83)
2.9(148) 2.5(236)
2.2(237)
2.2(160)
3.7(203)
2.6(713) 2.9(105)
3.8(117) 2.9(236)
1.5(78)
2.6(134) 2.3(221)
2.1(230)
2.1(153)
3.5(196)
2.5(720) 2.6(105)
3.4(117) 2.8(235)
1.4(82)
2.3(134) 2.3(223)
2.0(235)
2.1(153)
3.5(196)
2.4(725) 2.4(101)
3.2(114) 2.5(239)
1.6(75)
2.1(134) 2.3(227)
1.9(227)
2.0(158)
3.4(206)
2.3(689) 2.0(96)
2.4(109) 2.6(218)
1.5(75)
2.0(121) 2.3(219)
1.7(221)
1.7(143)
3.5(204)

5
(b) Reasons for change in opinion
Reasons for increased satisfaction Reasons for decreased satisfaction
Increased funding made available by the president or
dean of university
Initiatives by the university’s executive directors.
Changes in circumstances owing to a respondent
transferring to a different institution.
President of university forced to decrease spending,
thereby resulting in less funds being allocated to
departments and academic staff for research
purposes.
Management expenses grants decreased considerably
over time, necessitating budget cuts.
Sufficient money for research cannot be procured
through facility maintenance funds alone.
Insufficient funding for conducting experiment based
research activities.
Increased cost of electricity and consumption taxes
have forced researchers to bear an increasing
proportion of expenses related to the use of common
facilities.
Funds are being depleted to cover just printing and
postage costs.
3. Situational changes of Japanese STI system during the fourth STBP
3-1. Questions for which respondents felt circumstances had improved
Table 1 shows the top 10 questions in terms of positive change with respect to satisfaction when
compared to the 2011 NISTEP Teiten survey. The fourth STBP identified important issues that
must be tackled. The integrated promotion of science and technology/innovation policies intended
to resolve such issues is a fundamental objective of the basic plan.
Increases or positive trends were observed in the satisfaction indices for questions related to
innovation policy (e.g., cooperation beyond the boundaries of natural sciences to address technical
issues in resolving important problems [Q3–4]; unified public-private efforts to implement Japanese
technology and systems overseas [Q3–12]; concentration on core competence in government-led
research and development [Q3-3]; implementation of strategies and national projects to resolve
important issues through cooperation between industry, academia, and government [Q3–2];
introduction or relaxation of regulations and/or enhancement or establishment of systems [Q3–7]).
With respect to reasons for higher levels of satisfaction when compared to previous years,
respondents mentioned specific national research and development programs (e.g., “the
Cross-ministerial Strategic Innovation Promotion Program (SIP)”, “the Impulsing Paradigm Change
through Disruptive Technologies Program (ImPACT)”, and “the Center of Innovation (COI)
Program”). Concerning the introduction or relaxation of regulations, specific initiatives were
mentioned (e.g., the New Regenerative Medicine Act, Revision of the Pharmaceutical Affairs Act,
and the easing of regulations related to fuel-cell vehicles).
From these results, it is apparent that respondents felt that some progress was made in resolving

6
important issues during the fourth STBP. However, the satisfaction indices’ absolute values
indicate that there were many questions for which a strong feeling of insufficiency remained, thereby
suggesting that further improvement is needed.
Table 1: Top 10 questions in terms of positive change with respect to satisfaction between 2011–2015
Note 1: Darker shades in the “index change” column indicate greater change in satisfaction. The top and bottom figures in each
row indicate the degree of change in satisfaction between 2011–2015 and 2014–2015, respectively.
Note 2: The satisfaction index values are on a scale of zero (insufficient) to 10 (sufficient). Values of 5.5 or greater are
considered “unproblematic” ( ), 4.5–5.4 “not generally problematic” ( ), 3.5–4.4 “insufficient” ( ), 2.5–3.4
“generally insufficient” ( ), and less than 2.5 “extremely insufficient” ( ).
Note 3: KAKENHI is the largest competitive fund for academic research in Japan.
3-2. Questions for which respondents felt circumstances had worsened
Although progress was achieved in some areas during the fourth STBP, there were also questions
indicative of growing concerns when compared to the 2011 NISTEP Teiten survey (see Table 2).
Questions that exhibited the largest satisfaction index declines were those regarding baseline funding
for executing research and development at universities and PRIs (Q1–18). Based on the “Basic
Policies for Economic and Fiscal Policy Management and Structural Reform 2006”, the management
expenses grants of the national university corporations were reduced by 1%, and have been
consistently reduced for about ten years. Respondents expressed that the reduction of the
management expenses grants had large impact of research and development at university.
RankQuestion
No.Category Question Index change
Index
value 2015
1 Q1-19Research
environment
Usability of research expenses in Grants-in-Aid for Scientific Research
(KAKENHI)
0.79
(0.13)5.4
2 Q1-22Research
environment
Fostering and securing of specialized personnel to handle operations
necessary for the smooth execution of research activities (URAs) (in
universities and PRIs)
0.35
(0.09)2.4
3 Q3-04Innovation
policy
Cooperation beyond the boundaries of the natural sciences to address
technical issues for resolving important issues
0.34
(0.07)3.6
4 Q3-12Innovation
policy
Unified public-private efforts to implement Japanese technology and systems
to overseas
0.32
(0.04)2.8
5 Q3-03Innovation
policy
Concentration on core competence in government-led research and
development
0.30
(0.10)3.9
6 Q3-02Innovation
policy
Implementation of strategies and national projects to resolve important issues
through cooperation between industry, academia, and government
0.24
(0.03)3.6
7 Q1-13Research
personnelNumber of foreign researchers (in universities and PRIs)
0.23
(0.09)2.8
8 Q1-20Research
environmentEffectiveness of the multi-year funds for executing of R&D
0.23
(0.04)7.3
9 Q3-07Innovation
policy
Introduction or relaxation of regulations and/or enhancement or establishment
of systems
0.16
(-0.04)2.8
10 Q2-02Industry-academia-
government
collaboration
Interests for the needs of private companies (technical issues, etc.) (in
universities and PRIs)
0.15
(0.03)4.8

7
Table 2: Top 10 questions in terms of negative change with respect to satisfaction between 2011–2015
Note 1: Darker shades in the “index change” column indicate greater change in satisfaction. The top and bottom figures in each
row indicate the degree of change in satisfaction between 2011–2015 and 2014–2015, respectively.
Note 2: The satisfaction index values are on a scale of zero (insufficient) to 10 (sufficient). Values of 5.5 or greater are
considered “unproblematic” ( ), 4.5–5.4 “not generally problematic” ( ), 3.5–4.4 “insufficient” ( ), 2.5–3.4
“generally insufficient” ( ), and less than 2.5 “extremely insufficient” ( ).
There was also growing concern regarding a lack of diversity and/or originality in basic research.
Detailed questions were conducted in the 2014 NISTEP Teiten survey to examine changes in
research activities and behaviors among researchers at universities and PRIs (see Figure 3 and Figure
4). According to the results, respondents believed that there was growth in research for (a) the
direct purposes of resolving social issues and creating economic value, (b) to fulfill organizational
goals (e.g., regional or social contributions), and (c) to achieve integration between different
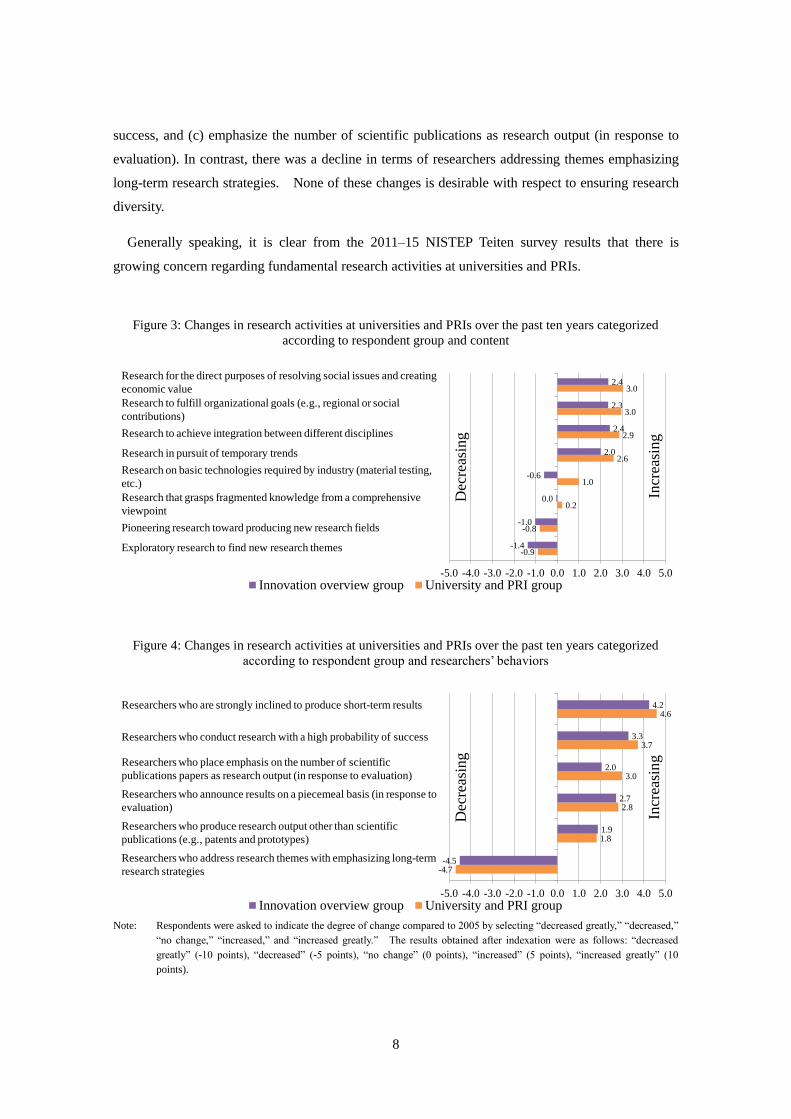
disciplines. In examining the behavior of researchers, there was a growing awareness that they
were producing output other than scientific publications, such as patents and prototypes. Given that
the resolution of important issues was emphasized in the fourth STBP, these changes can be
considered the result of various policies that were promoted under the plan.
The results likewise show that respondents were increasingly aware that research pursuing
temporary trends was growing, whereas exploratory research to find new research themes and
pioneering research toward producing new research fields were in decline—albeit at a minimal rate.
With respect to the behavior of researchers, respondents were aware that most researchers were
strongly inclined to (a) produce short-term results, (b) conduct research with a high probability of
RankQuestion
No.Category Question Index change
Index
value 2015
1 Q1-18Research
environment
Baseline funding for executing research and development at universities and
PRIs
-0.62
(-0.19)2.3
2 Q1-06Research
personnel
Whether or not individuals with the required capabilities are applying to
doctoral programs
-0.57
(-0.17)3.0
3 Q1-24Research
environment
Research facilities and equipment for innovative and advanced R&D; and the
training of high-quality human resources (in universities and PRIs)
-0.49
(-0.07)4.4
4 Q2-22 Basic researchDegree of diversity in Japanese basic research as the source of future
innovation
-0.43
(-0.14)3.0
5 Q2-23 Basic researchDegree of originality in Japanese basic research as the source of future
innovation
-0.40
(-0.16)3.0
6 Q2-17Research
environment
Amount of indirect funding related to the government's public appeal-based
research funds (competitive research funds, etc.) (in universities and PRIs)
-0.36
(-0.07)4.0
7 Q1-16Research
personnel
Multi-faceted evaluation of researchers, rather than a single indicator related to
scientific publications (in universities and PRIs)
-0.35
(-0.03)4.5
8 Q1-21Research
environment
Efforts to secure researchers' time allocated to R&D activities (in universities
and PRIs)
-0.31
(-0.06)2.2
9 Q2-19Research
environment
Circumstances of intellectual and research information infrastructure in Japan
(in universities and PRIs)
-0.30
(-0.03)4.2
10 Q2-16Research
environmentGovernment's S&T budget, taking account of current S&T situation in Japan
-0.28
(-0.16)2.7
8
success, and (c) emphasize the number of scientific publications as research output (in response to
evaluation). In contrast, there was a decline in terms of researchers addressing themes emphasizing
long-term research strategies. None of these changes is desirable with respect to ensuring research
diversity.
Generally speaking, it is clear from the 2011–15 NISTEP Teiten survey results that there is
growing concern regarding fundamental research activities at universities and PRIs.
Figure 3: Changes in research activities at universities and PRIs over the past ten years categorized
according to respondent group and content
Figure 4: Changes in research activities at universities and PRIs over the past ten years categorized
according to respondent group and researchers’ behaviors
Note: Respondents were asked to indicate the degree of change compared to 2005 by selecting “decreased greatly,” “decreased,”
“no change,” “increased,” and “increased greatly.” The results obtained after indexation were as follows: “decreased
greatly” (-10 points), “decreased” (-5 points), “no change” (0 points), “increased” (5 points), “increased greatly” (10
points).
-0.9
-0.8
0.2
1.0
2.6
2.9
3.0
3.0
-1.4
-1.0
0.0
-0.6
2.0
2.4
2.3
2.4
-5.0 -4.0 -3.0 -2.0 -1.0 0.0 1.0 2.0 3.0 4.0 5.0
Innovation overview group University and PRI group
Dec
reas
ing
Incr
easi
ng
Research for the direct purposes of resolving social issues and creating
economic value
Research to fulfill organizational goals (e.g., regional or social
contributions)
Research to achieve integration between different disciplines
Research in pursuit of temporary trends
Research on basic technologies required by industry (material testing,
etc.)
Research that grasps fragmented knowledge from a comprehensive
viewpoint
Pioneering research toward producing new research fields
Exploratory research to find new research themes
-4.7
1.8
2.8
3.0
3.7
4.6
-4.5
1.9
2.7
2.0
3.3
4.2
-5.0 -4.0 -3.0 -2.0 -1.0 0.0 1.0 2.0 3.0 4.0 5.0
Innovation overview group University and PRI group
Incr
easi
ng
Dec
reas
ing
Researchers who are strongly inclined to produce short-term results
Researchers who conduct research with a high probability of success
Researchers who place emphasis on the number of scientific
publications papers as research output (in response to evaluation)
Researchers who announce results on a piecemeal basis (in response to
evaluation)
Researchers who produce research output other than scientific
publications (e.g., patents and prototypes)
Researchers who address research themes with emphasizing long-term
research strategies

9
4. In-depth analyses of selected questions
4-1. Monitoring the breadth of the effects of policy measures implementation
Breaking down the NISTEP Teiten survey results according to attribute widens an understanding
of the breadth of the effects of policy measures implementation. Figure 5 shows the aggregate
results by attribute for the usability of research expenses in Grants-in-Aid for Scientific Research
(KAKENHI), the item for which improvement of the satisfaction indices were highest.
As the results show, satisfaction indices increased for each attribute. The stated reasons for this
change included smoother annual carryover, and increased convenience owing to the introduction of
multi-year funds. Grants-in-Aid for Scientific Research (KAKENHI) is the largest competitive
fund in Japan; hence, alterations to it influence many of the country’s researchers. However, it
requires elaborative efforts.
Figure 5: Usability of Grants-in-Aid for Scientific Research (KAKENHI)
Note: Categorization of university group was done by scientific publication share in Japan. Group 1: 5% or more; Group 2: 1%
or more and less than 5%; Group 3: 0.5% or more and less than 1%; Group 4: 0.05% or more and less than 0.5%.
An in-depth analysis of a question regarding university research administrators (URAs), an item
with the second-highest satisfaction index rise, was conducted. URA universities were compared to
other universities in terms of whether differences existed in circumstances related to Q1–22 (i.e., the
fostering and securing of specialized personnel to handle operations necessary for the smooth
execution of research activities (URAs)).
For this analysis, URA universities were defined as those that adopted the 2011–2014 Initiative for
‘the Developing a System for Fostering and Recruiting URAs’ or the 2013–2023 Initiative for ‘the
Strengthening of Research Universities,’ as well as members of the Association of Research
Administrators. Of the 36 universities that fell into these categories, 32 were targeted in the
Index
change
Index
change
0.85
(0.13)
Natural
sciences
0.92
(0.09)
0.44
(0.13)Engineering
0.5
(0.09)
Agricultural
sciences
1.15
(0.09)
G10.91
(0.04)
Medical
sciences
1.12
(0.21)
G20.78
(0.11)
G30.85
(0.08)
G40.9
(0.26)
Un
iver
sity
gro
up
Eas
y t
o u
se
6
No
t ea
sy t
o u
se
Eas
y t
o u
se No
t ea
sy t
o u
se
Attributes
Index Index
2 3 4 5 6 2
Q1-19: Usability of research expenses in Grants-in-Aid for Scientific Research (KAKENHI)
3 4 5
University
Fie
ld o
f d
epar
tmen
t
Public research
institute
Attributes
4.5(731) 5.0(108)
4.7(106) 5.1(239)
4.1(78)
4.7(149) 3.8(233)
4.3(235)
4.8(156)
4.5(191)
4.9(699) 5.7(103)
4.8(101) 5.4(228)
4.6(76)
5.3(133) 4.0(219)
4.7(228)
5.1(149)
4.8(189)
5.2(708) 5.9(103)
4.9(103) 5.4(230)
5.0(80)
5.6(134) 4.5(220)
5.0(232)
5.3(150)
5.0(190)
5.3(714) 5.8(101)
5.0(103) 5.5(233)
5.2(74)
5.6(133) 4.7(223)
5.0(226)
5.6(156)
5.1(199)
5.4(678) 5.9(96)
5.1(98) 5.6(214)
5.3(72)
5.7(121) 4.9(216)
5.1(219)
5.6(141)
5.4(197)

10
NISTEP Teiten survey2.
Figure 6(a) shows the difference between URA universities and other universities regarding
changes in satisfaction indices with respect to fostering and securing of URAs (Q1–22). The two
sets of universities showed similar satisfaction indices in 2011; however, the satisfaction index for
URA universities increased each year, such that by 2015 it was 0.79 points higher than in 2011. In
contrast, the satisfaction index for the other universities barely changed.
Furthermore, the change in the satisfaction index varied according to respondents’ duties. Figure
6(b) contains the aggregate results for respondents whose duties were management related. Among
URA universities, the satisfaction index was 1.9 for the 2011 NISTEP Teiten survey. Nevertheless,
between 2011–2013 the index increased sharply, reaching 4.4 in 2015. Given that between
2011–2013 these universities adopted ‘the Initiative for Developing a System for Fostering and
Recruiting URAs’ and/or ‘the Initiative for the Strengthening of Research Universities,’ the
commencement and adoption of these programs were reflected in the form of changes in the
satisfaction index.
The satisfaction index for respondents whose duties were not managerial (see Figure 6(c)) rose
between 2011–15, albeit markedly less than for their manager counterparts. This finding suggests
that although universities are progressing in fostering and securing URAs, these advances are not
having a substantial impact within institutions. Indeed, in this question, one of the reasons cited for
a decline in satisfaction level was “the benefits have not yet been felt at a department level.”
2 Data from the following websites (each accessed on February 27, 2016) were used to prepare the list of URA universities:
Initiative for Developing a System for Fostering/securing URAs (http://www.mext.go.jp/a_menu/jinzai/ura/detail/1315871.htm),
Initiative for the Strengthening of Research Universities (http://www.mext.go.jp/a_menu/kagaku/sokushinhi/1338460.htm),
Association for Research Administrators (http://www.rman.jp/aboutus/memberlist.html).

11
Figure 6: Comparison between URA universities and other universities
(a) All respondents
(b) Respondents whose primary duties are management related
(c) Respondents whose primary duties are not management related
1.9
2.7
1.92.0
1.5
2.0
2.5
3.0
3.5
4.0
4.5
5.0
2011 2012 2013 2014 2015
Sat
isfa
ctio
n i
nd
ex a
bo
ut
fost
erin
g a
nd
secu
rin
g U
RA
s (T
ota
l)
Year of survey
URA universities
Other universities
1.9
4.4
2.32.5
1.5
2.0
2.5
3.0
3.5
4.0
4.5
5.0
2011 2012 2013 2014 2015
Sat
isfa
ctio
n i
nd
ex a
bo
ut
fost
erin
g a
nd
secu
rin
g U
RA
s (R
esp
on
den
ts w
ho
se
du
ties
wer
e m
anag
emen
t re
late
d)
Year of survey
URA universities
Other universities
1.9
2.5
1.91.9
1.5
2.0
2.5
3.0
3.5
4.0
4.5
5.0
2011 2012 2013 2014 2015
Sat
isfa
ctio
n i
nd
ex a
bo
ut
fost
erin
g a
nd
secu
rin
g U
RA
s (R
esp
on
den
ts w
ho
se
du
ties
wer
e n
ot
man
ager
ial)
Year of survey
URA universities
Other universities

12
4-2. Monitoring attitudinal differences between actors
Analyzing the aggregate results by attribute makes it possible to ascertain attitudinal differences
between actors. Respondents at the private firm, university, and government all expressed
dissatisfaction regarding the utilization of intellectual property by private firms obtained from
research and development conducted at universities and PRIs (see Figure 7). Individuals in the
innovation overview group were particularly dissatisfied: their satisfaction index was 0.8 and 1.2
points lower than university and PRI respondents, respectively.
Respondents from private firms indicated that the quality of universities’ granted patent was low,
and furthermore that universities were unable to fund international applications pursuant to the
Patent Cooperation Treaty; consequently, the most of patent applications were domestic rather than
international. In contrast, university respondents pointed out that there was significant
apprehension and an unwillingness to take risks in product development at private firms, which
prevented knowledge transfer from universities to private firms.
Figure 7: Example of a question showing attitudinal differences between actors
Note1: Categorization of university group was done by scientific publication share in Japan. Group 1: 5% or more; Group 2: 1%
or more and less than 5%; Group 3: 0.5% or more and less than 1%; Group 4: 0.05% or more and less than 0.5%.
Note2: Innovation overview group comprised approximately 500 industry experts (e.g., members of science and technology
policy-related councils or subcommittees, executives in charge of research and development at private firms,
representatives of small or medium-sized enterprises), individuals who bridge research and development with innovation,
and those involved in science and technology think tanks or mass media.
4-3. Complementary analysis along with quantitative data
Analyzing the NISTEP Teiten survey results in conjunction with qualitative data facilitates an
understanding of the underlying causes of changes in the quantitative data.
Respondents from universities and PRIs were of the strong opinion that individuals with the
required capabilities were not applying to doctoral programs (see Figure 8). In examining changes
since the 2011 NISTEP Teiten survey, the satisfaction indices for all attributes either declined or
Index
change
Index
change
-0.09
(0.05)
Natural
sciences
0.06
(0.14)
-0.21
(0.13)Engineering
0.03
(0.18)
-0.05
(-0.02)
Agricultural
sciences
0.03
(0.05)
G1-0.02
(0.1)
Medical
sciences
-0.27
(-0.1)
G2-0.02
(0.12)
G30.15
(0.07)
G4-0.35
(-0.04)
Attributes Attributes
Q2-8: Utilization of intellectual property by private firms obtained from research and development
conducted at universities and PRIs
University
Fie
ld o
f d
epar
tmen
t
Public research
institute
Innovation
overview group
Un
iver
sity
gro
up
Su
ffic
ien
t
Insu
ffic
ien
t
Su
ffic
ien
t
Insu
ffic
ien
t
3 4 5 622 3 4 5 6
Index Index
3.7(536) 3.6(62)
4.2(106) 4.1(179)
2.8(414) 3.8(54)
4.1(103) 3.3(172)
3.5(170)
3.6(119)
3.8(144)
3.7(513) 3.5(61)
4.0(104) 4.0(172)
2.8(392) 3.6(46)
4.2(91) 3.2(165)
3.4(159)
3.7(110)
3.7(153)
3.6(520) 3.4(61)
3.9(105) 4.0(171)
2.8(371) 3.5(53)
3.9(95) 3.0(165)
3.3(163)
3.7(110)
3.5(150)
3.6(527) 3.6(59)
3.8(104) 3.9(174)
2.8(384) 3.8(49)
4.0(92) 3.1(168)
3.4(164)
3.7(117)
3.5(154)
3.6(495) 3.7(54)
4.0(101) 4.1(156)
2.8(371) 3.8(51)
4.1(81) 3.0(161)
3.5(156)
3.8(104)
3.5(154)

13
exhibited a declining trend. With respect to individual university groups, the satisfaction indices
for groups 1 and 4 declined by more than 0.6 points; as for various university departments, the
satisfaction indices for natural sciences, agricultural sciences, and medical sciences declined by
nearly 0.7 points. Engineering showed a smaller decline when compared to other departments,
although its dissatisfaction level was already relatively high in 2011.
Figure 8: Aggregate results by attribute for the quality of applicants to doctoral programs
Note: Categorization of university group was done by scientific publication share in Japan. Group 1: 5% or more; Group 2: 1%
or more and less than 5%; Group 3: 0.5% or more and less than 1%; Group 4: 0.05% or more and less than 0.5%.
Figure 9: Number of students enrolled in doctoral programs
(a) Change in the number of enrollees by course (b) Change in proportion of working enrollees
Note: “Other” includes courses that do not fall under the umbrella of engineering, agriculture, health, the humanities, or
social/physical sciences.
Source: National Institute of Science and Technology Policy (2015). Japanese science and technology indicators 2015. Research
Material No. 229.
Index
change
Index
change
-0.56
(-0.18)
Natural
sciences
-0.68
(-0.29)
-0.73
(-0.06)Engineering
-0.26
(0.02)
Agricultural
sciences
-0.7
(-0.28)
G1-0.65
(-0.19)
Medical
sciences
-0.67
(-0.16)
G2-0.5
(-0.14)
G3-0.45
(-0.19)
G4-0.66
(-0.23)
3 4 5 6
Index
Q1-6: Whether or not individuals with the required capabilities are applying to doctoral programs
University
Fie
ld o
f d
epar
tmen
t
Public research
institute
Un
iver
sity
gro
up
Ap
ply
ing
3 4 5 6
No
t-ap
ply
ing No
t-A
pp
lyin
g
Index
2A
pp
lyin
g
Attributes Attributes2
3.5(723) 3.6(104)
4.2(77) 3.0(243)
3.2(80)
3.7(148) 3.7(224)
3.3(238)
3.4(152)
3.7(185)
3.2(691) 3.3(97)
3.9(76) 2.8(229)
3.3(78)
3.3(132) 3.3(216)
3.2(228)
3.2(146)
3.3(185)
3.2(698) 3.1(101)
3.7(83) 2.8(228)
3.0(81)
3.1(134) 3.2(215)
3.0(229)
3.1(148)
3.4(185)
3.1(703) 3.2(96)
3.5(82) 2.7(228)
2.8(75)
3.2(133) 3.2(223)
2.9(222)
3.2(153)
3.3(195)
2.9(673) 2.9(94)
3.5(77) 2.7(214)
2.5(73)
3.0(120) 3.0(214)
2.8(220)
3.0(140)
3.0(193)
0.0
0.2
0.4
0.6
0.8
1.0
1.2
1.4
1.6
1.8
2.0
1981 84 87 90 93 96 99 02 05 08 11 2014
Others
Social
science
Humanities
Medical
sciences
Agricultural
sciences
Engineering
Natural
sciences
The
num
ber
of
enro
llm
ent
10,000 people
FY
21.7%
37.7%
0%
10%
20%
30%
40%
50%
0.0
0.5
1.0
1.5
2.0
2003 10 2014
Other
students
Working
students
Percentage
of working
students
10,000 people
FY

14
Figure 9 shows the change in the number of students entering doctoral programs according to the
Ministry of Education, Culture, Sports, Science, and Technology’s Basic School Survey. After
peaking in 2003, the number of enrollees entered a declining trajectory; by 2014, the number had
fallen to a level nearly identical to the late 1990s (see Figure 9(a)). The temporary rise that
occurred in 2010 could be attributable to the 2008 financial crisis.
The proportion of working students enrolled in doctoral programs rose from 21.7% in 2003 to
37.7% in 2014. Whereas the number of working students has remained relatively flat since the late
2000s, the number of non-working students has declined. As for why satisfaction dropped with
respect to the question regarding the quality of doctoral program applicants (Q1–6), respondents
cited the absence of reliable financial support or feasible career paths. Making such statements
suggest that the result of NISTEP Teiten survey likely reflects the declining number of enrollees
among non-working students (Figure 9(b)).
5. Conclusion and future works
It can be deduced that the NISTEP Teiten surveys are effective in comprehensively monitoring the
STI system’s status. The data provided by these surveys are useful in formulating science and
technology policies, and have been referenced in official documents by various governmental
councils and committees. Likewise, the survey’s results were referenced in science and technology
white papers, in planning the fifth STBP, and in media such as newspapers. The fifth STBP
outlines initiatives to strengthen fundamental capacities, particularly with respect to fostering and
promotion of young researchers, as well as reforming and strengthening the functions of universities.
When policymakers were establishing the direction of these policies, they referred to the NISTEP
Teiten survey results as one of evidence. Hence, it is clear that the NISTEP Teiten survey provide
useful information that others cannot. Looking forward, it should be possible to build data that are
even more useful in policy formation and evaluation by implementing surveys and related analyses
wherein the following three points are emphasized.
5-1. Understanding the relationships between questions
As mentioned previously, the NISTEP Teiten survey results can be employed in various ways;
nevertheless, they are often used in a partial manner. The survey’s 57 questions should be
examined in an interrelated fashion. For instance, in attempting to improve upon one item, its
relationship to others ought to be considered. This requires a comprehensive understanding of the
relationships between all questions.
5-2. Further analysis of the open-ended responses
The NISTEP Teiten surveys include open-ended questions regarding to various STI issues. The
total responses to these questions between 2011–2015 exceeded 2.5 million Japanese characters.

15
Through text mining or machine learning, it is possible to extract words used in specific contexts.
Currently, this is a manual and time-consuming process. Hence, a methodology based on
computerized text mining or machine learning should be developed in order to identify new issues,
as well as those that have not been discussed previously.
5-3. Analysis of the extent to which the effects of policies spread
There are some questions for which no significant changes were observed in the satisfaction
indices between 2011–2015 that means the effects of the policies were not felt by researchers,
perhaps because of a lack to implement relevant ones, or to do so on a limited scale. Accordingly,
continuous monitoring is necessary that goes beyond the STBP’s five-year framework, since a
sufficient amount of time is needed for conditions to improve. However, the NISTEP Teiten survey
includes identical respondents each year, and their ages obviously increase. Consequently, the use
of respondent groups and surveying methods that facilitate long-term chronological monitoring
while simultaneously maintaining respondent continuity should be examined.
5-4. Determining question content and identifying target respondents
The NISTEP Teiten surveys are effective in assessing the state of STI in Japan. Nevertheless, the
results depend largely on the content of questions and to whom they are directed. For instance,
some individuals argue that because the NISTEP Teiten surveys comprise many questions related to
research environment, that the results tend to emphasize dissatisfaction among researchers. It
should be possible to solve this problem by analyzing attitudinal differences between actors and
setting questions that examine researchers’ own efforts.
This paper presented a method for qualitatively determining the status of STI through a panel
survey administered to researchers and experts. Of course, determining the status of STI based on
qualitative data alone is insufficient. Hence, utilizing qualitative data from the NISTEP Teiten
surveys in conjunction with various research and development statistics would promote a fuller
understanding of STI systems.
Currently, preparation for the new NISTEP Teiten survey, which will be conducted during fifth
STBP, is undergoing. Fifth STBP identified numerical targets/indicators that should be monitored
during the basic plan; therefore, we believe that original evidence that NISTEP Teiten survey
provides is getting more important in order to understand a context of changes of the indicators.
To author’s knowledge, the NISTEP Teiten surveys are unique in their focus on monitoring the
status of STI systems, we hope that our experience will be useful for the development of new STI
indicators and widens our collective knowledge for the measurement of STI activities.

16
References
National Institute of Science and Technology Policy (2016). Analytical report for 2015 NISTEP expert survey on
Japanese S&T and innovation system (2015 NISTEP TEITEN survey). NISTEP Report No. 167 (in Japanese).
National Institute of Science and Technology Policy (2015). Japanese science and technology indicators 2015.
Research Material No. 229.