Embed Size (px)
Citation preview
H O L I D A Y C H E C K G R O U P A GN E U M A R K T E R S T R A S S E 6 18 1 6 7 3 M U N I C H , G E R M A N Y
W W W.H O L I D AY C H E C K G R O U P.C O M
INTERIM REPORTFOR THE FIRST HALF OF 2019
OF HOLIDAYCHECK GROUP AG
KEY FIGURES
First ha l f 2019
First ha l f 2018
Changein %
2Q 2019
2Q 2018
Changein %
REVENUE AND EARNINGS
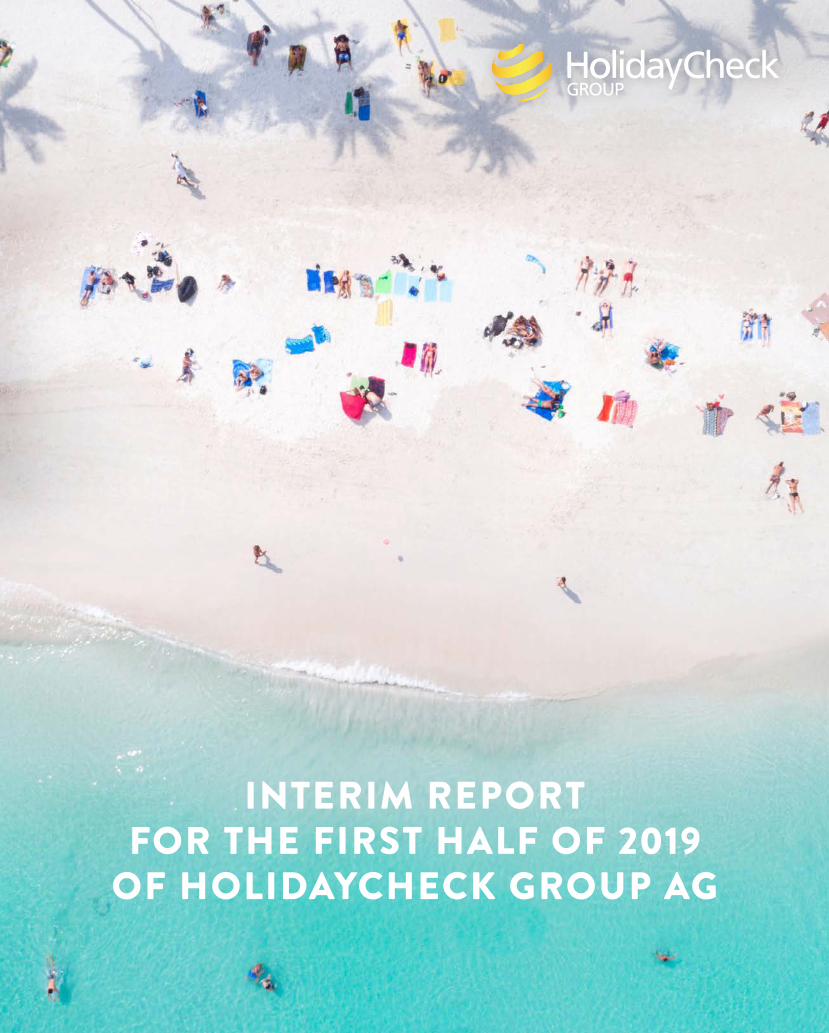
Consolidated revenue in EUR million 74.9 72.8 2.9% 32.7 31.4 4.1%
Marketing expenses in EUR million -37.5 -34.8 7.8% -16.3 -15.0 8.7%
Personnel expenses in EUR million -21.0 -19.6 7.1% -10.3 -9.9 4.0%
Other expenses in EUR million -13.3 -13.5 -1.5% -6.0 -6.4 -6.3%
EBITDA in EUR million 5.3 7.2 -26.4% 1.3 1.2 8.3%
Operating EBITDA in EUR million 5.8 7.8 -25.6% 1.5 1.6 -6.3%
EBIT in EUR million 0.3 4.1 -92.7% -1.3 -0.4 >100%
Financial result in EUR million -0.2 -0.1 100.0% -0.1 0.0 -
EBT in EUR million 0.2 4.0 -95.0% -1.4 -0.4 >100%
Consolidated net profit/loss in EUR million -0.5 3.0 - -1.5 -0.4 >100%
Earnings per share in EUR -0.01 0.05 - -0.03 -0.01 >100%
30 JUN 19 31 DEC 18
Changein %
ASSETS AND CAPITAL STRUCTURE
Total assets in EUR million 210.1 193.2 8.7%
Non-current assets in EUR million 143.0 134.4 6.4%
Current assets in EUR million 67.1 58.7 14.3%
thereof cash in EUR million 28.7 33.8 -15.1%
Equity in EUR million 158.0 159.9 -1.2%
Debt in EUR million 52.1 33.3 56.5%
30 JUN 19 31 DEC 18
Changein %
KEY CAPITAL MARKET DATA
Equity ratio in percent 75.2% 82.8% -9.2%
Debt ratio in percent 24.8% 17.2% 44.2%
* no guarantee of completeness
SHAREHOLDER STRUCTURE AS AT 1 JULY 2019 (ROUNDED)*
Free float 41.7%
Treasury Shares 1.2%
Burda Digital SE56.1%
Management Board and Supervisory Board 1.0%
2
KE
Y F
IGU
RE
S

IT IS OUR VISION TO BECOME THE MOST URLAUBER*-FRIENDLY
COMPANY IN THE WORLD.AGILE, INNOVATIVE, WITH
A LONG-TERM PERSPECTIVE AND CUSTOMER-ORIENTED
TO A FAULT.GEORG HESSE
CEO HolidayCheck Group AG
* Urlauber is the German term for holidaymaker, vacationer.

HolidayCheck Group AG | Neumarkter Strasse 61 | 81673 Munich, Germanywww.holidaycheckgroup.com www.facebook.de/HolidayCheckGroup www.twitter.com/HolidayCheckGrp
Armin Blohmannphone: + 49 (0) 89 - 357 680 901fax: + 49 (0) 89 - 357 680 999email: [email protected]
Sabine Wodarzphone: + 49 (0) 89 - 357 680 915fax: + 49 (0) 89 - 357 680 999email: [email protected]
INVESTOR & PUBLIC RELATIONS CONTACT
Dear Shareholders,
On 4 June 2019 the shareholders and proxies who attended this year’s annual general meeting of Holiday-Check Group AG in Munich, Germany, approved by a significant majority in favour of all resolutions on the agenda. The present shareholders and shareholder representatives accounted for around 66 percent of the company’s share capital with voting rights. The shareholders present at the meeting passed a resolution to distribute a dividend of EUR 0.04 per qualifying no-par value share. The shareholders’ meeting also approved by a large majority the discharge of the Management and Supervi-sory Boards and a control and profit transfer agreement between HolidayCheck Group AG and the tour operator HC Touristik GmbH, which was formed in 2018.
A detailed breakdown of the voting results for the agenda items and a transcript of the presentation made to the shareholders at the general meeting can be found on our website at https://www.holidaycheck-group.com/investor-relations/annual-general-meet-ing/?lang=en
The stock option plan we introduced in 2017 is turning more and more of our employees into shareholders.
In July 2019, around 400,000 HolidayCheck Group shares were issued to employees and members of the Management Board as one of the components of their overall remuneration package.
At www.holidaycheckgroup.com you will find a wealth of information about the company. For example, our website contains current company reports and pres-entations covering important investor events and road shows.
If you want to keep up to date with all the interesting news from the HolidayCheck Group, you might like to visit our social media pages. Follow us on Facebook, Twitter and Xing. We would be happy to meet you there.
Yours sincerely
Armin Blohmann
INVESTOR RELATIONS REPORT
Annual General Meeting 2019
4
INV
ES
TO
R R
EL
AT
ION
S R
EP
OR
T
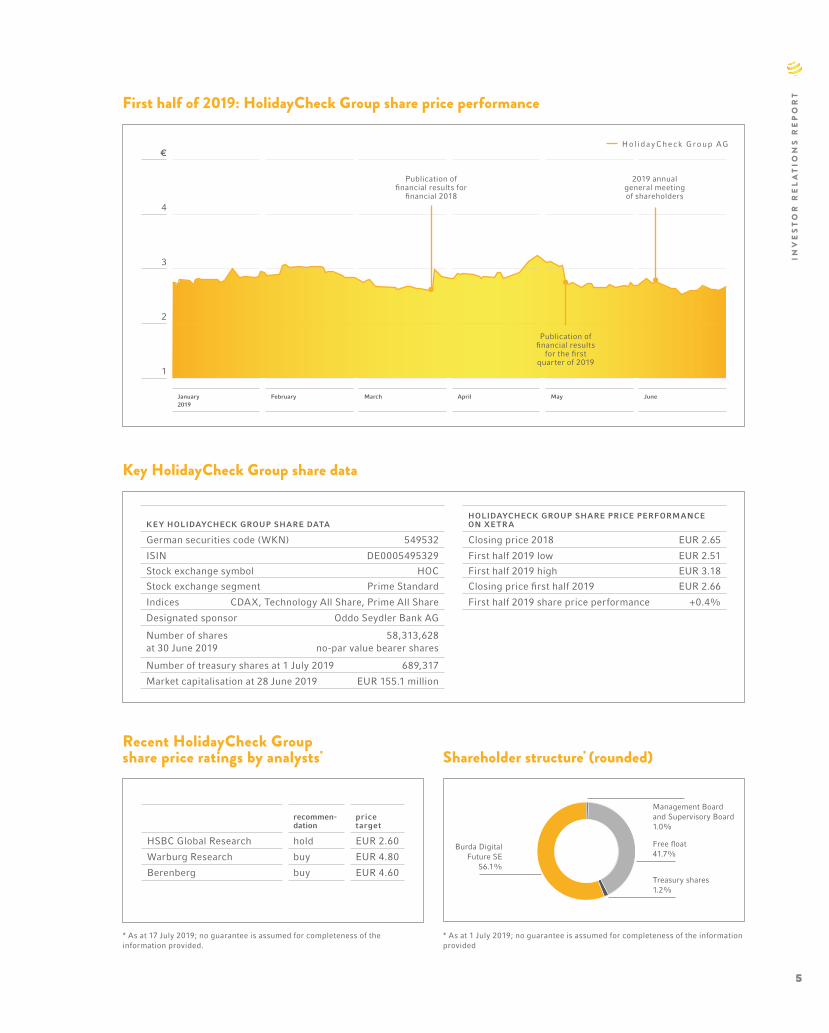
Shareholder structure* (rounded)
€
4
3
2
1
January2019
February March April May June
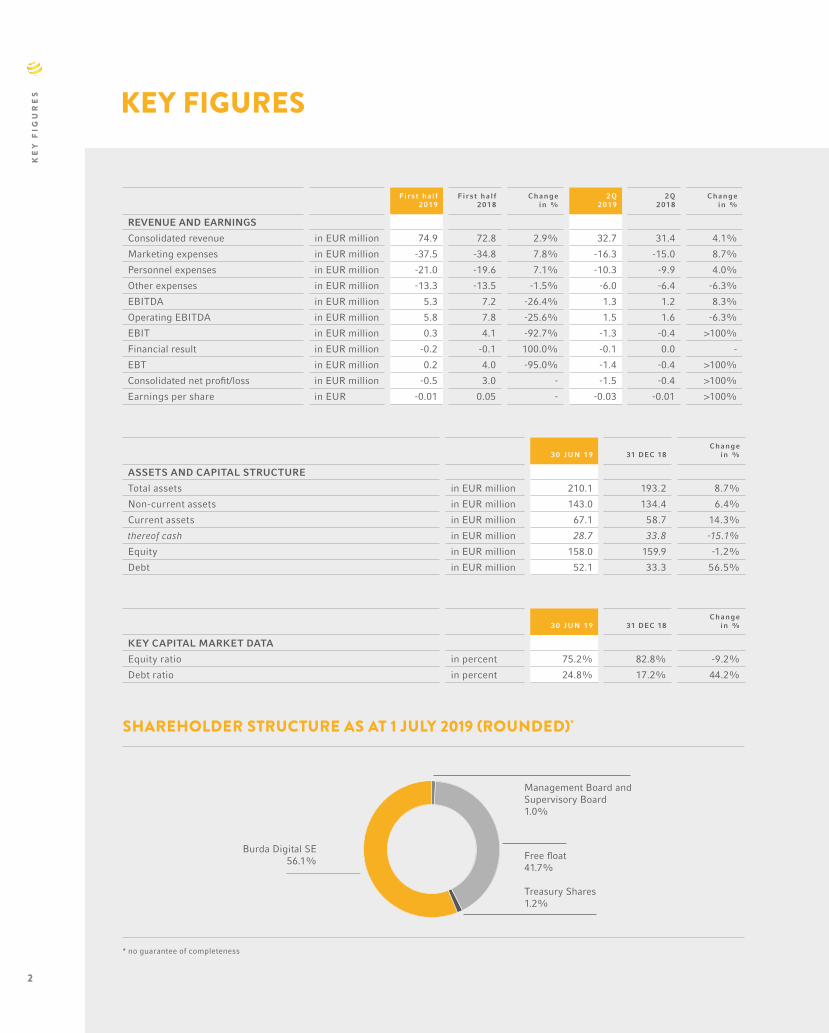
First half of 2019: HolidayCheck Group share price performance
Key HolidayCheck Group share data
* As at 17 July 2019; no guarantee is assumed for completeness of the information provided.
Recent HolidayCheck Group share price ratings by analysts*
* As at 1 July 2019; no guarantee is assumed for completeness of the information provided
KEY HOLIDAYCHECK GROUP SHARE DATAHOLIDAYCHECK GROUP SHARE PRICE PERFORMANCEON XETRA
German securities code (WKN) 549532 Closing price 2018 EUR 2.65
ISIN DE0005495329 First half 2019 low EUR 2.51
Stock exchange symbol HOC First half 2019 high EUR 3.18
Stock exchange segment Prime Standard Closing price first half 2019 EUR 2.66
Indices CDAX, Technology All Share, Prime All Share First half 2019 share price performance +0.4%
Designated sponsor Oddo Seydler Bank AG
Number of shares 58,313,628at 30 June 2019 no-par value bearer shares
Number of treasury shares at 1 July 2019 689,317
Market capitalisation at 28 June 2019 EUR 155.1 million
recommen-dation
price target
HSBC Global Research hold EUR 2.60
Warburg Research buy EUR 4.80
Berenberg buy EUR 4.60
Free float 41.7%
Treasury shares1.2%
Burda Digital Future SE
56.1%
Management Board and Supervisory Board1.0%
HolidayCheck Group AG
Publication of financial results
for the first quarter of 2019
2019 annual general meeting of shareholders
Publication of financial results for
financial 2018
INV
ES
TO
R R
EL
AT
ION
S R
EP
OR
T
5
1. GROUP STRUCTURE AND BUSINESS MODEL
1.1 Organisational structure HolidayCheck Group AG, a joint-stock company under German law (Aktiengesellschaft) is the parent company of the HolidayCheck Group, a digital business group for Holidaymakers with operations in Central Europe. In the first half of 2019 our average total workforce was 489 full-time equivalents (without Management Board members) based at five locations in Germany, the Netherlands, Poland and Switzerland.
1.2 Description of business operationsThe HolidayCheck Group includes operating compa-nies that generate revenue from transaction-based on-line business models in the fields of travel and weather.
HolidayCheck AG (based in Bottighofen, Switzerland) and WebAssets B.V. (based in Amsterdam, Nether-lands) operate a range of hotel rating and Holiday booking portals that generate revenue in the form of a commission for package tours and hotel and car hire bookings and from website links that take visitors to other booking portals. HC Touristik GmbH was formed in Munich, Germany, in October 2018. As a tour op-erator, it uses HolidayCheck’s own booking platform to offer dynamically packaged Holidays and hotel accommodation under the brand name ‘ HolidayCheck Reisen’.
The core sales markets for these web portals are Austria, Belgium, Germany, the Netherlands and Switzer land.
Driveboo AG (Bottighofen, Switzerland) operates sev-
eral car hire portals under the name MietwagenCheck and Driveboo. Its revenue is generated in the form of commission for car hire bookings. Driveboo AG’s core sales markets are Austria, Germany and Switzerland.
WebAssets B.V. also operates advertising-based weather portals such as WeerOnline.nl. Its main source of revenue is online advertising, and its core sales mar-kets are Belgium, Germany and the Netherlands.
Further components of the HolidayCheck Group are the non-operating company HolidayCheck Group AG (Munich, Germany) and the internal service provid-ers HolidayCheck Polska Sp. zo. o. and HolidayCheck Solutions GmbH, none of which generates any signifi-cant amounts of external revenue.
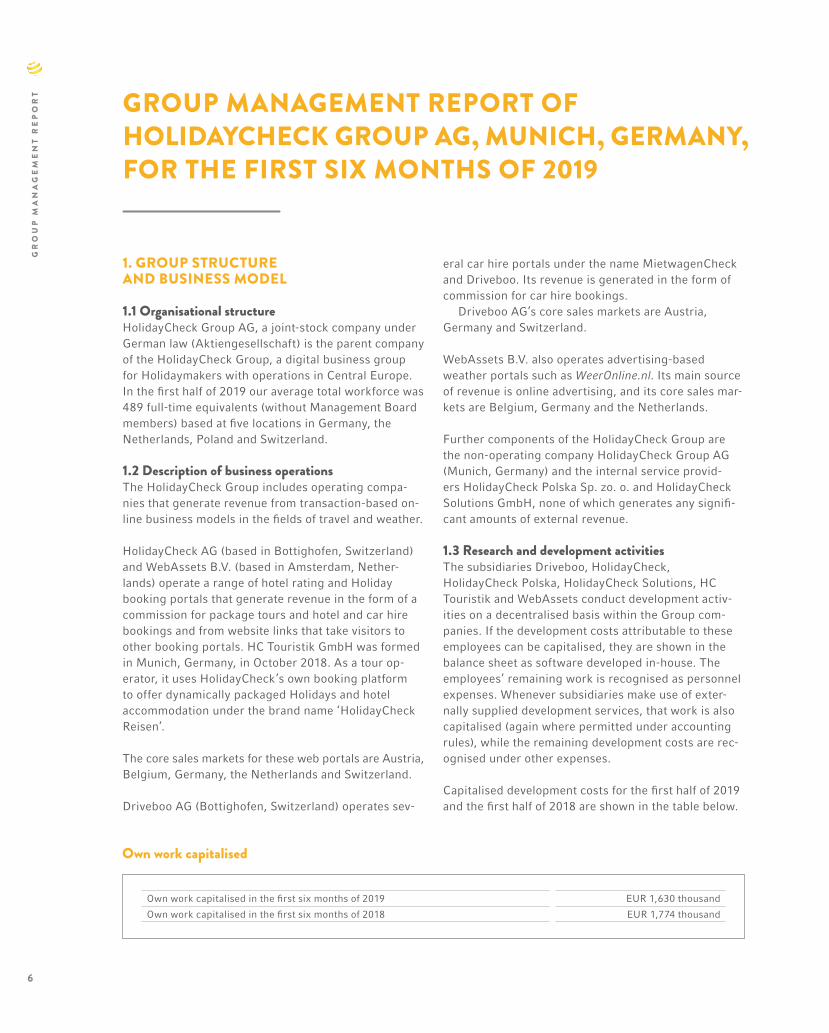
1.3 Research and development activitiesThe subsidiaries Driveboo, HolidayCheck, HolidayCheck Polska, HolidayCheck Solutions, HC Touristik and WebAssets conduct development activ-ities on a decentralised basis within the Group com-panies. If the development costs attributable to these employees can be capitalised, they are shown in the balance sheet as software developed in-house. The employees’ remaining work is recognised as personnel expenses. Whenever subsidiaries make use of exter-nally supplied development services, that work is also capitalised (again where permitted under accounting rules), while the remaining development costs are rec-ognised under other expenses.
Capitalised development costs for the first half of 2019 and the first half of 2018 are shown in the table below.
GROUP MANAGEMENT REPORT OF HOLIDAYCHECK GROUP AG, MUNICH, GERMANY,FOR THE FIRST SIX MONTHS OF 2019
Own work capitalised
Own work capitalised in the first six months of 2019 EUR 1,630 thousand
Own work capitalised in the first six months of 2018 EUR 1,774 thousand
6
GR
OU
P M
AN
AG
EM
EN
T R
EP
OR
T

2. ECONOMIC REPORT
2.1 Macro-economic and industry situation
2.1.1 Macro-economic situationIn a report issued on 8 July 2019, Deutsche Bank’s Global Market Research unit projects the following pic-ture of economic growth in the HolidayCheck Group’s core sales markets over the financial year 2019: After adjusting for inflation, Dutch gross domestic product (GDP) is forecast to increase by 1.8 percent and Belgian GDP by 1.2 percent. Germany is expected to put on 0.7 percent, Austria 1.6 percent and Switzer-land 1.1 percent.
2.1.2 Industry situationAccording to an assessment by the market research institute GfK, high street travel agencies in Europe’s German-speaking region experienced a slight decline in revenue from package Holidays over the first half of 2019. By contrast, on average, online travel agencies generated a modest increase in revenue. Overall, GfK believes that revenue from package Holidays was down by 2.0 percent over the period.
2.2 Business development and performance HolidayCheck Group AG can look back on a modestly successful first half-year of 2019 with a small growth in revenue. As anticipated, however, earnings were down on the same period in 2018, partly as a result of investment in new business areas. As a whole, the Central European package Holiday market was unable to sustain the momentum gener-ated in the final quarter of 2018 due to weak demand for early bookings. In the company’s view, however, providers operating in the online package Holiday sector – including the HolidayCheck Group – managed to increase their market share. Consolidated revenue for the first six months of 2019 was up by 2.9 percent from EUR 72.8 million in 2018 to EUR 74.9 million in 2019. Operating EBITDA amounted to EUR 5.8 million in the first half of 2019 as against EUR 7.8 million in the same period of the previous year. At EUR 32.7 million, the second-quarter total in-creased by 4.1 percent compared with EUR 31.4 million in the same period of 2018. Operating EBITDA stood at EUR 1.5 million in the second quarter of 2019 as against EUR 1.6 million in the same period of 2018.
2.2.1 Business development
2019 ordinary general meeting of shareholdersThe 2019 annual general meeting of HolidayCheck Group AG was held at Haus der Bayerischen Wirtschaft in Munich, Germany, on 4 June 2019. The shareholders and proxies who attended the meeting represented around 66 percent of the company’s share capital with voting rights and approved each of the agenda resolu-tion by a large majority. They passed a resolution to distribute a dividend of EUR 0.04 per qualifying no-par value share. The shareholders’ meeting also approved by a large majority the discharge of the Management and Supervi-sory Boards and a control and profit transfer agreement between HolidayCheck Group AG and the tour operator HC Touristik GmbH, which was formed in 2018.
2.2.2 Performance
2.2.2.1 Income
2.2.2.1.1 Total operating income At EUR 77.2 million, the total operating income of the HolidayCheck Group for the first half-year rose by 2.7 percent in 2019 compared with EUR 75.2 million in the same period of 2018. Total operating income for the second quarter of 2019 stood at EUR 33.9 million, up 4.0 percent on the corresponding figure of EUR 32.6 million in 2018.
Revenue for the first half-year was up by 2.9 percent from EUR 72.8 million in 2018 to EUR 74.9 million in 2019. At EUR 32.7 million, second-quarter revenue was 4.1 percent higher compared with EUR 31.4 mil-lion in the same period of 2018. The main factor here was a slight upturn of the online travel agency market in the German-speaking area in the second quarter of 2019 from which also the HolidayCheck Group bene-fited, according to the company’s assessment.
At EUR 0.7 million, other income in the first six months of 2019 was up 16.7 percent on the figure of EUR 0.6 million for the same period of 2018. The second-quarter figure of EUR 0.4 million was unchanged year on year.
Other own work capitalised in the first half of 2019 stood at EUR 1.6 million, a decrease of 11.1 percent compared with the figure of EUR 1.8 million in the first six months of 2018. In the second quarter of 2019, other own work capitalised fell by 11.1 percent to EUR 0.8 million (second quarter 2018: EUR 0.9 million).
GR
OU
P M
AN
AG
EM
EN
T R
EP
OR
T
7
2.2.2.1.2 EBITDAMarketing expenditure in the first six months of the current year stood at EUR 37.5 million and thus went up by 7.8 percent on the 2018 first-half year figure of EUR 34.8 million. At EUR 16.3 million, however, mar-keting expenses in the second quarter were 8.7 per-cent higher compared with the figure of EUR 15.0 million in the same period of 2018.
Personnel expenditure in the first six months rose slightly by 7.1 percent from EUR 19.6 million to EUR 21.0 million year on year. Second-quarter 2019 personnel ex-penses increased marginally to EUR 10.3 million, which is an increase of 4.0 percent to the 9.9 million in the same quarter of the prior year. Personnel expenditure rose almost exactly in line with growth in the workforce.
At EUR 13.3 million, other expenses in the first half of 2019 were down by 1.5 percent compared with EUR 13.5 million in the same period of 2018. In the second quarter of 2019, other expenses decreased by 6.3 per-cent from EUR 6.4 million in the same period of 2018 to EUR 6.0 million. This was mainly due to the first-time application of IFRS 16 in financial 2019. Under the new rules, items totalling EUR 1.3 million that would previously have been treated as other expenses are now shown as amortisation/depreciation.
Further information about IFRS 16 can be found in section 3 of the notes to the consolidated financial statements. Under other expenses, the main increases compared with the first half of 2018 were fees, IT and other services.
At EUR 5.3 million, EBITDA (earnings before inter-est, tax, depreciation and amortisation) for the first six months of 2019 was down 26.4 percent year on year (first half of 2018: EUR 7.2 million). Second-quar-ter EBITDA increased slightly from EUR 1.2 million in 2018 to EUR 1.3 million in the current financial year.
In the first half-year, EBITDA received a EUR 1.3 mil-lion boost from the first-time application of IFRS 16, mainly due to a shift from other expenses to amorti-sation/depreciation and impairment charges. The new rules pushed up second-quarter EBITDA by EUR 0.7 million.
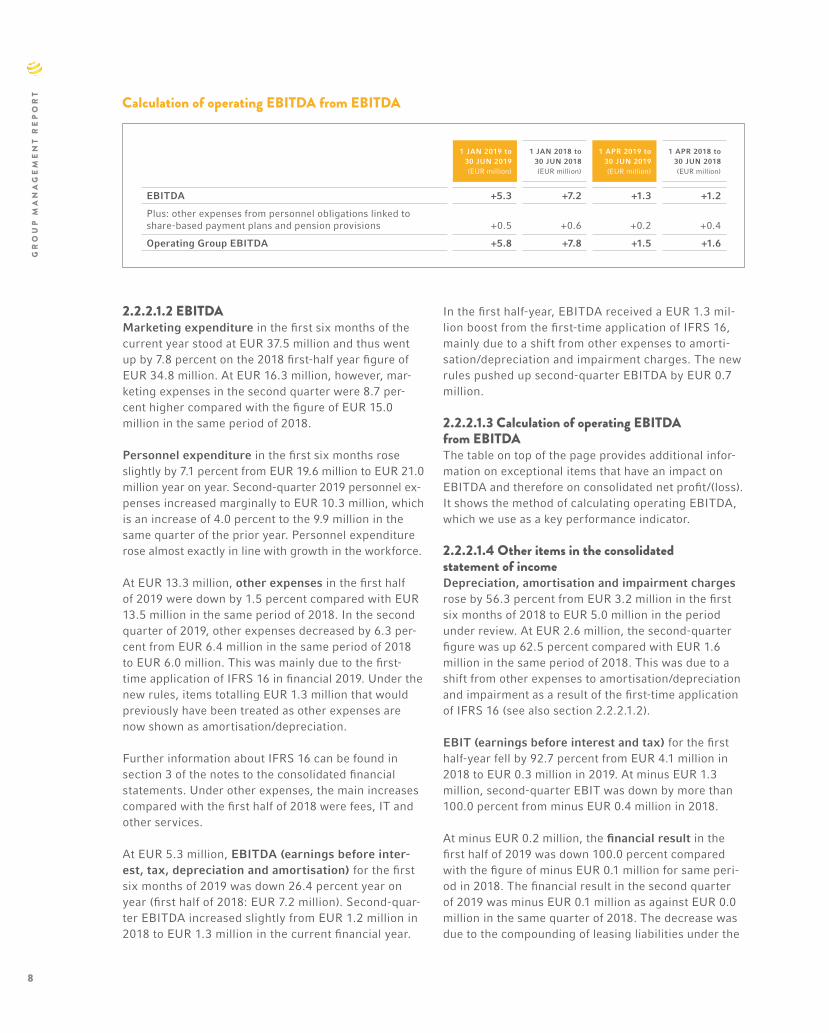
2.2.2.1.3 Calculation of operating EBITDA from EBITDAThe table on top of the page provides additional infor-mation on exceptional items that have an impact on EBITDA and therefore on consolidated net profit/(loss). It shows the method of calculating operating EBITDA, which we use as a key performance indicator.
2.2.2.1.4 Other items in the consolidated statement of incomeDepreciation, amortisation and impairment charges rose by 56.3 percent from EUR 3.2 million in the first six months of 2018 to EUR 5.0 million in the period under review. At EUR 2.6 million, the second-quarter figure was up 62.5 percent compared with EUR 1.6 million in the same period of 2018. This was due to a shift from other expenses to amortisation/depreciation and impairment as a result of the first-time application of IFRS 16 (see also section 2.2.2.1.2).
EBIT (earnings before interest and tax) for the first half-year fell by 92.7 percent from EUR 4.1 million in 2018 to EUR 0.3 million in 2019. At minus EUR 1.3 million, second-quarter EBIT was down by more than 100.0 percent from minus EUR 0.4 million in 2018.
At minus EUR 0.2 million, the financial result in the first half of 2019 was down 100.0 percent compared with the figure of minus EUR 0.1 million for same peri-od in 2018. The financial result in the second quarter of 2019 was minus EUR 0.1 million as against EUR 0.0 million in the same quarter of 2018. The decrease was due to the compounding of leasing liabilities under the
Calculation of operating EBITDA from EBITDA
1 JAN 2019 to30 JUN 2019(EUR million)
1 JAN 2018 to30 JUN 2018(EUR million)
1 APR 2019 to30 JUN 2019(EUR million)
1 APR 2018 to30 JUN 2018(EUR million)
EBITDA +5.3 +7.2 +1.3 +1.2
Plus: other expenses from personnel obligations linked to share-based payment plans and pension provisions +0.5 +0.6 +0.2 +0.4
Operating Group EBITDA +5.8 +7.8 +1.5 +1.6
8
GR
OU
P M
AN
AG
EM
EN
T R
EP
OR
T

new IFRS 16 rules. Further information about IFRS 16 can be found in section 3 of the notes to the consoli-dated financial statements.
EBT (earnings before taxes) for the first six months stood at EUR 0.2 million, down 95.0 percent on the figure of EUR 4.0 million reported for the same period of 2018. At minus EUR 1.4 million, second-quarter EBT was more than 100.0 percent down on the 2018 figure of minus EUR 0.4 million.
The tax result for the first half of 2019 was minus EUR 0.7 million compared with minus EUR 1.0 million in the same period of 2018. The corresponding figure for the second quarter was minus EUR 0.1 million in 2019 and EUR 0.0 million in the previous year.
Consolidated net profit/(loss) for the first six months was minus EUR 0.5 million compared with EUR 3.0 million in the same period of 2018. The equivalent fig-ure for the second quarter of 2019 was minus EUR 1.5 million (second quarter 2018: minus EUR 0.4 million).
Consolidated comprehensive income for the first six months decreased from EUR 2.9 million in 2018 to minus EUR 0.5 million in the reporting period. The cor-responding figure for the second quarter of 2019 was down to minus EUR 1.5 million (second quarter 2018: minus EUR 0.5 million).
Basic and diluted earnings per share stood at minus EUR 0.01 in the first half of 2019 as against EUR 0.05 in the same period of 2018. The second-quarter figure for 2019 fell to minus EUR 0.03 compared with minus EUR 0.01 in the same quarter of the prior year.
2.2.2.2 Asset and financial position
Financial management objectivesThe main financial management objective of the HolidayCheck Group is to safeguard liquidity at all times in order to ensure that the Group is able to perform its day-to-day business operations. Another objective is the optimisation of profitability to attain the maximum possible credit rating with a view to obtaining favourable refinancing terms.
2.2.2.2.1 Liquidity
Cash flowsWith EUR 0.9 million, HolidayCheck Group AG gener-ated a positive operating cash flow (net cash used in operating activities) in the reporting period (first half
2018: EUR 2.0 million). The main factor here was a decline in consolidated net profit/(loss) compared with the first half of 2018. By contrast, operating cash flow was boosted by the first-time application of IFRS 16, since payments for leasing contracts that fall under the new IFRS 16 rules are now recognised under cash flow from financing activities.
At minus EUR 2.4 million, net cash used in investing activities was at roughly the same level as in the same period of 2018 (minus EUR 2.6 million).
Net cash used in financing activities totalled a minus of EUR 3.6 million in the first six months of 2019 and EUR 0.0 million in the first half of 2018. This was due to the first-time application of IFRS 16 (see above) and the distribution by HolidayCheck Group AG of share-holder dividends totalling EUR 2.3 million.
As at 30 June 2019, cash and cash equivalents stood at EUR 28.7 million compared with EUR 25.5 million at the end of the same period in 2018.
2.2.2.2.2 Asset positionOn the assets side of the consolidated balance sheet, non-current assets as at 30 June 2019 were 6.4 percent up at EUR 143.0 million compared with the 2018 year-end figure of EUR 134.4 million. The main reason for this increase was the first-time capitalisation of rights of use totalling EUR 9.9 million under the new IFRS 16 rules.
By contrast, at EUR 67.1 million, current assets as at 30 June 2019 were 14.3 percent higher compared with the figure of EUR 58.7 million as at 31 December 2018. This was mainly due to a seasonal, revenue-based increase in trade receivables, which ended the period EUR 12.8 million higher at EUR 34.8 million, and to the change in cash and cash equivalents (see 2.2.2.2.1).
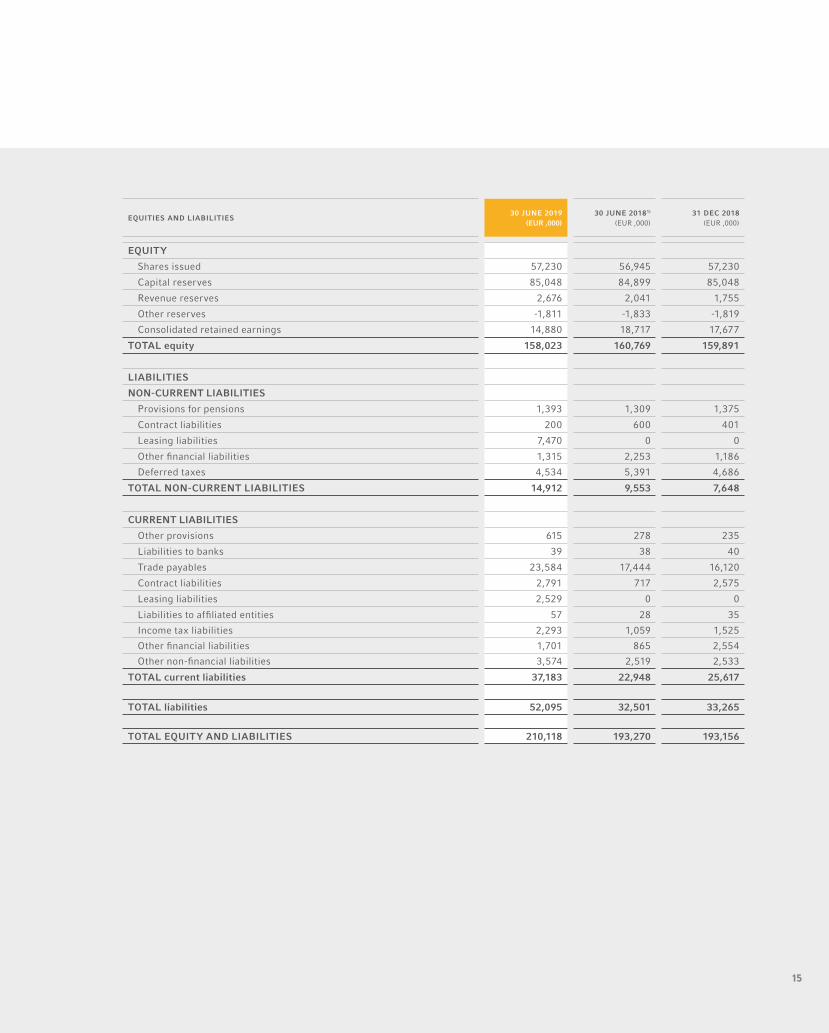
On the liabilities side of the consolidated balance sheet, equity as at 30 June 2019 was EUR 158.0 mil-lion, 1.2 percent down on the 2018 year-end figure of EUR 159.9 million. This was primarily attributable to the dividend payment in respect of financial 2018. As at 30 June, the equity ratio stood at 75.2 percent compared with the 2018 year-end figure of 82.8 per-cent. This decrease was due to a reduction in equity and – mainly because of the first-time application of IFRS 16 – an increase in total capital.
At EUR 14.9 million, non-current liabilities as at 30 June 2019 were 96.1 percent higher compared with the 2018 year-end figure of EUR 7.6 million. The main
GR
OU
P M
AN
AG
EM
EN
T R
EP
OR
T
9

factor here was the first-time recognition of non-cur-rent leasing liabilities totalling EUR 7.5 million follow-ing the introduction of IFRS 16.
As at 30 June 2019, current liabilities stood at EUR 37.2 million, up 45.3 percent on the 2018 year-end total of EUR 25.6 million. This increase was partly due to higher trade payables as a result of greater marketing expenditure and full adherence to payment targets. An-other factor, as for non-current liabilities, was the first-time recognition of current leasing liabilities totalling EUR 2.5 million following the introduction of IFRS 16.
The figure for total liabilities ended the period 56.5 percent higher at EUR 52.1 million compared with the 2018 year-end figure of EUR 33.3 million.
Total assets rose by 8.7 percent from EUR 193.2 million at the end of 2018 to EUR 210.1 million as at 30 June 2019.
The relationship between items in the balance sheet shows a shift towards a higher debt ratio. Current liabilities are covered entirely by current assets, while non-current assets are covered entirely by equity.
3. EVENTS AFTER THE BALANCE SHEET DATE
Reappointment of Marcus Scheuermann to the Management BoardThe Supervisory Board of HolidayCheck Group AG has reappointed Markus Scheuermann as CFO and decided to extend his service contract. Markus Scheuermann’s contract has been extended by another three and a half years in conjunction with his reappointment as CFO until 31 December 2023. He has been CFO of HolidayCheck Group AG since May 2017.
4. REPORT ON EXPECTED DEVELOPMENTS, OPPORTUNITIES AND RISKS
4.1 Report on expected developments
4.1.1 Expected macroeconomic developmentsBased on the forecast issued by Deutsche Bank’s Glob-al Market Research unit on 8 July 2019, the overall pic-ture of economic activity in the HolidayCheck Group’s core sales markets in 2019 is likely to be as follows. After adjusting for inflation, Dutch gross domestic product (GDP) is forecast to increase by 1.8 percent
and Belgian GDP by 1.2 percent; Germany is expected to put on 0.7 percent, Austria 1.6 percent and Switzer-land 1.1 percent in the current year.
4.1.2 Expected industry developmentsFor the current year, the Management Board of HolidayCheck Group AG anticipates revenue to be at the previous year’s level in the core markets served by the Group’s Holiday portals, especially in the package Holiday sector. Key factors for this assumption are the forecast eco-nomic developments in the core sales markets served by those Holiday portals (see section 4.1.1 of this Group management report) and the expected subdued consumer demand for Holidays. Another important but unpredictable factor that could have an impact on the trend of the travel market is any political unrest or terrorist attacks, especially in our key Mediterranean package Holiday regions, in the German-speaking area (Germany, Austria and part of Switzerland) and in the Benelux countries (Belgium, the Netherlands and Luxembourg). At the same time, the company anticipates strong and sustained competitive pressures, primarily as a result of continued high levels of spending by compet-itors on marketing and the entry of new competitors into the market. In the medium term, a possible trend towards consolidation could lead to some easing of the competitive situation and to a corresponding reduction in marketing expenditure.
The above assessments of expected industry develop-ments are based on the company’s own estimates.
4.1.3 HolidayCheck GroupOur vision is to become the most Holidaymaker-friendly company in the world. Our goal is to constantly expand our portfolio of Holiday services. We plan to consist-ently invest in measures to speed up the further devel-opment of our existing products and services (with an emphasis on the core fields of package Holidays, ‘hotel only’ bookings and cruises), the development of new products and services in adjoining areas, the steady expansion of our data intelligence systems and the fur-ther expansion of our customised travel advice service. In order to implement these measures, we anticipate an increase in personnel at HolidayCheck Group AG’s subsidiaries, mainly in the areas of product and IT development, travel advice and travel agency. This will entail an increase in staff costs.
Our subsidiaries also intend to make further invest-ments in marketing in the form of direct sales promo-
10
GR
OU
P M
AN
AG
EM
EN
T R
EP
OR
T
tions and other measures designed to give a sustained boost to the profile of our various brands.
Although HolidayCheck AG is based in the Swiss munici-pality of Bottighofen, it generates most of its sales revenue in the euro area. However, important costs such as salaries and rents are paid in Swiss francs, so any ap-preciation in the Swiss franc vis-à-vis the euro will have a negative impact on the Group’s earnings. In order to hedge this currency risk, the company concludes either currency futures contracts or, if economically reasona-ble, holds cash or cash equivalents in Swiss francs.
The Management Board’s forecast for 2019 is prem-ised on the implementation of the above investments in products and marketing in line with our plans. It assumes a solid economic situation, on the whole, and further intense competition at the same level as in 2018. Finally, the forecast of the Management Board is based on a largely stable political situation in the coun-tries that represent our most important Mediterranean Holiday destinations.
The potential effects of legal and regulatory issues have not been factored into these forecasts.
4.1.3.1 Revenue and operating EBITDAIn light of these modest results for the first half of 2019 and the upwards trend in revenue for both June and July, and with due regard for the assumptions set out above, the Management Board now anticipates a year-on-year increase of between 7.0 and 9.0 percent in the HolidayCheck Group’s revenue after adjusting for acquisitions, disposals and new company formations. This is at the lower end of the Management Board’s original revenue forecast, issued at the start of 2019, in which it projected an increase in Group revenue of between 7.0 and 12.0 percent.
In terms of earnings, reflecting the Group’s first half-year results and investments in personnel and market-ing, the Management Board now expects operating EBITDA for 2019 as a whole to reach between EUR 8.5 million and EUR 11.5 million. This includes a boost to earnings of around EUR 2.5 million from the first-time application of IFRS 16. In its original forecast, issued at the start of 2019, the Management Board anticipated an increase in operating EBITDA of between EUR 8.5 million and EUR 13.5 million.
If our expectations and assumptions do not materialise, the actual figures for revenue and operating EBITDA could be either higher or lower than forecast.
4.1.4 Overall assessment of likely developmentsFor financial 2019 as a whole, we expect to implement investments in products and marketing in line with our plans. We also anticipate a slight economic recovery of the German market and further intense competition at the same level as in 2018. Finally, we expect to see a largely stable political situation in the countries that represent our most important Mediterranean Holiday destinations. The potential effects of legal and regulatory issues have not been factored into these forecasts. The development of HolidayCheck Group can deviate positively or negatively from this forecast on account of the opportunities and risks presented in the annual report 2018 (starting from page 66) and/or the materialisation (or not) of our expectations and assumptions.
4.2 Opportunities and risk reportSince the beginning of the current financial year there have been no significant changes within the HolidayCheck Group in terms of risks and opportuni-ties that might affect its future performance. A detailed review of material risks and opportunities can be found starting from page 66 of the annual report for 2018, which can be downloaded from the Internet at www. holidaycheckgroup.com under the heading Inves-tor Relations/Reports. Printed copies are also available free of charge from the company on request.
5. EMPLOYEES
The average headcount for the HolidayCheck Group in the first half of 2019 was 489 full-time equivalents (without Management Board members). The corre-sponding average figure for the first half of 2018 was 463 full-time equivalents (without Management Board members).
6. NOTES AND FORWARD-LOOKING STATEMENTS
DefinitionsAll mentions of ‘the HolidayCheck Group’ in this man-agement report relate to the group of companies of which HolidayCheck Group AG is the parent.
Forward-looking statementsThis management report contains statements re-lating to future business and financial performance and future events or developments concerning the
GR
OU
P M
AN
AG
EM
EN
T R
EP
OR
T
11

HolidayCheck Group that may constitute forward-look-ing statements. These statements may be identified by words such as ‘expects’, ‘looks forward to’, ‘anticipates’, ‘intends’, ‘plans’, ‘believes’, ‘seeks’, ‘estimates’, ‘will’, ‘project’ or words of similar meaning. We may also make forward- looking statements in other reports, in pres-entations, in material delivered to shareholders and in media releases. In addition, our representatives may from time to time make oral forward-looking state-ments. Such statements are based on current expec-tations and certain assumptions of the HolidayCheck Group management team, and are, therefore, subject to various risks and uncertainties. Numerous fac-tors, many of which are beyond the control of the HolidayCheck Group, nevertheless affect its opera-tions, performance, business strategy and results and could cause the Group’s actual results, performance or achievements to be materially different from those expressed or implied in such forward-looking statements or anticipated on the basis of histori-cal trends. These factors include in particular, but are not limited to, the matters described in section 4.2.2 of the 2018 report under the heading ‘Risks’. Further information about risks and uncertainties affecting the HolidayCheck Group can be found in the annual report of 2018 and in our most recent earnings release, both of which are available on our website at www. holidaycheckgroup.com. Should one or more of these risks or uncertainties materialise, or should underlying assumptions prove incorrect, the actual results, performance or achievements of the HolidayCheck Group may vary materially from those described in the corresponding forward-look-
ing statements as being expected, anticipated, intended, planned, believed, sought, estimated or projected. The HolidayCheck Group neither intends, nor assumes any obligation, to update or revise these forward-looking statements in light of developments which differ from those anticipated. Due to rounding, numbers presented throughout this and other documents may not add up precisely to the totals shown, and percentages may not precisely reflect the absolute figures.
7. RESPONSIBILITY STATEMENT BY THE LEGAL REPRESENTATIVES IN ACCORD-ANCE WITH SECTION 37Y, NUMBER 1 OF THE GERMAN SECURITIES TRADING ACT (WERTPAPIERHANDELSGESETZ, WPHG) IN CONJUNCTION WITH SECTION 297, PARA GRAPH 2, SENTENCE 4 AND SEC-TION 315, PARAGRAPH 1, SENTENCE 6 OF THE GERMAN COMMERCIAL CODE (HANDELSGESETZBUCH, HBG)
To the best of our knowledge, and in accordance with the applicable reporting principles, the consolidated financial statements as at 30 June 2019 give a true and fair view of the assets and liabilities, financial position and profit or loss of the HolidayCheck Group, and the Group management report includes a fair review of the development and performance of the business and the position of the HolidayCheck Group, together with a description of the principal opportunities and risks associated with the expected development of the HolidayCheck Group.
Munich, Germany, 8 August 2019
Georg Hesse Nathan Brent Glissmeyer Markus ScheuermannChairperson of the Management Board Member of the Management Board Member of the Management Board(CEO) (CPO) (CFO)
12
GR
OU
P M
AN
AG
EM
EN
T R
EP
OR
T


CONSOLIDATED BALANCE SHEETAS AT 30 JUNE 2019
ASSETS30 JUNE 2019
(EUR ‚000)30 JUNE 20181)
(EUR ‚000)31 DEC 2018
(EUR ‚000)
NON-CURRENT ASSETS
Intangible assets
Intangible assets acquired for valuable consideration 17,776 16,969 18,611
Internally generated intangible assets 11,332 12,608 11,886
Goodwill 100,182 100,182 100,182
129,290 129,759 130,679
Rights of use 9,932 0 0
Property, plant and equipment (tangible assets)
Land and land rights 17 17 18
Other equipment, operating and office equipment 2,433 2,658 2,363
2,450 2,675 2,381
Receivables and other assets
Other financial assets 660 640 653
Other non-financial assets 107 191 150
767 831 803
Deferred taxes 572 624 548
TOTAL non-current assets 143,011 133,889 134,411
CURRENT ASSETS
Receivables and other assets
Trade receivables 34,805 31,329 22,004
Contract assets 1,575 0 1,060
Receivables from affiliated entities 135 233 184
Income tax receivables 10 70 13
Other financial assets 55 126 39
Other non-financial assets 1,854 2,113 1,686
38,434 33,871 24,986
Cash and cash equivalents 28,673 25,510 33,759
TOTAL current assets 67,107 59,381 58,745
TOTAL ASSETS 210,118 193,270 193,156
Footnote
1) Adjustment to IAS 8 (See information in section 2.3 of the notes to the consolidated financial statement).
14
CO
NS
OL
IDA
TE
D B
AL
AN
CE
SH
EE
T
EQUITIES AND LIABILITIES30 JUNE 2019
(EUR ‚000)30 JUNE 20181)
(EUR ‚000)31 DEC 2018
(EUR ‚000)
EQUITY
Shares issued 57,230 56,945 57,230
Capital reserves 85,048 84,899 85,048
Revenue reserves 2,676 2,041 1,755
Other reserves -1,811 -1,833 -1,819
Consolidated retained earnings 14,880 18,717 17,677
TOTAL equity 158,023 160,769 159,891
LIABILITIES
NON-CURRENT LIABILITIES
Provisions for pensions 1,393 1,309 1,375
Contract liabilities 200 600 401
Leasing liabilities 7,470 0 0
Other financial liabilities 1,315 2,253 1,186
Deferred taxes 4,534 5,391 4,686
TOTAL NON-CURRENT LIABILITIES 14,912 9,553 7,648
CURRENT LIABILITIES
Other provisions 615 278 235
Liabilities to banks 39 38 40
Trade payables 23,584 17,444 16,120
Contract liabilities 2,791 717 2,575
Leasing liabilities 2,529 0 0
Liabilities to affiliated entities 57 28 35
Income tax liabilities 2,293 1,059 1,525
Other financial liabilities 1,701 865 2,554
Other non-financial liabilities 3,574 2,519 2,533
TOTAL current liabilities 37,183 22,948 25,617
TOTAL liabilities 52,095 32,501 33,265
TOTAL EQUITY AND LIABILITIES 210,118 193,270 193,156
15

CONSOLIDATED STATEMENT OF INCOME FOR THE PERIOD 1 JANUARY TO 30 JUNE 2019
1 JAN to 30 JUN 2019
(EUR ‚000)
1 JAN to 30 JUN 2018
(EUR ‚000)
1 APR to30 JUN 2019
(EUR ‚000)
1 APR to 30 JUN 2018
(EUR ‚000)
Revenue 74,861 72,819 32,652 31,372
Other income 672 587 370 376
Other own work capitalised 1,630 1,774 831 865
Total operating income 77,163 75,180 33,853 32,613
Marketing expenses -37,485 -34,811 -16,257 -15,045
Personnel expenses -21,030 -19,595 -10,324 -9,930
thereof current benefits -20,595 -19,066 -10,113 -9,544
thereof long-term incentive plans and pensions -435 -529 -211 -386
Other expenses -13,309 -13,535 -5,988 -6,415
Earnings before interest, taxes, depreciation and amortisation (EBITDA) 5,339 7,239 1,284 1,223
Depreciation, amortisation and impairment -5,000 -3,175 -2,602 -1,618
Earnings before interest and taxes (EBIT) 339 4,064 -1,318 -395
Financial income 0 1 0 0
Financial expenses -177 -90 -88 -45
Financial result -177 -89 -88 -45
Earnings before taxes (EBT) 162 3,975 -1,406 -440
Actual taxes -844 -1,117 -199 -118
Deferred taxes 174 108 57 112
Tax result -670 -1,009 -142 -6
Consolidated net profit/(loss) -508 2,966 -1,548 -446
Consolidated net profit/(loss) attributable to
equity holders of the parent company -508 2,966 -1,548 -446
-508 2,966 -1,548 -446
€ € € €
Basic and diluted earnings per share -0.01 0.05 -0.03 -0.01
Average number of shares outstanding 57,229,845 56,944,318 57,229,845 56,944,318
16
CO
NS
OL
IDA
TE
D S
TA
TE
ME
NT
OF
IN
CO
ME

CONSOLIDATED STATEMENT OF COMPREHENSIVE INCOMEFOR THE PERIOD 1 JANUARY TO 30 JUNE 2019
1 JAN to 30 JUN 2019
(EUR ‚000)
1 JAN to 30 JUN 2018
(EUR ‚000)
1 APR to30 JUN 2019
(EUR ‚000)
1 APR to 30 JUN 2018
(EUR ‚000)
Consolidated net profit/(loss) -508 2,966 -1,548 -446
Items subject to possible reclassification to the statement of income in the future 8 -25 9 -19
Currency translation differences 8 -25 9 -19
Other comprehensive income 8 -25 9 -19
Consolidated comprehensive income -500 2,941 -1,539 -465
Consolidated comprehensive income attributable to
equity holders of the parent -500 2,941 -1,539 -465
-500 2,941 -1,539 -465
17
CO
NS
OL
IDA
TE
D S
TA
TE
ME
NT
OF
CO
MP
RE
HE
NS
IVE
IN
CO
ME
Footnotes
1) Adjustment to IAS 8 (See information in section 2.3 of the notes to the consolidated financial statements)
2) The item mainly comprises unrealised price gains, exchange rate-related currency holding devaluations and losses from asset disposals.
3) There were outflows of EUR 77 thousand for income taxes in the first six months of the year (2018: EUR 133 thousand) and income tax refund inflows of EUR 3 thousand (2018: EUR 111 thousand).
18
CO
NS
OL
IDA
TE
D S
TA
TE
ME
NT
OF
CA
SH
FL
OW
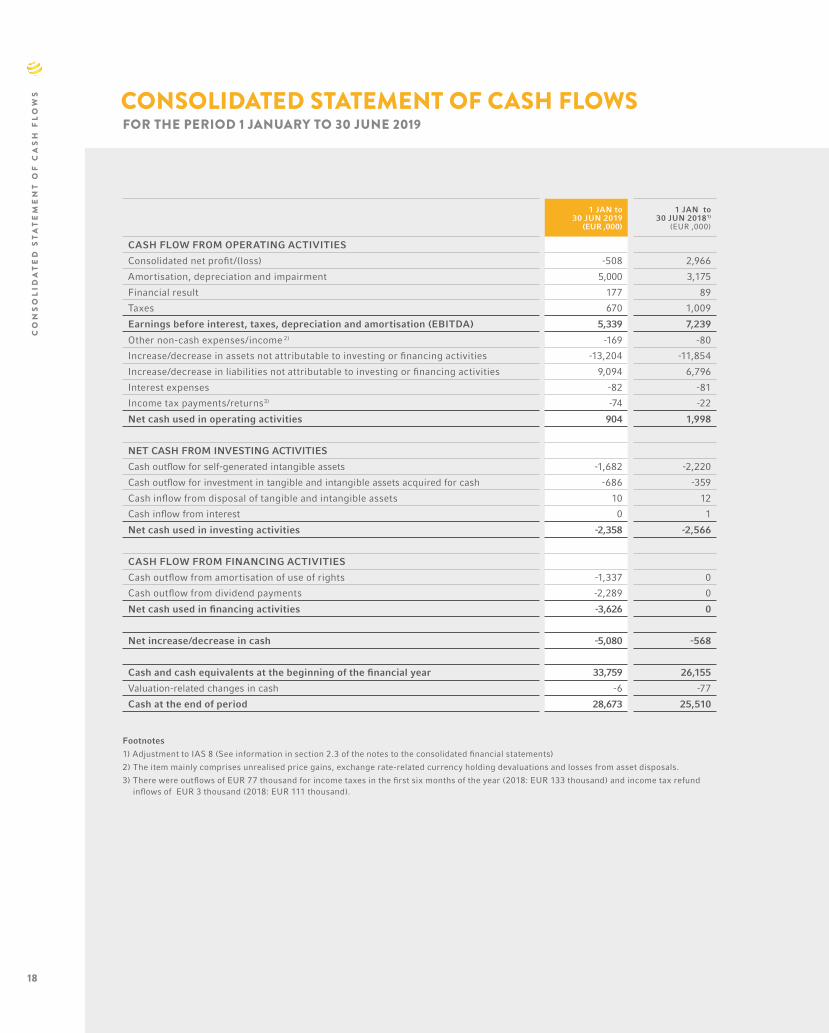
S CONSOLIDATED STATEMENT OF CASH FLOWSFOR THE PERIOD 1 JANUARY TO 30 JUNE 2019
1 JAN to 30 JUN 2019
(EUR ‚000)
1 JAN to 30 JUN 20181)
(EUR ‚000)
CASH FLOW FROM OPERATING ACTIVITIES
Consolidated net profit/(loss) -508 2,966
Amortisation, depreciation and impairment 5,000 3,175
Financial result 177 89
Taxes 670 1,009
Earnings before interest, taxes, depreciation and amortisation (EBITDA) 5,339 7,239
Other non-cash expenses/income 2) -169 -80
Increase/decrease in assets not attributable to investing or financing activities -13,204 -11,854
Increase/decrease in liabilities not attributable to investing or financing activities 9,094 6,796
Interest expenses -82 -81
Income tax payments/returns3) -74 -22
Net cash used in operating activities 904 1,998
NET CASH FROM INVESTING ACTIVITIES
Cash outflow for self-generated intangible assets -1,682 -2,220
Cash outflow for investment in tangible and intangible assets acquired for cash -686 -359
Cash inflow from disposal of tangible and intangible assets 10 12
Cash inflow from interest 0 1
Net cash used in investing activities -2,358 -2,566
CASH FLOW FROM FINANCING ACTIVITIES
Cash outflow from amortisation of use of rights -1,337 0
Cash outflow from dividend payments -2,289 0
Net cash used in financing activities -3,626 0
Net increase/decrease in cash -5,080 -568
Cash and cash equivalents at the beginning of the financial year 33,759 26,155
Valuation-related changes in cash -6 -77
Cash at the end of period 28,673 25,510

19

Footnote
1) Adjustment to IAS 8 (See information in section 2.3 of the notes to the consolidated financial statement)
20
CO
NS
OL
IDA
TE
D S
TA
TE
ME
NT
OF
CH
AN
GE
S I
N E
QU
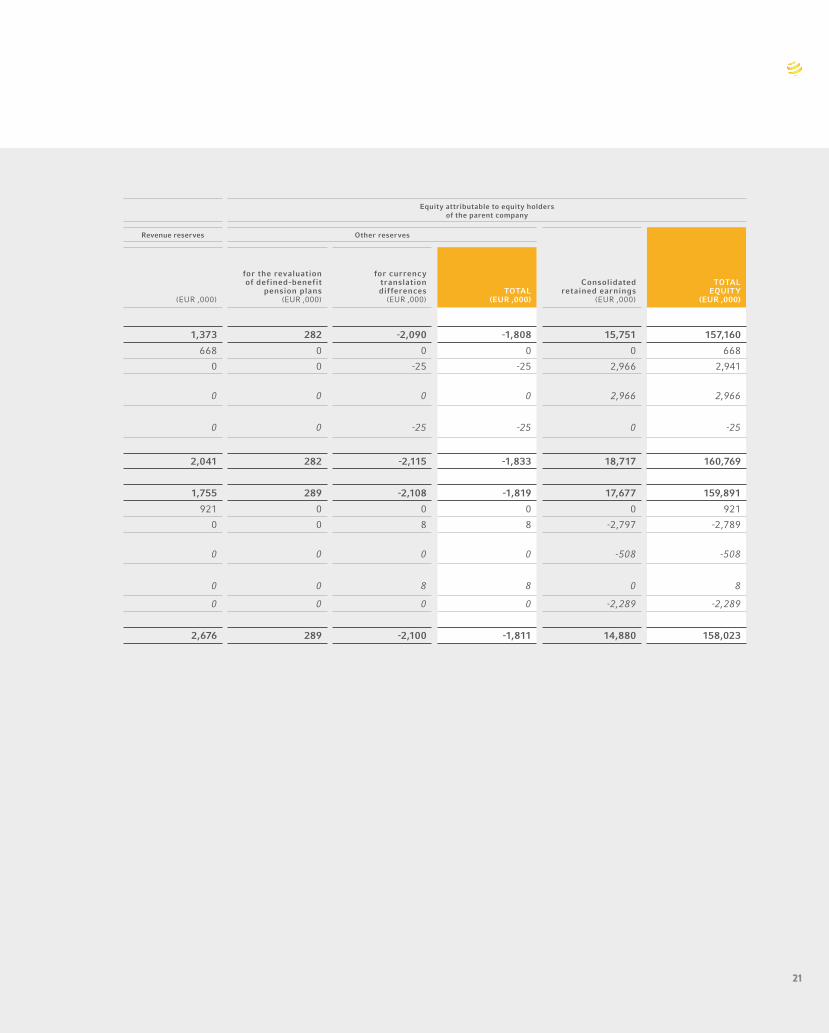
ITY CONSOLIDATED STATEMENT OF CHANGES IN EQUITY
FOR THE PERIOD 1 JANUARY TO 30 JUNE 2019
Equity attributable to equity holders of the parent company
Equity attributable to equity holders of the parent company
Issued shares Capital reserves Revenue reserves Other reserves
Consolidated retained earnings
(EUR ‚000)
TOTALEQUITY
(EUR ‚000)
Subscribed capital
(EUR ‚000)
Treasury shares
(EUR ‚000)TOTAL
(EUR ‚000) (EUR ‚000) (EUR ‚000)
for the revaluation of defined-benefit
pension plans (EUR ‚000)
for currencytranslationdif ferences
(EUR ‚000)TOTAL
(EUR ‚000)
1 JANUARY 20181) 58,314 -1,369 56,945 84,899 1,373 282 -2,090 -1,808 15,751 157,160
Effects of share-base payment plans 0 0 0 0 668 0 0 0 0 668
Consolidated comprehensive income 0 0 0 0 0 0 -25 -25 2,966 2,941
Net profit/(loss) after taxes according to consolidated statement of income 0 0 0 0 0 0 0 0 2,966 2,966
Other comprehensive income according to consolidated statement of comprehensive income 0 0 0 0 0 0 -25 -25 0 -25
30 JUNE 2018 1) 58,314 -1,369 56,945 84,899 2,041 282 -2,115 -1,833 18,717 160,769
1 JANUARY 2019 58,314 -1,084 57,230 85,048 1,755 289 -2,108 -1,819 17,677 159,891
Effects of share-base payment plans 0 0 0 0 921 0 0 0 0 921
Consolidated comprehensive income 0 0 0 0 0 0 8 8 -2,797 -2,789
Net profit/(loss) after taxes according to consolidated statement of income 0 0 0 0 0 0 0 0 -508 -508
Other comprehensive income according to consolidated statement of comprehensive income 0 0 0 0 0 0 8 8 0 8
Dividend payment 0 0 0 0 0 0 0 0 -2,289 -2,289
30 JUNE 2019 58,314 -1,084 57,230 85,048 2,676 289 -2,100 -1,811 14,880 158,023
21
Equity attributable to equity holders of the parent company
Equity attributable to equity holders of the parent company
Issued shares Capital reserves Revenue reserves Other reserves
Consolidated retained earnings
(EUR ‚000)
TOTALEQUITY
(EUR ‚000)
Subscribed capital
(EUR ‚000)
Treasury shares
(EUR ‚000)TOTAL
(EUR ‚000) (EUR ‚000) (EUR ‚000)
for the revaluation of defined-benefit
pension plans (EUR ‚000)
for currencytranslationdif ferences
(EUR ‚000)TOTAL
(EUR ‚000)
1 JANUARY 20181) 58,314 -1,369 56,945 84,899 1,373 282 -2,090 -1,808 15,751 157,160
Effects of share-base payment plans 0 0 0 0 668 0 0 0 0 668
Consolidated comprehensive income 0 0 0 0 0 0 -25 -25 2,966 2,941
Net profit/(loss) after taxes according to consolidated statement of income 0 0 0 0 0 0 0 0 2,966 2,966
Other comprehensive income according to consolidated statement of comprehensive income 0 0 0 0 0 0 -25 -25 0 -25
30 JUNE 2018 1) 58,314 -1,369 56,945 84,899 2,041 282 -2,115 -1,833 18,717 160,769
1 JANUARY 2019 58,314 -1,084 57,230 85,048 1,755 289 -2,108 -1,819 17,677 159,891
Effects of share-base payment plans 0 0 0 0 921 0 0 0 0 921
Consolidated comprehensive income 0 0 0 0 0 0 8 8 -2,797 -2,789
Net profit/(loss) after taxes according to consolidated statement of income 0 0 0 0 0 0 0 0 -508 -508
Other comprehensive income according to consolidated statement of comprehensive income 0 0 0 0 0 0 8 8 0 8
Dividend payment 0 0 0 0 0 0 0 0 -2,289 -2,289
30 JUNE 2019 58,314 -1,084 57,230 85,048 2,676 289 -2,100 -1,811 14,880 158,023
1. GENERAL DISCLOSURES
HolidayCheck Group AG, a joint-stock corporation under German law with its registered office in Munich, Ger-many, (also referred to below as ‘HCG’ or ‘the compa-ny’) is the parent company of the HolidayCheck Group, an Internet group with operations in Central Europe.
2. PREPARATION OF THE FINANCIAL STATEMENTS – ACCOUNTING BASIS AND STANDARDS
This interim consolidated report was drawn up in accordance with the International Financial Reporting Standards (IFRS) issued by the International Ac-counting Standards Board (IASB) and adopted by the European Union. In line with the provisions of Interna-tional Accounting Standard (IAS) 34 Interim Financial Reporting, the interim consolidated report condenses or omits certain information and disclosures that are usually contained in annual financial reports.
Accordingly, the financial statements contained in this interim report do not include all the information and disclosures that are required under IFRS rules for the consolidated financial statements at the end of the financial year.
The accounting and valuation methods adopted for these interim consolidated financial statements are essentially the same as those applied to the full consol-idated financial statements at the end of the previous financial year except for the first-time application of new or changed standards that will be explained in greater detail below. A comprehensive description of the accounting principles used can be found in the notes to the consolidated financial statements in our 2018 annual report. The report can also be download-ed at www.holidaycheckgroup.com.
When preparing the interim consolidated financial
statements, the Management Board has to make assumptions and estimates that affect the level and recognition of balance-sheet assets and liabilities, income and expenditure and contingent liabilities. All such assumptions and estimates are based on premises that were valid on the reporting date and, as a general rule, were calculated using the same methods as those applied for the 2018 consolidated financial statements. The actual values may differ from these assumptions and estimates if developments subsequently vary from those anticipated on the balance sheet date.
Although some parts of our business are seasonal, this does not affect the comparability of the consolidated quarterly financial statements as a whole. Any major effects during the reporting period are noted in the summary of the interim report or in the subsequent explanations.
The interim consolidated financial statements have been drawn up in euros. Unless otherwise indicated, all amounts are shown in EUR thousand (EUR ’000).
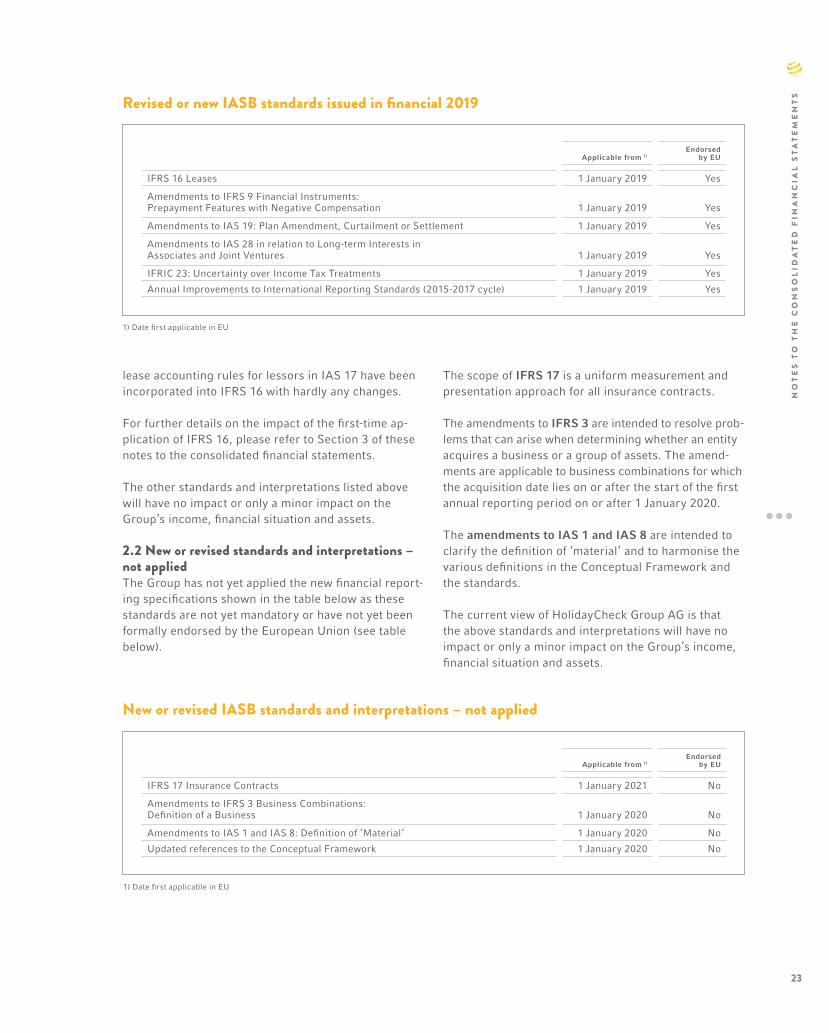
2.1 Effect of new or revised standardsThe standards shown in the table below were revised or newly issued by the IASB and became mandatory for the financial year commencing on 1 January 2019 (see table on the top of next page).
In January 2016, the IASB published IFRS 16 Leases, replacing IAS 17, IFRIC 4 and other standards and interpretations. Accordingly, the previously required accounting distinction between finance leases and operating leases is no longer applicable for the lessee. Instead, IFRS 16 has introduced a uniform account-ing model that requires lessees to recognise assets corresponding to the right of use as well as leasing liabilities in the case of leases with a term of more than twelve months. This means that leases that were previously not recognised in the balance sheet will now have to be shown in a form largely comparable to the current accounting treatment of finance leases. The
NOTES TO THE CONSOLIDATED FINANCIAL STATEMENTS OF HOLIDAYCHECK GROUP AG, MUNICH, GERMANY,FOR THE FIRST SIX MONTHS OF 2019
22
NO
TE
S T
O T
HE
CO
NS
OL
IDA
TE
D F
INA
NC
IAL
ST
AT
EM
EN
TS
lease accounting rules for lessors in IAS 17 have been incorporated into IFRS 16 with hardly any changes.
For further details on the impact of the first-time ap-plication of IFRS 16, please refer to Section 3 of these notes to the consolidated financial statements.
The other standards and interpretations listed above will have no impact or only a minor impact on the Group’s income, financial situation and assets.
2.2 New or revised standards and interpretations – not appliedThe Group has not yet applied the new financial report-ing specifications shown in the table below as these standards are not yet mandatory or have not yet been formally endorsed by the European Union (see table below).
The scope of IFRS 17 is a uniform measurement and presentation approach for all insurance contracts.
The amendments to IFRS 3 are intended to resolve prob-lems that can arise when determining whether an entity acquires a business or a group of assets. The amend-ments are applicable to business combinations for which the acquisition date lies on or after the start of the first annual reporting period on or after 1 January 2020.
The amendments to IAS 1 and IAS 8 are intended to clarify the definition of ‘material’ and to harmonise the various definitions in the Conceptual Framework and the standards.
The current view of HolidayCheck Group AG is that the above standards and interpretations will have no impact or only a minor impact on the Group’s income, financial situation and assets.
Revised or new IASB standards issued in financial 2019
1) Date first applicable in EU
Applicable from 1)Endorsed
by EU
IFRS 16 Leases 1 January 2019 Yes
Amendments to IFRS 9 Financial Instruments: Prepayment Features with Negative Compensation 1 January 2019 Yes
Amendments to IAS 19: Plan Amendment, Curtailment or Settlement 1 January 2019 Yes
Amendments to IAS 28 in relation to Long-term Interests in Associates and Joint Ventures 1 January 2019 Yes
IFRIC 23: Uncertainty over Income Tax Treatments 1 January 2019 Yes
Annual Improvements to International Reporting Standards (2015-2017 cycle) 1 January 2019 Yes
New or revised IASB standards and interpretations – not applied
1) Date first applicable in EU
Applicable from 1)Endorsed
by EU
IFRS 17 Insurance Contracts 1 January 2021 No
Amendments to IFRS 3 Business Combinations:Definition of a Business 1 January 2020 No
Amendments to IAS 1 and IAS 8: Definition of ‘Material’ 1 January 2020 No
Updated references to the Conceptual Framework 1 January 2020 No
NO
TE
S T
O T
HE
CO
NS
OL
IDA
TE
D F
INA
NC
IAL
ST
AT
EM
EN
TS
23

2.3 IAS 1/IAS 8 disclosures
Adjustment of the consolidated balance sheet 2018Due to the first-time application of IFRS 9 in financial 2018, the carrying value of trade receivables as at 1 January 2018 would have had to be increased by EUR 330 thousand on account of the lower risk provi-sion compared with the previous rules under IAS 39. Equally, due to the first-time application of IFRS 15 in financial 2018, current contract liabilities as at 1 January 2018 would have had to be reduced by EUR 154 thousand. The figures for the end of the second quarter of 2018 as at 30 June have been adjusted accordingly in line with IAS 1 and IAS 8. The resulting differences have been recognised under other comprehensive
income as consolidated retained earnings. The items ‘Increase/decrease in assets/liabilities not attributable to investing or financing activities’ in the consolidat-ed statement of cash flows for the previous year have therefore been adjusted. For details, please refer to section 2.1 (starting from page 105) of the notes to the 2018 consolidated financial statements.
From 2018 onwards, for greater transparency, other miscellaneous assets and liabilities will be shown sep-arately in the consolidated balance sheet under other financial and non-financial assets and liabilities. For logical consistency with the audited consolidated finan-cial statement for 2018, these items have been divided as shown below for the first half of 2019 (condensed form):
Changes in the presentation of the prior-year consolidated balance sheet
30 June 2018
ASSETS
PRIOR-YEAR FIGURE
€ '000
RECLASSI-FICATION
€ '000
NEW CLASSI-FICATION
€ '000
NON-CURRENT ASSETS
Receivables and other assets
Other financial assets 592 -466 1) 126
Other non-financial assets 1,647 466 1) 2,113
2,239 0 2,239
EQUITY AND LIABILITIES
NON-CURRENT LIABILITIES
Other financial liabilities 3,384 -2,519 2) 865
Other non-financial liabilities 0 2,519 2) 2,519
3,384 0 3,384
Notes1) The reclassified figures refer to VAT receivables in Germany and other countries.2) The reclassified figures are chiefly VAT liabilities, other tax liabilities, personnel liabilities, such as provisions for leave not taken, social security liabilities, and other
transit items.
24
NO
TE
S T
O T
HE
CO
NS
OL
IDA
TE
D F
INA
NC
IAL
ST
AT
EM
EN
TS
3. CHANGES IN REPORTING PRINCIPLES
Impact of the first-time application of IFRS 16IFRS 16 is to be applied to annual reporting periods beginning on or after 1 January 2019. Early adoption is permitted if IFRS 15 is already being applied. The HCG Group applies IFRS 16 for the first time for the financial year beginning on 1 January 2019. HCG exercises the option to follow the modified retrospective method. Any cumulative effect of this switch would have been shown in equity with no impact on income. Comparative figures for the same periods in the previous year will not be adjusted. Instead, notes will be added to explain changes in items in the balance sheet and statement of income for the current period that result from the first-time application of IFRS 16. There were no onerous leases when IFRS 16 was first applied. Valuation allow-ances for rights of use were therefore not required. HCG will also apply the following transitional rules:• we will exercise the option not to perform a reval-
uation; accordingly, we will apply IFRS 16 only to existing contracts classed as leases under IAS 17 and IFRIC 4;
• leasing liabilities will be recognised at the present value of the outstanding lease payments discounted by the lessee’s incremental borrowing rate of interest at the time of first application; the right-of-use (RoU) asset is shown as the total of the leasing liabilities after adjusting for previously recognised lease pay-ments. The weighted average incremental borrowing rate of interest applied to leasing liabilities as at 1 January 2019 is 1.5 percent.
With regard to the options and exemptions available under IFRS 16, the HCG Group applies the following approach:• rights of use and leasing liabilities will be shown
separately in the balance sheet;• the recognition, valuation and presentation rules
of IFRS 16 will not be applied to current leasing relationships and leasing relationships in which the leased asset in question is of minor value (EUR < 5,000);
• in the case of contracts which contain both leasing and non-leasing components, there will be no sep-aration; each leasing component will be presented with the other associated contractual components as a leasing relationship.
The first-time application of IFRS 16 had the following impact on the consolidated results:
• the leasing liabilities arising from first-time appli-cation on 1 January 2019 amounted to EUR 10,685 thousand;
• the right-of-use (RoU) asset was also recognised at EUR 10,685 thousand, as no previous lease payments had been made; for this reason, the switch had no impact on the consolidated net profit/(loss);
• based on our current lease contracts, there was a shift between leasing expenses and deprecia-tion in the period under review; leasing expenses were EUR 1,337 thousand lower and depreciation EUR 1,319 thousand higher;
• based on our current lease contracts, there was a shift of around EUR 1,337 thousand between operat-ing cash flow and financing cash flow in the report-ing period;
• the compounding of leasing liabilities produced in-terest expenses of EUR 85 thousand in the half-year period under review.
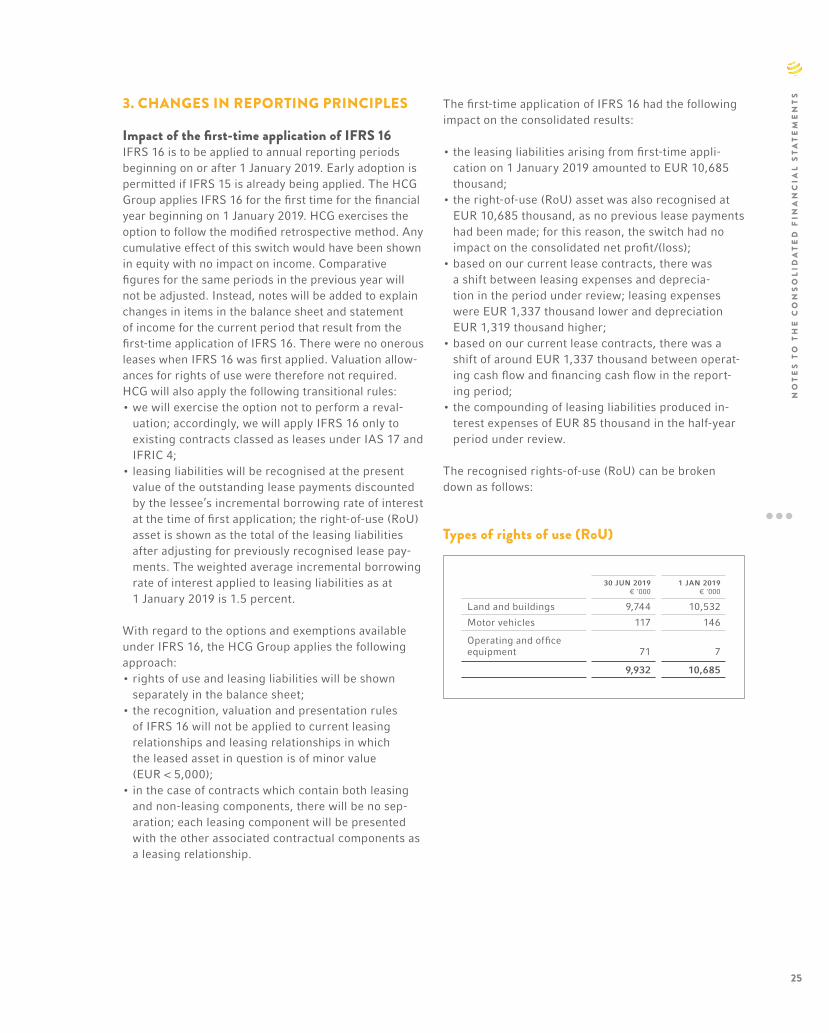
The recognised rights-of-use (RoU) can be broken down as follows:
Types of rights of use (RoU)
30 JUN 2019€ '000
1 JAN 2019€ '000
Land and buildings 9,744 10,532
Motor vehicles 117 146
Operating and office equipment 71 7
9,932 10,685
NO
TE
S T
O T
HE
CO
NS
OL
IDA
TE
D F
INA
NC
IAL
ST
AT
EM
EN
TS
25

4. PRINCIPLES OF CONSOLIDATION
The principles of consolidation applied in the first half of 2019 were unchanged and therefore match those set out in section 3 of the notes to the consolidated finan-cial statements in the 2018 annual report.
5. SEGMENT REPORTING
Business segment reporting is laid out in such a way as to conform to the method of in-house reporting to the principal decision-making body. The latter is respon-sible for decisions on the allocation of resources to business segments and for the evaluation of their prof-itability. The Management Board of HCG constitutes the principal decision-making body.
As from financial 2016, the Management Board has therefore managed the Group on the basis of key indi-cators for the entire business rather than on a segment basis. As such, the business is no longer divided into segments. Accordingly, this interim report does not contain a separate segment report.
6. REPORTING ENTITY
The interim consolidated financial statements in con-densed form include all companies over which Holiday-Check Group AG exerts direct or indirect control.
The table on the top of the page lists all the companies included in the interim consolidated financial state-ments of HolidayCheck Group AG:
Reporting entity as of 30 June 2019
1) Indirect shareholding via HolidayCheck AG 2) Indirect shareholding via WebAssets B.V. 3) Company in liquidation
COMPANY PRINCIPAL PLACE OF BUSINESS SHAREHOLDING(percent)
HolidayCheck Group AG Munich, Germany -
HolidayCheck AG Bottighofen, Switzerland 100.00
HolidayCheck Polska Sp. z o.o. 1) Warsaw, Poland 100.00
HolidayCheck Solutions GmbH Munich, Germany 100.00
HC Touristik GmbH Munich, Germany 100.00
Driveboo AG Bottighofen, Switzerland 100.00
Tomorrow Travel B.V. Amsterdam, Netherlands 100.00
WebAssets B.V. Amsterdam, Netherlands 100.00
Zoover Media B.V. 2) Amsterdam, Netherlands 100.00
Zoover International B.V. 2) Amsterdam, Netherlands 100.00
Zoover GmbH 2) Munich, Germany 100.00
Meteovista B.V. 2) Amsterdam, Netherlands 100.00
SARL Zoover France 2) 3) Paris, France 100.00Zoover Travel B.V. 2) Amsterdam, Netherlands 100.00
26
NO
TE
S T
O T
HE
CO
NS
OL
IDA
TE
D F
INA
NC
IAL
ST
AT
EM
EN
TS

7. NOTES ON THE INTERIM CONSOLIDATED FINANCIAL STATEMENTS
Intangible assetsIntangible assets include capitalised goodwill and oth-er own work capitalised for the development of mobile applications and website redesign. In respect of own work capitalised a total of EUR 1,630 thousand was recognised for the period up to 30 June 2019 (30 June 2018: EUR 1,774 thousand).
Trade receivablesTrade receivables rose from the 2018 year-end figure of EUR 22,004 thousand to EUR 34,805 thousand as at 30 June 2019. This was mainly due to an increase in the volume of holiday bookings brokered by the Holiday-Check Group but not yet settled and to the seasonal nature of the Group’s business activities.
Equity
Shares issuedAs at 30 June 2019, the cash equivalent of shares issued by the company amounted to EUR 58,313,628. This total is divided into 58,313,628 no-par value shares, each with an accounting par value of EUR 1. All shares in the company are fully paid up.
As at 30 June 2019, the number of treasury shares held by the company was unchanged on the 2018 year-end figure at 1,083,783. This corresponds to around 1.9 percent of the share capital.
Capital reservesAs at 30 June 2019, the capital reserves of HCG stood at EUR 85,048 thousand and thus were unchanged on the 2018 year-end figure.
The capital reserves are made up of payments into the reserve from capital increases. They may only be uti-lised as prescribed by German stock corporation law.
Revenue reservesIn the first half of 2019, as prescribed by IFRS 2, the amount of EUR 921 thousand was recognised as an in-crease in the revenue reserves. As at 30 June 2019, the revenue reserves of the HCG Group stood at EUR 2,676 thousand.
Consolidated retained earningsHolidayCheck Group AG distributed a total dividend of EUR 2,289 thousand in respect of the first half of 2019.
Authorised capitalOn 20 June 2018, the general meeting of sharehold-ers passed a resolution authorising the Management Board, subject to Supervisory Board approval, to un-dertake one or more increases in the company’s share capital until 19 June 2023 of up to EUR 29,156,814.00 through the issuance of up to 29,156,814 new no-par value shares in exchange for cash and/or non-cash contributions (Authorised Capital 2018). The Man-agement Board is authorised to exclude shareholders’ statutory subscription rights.
Share-based paymentsShare-based payments are awarded under the long-term incentive plans LTIP 2011-2016, LTIP 2017-2020 and the restricted stock plan. These plans are de-scribed in our 2018 annual report.
The following table details the personnel expenses recognised in the consolidated financial statements for the first half of 2019 as a result of the company’s share-based payment obligations (see table below).
Personnel expenses of share-based payments
1) Including pro rata personnel expenditure for the tranches from 2019 to 2020 2) Including pro rata personnel expenditure for the tranches from 2018 to 2020.
Previous-year figure corrected to take account of ancillary salary costs.3) Including personnel expenses created by the share matching offer.
1 JAN to 30 JUN 2019(EUR ‘000)
1 JAN to 30 JUN 2018(EUR ‘000)
Of which from plans with settlement in cash (LTIP 2011-2016) 61 181
Of which from plans with settlement in equity instruments (LTIP 2017-2020) 1591) 1232)
Of which from plans with settlement in equity instruments (RSP) 762 5453)
TOTAL 982 849
NO
TE
S T
O T
HE
CO
NS
OL
IDA
TE
D F
INA
NC
IAL
ST
AT
EM
EN
TS
27

The personnel expenses on plans with settlement in equity instruments initially increases the revenue reserves in accordance with IFRS 2. It is anticipated that shares will be allocated to employees (RSP) and to the Management Board for 2018 (LTIP 2017-2020) in July 2019. Their nominal value as part of the company’s share capital (i.e. the number of shares allocated at an accounting par value of EUR 1.00 each) will then be recognised under shares issued. This effect on the total figure for shares issued was not included in the calculation of earnings per share for this interim statement.
Trade payablesTrade payables rose from the 2018 year-end figure of EUR 16,120 thousand to EUR 23,584 thousand as at 30 June 2019. This was mainly due to higher liabilities to holidaymakers under the voucher scheme and to the HolidayCheck Group’s active use of payment targets.
RevenueRevenue is subdivided into the categories shown in the table above: type of service and timing of recognition.
Financial expensesThe financial expenses of EUR 177 thousand (2018: EUR 90 thousand) result from interest expenses. The total figure for interest expenses includes EUR 85 thousand (2018: EUR 0 thousand) for compounding and EUR 92 thousand (2018: EUR 90 thousand) for loan interest.
Additional disclosures to financial instrumentsAs a guide to the reliability of the input factors used to calculate their fair value, financial instruments are allocated to one of the three levels prescribed by the reporting principles.
• Level 1: the fair value of level 1 financial instruments is determined at the end of the reporting period us-ing quoted (unadjusted) market prices that match the current bid price.
• Level 2: the fair value of level 2 financial instruments is determined using valuation methods for which the input factors are based on observable market data.
• Level 3: in the case of level 3 financial instruments, at least one of the main input factors is not based on observable market data.
The table on top of the next page shows the financial assets and/or liabilities measured on a recurring basis and recognised at fair value as at 30 June 2019. There were no assets or liabilities in this category in the year-end financial statements for 2018.
Changes in the figures due to switches between fair value levels are calculated at the end of the reporting period. There were no such changes in the period under review.
Financial assets were measured at fair value using recognised actuarial valuation models (market-to-mar-ket method). The methods used to value financial instruments are unchanged compared with 31 Decem-ber 2018.
Revenue from contracts with customers
1 JAN – 30 JUN 2019(EUR ‘000)
1 JAN – 30 JUN 2018(EUR ‘000)
Type of service
Commission services 67,463 65,317
Advertising services 7,156 7,290
Other services 242 212
Timing of recognition
Over time 8,008 7,901
At a point in time 66,853 64,918
TOTAL 74,861 72,819
28
NO
TE
S T
O T
HE
CO
NS
OL
IDA
TE
D F
INA
NC
IAL
ST
AT
EM
EN
TS

Munich, Germany, 8 August 2019
HolidayCheck Group AG
Georg Hesse Nathan Brent Glissmeyer Markus ScheuermannChairperson of the Management Board Member of the Management Board Member of the Management Board(CEO) (CPO) (CFO)
8. RELATED PARTIES
Transactions with related entities primarily involved services as defined by IAS 24.21c. All such transac-tions were concluded on arm’s length basis.
In total, transactions with related parties in the first six months of the financial year involved trade receivables valued at EUR 25 thousand (2018: EUR 29 thousand) and trade payables valued at EUR 423 thousand (2018: EUR 389 thousand).
As at 30 June 2019 receivables and payables from current transactions with related parties amounted to EUR 135 thousand (31 December 2018: EUR 184 thou-sand) and EUR 57 thousand (31 December 2018: EUR 35 thousand) respectively.
Financial assets as at 30 June 2019
LEVEL 1 LEVEL 2 LEVEL 3 TOTAL
Financial assets
Financial assets measured at fair value through profit and loss
Currency forwards 0 26 0 26
9. EVENTS AFTER THE BALANCE SHEET DATE
Extension of Markus Scheuermann’s Management Board service contractThe Supervisory Board of HolidayCheck Group AG has reappointed Markus Scheuermann as CFO and decided to extend his service contract.
Markus Scheuermann’s contract has been extended by another three and a half years in conjunction with his reappointment as CFO until 31 December 2023. He has been CFO of HolidayCheck Group AG since May 2017.
NO
TE
S T
O T
HE
CO
NS
OL
IDA
TE
D F
INA
NC
IAL
ST
AT
EM
EN
TS
29

PUBLISHING INFORMATIONPUBLISHERHolidayCheck Group AGNeumarkter Strasse 6181673 Munich, Germanywww.holidaycheckgroup.com
EDITORSArmin Blohmann and Sabine Wodarz, HolidayCheck Group AG
OTHER CONTRIBUTORSMaximilian Buchard, Uta Fesefeldt, Minh Tran and Kerstin Trottnow
ART DIRECTIONUte Pfeuffer
PHOTOGRAPHYPicture credits: 4FR, wundervisuals, TriggerPhoto
TRANSLATIONVerbum versus Verbum
FINANCIAL CALENDAR 2019*24 September 2019Berenberg & Goldman Sachs German Corporate Conference 2019 in Munich-Unterschleißheim, Germany
8 November 2019Publication of the nine months 2019 Interim Statement
27 November 2019Analysts’ meeting at the German Equity Forum 2019 in Frankfurt am Main, Germany
* scheduled dates
INVESTOR RELATIONSArmin Blohmann+49 (0) 89 35 76 [email protected]
Sabine Wodarz+49 (0) 89 35 76 [email protected]
HolidayCheck Group AGNeumarkter Strasse 6181673 Munich, Germany
www.holidaycheckgroup.com
www.facebook.de/HolidayCheckGroup
www.twitter.com/HolidayCheckGrp
DISCLAIMERThis is a translation of HolidayCheck Group AG‘s HY1 2019 Interim Report. Only the German version of the Interim Report is legally binding. Every effort was made to ensure the accuracy of the translation, however, no warranty is made as to the accuracy of the translation and the company assumes no liability with respect thereto. The company cannot be held responsible for any misunderstandings or misinterpretation arising from this convenience translation.
FIN
AN
CIA
L C
AL
EN
DA
R &
PU
BL
ISH
ING
IN
FO
RM
AT
ION


H O L I D A Y C H E C K G R O U P A GN E U M A R K T E R S T R A S S E 6 18 1 6 7 3 M U N I C H , G E R M A N Y
W W W.H O L I D AY C H E C K G R O U P.C O M