Embed Size (px)
Citation preview

HMDA Data
Robert B. Avery
Association of Public Data Users Annual Conference 2008
September 24, 2008
This presentation reflects the joint work of Robert B. Avery, Kenneth P. Brevoort and Glenn B. Canner. The views expressed here are those of the author and do not necessarily represent those of the Board of Governors of the Federal Reserve System or members of the staff.
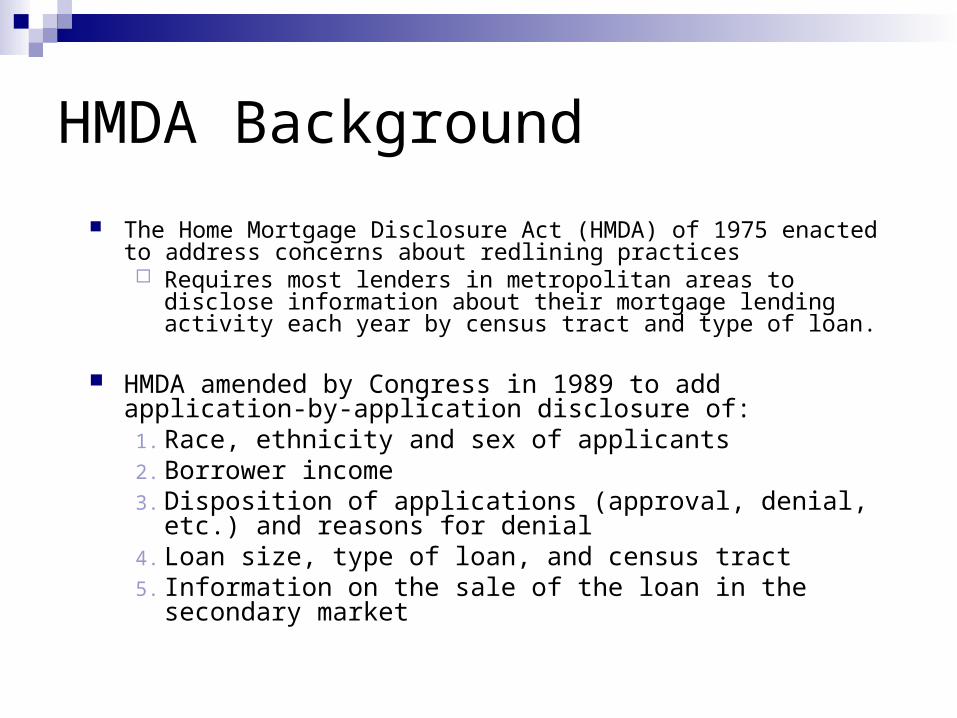
HMDA Background
The Home Mortgage Disclosure Act (HMDA) of 1975 enacted to address concerns about redlining practices Requires most lenders in metropolitan areas to disclose information
about their mortgage lending activity each year by census tract and type of loan.
HMDA amended by Congress in 1989 to add application-by-application disclosure of:
1. Race, ethnicity and sex of applicants2. Borrower income3. Disposition of applications (approval, denial, etc.) and
reasons for denial4. Loan size, type of loan, and census tract5. Information on the sale of the loan in the secondary market
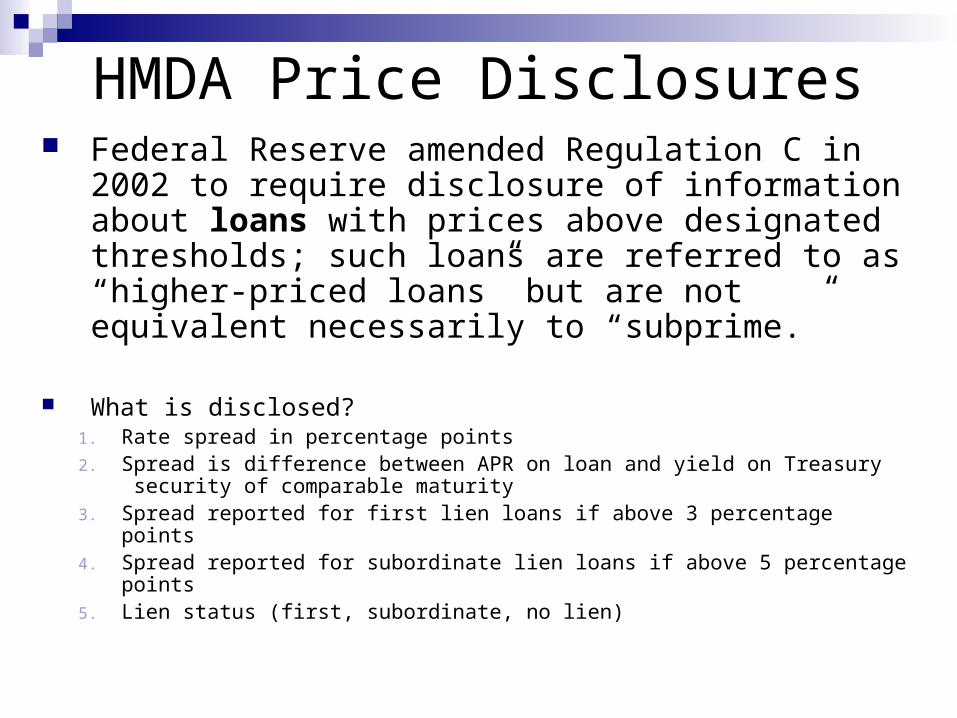
HMDA Price Disclosures Federal Reserve amended Regulation C in 2002
to require disclosure of information about loans with prices above designated thresholds; such loans are referred to as “higher-priced loans” but are not equivalent necessarily to “subprime.”
What is disclosed?1. Rate spread in percentage points2. Spread is difference between APR on loan and yield on Treasury security
of comparable maturity 3. Spread reported for first lien loans if above 3 percentage points4. Spread reported for subordinate lien loans if above 5 percentage points 5. Lien status (first, subordinate, no lien)

The 2007 HMDA Data
For 2007: 8,610 lenders reported on roughly 21 million loan applications down about 25 percent from 2006Reporters include 6,858 banking institutions
and 1,752 mortgage companies -- including 1,124 independent mortgage companies
Number of reporters fell about 3 percent; virtually all the decline due to independent mortgage companies that ceased operations
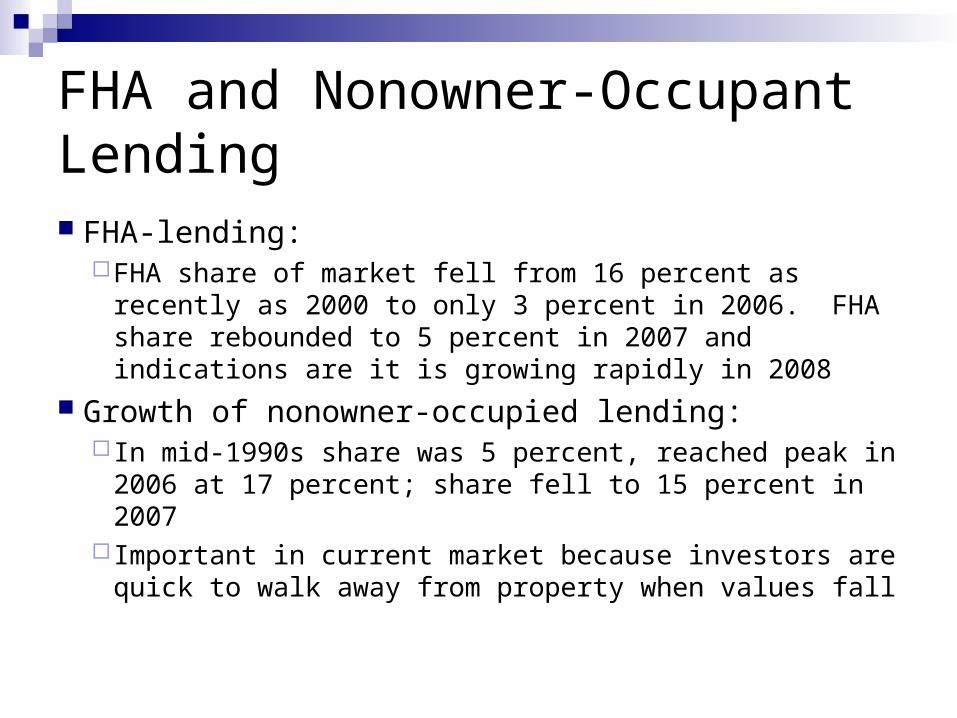
FHA and Nonowner-Occupant Lending FHA-lending:
FHA share of market fell from 16 percent as recently as 2000 to only 3 percent in 2006. FHA share rebounded to 5 percent in 2007 and indications are it is growing rapidly in 2008
Growth of nonowner-occupied lending: In mid-1990s share was 5 percent, reached peak in 2006 at
17 percent; share fell to 15 percent in 2007 Important in current market because investors are quick to
walk away from property when values fall
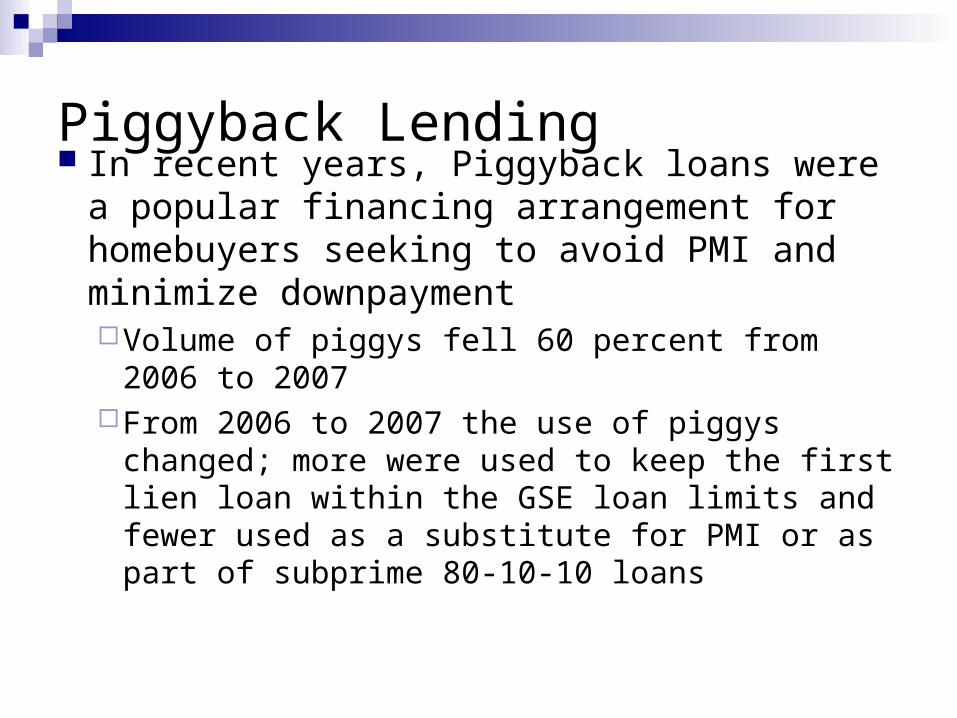
Piggyback Lending In recent years, Piggyback loans were a
popular financing arrangement for homebuyers seeking to avoid PMI and minimize downpaymentVolume of piggys fell 60 percent from 2006 to 2007From 2006 to 2007 the use of piggys changed;
more were used to keep the first lien loan within the GSE loan limits and fewer used as a substitute for PMI or as part of subprime 80-10-10 loans
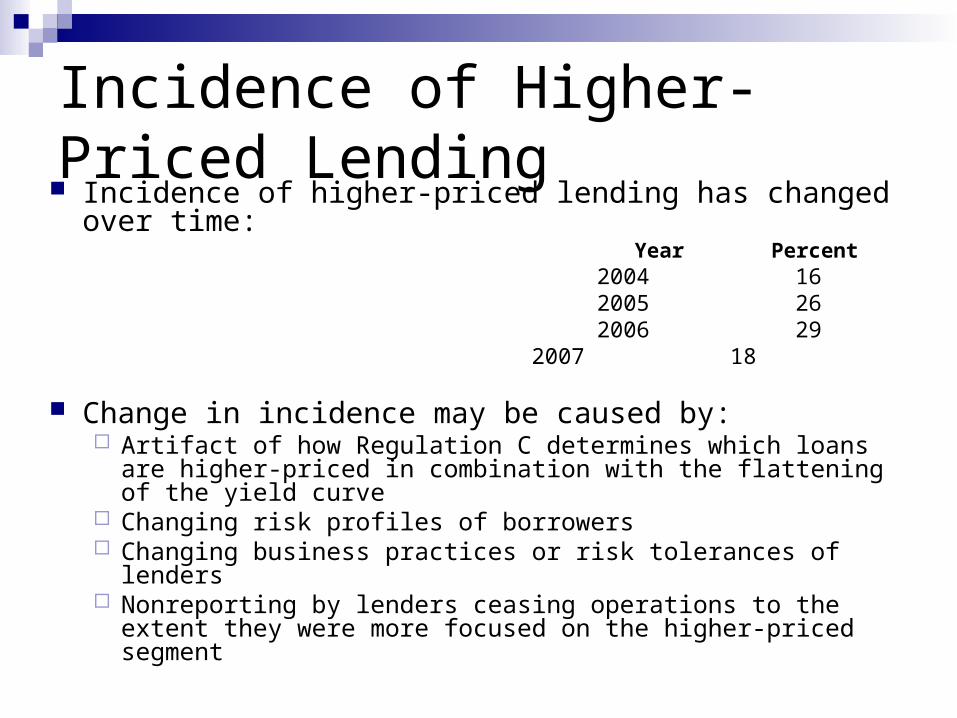
Incidence of Higher-Priced Lending Incidence of higher-priced lending has changed over
time: Year Percent
2004 16 2005 26 2006 29
2007 18
Change in incidence may be caused by: Artifact of how Regulation C determines which loans are higher-
priced in combination with the flattening of the yield curve Changing risk profiles of borrowers Changing business practices or risk tolerances of lenders Nonreporting by lenders ceasing operations to the extent they
were more focused on the higher-priced segment
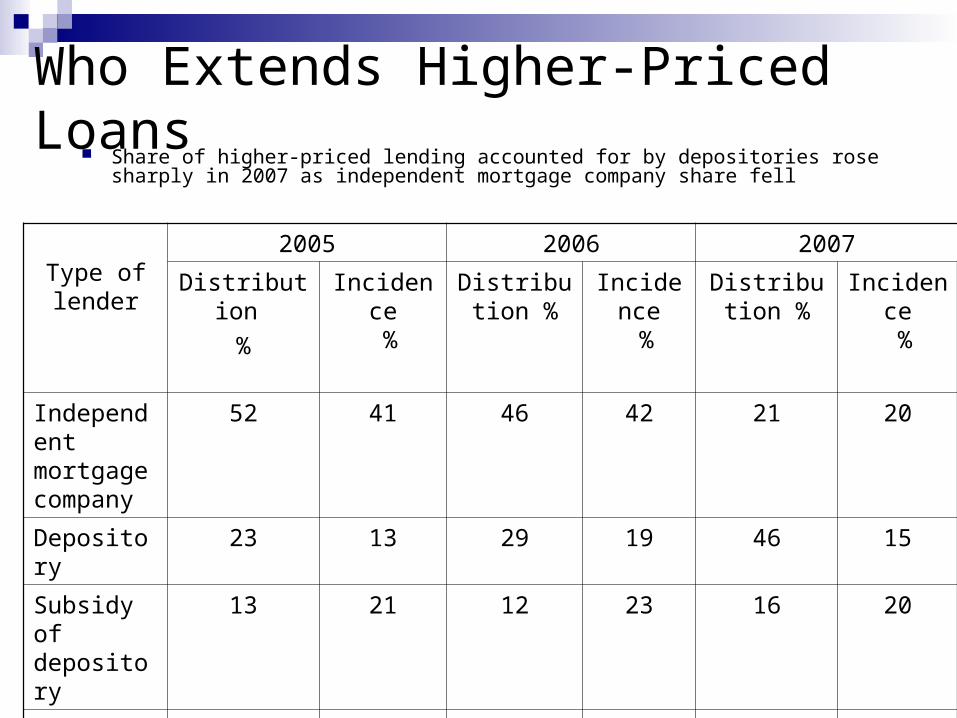
Who Extends Higher-Priced Loans Share of higher-priced lending accounted for by depositories rose
sharply in 2007 as independent mortgage company share fell
Type of lender
2005 2006 2007
Distribution
%
Incidence %
Distribution %
Incidence %
Distribution %
Incidence %
Independent mortgage company
52 41 46 42 21 20
Depository 23 13 29 19 46 15
Subsidy of depository
13 21 12 23 16 20
Affiliate of depository
12 31 13 38 18 41
Total 100 25 100 28 100 19

Effects of Closed LendersLoan Counts by Month, 2006 and 2007
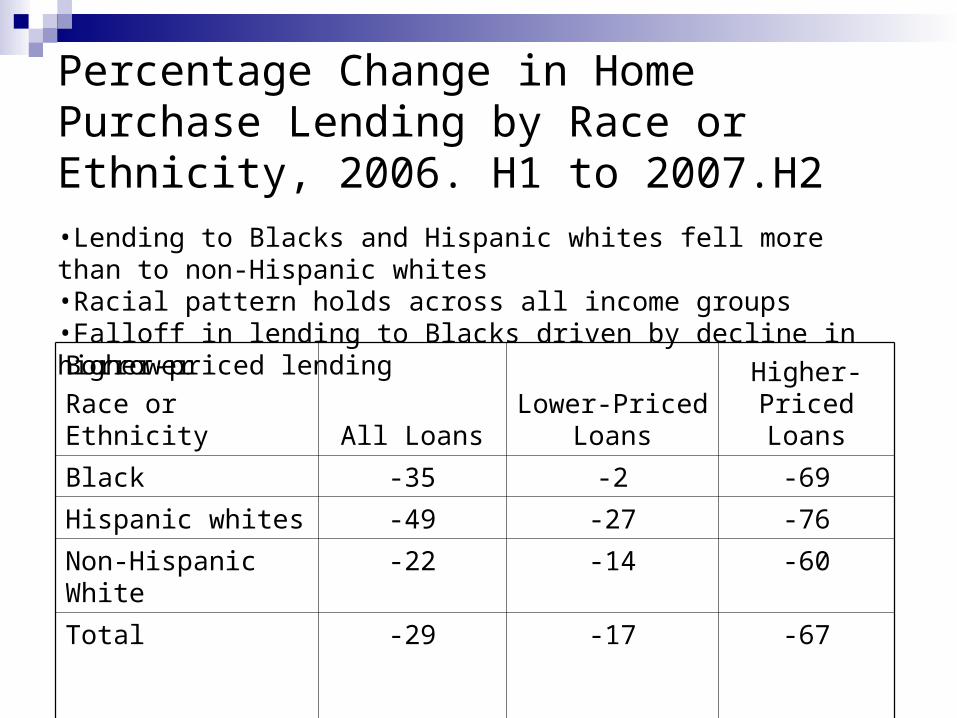
Percentage Change in Home Purchase Lending by Race or Ethnicity, 2006. H1 to 2007.H2
Borrower
Race or Ethnicity All LoansLower-Priced
LoansHigher-Priced
Loans
Black -35 -2 -69
Hispanic whites -49 -27 -76
Non-Hispanic White -22 -14 -60
Total -29 -17 -67
•Lending to Blacks and Hispanic whites fell more than to non-Hispanic whites•Racial pattern holds across all income groups•Falloff in lending to Blacks driven by decline in higher-priced lending

Percentage Changes in Lending by Type of Lender
Loan Type All
Depositories in Assessment
Area
Depositories Outside
Assessment Area
Independent Mortgage Company
Home Purchase
Lower Priced -17 -4 -17 -36
Higher Priced -67 -17 -59 -88
Refinance
Lower Priced -16 -11 -7 -38
Higher Priced -57 8 -43 -85
•Independent mortgage companies experienced greater declines than depository institutions regardless of location for all types of lending

House Price Changes and Changes in Lending Falloff in lending activity is related to patterns
of house price changes in preceding yearsMSAs that had larger declines in prices from
2006.Q4 to 2008.Q1 experienced larger declines in lending
Falloff in activity was greater for MSAs that had experienced sharp increases in home prices from 2003.Q1 to 2006.Q4
Lending declined 53 percent in MSAs with sharp declines preceded by sharp increases, compared to a 5 percent decline in MSAs with sharp declines preceded by smaller appreciation

Change in House Price Index from December 2006 to March 2008
Large decrease (greater than 8% decrease)
Small decrease (less than 8% decrease)
Increase (increase greater than 0%)
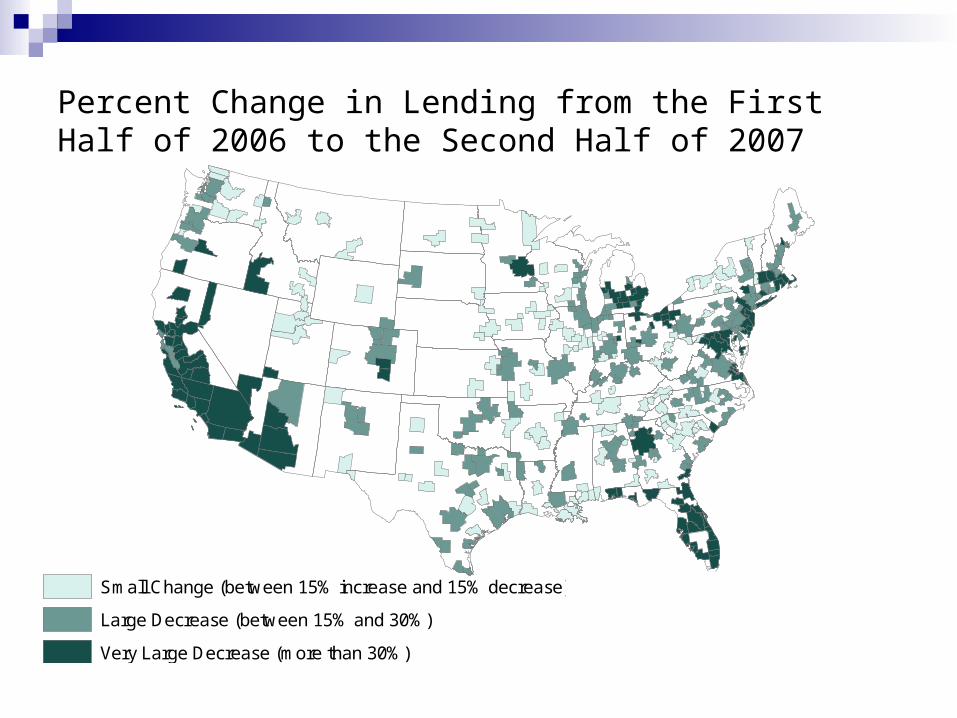
Percent Change in Lending from the First Half of 2006 to the Second Half of 2007
Small Change (between 15% increase and 15% decrease)
Large Decrease (between 15% and 30%)
Very Large Decrease (more than 30%)
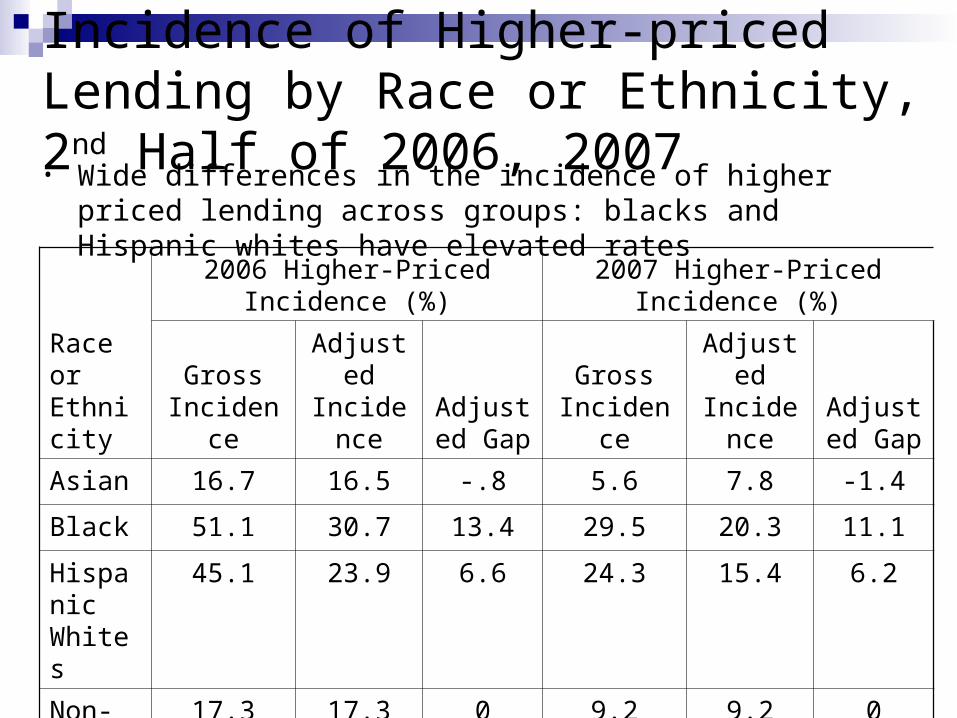
Incidence of Higher-priced Lending by Race or Ethnicity, 2nd Half of 2006, 2007• Wide differences in the incidence of higher priced lending
across groups: blacks and Hispanic whites have elevated rates
Race or Ethnicity
2006 Higher-Priced Incidence (%) 2007 Higher-Priced Incidence (%)
Gross Incidence
Adjusted Incidence
Adjusted Gap
Gross Incidence
Adjusted Incidence
Adjusted Gap
Asian 16.7 16.5 -.8 5.6 7.8 -1.4
Black 51.1 30.7 13.4 29.5 20.3 11.1
Hispanic Whites
45.1 23.9 6.6 24.3 15.4 6.2
Non-Hispanic Whites
17.3 17.3 0 9.2 9.2 0

Denial rates by Race and Ethnicity, 2nd Half of 2006, 2007
Wide differences in denial rates: blacks, Hispanics have elevated rates of loan denial
Race or Ethnicity
2006 Higher-Priced Denial Rate (%)
2007 Higher-Priced Denial Rate (%)
Denial rate
Adjusted denial rate
Adjusted denial
rate gapDenial
rate
Adjusted denial rate
Adjusted denial
rate gap
Asian 16.8 14.8 1.7 17.7 15.1 1.9
Black 32.3 21.5 8.4 34.2 22.9 9.7
Hispanic Whites
26.2 17.6 4.5 30.0 19.7 6.5
Non-Hispanic Whites
13.1 13.1 0 13.2 13.2 0
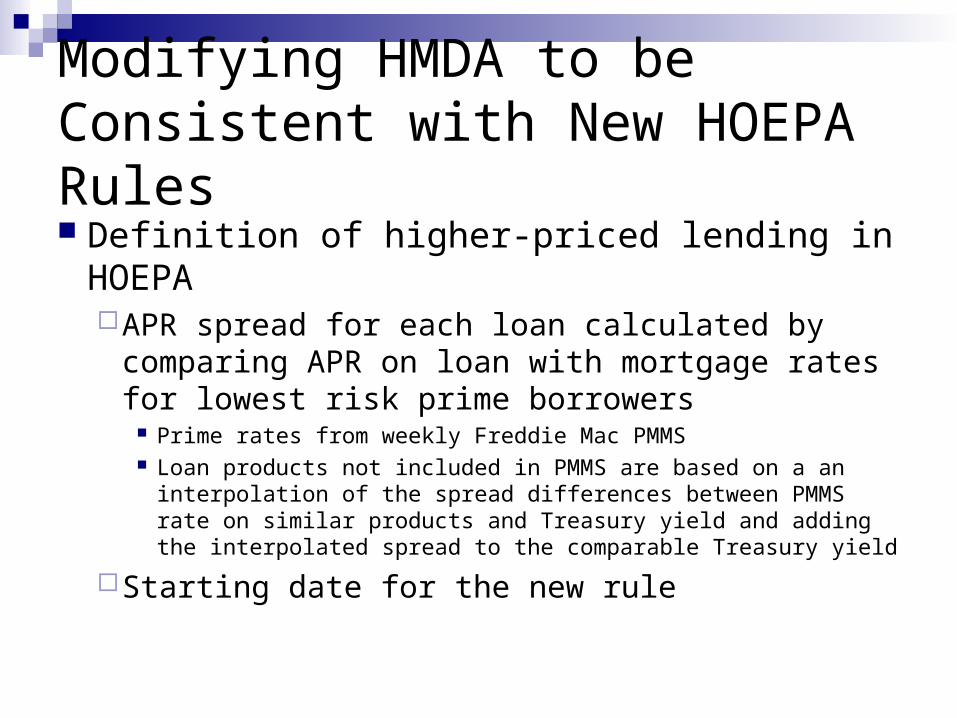
Modifying HMDA to be Consistent with New HOEPA Rules Definition of higher-priced lending in HOEPA
APR spread for each loan calculated by comparing APR on loan with mortgage rates for lowest risk prime borrowers
Prime rates from weekly Freddie Mac PMMS Loan products not included in PMMS are based on a an
interpolation of the spread differences between PMMS rate on similar products and Treasury yield and adding the interpolated spread to the comparable Treasury yield
Starting date for the new rule