Embed Size (px)
DESCRIPTION
H&M Valuation report (2011)
Citation preview

Written by:
Joppe Out 349810
Marcel Du Ry 322596
Ivan Fartunov 348250
Di Piao 350056
Analyst Report:
H&M Hennes & Mauritz AB
9 December 2011
Rotterdam School of Management, Erasmus University
BKM04ACA-11 Financial Analysis
Prof. Dr. Erik Peek
Financial Analysis Report – H&M Hennes & Mauritz AB
2
Contents
Introduction..................................................................................................................................... 3
Strategy Analysis ............................................................................................................................. 3
Accounting Analysis ........................................................................................................................ 5
Financial Analysis .......................................................................................................................... 7
Prospective Analysis ....................................................................................................................... 9
Concluding Remarks ..................................................................................................................... 12
References: .................................................................................................................................... 13
Appendix ....................................................................................................................................... 14
Appendix 1 – H&M five year overview of key figures .............................................................. 14
Appendix 2 – Market share and geographic sales distribution of H&M in 2009 and 2010..... 14
Appendix 3 – Fashion triangle .................................................................................................. 15
Appendix 4– H&M unadjusted standardized financial statements .......................................... 15
Appendix 5 – H&M Reported future rental commitments ........................................................ 17
Appendix 6 – H&M detailed future rental payments schedule ................................................. 18
Appendix 7 - Adjustments to H&M’s financial statements ....................................................... 19
Appendix 8 – Adjusted financial statements H&M ................................................................... 20
Appendix 9 – Adjusted standardized financial statements Inditex ............................................ 23
Appendix 10 – Impact of adjustments on leverage of H&M ..................................................... 25
Appendix 11 – Key financial ratios comparison H&M and Inditex ......................................... 26
Appendix 12 – H&M sales growth drivers ............................................................................... 28
Appendix 13 – H&M sales forecasts ......................................................................................... 28
Appendix 14 – Forecasted condensed Financial Statements .................................................... 29
Appendix 15 – WACC calculations (1) ..................................................................................... 29
Appendix 16 – WACC calculations (2) ..................................................................................... 30
Appendix 17 - Estimates of Value of Equity.............................................................................. 31
Appendix 18 - Estimated of Share Price beyond Terminal Year under two Scenarios ............ 31
Appendix 19 – Sensitivity analysis ............................................................................................ 32

Financial Analysis Report – H&M Hennes & Mauritz AB
3
Introduction
H&M is a one of the leading global fashion retailers. The company started in Sweden more than
60 years ago and is nowadays present in more than 38 countries with over 2200 stores. Despite
its global presence, H&M is relatively concentrated in the more mature Nordic and German
markets where 40% of sales are coming from. In 2010, the company possessed a 0.9% share of
the worldwide market for apparel retail (RSP value)1 (Appendix 2). H&M´s turnover in 2010
was SEK 108,483 million. A five-year overview of the company is presented in Appendix 1.
Strategy analysis
The business concept of H&M centres on providing “fashion and quality at the best price”. The
company offers fashion products to a broad target group consisting of women, men, teenagers
and children. One of H&M´s differentiating factors is its cooperation with famous designers like
Karl Lagerfeld and Viktor & Rolf to come up with fashionable new collections that generate a lot
of attention in the fashion scene. H&M sells its products via retail, catalogue and internet sales
and since 2006 on a franchise basis.
Rather than owning its stores, the company makes use of lease arrangements. The company has
an own design and buying department which creates the collections centrally. Via the concept of
regional grouping – a concept in which products are purchased and distributed to a group of
regional (sales) countries – products are allocated to the sales countries based on observed
demand in each market. H&M buys it goods from about 700 independent suppliers, located in
four different continents.2,3
Since a couple of years, the company makes use of a new format, Collection of Style (COS), a
higher priced concept aiming to attract the ´older´ customer. Also, the company plans to start
internet sales in the USA by the end of 2011/beginning of 2012.4
The global apparel retail market had a RSP value of 1,527 billion USD. 5
Since 2006, it grew at
CAGR of 3.9% with the mature markets (Western Europe and North America) growing by only
0.4% annually. While the global growth is expected to slow down in the next 5 years, emerging
markets are still going to account for most of it.
1 Passport database (2010)
2 JP Morgan (2010)
3 DataMonitor (2011)
4 H&M Hennes & Mauritz AB (2010)
5 Passport database (2010)

Financial Analysis Report – H&M Hennes & Mauritz AB
4
The bargaining power of buyers is low to moderate. Virtually all H&M clients are individual
consumers which gives them very little bargaining power. The low switching costs faced by
customers in the industry and the ever increasing availability of information balance this to a
certain degree, giving consumers some power. Suppliers bargaining power is low due to H&M’s
wide range of suppliers. Furthermore, the switching costs for the company are rather low.
The low capital requirements of the industry and the lack of switching costs for the customers
make the market lucrative for new entrants. H&M’s large network provides the company with a
wide base for improving efficiency and building brand equity, which decreases the threat of new
entrants. An industry-wide increase in advertising expenses indicates intensifying rivalry among
existing firms. Currently, the only feasible substitute of retail clothing is the online sales
medium. H&M, as well as other retailers, are progressively moving into that space, which we
consider of being solely part of the evolving market rather than a real substitute.
Recent market developments and future trends
Internet – apparel retail will continue to be strongly impacted by the internet. Going hand in hand
with online retail, the use of multi-channel platforms represents an important trend. Internet and
multi-channel sales are expected to account for most of the future growth. Because of that, it is
unlikely that there will be significant a increase of retail floor space in the mature markets in the
near future.
Internationalization – thanks to the globalization, fashion around the world becomes more
homogeneous than ever making international expansion easier. The major growth potential of the
global market is centred on developing markets. Particularly interesting are the cases of Russia
and China growing 10.2% and 8.8% respectively (for the period 2010-2013)6. H&M is present in
both of the fore mentioned markets but in Russia, it lags significantly behind Inditex which we
identified as key competitor due to the similar size and internationalization profile.
Competitive strategy
Whereas H&M started with a cost-leadership strategy, the company seems to more and more
undergo a transition towards differentiation (an example of this is the recent introduction of the
higher-end fashion line COS). In terms of brand portfolio, H&M has diversified its portfolio in
the last years by acquiring the fashion group FaBric Scandinavian AB in 2008. However,
compared to the multi-brand strategy of Inditex, H&M still seems to rely heavily on its
consolidated brand.
6 JP Morgan (2010)

Financial Analysis Report – H&M Hennes & Mauritz AB
5
H&M’s target is to increase number of shops by 10-15% annually while maintaining profitability
levels. The principle for expansion followed by the company is that every store shall have the
best commercial location.7 Although H&M has expanded globally, its most vital market is still
Europe. For its 2011 expansion strategy, the company has identified China, the USA and the UK
as its most important markets. The management recognizes the increasing importance of the
Asia-Pacific region (entered in 2007 for the first time) while 2011, in addition to substantial
investments in China, the company entered Singapore. In 2012, new franchise entries are
planned for Indonesia and Thailand, which would be the first franchise outside the Middle East.
Another key development expected in 2012 is the launch of the online shop in the USA – the
largest online shopping market.8
One of H&M’s strategic advantages is the short lead-times it maintains through a flexible-value
chain sourced from over 700 suppliers mainly in Turkey and China. It distinguishes the company
from its highly vertically-integrated main competitor Inditex. H&M’s higher speed to market is
very important for the fashion triangle format (Appendix 3) that the company has adopted.
Accounting Analysis
In order to identify the key accounting policies, we investigated the company’s financial
statements and its respective notes. With respect to its business model, our analysis retrieved that
H&M’s main accounting policies are most closely related to inventories, non-current tangible
assets, and leased assets.
Key accounting policies
On basis of the current IFRS, management has certain freedom to influence reported inventories.
Classically, an overstatement of this working capital position could increase gross profits as well
as net income. For H&M, the recent increase in the company’s inventories raises concerns
among analysts. Because of that, management might have rather an incentive to understate this
post. However, this is offset by the fact that understatement would be associated with higher
depreciation and a decrease in profitability. Since we consider that this lies out of the scope of
management’s objectives, we believe that there is no motivation for misreporting inventories.
The non-current tangible assets of the company are subject to depreciation. Due to IFRS, the
determination of the useful life of an asset (and consequently the respective depreciation
7 JP Morgan (2010)
8 H&M Hennes & Mauritz AB (2011)

Financial Analysis Report – H&M Hennes & Mauritz AB
6
rate/method) allows for a certain range of subjective estimation. In the case of H&M, we found
the reported depreciation expenses as percentage of non-current tangible assets to be in line with
the same measure of its identified closest industry peer Inditex. Hence, we consider that no
adjustments concerning the depreciation are necessary.
Leased assets can be either classified as operational leases or financial leases. Though the IFRS
does provide guidelines with regard to this classification, they still incorporate a certain leeway
of possible assumptions that management can make to distinguish between these two lease
forms. H&M treats the report of its premise usage as rental agreements which in turn might be
regarded as operational lease expenses. By doing so, the company significantly understates its
liabilities (Appendix 4). We decided to adjust for that by transforming the respective rental
agreements for the years 2009 and 2010 into financial lease positions.9
Adjusting for financial lease position
With respect to the asset distribution of H&M in 2010, total tangible fixed assets amounted to
15,469 SEKm or approximately 26.1% of total assets. The striking point is that rental costs for
premises (analogically to operating lease contracts for buildings and land) in 2010 amounted to
12,891 SEKm (plus 229 SEKm per year classified as “Related Party Disclosure”)10
. These assets
are of major economic importance for H&M but entirely omitted in the balance sheet. It is not
obvious why management chose to omit this position and there are no indicators given whether
the present accounting data appropriately reflects the business reality of H&M or whether they
underlie strategic accounting choices or rigid accounting rules. A hypothetical explanation could
be that management attempts to understate leverage since lease assets are booked against lease
liabilities. This significant impact on H&M´s leverage (from virtually no leverage to
approximately 50% - Appendix 10) may affect the company’s credit ratings which in turn could
lead to an increase in its cost of debt. The financial analysis in section three provides a deeper
insight into possible motives for management to keep this material position off-balance.
Apart from strategic motives or overly rigid account rules, a transformation of these rental
agreements into asset positions may increase comparability with industry peers who (e.g.
Inditex) opted for its own specific reporting methods and an alternative portfolio of lease
arrangements. Certainly, these adjustments would have also to be made for peer statements in
order to make a meaningful comparison.
9 H&M Hennes & Mauritz AB (2010)
10 H&M classifies in its financial statements additional leased premises directly obtained from the Persson family.
Members of this family include the founder of H&M, the current CEO, and the current director of the supervisory
board. Therefore, we regard these positions as assets of H&M.

Financial Analysis Report – H&M Hennes & Mauritz AB
7
H&M’s distribution of expenses for premises for the years 2008 to 2010 is presented in
Appendix 5. H&M additionally incurs variable sales-based rents. We omitted these accrued
positions since respective sales are not reported so that a meaningful distribution is not possible.
We distributed the related party disclosure expenses equally weighted over all years, assuming
that H&M will continue to utilize them (these stores are situated in profitable key locations).
Since H&M virtually does not use debt financing at all, we determined the company-specific
discount rate of 2.7% through annual interest expenses over provisions for pensions (these
represent the only non-current interest-bearing position of H&M). Although this interest rate
might at first appear to be low, the fact that the firm has no debt could be interpreted as a signal
of superior creditworthiness. The tax rate of 25.3% was given directly within the company’s
financial statements. A detailed outline of the adjustments for the years 2009 and 2010 as well as
the respective condensed financial statements can be retrieved from Appendices 6 to 9.
Financial Analysis
Profitablity
A ratio analysis and a cash flow analysis were used to assess the performance of H&M and
efficiency of the company’s operations and investment policies. For this reason, a time-series
comparison of 2009 and 2010 data of the most important ratios together with a cross-sectional
comparison with its closest peer Inditex has been performed (Appendix 11).
We employ return on equity (ROE) as an indicator to evaluate H&M’s overall profitability, since
it captures how well managers are employing the funds invested by the shareholders to generate
returns.11
The alternative decomposition of ROE is preferred over the traditional one because it
provides a better identification of the key profitability drivers by separating operating and
financing activities.
Overall ROE for H&M increased from 44.5% (2009) to 46.5% (2010) with an increase in
operating ROA as main driver. The identified closest peer Inditex achieved the same growth
reaching ROE of 32.9% in 2010 and although Inditex achieved a higher operating ROA, their
business suffered from negative financial leverage gains which offset its operating advantage.
According to Bloomberg data, the non-adjusted industry average ROE is 17.8% (excluding
outliers) and the non-adjusted industry median is 15.4%. This shows that both companies
significantly outperform the industry which is an indication of a superior business model.
11
Palepu, Healy, Peek, (2010)

Financial Analysis Report – H&M Hennes & Mauritz AB
8
Looking at the financing policy on ROE, a small decrease in leverage has decreased the tax
benefits of debt which in turn is partially offset by an increasing spread due to higher operational
profitability.
Operating Management
A slight increase in the NOPAT margin for H&M was observed in 2010. Inditex is still
underperforming with regard to H&M but at the same time diminishing the gap through a higher
growth. The EBITDA margins exhibit the same trends.
To get a better understanding of the performance of H&M, we looked at the common-sized
income statements. The improvement in NOPAT was driven mainly by a decrease in cost of
materials and personnel expense. The former can be explained by an increase in retail space even
in mature markets which H&M could penetrate through lower freight costs and the exploitation
of spare capacities. A possible reason for the decrease in personnel expenses is the growing share
of online sales while Inditex benefitted from a larger decrease in procurement costs due to a
superior cost control policy. Tax and interest expenses for H&M incurred only marginal changes
which indicate relatively stable financing conditions.
Investment Management
A difference between ROA and operating ROA (far larger operating ROA) is driven by asset
turnover vs. net operating asset turnover. Because of the nature of the apparel retail business, the
company has both, large cash holdings and significant current liabilities (mostly accounts
payable and accrued expenses and other classified income).
Net operating asset turnover for H&M has increased slightly (1.47) which indicates the higher
efficient usage of company’s assets. Here, main competitor Inditex showed a clear advantage in
this measure (2.02). Furthermore, its improvement was larger in comparison to H&M.
In 2010, H&M experienced a decrease in both, trade receivables turnover and inventories
turnover since they seemingly managed to roll these over to the suppliers and evenly decreased
their trade payables turnover from 10.61 to 10.14. Nevertheless, the fundamental driver of the
large increase in operating working capital turnover is the tax policy adopted by the company
(Increase of current tax liabilities by 1865 million SEK in 2010). Operating working capital
turnover is negative for Inditex due to significantly lower payable trade turnover.
We detected a slight increase in efficiency of non-current assets (almost entirely consisting of
PP&E) usage due to the fact that online sales become more prevalent in H&M´s business model.
For Inditex the same trend can be observed whose improvement is again slightly larger.

Financial Analysis Report – H&M Hennes & Mauritz AB
9
Financial Management
H&M´s liquidity ratios deteriorated slightly in 2010. However, the company maintains a
comfortable buffer against short-term liquidity risk and outperforms its main competitor Inditex
in these fields. In 2010, H&M decreased its financial leverage (post adjustments) by 10% to
55%. Prior to our implemented financial lease adjustment, the company had virtually no leverage
(Debt-to-capital 0.4% in 2010) while after accounting for the rental agreements as financial lease
liabilities, this dramatically changed (Debt-to-capital 44.5% in 2010). In terms of interest
coverage ratios, H&M and its competitor Inditex are both situated in an obviously safe position.
Sustainable growth rate
To assess the dividend policy implemented by H&M we looked at the sustainable growth rate of
the company. A decrease in the dividend payout rate paired with the already mentioned increase
in ROE led to a boost in the sustainable growth rate in 2010 to 18.7% which exceeds the 12%
CAGR (sales) of H&M over the periods 2006 – 2010. The non-adjusted sustainable growth rate
of the company is 12.3% which is in line with the actual achieved performance. This discrepancy
might represent another rationale behind the omission of the rental premises from balance sheet
items: investors might demand a higher dividend payout. Due to a lower payout rate, Inditex
achieved a higher sustainable growth rate despite its lower ROE.
Cash flow analysis
In 2010, the cash flows from operating activities for H&M grew by 21% signifying a healthy
operating state of the company. This gain was partially offset by higher investments in short-
term investments and increased dividends (despite decrease in payout ratio). As a final outcome,
the total cash-flow for the year improved compared to 2009 but remained negative.
Prospective Analysis
General outlook
H&M shows a strong historical firm performance. Being the current world leader in specialty
retail with strong brand recognition and high growth expectations due to international expansion,
H&M managed to establish a solid foundation of producing continuously abnormal returns. Its
upscale position in the market has proven its firm stand so that future premium prices could
maintain their beneficial influence on profit margins. Going hand in hand with that, the profitable
expectations of the online sale segment might contribute to the increasingly efficient usage of the
company’s assets and hence, further strengthen operating profits.

Financial Analysis Report – H&M Hennes & Mauritz AB
10
H&M’s management was able to react swiftly to environmental developments with strong
investments in IT and marketing and a shift in geographical focus towards profitable emerging
markets (mainly Russia, China, Turkey, and Israel). A successful replication of H&M’s business
model in these regions might offset or even outweigh the negative effects on profit margins due
to the aftermath of the crisis within the traditional markets (and segments), Europe and the US.
Possible drawbacks are the high input costs due to the current shock in cotton prices and
monetary risks due to exchange rate fluctuations. Although the shock in cotton prices might tend
to revert back, inflationary input costs could materialize into a long-term effect.
Forecast horizon and terminal value assumptions
We consider a forecast horizon of 5 years as adequate which leads to the assumption that H&M
will finally arrive in 2015 at its steady-state. Although being relatively short, we view this time
frame as reasonable due to the following arguments. H&M has clearly outlined its plans for the
upcoming periods which, amongst others, comprise the foray into the new market segment of
online sales and the increase of its exposure to international markets with focus on emerging
economies. We have incorporated these effects into our growth driver predictions while
expecting that their beneficial influences are going to settle in a relatively short time frame due to
the lack of non-imitability. Since the company has not outlined further expansion plans, we
assume that the status in 2015 will maintain perpetually. It is arguable to state that the omission
of future shocks in profitability, either in favour (e.g. successfully establishing a competitive
position in the underserved high-demand market of plus size apparel in the US) or against H&M
(e.g. negative developments of input prices) is not perfectly precise. However, approaching from
an earnings-model perspective, we consider it as reasonable to stabilize our forecast by
anticipating that these “abnormal” developments may cancel each other out in the long-term (if
not simultaneously, then on an accrued basis). Moreover, we expect H&M´s high brand exposure
in combination with the company´s economies of scale to persist as a solid shield against
competitive forces that will preserve its current leading position on the market. The bottom line
of all these arguments leads to our terminal value assumption: H&M´s abnormal earnings growth
will endure while the firm´s growth in sales in the terminal year will gradually settle upon the
average industry growth of retail apparel (with current competitive earnings level).
Prediction of condensed financial statements
To predict the condensed financial statements for the years 2011 – 2015 (Appendix 14), we have
forecasted the sales growth rate for these years and related all other numbers to sales. H&M
acknowledged in their annual report that they plan to increase the number of shops per year with
Financial Analysis Report – H&M Hennes & Mauritz AB
11
10-15%. Therefore, we have identified as sales driver the yearly growth rate in shops (based on
observed yearly growth rates in shops between first nine month 2011 and 2010). The sales-per-
shop ratio has declined slightly over the last two years (Appendix 12). However, since H&M
reports internet sales under its sales per shop, we expect that the observed decline in physical
sales-per-shop is partly being offset by an increase in the online sales-per-shop. As net effect, we
assume that yearly sales growth is driven by the combination of the increase in the yearly growth
rate in shops (per region) and the decrease in sales-per-shop (per region). Using the assumption
that sales growth driven by new openings contributes on average half a year of sales, we expect
that the yearly sales growth rate will increase from 0.4% in 2011 to 3.1% in 2013 (Appendix 13).
We expect that the terminal value year assumptions holds and predict that the sales growth rate
will slightly decline to the average retail apparel industry growth rate of 2.2% in 2014/15.12
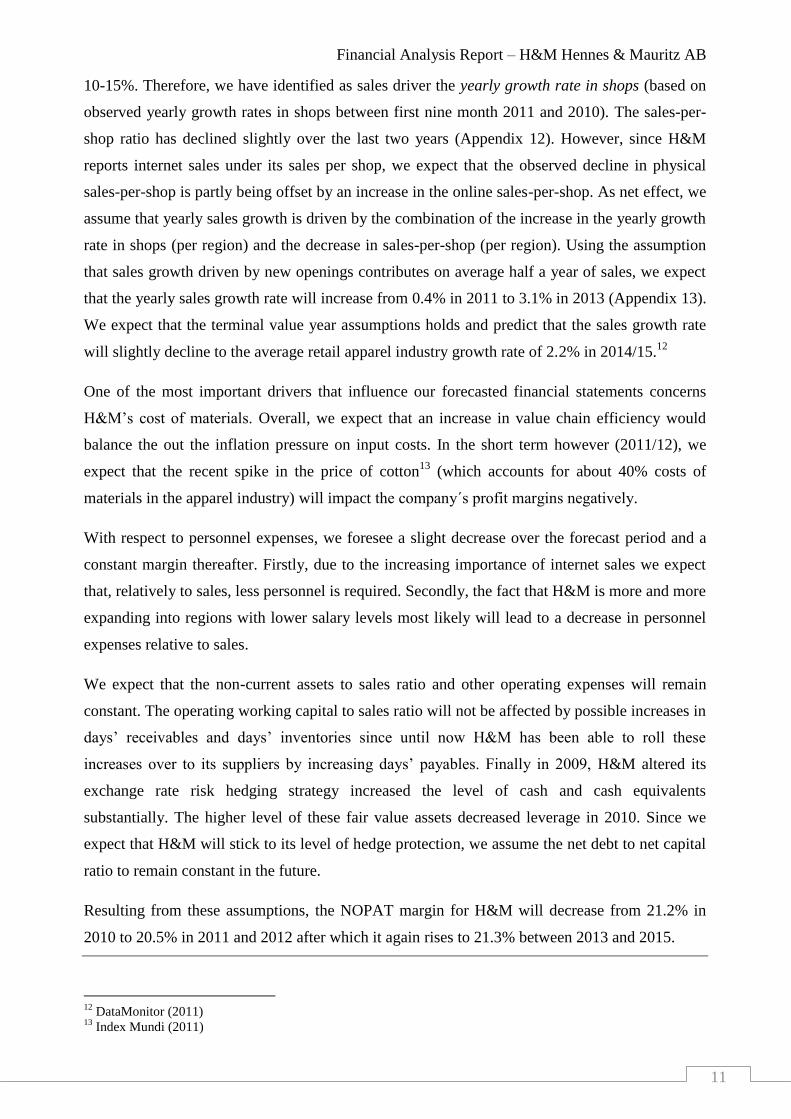
One of the most important drivers that influence our forecasted financial statements concerns
H&M’s cost of materials. Overall, we expect that an increase in value chain efficiency would
balance the out the inflation pressure on input costs. In the short term however (2011/12), we
expect that the recent spike in the price of cotton13
(which accounts for about 40% costs of
materials in the apparel industry) will impact the company´s profit margins negatively.
With respect to personnel expenses, we foresee a slight decrease over the forecast period and a
constant margin thereafter. Firstly, due to the increasing importance of internet sales we expect
that, relatively to sales, less personnel is required. Secondly, the fact that H&M is more and more
expanding into regions with lower salary levels most likely will lead to a decrease in personnel
expenses relative to sales.
We expect that the non-current assets to sales ratio and other operating expenses will remain
constant. The operating working capital to sales ratio will not be affected by possible increases in
days’ receivables and days’ inventories since until now H&M has been able to roll these
increases over to its suppliers by increasing days’ payables. Finally in 2009, H&M altered its
exchange rate risk hedging strategy increased the level of cash and cash equivalents
substantially. The higher level of these fair value assets decreased leverage in 2010. Since we
expect that H&M will stick to its level of hedge protection, we assume the net debt to net capital
ratio to remain constant in the future.
Resulting from these assumptions, the NOPAT margin for H&M will decrease from 21.2% in
2010 to 20.5% in 2011 and 2012 after which it again rises to 21.3% between 2013 and 2015.
12
DataMonitor (2011) 13
Index Mundi (2011)

Financial Analysis Report – H&M Hennes & Mauritz AB
12
Calculation of WACC
Using the procedure described in (Appendix 15), we obtained an equity beta of 0.34 for H&M.
Our estimate seemed unreasonably low compared to the betas reported by FT (0.55), Reuters
(0.56) and Thomson One Banker (0.53) so that we have chosen to use an equity beta equal to the
average of the equity beta’s from FT, Reuters and Thomson One Banker which is 0.55.
For the risk-free rate, we employ a value of 2.78% based on the average yield on 10-year
Swedish government bonds between April 2010 and October 2011. As a risk premium, we have
taken the worldwide historical average of 5.5%.14
Using those values, the traditional CAPM
equation yields a cost of equity of 5.79%. For the cost of debt we resorted to the 2.7% mentioned
earlier in the report. Using the cost of debt and equity, the net debt and market value of equity
levels, we obtain a WACC of 5.48% (Appendix 16).
Estimation of H&M´s equity value
To estimate the equity value, we have applied three different valuation models: the discounted
cash flow model, the abnormal earnings model and the abnormal earnings growth model. We
assume the sustainable sales growth rate after the terminal year to remain at 2.2% (in real terms)
with a discount rate equal to the firm´s cost of equity of 5.79% which means that we expect
H&M to persistently generate competitive abnormal earnings. Looking at the outcomes of the
three models, we see that all models arrive at the same equity value of 588,258.55 SEK m
(Appendix 17, Appendix 18).
Concluding remarks
On basis of all three valuation models, we determine an equity value of SEK 355.43 per share
which represents an upward potential of 51.6% (based on the price on 30 November 2010).
The valuation presented in this report is based on a series of assumptions that are not to be
considered 100% accurate. The main reason for the deviation of our estimate from the market is
in our view an underestimation of the required rate of return (we consider it to be equal to the
cost of equity of H&M). The sensitivity analysis (Appendix 19) indicates that in the vicinity of a
reasonable discount rate of 8%15
, our valuation would be in agreement with the market price
levels during the last year. Another explanation could be an overestimation of the terminal
growth rate that we implied in our model.
14
Palepu, K.,Healy, P., Peek, E., (2010) 15
JP Morgan (2011)

Financial Analysis Report – H&M Hennes & Mauritz AB
13
References:
DataMonitor (2011), Global Textiles, Apparel & Luxury Goods
Euromonitor (2011), Global Industry Overview: Apparel, Retrieved from:
http://www.youtube.com/watch?v=IDyjBEAGybE, Accesed : 21.11.2011
H&M Hennes & Mauritz AB (2011), H&M nine month report 2011
H&M Hennes & Mauritz AB (2010), Annual Rpeort 2010
H&M Hennes & Mauritz AB (2009), Annual Rpeort 2009
H&M Hennes & Mauritz AB (2008), Annual Rpeort 2008
JP Morgan (2011), General Retail H2 outlook 28 September 2011
JP Morgan (2010), European Apparel 28 October 2010
IndexMundi (2011), Retrieved from: http://www.indexmundi.com/commodities/,
Accesed : 18.11.2011
Inditex Group (2010), Annual Report 2010
Inditex Group (2009), Annual Report 2009
Passport database (2010), Retrieved from: http://www.portal.euromonitor.com, Accesed :
18.11.2011
Palepu, K.,Healy, P., Peek, E., (2010), Business Analysis and Valuation: IFRS Edition,
Second edition, South-Western Cengage Learning

Financial Analysis Report – H&M Hennes & Mauritz AB
14
Appendix
Appendix 1 – H&M five year overview of key figures
2010 2009 2008 2007 2006
Sales (SEK m) 108,483 101,393 88,532 78,346 68,400
EBITDA (SEK m) 27,720 24,474 22,340 20,196 16,922
ROE % 44.1% 42.2% 44.3% 45.4% 40.2%
Employees ('000) 59,440 53,476 53,430 47,029 40,855
Number of shops 2,206 1,988 1,738 1,522 1,345
Source: H&M Hennes & Mauritz AB Annual Report (2010)
Appendix 2 – Market share and geographic sales distribution of H&M in 2009 and 2010
Figure 1: Market share of the five biggest Apparel retailers
Source: Passport database (2010)
Figure 2: H&M Sales by geographic region
Source: H&M Hennes & Mauritz AB Annual Reports (2010, 2009)

Financial Analysis Report – H&M Hennes & Mauritz AB
15
Appendix 3 – Fashion triangle
Source: JP Morgan European Apparel 28 October 2010
Appendix 4 – H&M unadjusted standardized financial statements
Income statement (SEK m) 2010 2009
Sales 108,483.0 101,393.0
Cost of materials (nature) (65,088.4) (62,180.1)
Personnel expense (nature) (14,216.0) (13,576.0)
Depreciation and amortization (nature) (3,611.0) (3,019.0)
Other operating income, net of other operating expense (908.6) (973.9)
Operating profit 24,659.0 21,644.0
Investment income 0.0 0.0
Other income, net of other expense 0.0 0.0
Net interest expense (income) 349.0 459.0
Profit before taxes 25,008.0 22,103.0
Tax expense (6,327.0) (5,719.0)
Profit after taxes 18,681.0 16,384.0
Minority interest 0.0 0.0
Net profit 18,681.0 16,384.0

Financial Analysis Report – H&M Hennes & Mauritz AB
16
Balance Sheet (SEK m) 2010 2009
ASSETS
Non-Current Tangible Assets 15,469.0 14,811.0
Non-Current Intangible Assets 1,198.0 1,674.0
Deferred Tax Asset 1,065.0 1,246.0
Other Non-Current Assets 518.0 551.0
Total non-current assets 18,250.0 18,282.0
Trade Receivables 4,587.0 3,816.0
Inventories 11,487.0 10,240.0
Other Current Assets 8,167.0 3,001.0
Cash and Marketable Securities 16,691.0 19,024.0
Total current assets 40,932.0 36,081.0
TOTAL ASSETS 59,182.0 54,363.0
LIABILITIES AND SHAREHOLDERS’ EQUITY
Preference Shares 0.0 0.0
Ordinary Shareholders’ equity 44,172.0 40,613.0
Total shareholders’ equity 44,172.0 40,613.0
Minority Interest 0.0 0.0
Non-Current Debt 257.0 622.0
Deferred Tax Liability 906.0 2,038.0
Other Non-Current Liabilities (non interest bearing) 0.0 0.0
Total non-current liabilities 1,163.0 2,660.0
Current Debt 0.0 0.0
Trade Payables 3,965.0 3,667.0
Other Current Liabilities 9,882.0 7,423.0
Total current liabilities 13,847.0 11,090.0
TOTAL EQUITY AND LIABILITIES 59,182.0 54,363.0
Financial Analysis Report – H&M Hennes & Mauritz AB
17
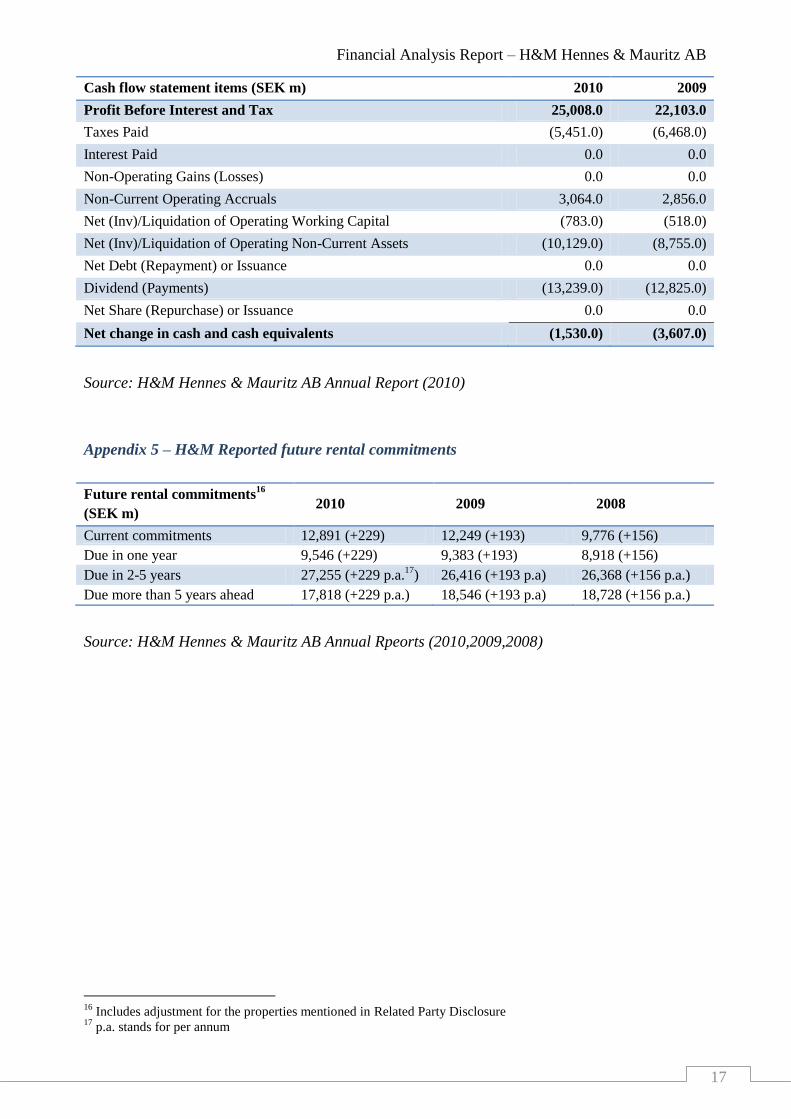
Cash flow statement items (SEK m) 2010 2009
Profit Before Interest and Tax 25,008.0 22,103.0
Taxes Paid (5,451.0) (6,468.0)
Interest Paid 0.0 0.0
Non-Operating Gains (Losses) 0.0 0.0
Non-Current Operating Accruals 3,064.0 2,856.0
Net (Inv)/Liquidation of Operating Working Capital (783.0) (518.0)
Net (Inv)/Liquidation of Operating Non-Current Assets (10,129.0) (8,755.0)
Net Debt (Repayment) or Issuance 0.0 0.0
Dividend (Payments) (13,239.0) (12,825.0)
Net Share (Repurchase) or Issuance 0.0 0.0
Net change in cash and cash equivalents (1,530.0) (3,607.0)
Source: H&M Hennes & Mauritz AB Annual Report (2010)
Appendix 5 – H&M Reported future rental commitments
Future rental commitments16
(SEK m) 2010 2009 2008
Current commitments 12,891 (+229) 12,249 (+193) 9,776 (+156)
Due in one year 9,546 (+229) 9,383 (+193) 8,918 (+156)
Due in 2-5 years 27,255 (+229 p.a.17
) 26,416 (+193 p.a) 26,368 (+156 p.a.)
Due more than 5 years ahead 17,818 (+229 p.a.) 18,546 (+193 p.a) 18,728 (+156 p.a.)
Source: H&M Hennes & Mauritz AB Annual Rpeorts (2010,2009,2008)
16
Includes adjustment for the properties mentioned in Related Party Disclosure 17
p.a. stands for per annum

Financial Analysis Report – H&M Hennes & Mauritz AB
18
Appendix 6 – H&M detailed future rental payments schedule18
Rental Agreements 2010 (SEK m) Year Payment due
Lease/Rental expense 2010 2010 13,120.0
"Less than one year" 2011 9,775.0
"2-5 years'' 2012 7,042.8
"2-5 years'' 2013 7,042.8
"2-5 years'' 2014 7,042.8
"2-5 years'' 2015 7,042.8
'More than 5 years'' 2016 7,042.8
'More than 5 years'' 2017 7,042.8
'More than 5 years'' 2018 4,021.5
NPV of the leased asset 50,288.7
Rental Agreements 2009 (SEK m) Year Payment due
Lease/Rental expense 2009 2009 12,442.0
"Less than one year" 2010 9,576.0
"2-5 years'' 2011 6,797.0
"2-5 years'' 2012 6,797.0
"2-5 years'' 2013 6,797.0
"2-5 years'' 2014 6,797.0
'More than 5 years'' 2015 6,797.0
'More than 5 years'' 2016 6,797.0
'More than 5 years'' 2017 5,145.0
NPV of the leased asset 49,693.5
Rental Agreements 2008 (SEK m) Year Payment due
Lease/Rental expense 2008 2008 9,932.0
"Less than one year" 2009 9,074.0
"2-5 years'' 2010 6,748.0
"2-5 years'' 2011 6,748.0
"2-5 years'' 2012 6,748.0
"2-5 years'' 2013 6,748.0
'More than 5 years'' 2014 6,748.0
'More than 5 years'' 2015 6,748.0
'More than 5 years'' 2016 5,388.0
NPV of the leased asset 49,140.0
Source: Own Estimates
18
All numbers include Related Party Disclosures
Financial Analysis Report – H&M Hennes & Mauritz AB
19
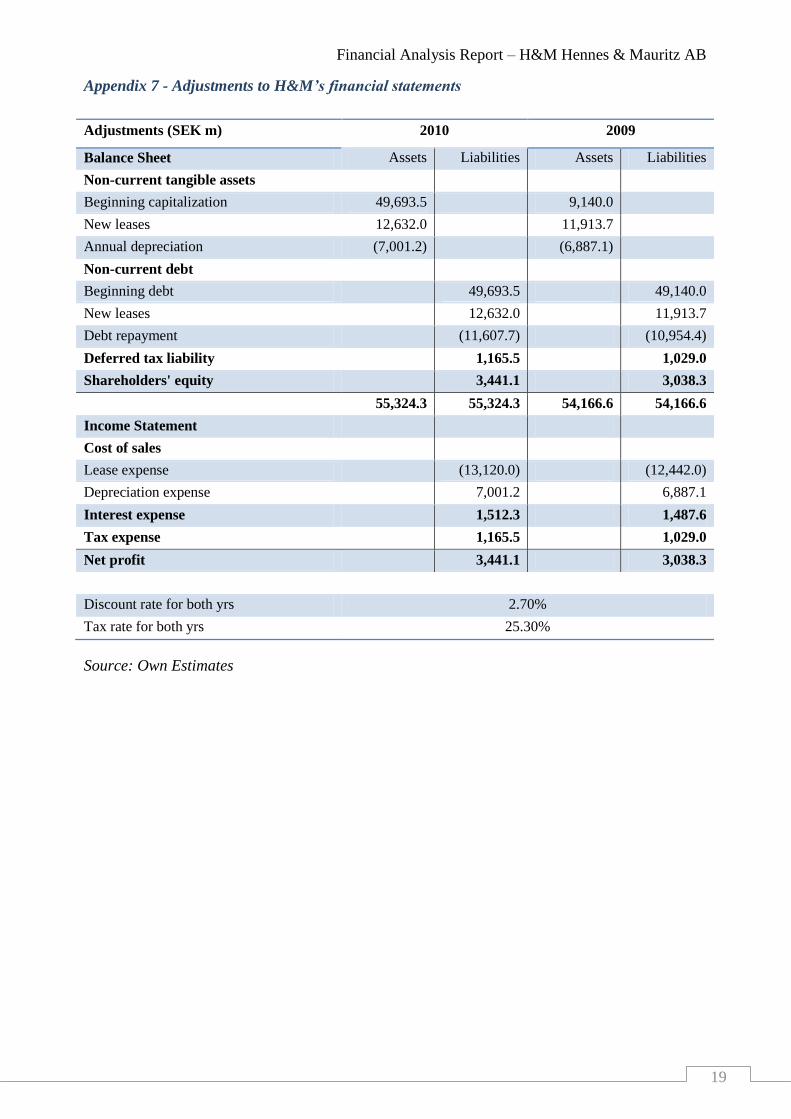
Appendix 7 - Adjustments to H&M’s financial statements
Adjustments (SEK m) 2010 2009
Balance Sheet Assets Liabilities Assets Liabilities
Non-current tangible assets
Beginning capitalization 49,693.5 9,140.0
New leases 12,632.0 11,913.7
Annual depreciation (7,001.2) (6,887.1)
Non-current debt
Beginning debt
49,693.5 49,140.0
New leases
12,632.0 11,913.7
Debt repayment
(11,607.7) (10,954.4)
Deferred tax liability
1,165.5 1,029.0
Shareholders' equity
3,441.1 3,038.3
55,324.3 55,324.3 54,166.6 54,166.6
Income Statement
Cost of sales
Lease expense
(13,120.0) (12,442.0)
Depreciation expense
7,001.2 6,887.1
Interest expense
1,512.3 1,487.6
Tax expense
1,165.5 1,029.0
Net profit
3,441.1 3,038.3
Discount rate for both yrs 2.70%
Tax rate for both yrs 25.30%
Source: Own Estimates
Financial Analysis Report – H&M Hennes & Mauritz AB
20
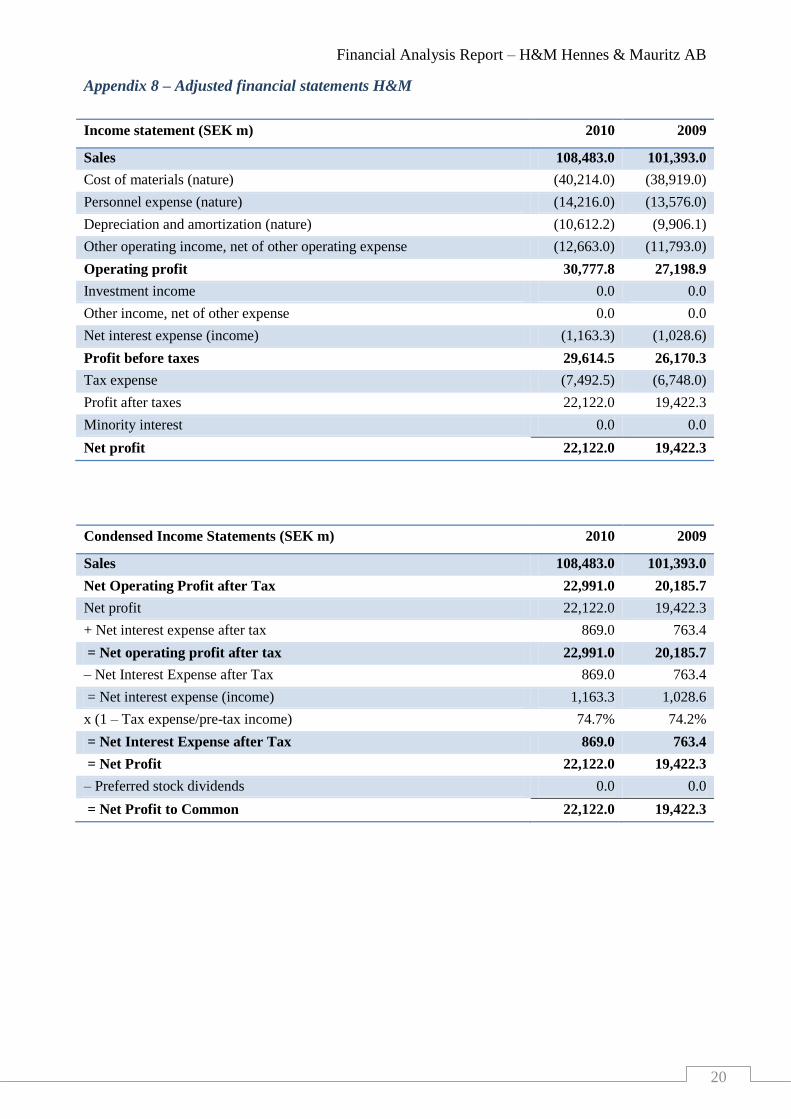
Appendix 8 – Adjusted financial statements H&M
Income statement (SEK m) 2010 2009
Sales 108,483.0 101,393.0
Cost of materials (nature) (40,214.0) (38,919.0)
Personnel expense (nature) (14,216.0) (13,576.0)
Depreciation and amortization (nature) (10,612.2) (9,906.1)
Other operating income, net of other operating expense (12,663.0) (11,793.0)
Operating profit 30,777.8 27,198.9
Investment income 0.0 0.0
Other income, net of other expense 0.0 0.0
Net interest expense (income) (1,163.3) (1,028.6)
Profit before taxes 29,614.5 26,170.3
Tax expense (7,492.5) (6,748.0)
Profit after taxes 22,122.0 19,422.3
Minority interest 0.0 0.0
Net profit 22,122.0 19,422.3
Condensed Income Statements (SEK m) 2010 2009
Sales 108,483.0 101,393.0
Net Operating Profit after Tax 22,991.0 20,185.7
Net profit 22,122.0 19,422.3
+ Net interest expense after tax 869.0 763.4
= Net operating profit after tax 22,991.0 20,185.7
– Net Interest Expense after Tax 869.0 763.4
= Net interest expense (income) 1,163.3 1,028.6
x (1 – Tax expense/pre-tax income) 74.7% 74.2%
= Net Interest Expense after Tax 869.0 763.4
= Net Profit 22,122.0 19,422.3
– Preferred stock dividends 0.0 0.0
= Net Profit to Common 22,122.0 19,422.3

Financial Analysis Report – H&M Hennes & Mauritz AB
21
Condensed Balance Sheet (SEK m) 2010 2009
ASSETS
Non-Current Tangible Assets 70,739.3 68,977.6
Non-Current Intangible Assets 1,198.0 1,674.0
Deferred Tax Asset 1,065.0 1,246.0
Other Non-Current Assets 518.0 551.0
Total non-current assets 73,520.3 72,448.6
Trade Receivables 4,587.0 3,816.0
Inventories 11,487.0 10,240.0
Other Current Assets 0.0 0.0
Cash and Marketable Securities 24,858.0 22,025.0
Total current assets 40,932.0 36,081.0
TOTAL ASSETS 114,452.3 108,529.6
LIABILITIES AND SHAREHOLDERS’ EQUITY
Preference Shares 0.0 0.0
Ordinary Shareholders’ equity 47,613.1 43,651.2
Total shareholders’ equity 47,613.1 43,651.2
Minority Interest 0.0 0.0
Non-Current Debt 50,920.7 50,353.3
Deferred Tax Liability 2,071.5 3,067.0
Other Non-Current Liabilities (non interest bearing) 0.0 368.0
Total non-current liabilities 52,992.2 53,788.3
Current Debt 0.0 0.0
Trade Payables 3,965.0 3,667.0
Other Current Liabilities 9,882.0 7,423.0
Total current liabilities 13,847.0 11,090.0
TOTAL EQUITY AND LIABILITIES 114,452.3 108,529.6

Financial Analysis Report – H&M Hennes & Mauritz AB
22
Ending Net Working Capital (SEK m) 2010 2009
Trade receivables 4,587.0 3,816.0
+ Inventories 11,487.0 10,240.0
+ Other current assets 0.0 0.0
– Trade payables 3,965.0 3,667.0
– Other current liabilities 9,882.0 7,423.0
= Ending Net Working Capital 2,227.0 2,966.0
+ Ending Net Non-Current Assets
Non-current tangible assets 70,739.3 68,977.6
+ Non-current intangible assets 1,198.0 1,674.0
+ Other non-current assets 518.0 551.0
– Minority interest 0.0 0.0
– Deferred taxes 1,006.5 1,821.0
– Other non-current liabilities (non-interest- bearing) 0.0 368.0
= Ending Net Non-Current Assets 71,448.8 69,013.6
= Total Assets 73,675.8 71,979.6
Ending Net Debt
Current debt 0.0 0.0
+ Non-current debt 50,920.7 50,353.3
– Cash 24,858.0 22,025.0
= Ending Net Debt 26,062.7 28,328.3
+ Ending Preference Shares 0.0 0.0
+ Ending Shareholders’ Equity 47,613.1 43,651.2
= Total Net Capital 73,675.8 71,979.5
Source: Own Estimates

Financial Analysis Report – H&M Hennes & Mauritz AB
23
Appendix 9 – Adjusted standardized financial statements Inditex
Income statement (EUR '000) 2010 2009
Sales 12,526,595.0 11,083,514.0
Cost of materials (nature) (5,104,573.0) (4,755,505.0)
Personnel expense (nature) (2,009,429.0) (1,791,632.0)
Depreciation and amortization (nature) (1,084,553.1) (1,031,386.4)
Other operating income, net of other operating expense (1,174,310.0) (1,028,156.0)
Operating profit 3,153,729.9 2,476,834.6
Investment income 13,651.0 4,842.0
Other income, net of other expense 0.0 0.0
Net interest expense (income) (53,782.0) (68,258.6)
Profit before taxes 3,113,598.8 2,413,417.9
Tax expense (817,909.2) (614,407.4)
Profit after taxes 2,295,689.7 1,799,010.6
Minority interest (9,451.0) (7,783.0)
Net profit 2,286,238.7 1,791,227.6
Condensed Income Statements (EUR '000) 2010 2009
Sales 12,526,595.0 11,083,514.0
Net Operating Profit after Tax 2,325,892.8 1,842,108.9
Net profit 2,286,238.7 1,791,227.6
+ Net interest expense after tax 39,654.1 50,881.4
= Net operating profit after tax 2,325,892.8 1,842,108.9
– Net Interest Expense after Tax 39,654.1 50,881.4
= Net interest expense (income) 53,782.0 68,258.6
x (1 – Tax expense/pre-tax income) 73.7% 74.5%
= Net Interest Expense after Tax 39,654.1 50,881.4
= Net Profit 2,286,238.7 1,791,227.6
– Preferred stock dividends 0.0 0.0
= Net Profit to Common 2,286,238.7 1,791,227.6

Financial Analysis Report – H&M Hennes & Mauritz AB
24
Condensed Balance Sheet (EUR '000) 2010 2009
ASSETS
Non-Current Tangible Assets 6,719,578.2 6,653,031.9
Non-Current Intangible Assets 704,789.0 678,235.0
Deferred Tax Asset 299,350.0 234,203.0
Other Non-Current Assets 222,346.0 185,669.0
Total non-current assets 7,946,063.2 7,751,138.9
Trade Receivables 481,844.0 421,781.0
Inventories 1,214,623.0 992,570.0
Other Current Assets 72,593.0 109,334.0
Cash and Marketable Securities 3,433,452.0 2,420,110.0
Total current assets 5,202,512.0 3,943,795.0
TOTAL ASSETS 13,148,575.2 11,694,933.9
LIABILITIES AND SHAREHOLDERS’ EQUITY
Preference Shares 0.0 0.0
Ordinary Shareholders’ equity 6,940,592.7 5,806,039.6
Total shareholders’ equity 6,940,592.7 5,806,039.6
Minority Interest 36,984.0 41,380.0
Non-Current Debt 2,691,263.4 2,810,299.0
Deferred Tax Liability 410,252.2 377,266.4
Other Non-Current Liabilities (non interest bearing) 394,575.0 354,989.0
Total non-current liabilities 3,496,090.5 3,542,554.4
Current Debt 2,682.0 35,058.0
Trade Payables 2,458,857.0 2,103,029.0
Other Current Liabilities 213,368.0 166,873.0
Total current liabilities 2,674,907.0 2,304,960.0
TOTAL EQUITY AND LIABILITIES 13,148,575.2 11,694,933.9

Financial Analysis Report – H&M Hennes & Mauritz AB
25
Ending Net Working Capital (EUR '000) 2010 2009
Trade receivables 481,844.0 421,781.0
+ Inventories 1,214,623.0 992,570.0
+ Other current assets 72,593.0 109,334.0
– Trade payables 2,458,857.0 2,103,029.0
– Other current liabilities 213,368.0 166,873.0
= Ending Net Working Capital (903,165.0) (746,217.0)
+ Ending Net Non-Current Assets
Non-current tangible assets 6,719,578.2 6,653,031.9
+ Non-current intangible assets 704,789.0 678,235.0
+ Other non-current assets 222,346.0 185,669.0
– Minority interest 36,984.0 41,380.0
– Deferred taxes 110,902.2 143,063.4
– Other non-current liabilities (non-interest- bearing) 394,575.0 354,989.0
= Ending Net Non-Current Assets 7,104,252.1 6,977,503.5
= Total Assets 6,201,087.1 6,231,286.5
Ending Net Debt
Current debt 2,682.0 35,058.0
+ Non-current debt 2,691,263.4 2,810,299.0
– Cash 3,433,452.0 2,420,110.0
= Ending Net Debt (739,506.6) 425,247.0
+ Ending Preference Shares 0.0 0.0
+ Ending Shareholders’ Equity 6,940,592.7 5,806,039.6
= Total Net Capital 6,201,086.1 6,231,286.5
Source: Own Estimates
Appendix 10 – Impact of adjustments on leverage of H&M
Leverage 2010 2009
Net debt-to-equity ratio prior to adjustments -37.2% -45.3%
Net debt-to-equity ratio after adjustments 54.7% 64.9%
Source: Own Estimates

Financial Analysis Report – H&M Hennes & Mauritz AB
26
Appendix 11 – Key financial ratios comparison H&M and Inditex
Traditional decomposition of ROE H&M Inditex
Year 2010 2009 2010 2009
Net profit margin (ROS) 20.4% 19.2% 18.3% 16.2%
× Asset turnover 0.95 0.93 0.95 0.95
= Return on assets (ROA) 19.3% 17.9% 17.4% 15.3%
× Financial leverage 2.40 2.49 1.89 2.01
= Return on equity (ROE) 46.5% 44.5% 32.9% 30.9%
Alternative decomposition of ROE H&M Inditex
Year 2010 2009 2010 2009
Net operating profit margin 21.2% 19.9% 18.6% 16.6%
× Net operating asset turnover 1.47 1.41 2.02 1.78
= Operating ROA (1) 31.2% 28.0% 37.5% 29.6%
Spread 27.9% 25.3% 42.9% 17.6%
× Net financial leverage 0.55 0.65 -0.11 0.07
= Financial leverage gain (2) 15.3% 16.5% -4.6% 1.3%
ROE = 1 + 2 46.5% 44.5% 32.9% 30.9%
Common-sized income statement H&M Inditex
Year 2010 2009 2010 2009
Sales 100.0% 100.0% 100.0% 100.0%
Cost of materials -37.1% -38.4% -40.7% -42.9%
Personnel expense -13.1% -13.4% -16.0% -16.2%
Depreciation and amortization -9.8% -9.8% -8.7% -9.3%
Other operating expense -11.7% -11.6% -9.4% -9.3%
Net interest expense/income -1.1% -1.0% -0.4% -0.6%
Tax expense -6.9% -6.7% -6.5% -5.5%
Profit from discontinued operations 0.0% 0.0% 0.0% 0.0%
Net profit 20.4% 19.2% 18.3% 16.2%
Key profitability ratios H&M Inditex
Year 2010 2009 2010 2009
EBITDA margin 38.2% 36.6% 33.9% 31.7%
NOPAT margin 21.2% 19.9% 18.6% 16.6%
Net profit margin 20.4% 19.2% 18.3% 16.2%
Asset management ratios H&M Inditex
Year 2010 2009 2010 2009

Financial Analysis Report – H&M Hennes & Mauritz AB
27
Operating working capital/Sales 2.1% 2.9% -7.2% -6.7%
Net non-current assets/Sales 65.9% 68.1% 56.7% 63.0%
PP&E/Sales 65.2% 68.0% 53.6% 60.0%
Operating working capital turnover 48.71 34.19 -13.87 -14.85
Net non-current asset turnover 1.52 1.47 1.76 1.59
PP&E turnover 1.53 1.47 1.86 1.67
Trade receivables turnover 23.65 26.57 26.00 26.28
Days’ receivables 15.2 13.5 13.8 13.7
Inventories turnover 3.50 3.80 4.20 4.79
Days’ inventories 102.8 94.7 85.7 75.1
Trade payables turnover 10.14 10.61 2.08 2.26
Days’ payables 35.5 33.9 173.4 159.2
Debt, coverage and liquidity ratios H&M Inditex
Year 2010 2009 2010 2009
Current ratio 2.96 3.25 1.94 1.71
Quick ratio 2.13 2.33 1.49 1.28
Cash ratio 1.80 1.99 1.28 1.05
Operating cash flow ratio 1.58 1.62 0.96 1.01
Liabilities-to-equity 1.40 1.49 0.89 1.01
Debt-to-equity 1.07 1.15 0.39 0.49
Net debt-to-equity 0.55 0.65 -0.11 0.07
Debt-to-capital 0.445 0.464 0.20 0.24
Net debt-to-net capital 0.35 0.39 -0.12 0.07
Interest coverage (earnings based) 26.46 26.44 58.65 36.20
Interest coverage (cash flow based) 25.13 23.54 64.46 45.61
Key profitability ratios H&M Inditex
Year 2010 2009 2010 2009
ROE 46.5% 44.5% 32.9% 30.9%
Dividend payout ratio 59.8% 66.0% 32.9% 37.0%
Sustainable growth rate 18.7% 15.1% 22.1% 19.4%
Source: Own Estimates

Financial Analysis Report – H&M Hennes & Mauritz AB
28
Appendix 12 – H&M sales growth drivers
Table 1: Trailing twelve months growth rates
Region Shops Sales per shop Sales
Germany 2% -5% -2.8%
Nordics 1% -5% -3.5%
Rest of Europe 5% -5% 0.3%
Asia 39% -14% 20.3%
Americas 5% -1% 3.5%
Franchise 22% -1% 20.4%
Global 5% -5% 0.4%
Table 2: Trailing twelve months actual sales (SEK m)
Region Shops Sales per shop Sales
Germany 386 64.83 25,024
Nordics 404 40.66 16,425
Rest of Europe 1,100 44.46 48,905
Asia 99 61.88 6,127
Americas 275 41.15 11,317
Franchise 61 17.75 1,083
Global 2,325 46.83 108,880
Source: H&M Hennes & Mauritz AB reports
Appendix 13 – H&M sales forecasts
Measure 2011 2012 2013 2014 Terminal
Number of shops 2,325 2,461 2,618 2,806 3,008
Yoy Growth 5.4% 5.8% 6.4% 7.2% 7.2%
Sales 109,075 111,888 115,348 117,886 120,475
Yoy Growth 0.4% 2.6% 3.1% 2.2% 2.2%
Source: Own Estimates

Financial Analysis Report – H&M Hennes & Mauritz AB
29
Appendix 14 – Forecasted condensed Financial Statements
SEK (m) 2011 2012 2013 2014 Term
Balance Sheet 2,235 2,293 2,364 2,416 2,470
Net Working Capital 71,713 73,578 75,859 77,528 79,233
+ Net NC Assets 73,948 75,871 78,223 79,944 81,703
= Net Assets 26,159 26,839 27,671 28,280 28,902
Net Debt 47,789 49,032 50,552 51,664 52,801
+ SH Equity 73,948 75,871 78,223 79,944 81,703
= Net Capital 2,235 2,293 2,364 2,416 2,470
Income Statement
Sales 108,884 111,715 115,179 117,712 120,302
NOPAT 22,321 22,951 24,523 25,062 25,614
- Net interest expense after tax 1,168 1,225 1,290 1,347 1,377
= Net Profit 21,154 21,726 23,232 23,715 24,237
Operating ROA 2011 2012 2013 2014 Term
Operating ROA 30.2% 30.2% 31.3% 31.3% 31.3%
ROE 44.3% 44.3% 46.0% 45.9% 45.9%
BV of Assets Growth Rate 0.4% 2.6% 3.1% 2.2% 2.2%
BV of Equity GR Rate 0.4% 2.6% 3.1% 2.2% 2.2%
Net Operating Asset Turnover 1.5 1.5 1.5 1.5 1.5
Cash Flow 2011 2012 2013 2014 Term
Net profit 21,154 21,726 23,232 23,715 24,237
- ∆ net working capital (8) (58) (71) (52) (53)
- ∆ net non-current assets (264) (1,865) (2,281) (1,669) (1,706)
+ ∆ net debt 96 680 832 609 622
Free cash flow to equity 20,978 20,484 21,712 22,603 23,100
NOPAT 22,321 22,951 24,523 25,062 25,614
- ∆ net working capital (8) (58) (71) (52) (53)
- ∆ net non-current assets (264) (1,865) (2,281) (1,669) (1,706)
Free cash flow to capital 22,049 21,028 22,171 23,341 23,855
Source: Own Estimates
Appendix 15 – Beta Calculation
In order to determine H&M’s cost of capital, we have first determined the equity beta’s of H&M
and two of its main competitors, Inditex and Marks & Spencer, by regressing (for three and five
years) their monthly returns against the returns on the MSCI Europe Index. After obtaining the

Financial Analysis Report – H&M Hennes & Mauritz AB
30
equity betas, we have calculated the asset beta’s (we assume a debt beta of zero which seems
plausible given the fact H&M hardly used debt financing signalling superior creditworthiness).
By taking the average asset beta of the three companies, we calculated again the equity beta for
H&M. Depending on both the time horizon chosen and the index used (we used both MSCI
Europe and Vanguard) we obtained a maximum equity beta of 0.34 for H&M.
Appendix 16 – WACC calculation
Risk free rate is equal to 2.78%. This risk-free rate is based on the yield of ten-year Swedish
government bonds between April 2010 and October 2011. We have taken an average of the rates
that were observed each month between April 2010 and October 2011.
Source: Sveriges Risk Bank, http://www.riksbank.com/
The equity beta obtained for H&M was calculated by using the average equity betas of FT
(0.55), Reuters (0.56) and Thomson One Banker (0.53). This gave us an equity beta of:
(0.56+0.55+0.53)/3 = 0.55. Market risk premium is equal to the historical risk premium of 5.5%
Costs of equity = risk free rate + Beta * (market risk premium) = 2.78% + 0.55*(5.5) = 5.79%.
The cost of debt is assumed to be equal to 2.7% as explained earlier in footnote 4 of the
accounting analysis.
WACC is calculated using the formula below:
Net debt equals: 34,229.70 SEK m. For equity, we have taken the market value of equity. This
was calculated by multiplying the number of shares outstanding at November 30th, 2010 * share
price at November 30th, 2010. This gives us a market value of: (1,655,072,000 * 237,40 SEK) /
1,000,000 = 392,914.09 SEK m. The after tax costs of debt are equal to 2.7% * (1-0,253) =
2.02%. Net debt / Net debt + Equity = (34,229.70) / (392,914.09 + 34,229.70) = 0.065. Equity /
Net debt + Equity = 1 – 0.065 = 0.925
Plugging in all values in the formula gives a WACC of: (0.07 * 2.02) + (0.92*5.79) = 5.48%

Financial Analysis Report – H&M Hennes & Mauritz AB
31
Appendix 17 - Estimates of Value of Equity
Table 3: Total Equity Value (SEK m)
Valuation
Method
Beginning
book value
Capitalized
NP2010
Value
between 2010
and 2014
Terminal
value Total Value
Abnormal
earnings 47,613.10 - 84,186.91 456,458.54 588,258.55
Free Cash Flow
to equity - - 91,951.23 496,307.33 588,258.55
Abnormal
earnings growth - 365,348.79 43,378.87 179,530.89 588,258.55
Source: Own Estimates
Appendix 18 - Estimated of Share Price beyond Terminal Year under the two Scenarios
AE > 0 beyond terminal year AE = 0 beyond terminal year
Total Value Price per share Total Value Price per share
SEK 588,258.55 m SEK 355.43 SEK 131,800.01 m SEK 79.63
Source: Own Estimates

Financial Analysis Report – H&M Hennes & Mauritz AB
32
Appendix 19 – Sensitivity analysis
Share Price
Sensitivity
Cost of Equity
5.29% 5.79% 6.29% 6.79% 7.29% 7.79% 8.29%
Ter
min
al
Gro
wth
Ra
te
3.70% 735.85 560.32 452.55 379.65 327.06 287.31 256.22
3.20% 576.78 465.65 390.48 336.25 295.27 263.22 237.46
2.70% 479.13 401.62 345.70 303.45 270.41 243.86 222.06
2.20% 413.08 355.43 311.87 277.81 250.43 227.96 209.18
1.70% 365.43 320.53 285.41 257.20 234.03 214.67 198.26
1.20% 329.43 293.23 264.15 240.27 220.32 203.40 188.87
0.70% 301.28 271.30 246.69 226.13 208.69 193.72 180.73
Figure 3: Share price sensitivity to the cost of equity and the terminal growth rate
Source: Own Estimates