Embed Size (px)
Citation preview
HIV-1 NEF MOBILIZES LIPID RAFTS IN MACROPHAGES THROUGH A
PATHWAY THAT COMPETES WITH ABCA1-DEPENDENT CHOLESTEROL
EFFLUX
Huanhuan L. Cui*,2, Angela Grant, §,2,3, Nigora Mukhamedova*, Tatiana Pushkarsky§, Lucas
Jennelle§, Larisa Dubrovsky§, Katharina Gaus^, Michael L. Fitzgerald¶, Dmitri Sviridov*,1,
and Michael Bukrinsky§.
*Baker Heart and Diabetes Institute, Melbourne, VIC, Australia; §Department of
Microbiology, Immunology and Tropical Medicine, George Washington University,
Washington, DC, USA; ^The Centre for Vascular Research, University of New South Wales,
Sydney, NSW, Australia; ¶Lipid Metabolism Unit, Massachusetts General Hospital, Boston,
MA, USA.
Running title: Host cholesterol metabolism regulation by Nef
1To whom correspondence should be addressed: Dmitri Sviridov, Baker Heart and Diabetes
Institute, PO Box 6492, St. Kilda Rd Central, Melbourne, VIC, 8008, Australia; email:
1
by guest, on July 2, 2018w
ww
.jlr.orgD
ownloaded from

ABSTRACT
HIV infection, through the actions of viral accessory protein Nef, impairs activity of
cholesterol transporter ABCA1 inhibiting cholesterol efflux from macrophages and elevating
the risk of atherosclerosis. Nef also induces lipid raft formation. In this study, we
demonstrate that these activities are tightly linked and affect macrophage function and HIV
replication. Nef stimulated lipid raft formation in macrophage cell line RAW 264.7, and lipid
rafts were also mobilized in HIV-1-infected human monocyte-derived macrophages. Nef-
mediated transfer of cholesterol to lipid rafts competed with the ABCA1-dependent pathway
of cholesterol efflux, and pharmacological inhibition of ABCA1 functionality or suppression
of ABCA1 expression by RNAi increased Nef-dependent delivery of cholesterol to lipid
rafts. Nef reduced cell-surface accessibility of ABCA1 and induced ABCA1 catabolism via
the lysosomal pathway. Despite increasing the abundance of lipid rafts, expression of Nef
impaired phagocytic functions of macrophages. The infectivity of the virus produced in
natural target cells of HIV-1 negatively correlated with the level of ABCA1. These findings
demonstrate that Nef-dependent inhibition of ABCA1 is an essential component of the viral
replication strategy and underscore the role of ABCA1 as an innate anti-HIV factor.
Supplementary key words: Cholesterol metabolism, HIV, lipid rafts
2
by guest, on July 2, 2018w
ww
.jlr.orgD
ownloaded from
Impairment of cholesterol metabolism plays a key role in pathogenesis of many
disorders, most importantly cardiovascular and neurodegenerative diseases. Many infectious
agents, from prions to parasites, affect cholesterol metabolism of the host. Microorganisms
modify host cholesterol metabolism for two main reasons: to satisfy their own requirements
for cholesterol at different stages of their life cycle, and to weaken the immune response of
the host. These modifications may cause “unintended” consequences triggering development
of diseases that are not directly related to infection. This situation is exemplified by the
increased risk of atherosclerosis coincident with HIV infection. Targeting cholesterol
metabolism for anti-microbial intervention, while at the same time correcting metabolic
consequences of the infection, is a tempting possibility limited by the lack of knowledge
about mechanisms of interaction between microorganisms and pathways of cholesterol
metabolism in host cells.
It has been established that HIV infection interferes with cholesterol metabolism of host
cells, particularly macrophages, elevating the risk of atherosclerosis, however, the
mechanisms of this connection are not completely understood (for review see (1)). We have
reported that HIV replication is associated with impairment of both local and systemic
elements of the reverse cholesterol transport pathway (2, 3), which plays a key role in
maintaining cellular cholesterol homeostasis. HIV, via the viral accessory protein Nef,
inhibits activity of the ATP binding cassette transporter A1 (ABCA1), an integral
transmembrane lipid transporter (4), and impairs cholesterol efflux from macrophages
causing accumulation of cholesterol in these cells and their transformation into foam cells, a
hallmark of atherosclerosis (3). Furthermore, extracellular Nef secreted by HIV infected cells
can inhibit cholesterol efflux from un-infected cells and cause impairment of systemic reverse
cholesterol transport (5). On the other hand, stimulation of cholesterol efflux through
activation of ABCA1 suppresses HIV-1 infection (6). These findings suggest that interaction
3
by guest, on July 2, 2018w
ww
.jlr.orgD
ownloaded from
between Nef and ABCA1 may be a key to both viral replication and impairment of cellular
lipid metabolism. The cellular mechanisms of Nef interaction with ABCA1 and how this
interaction translates into physiological effects related to HIV replication and macrophage
functions remain unknown. Understanding the mechanisms of Nef effects on ABCA1 may
provide important information for elucidating novel pathways responsible for regulation of
ABCA1 abundance and functionality. The involvement of these pathways may not be limited
to HIV infection, as they may represent a physiological regulation of cellular cholesterol
metabolism exploited by HIV and possibly by other infections.
Nef exerts pleiotropic effects during viral infection, and although Nef expression is not
strictly essential for viral replication in vitro, it significantly enhances infectivity of nascent
virions (7). One mechanism by which Nef controls viral infectivity is through increasing
cholesterol content of lipid rafts (8). Nef induces a number of genes involved in cholesterol
synthesis (8, 9) and can facilitate cholesterol delivery to lipid rafts (8, 10). This activity is
consistent with membrane localization of Nef due to myristoylation (8, 11, 12), and non-
myristoylated Nef did not affect lipid rafts (8). Lipid rafts are the preferential sites of HIV-1
assembly and budding, and cholesterol content of lipid rafts determines the cholesterol
content of virions, which is critical for virion infectivity. Cholesterol depletion of HIV-
infected cells reduces infectivity of released virions, which was shown to correlate with the
amount of virion-associated cholesterol and the activity of Nef (6, 13). In addition, depletion
of cellular cholesterol, which reduces the abundance of rafts, also reduces HIV-1 particle
production (6, 10). Therefore, primary cholesterol-related activity of Nef may be to increase
the abundance of lipid rafts thus stimulating production and infectivity of nascent HIV
virions. How this capacity of Nef relates to cellular pathways involved in maintaining
cholesterol homeostasis and, specifically, why and how Nef inhibits ABCA1 remains unclear.
It is also unknown what role, if any, inhibition of ABCA1 plays in the effect of Nef on lipid
4
by guest, on July 2, 2018w
ww
.jlr.orgD
ownloaded from
rafts. In this study we investigated the association between Nef, ABCA1, and lipid rafts. We
hypothesized that HIV Nef is responsible for either inhibition or subversion of the ABCA1-
dependent pathway of cholesterol trafficking, re-directing the flow of intracellular cholesterol
from cholesterol efflux to formation of lipid rafts, and that this phenomenon is essential for
HIV infectivity. Our results demonstrate that inhibition of ABCA1 is critical for Nef-
dependent modulation of lipid rafts and illustrate consequences of this modulation for the cell
and the virus.
METHODS
Cells
N7 mouse macrophage cell line was obtained from the Centre for AIDS Reagents
(NIBSC). These cells were derived from the RAW 264.7 mouse macrophage cell line and
are stably transfected to express a low level of HIV-1 viral protein Nef, that is inducible by
treatment with cadmium chloride (CdCl2) (14). HeLa-ABCA1 cells stably expressing GFP-
tagged ABCA1 (15, 16) were a kind gift of Dr. A. Remaley. Peripheral blood leukocytes and
monocyte-derived macrophages were isolated and maintained as described previously (3).
Antibodies for Western blot analysis
The monoclonal antibody against ABCA1 was from Novus Biologicals, anti JR-CSF
Nef monoclonal antibody was from NIH AIDS Research and Reference Reagent Program,
antibodies to Notch 3, Integrin 5β, and GAPDH were from Santa Cruz Biotechnology, anti-β-
actin monoclonal antibody was from Sigma. Horseradish peroxidase cholera toxin subunit B
conjugate for detection of GM1 and transferrin receptor antibodies were from Invitrogen.
5
by guest, on July 2, 2018w
ww
.jlr.orgD
ownloaded from
Isolation of apoA-I
High density lipoprotein (1.083<d<1.21 g/L) was isolated by sequential
centrifugation in KBr solutions, delipidated, and apoA-I was purified by gel filtration
chromatography as previously described (17).
siRNA experiments
Cells were treated with TO-901317 (0.5 µM) for 18 hours, and transfected with
ABCA1- or Nef-specific siRNA or scrambled siRNA (control) using Lipofectamine 2000TM
(Invitrogen). ABCA1 siRNA and scrambled siRNA were from Ambion. Nef siRNA was
custom-designed and manufactured by Invitrogen.
Analysis of HIV-1 infectivity
Monocyte-derived macrophages were infected with HIV-1 ADA and were maintained
for 10 days until infection reached the plateau (5x10³ cpm/ml of RT activity). Cells were
transfected with ABCA1-targeting or control siRNA twice with a 24 h interval, washed, and
cultured for 2 days after the second transfection. Virus was collected from the supernatant,
concentrated, adjusted according to p24 content and used to infect indicator TZM-bl cells
(18). 48 h after infection, luciferase activity was measured on Perkin Elmer luminescence
counter.
Lipid raft cholesterol content analysis
To assess the transfer of cholesterol to lipid rafts we used three approaches. The first
approach utilized a selective binding of cholera toxin subunit B (CT-B) to GM1, a marker of
6
by guest, on July 2, 2018w
ww
.jlr.orgD
ownloaded from
rafts. The cells were treated with 0.5 µM of LXR agonist TO-901317 and treated or not with
10 µM CdCl2 for 24 hours, washed with PBS, detached by trypsin, washed again and
incubated for 1 h at 4oC in serum-containing medium with FITC-CT-B conjugate (Invitrogen)
(final concentration 0.5 μg/ml). Cells were then fixed with 5% formaldehyde and analyzed
by flow cytometry.
The second approach relied on increased susceptibility for oxidation of cholesterol in
cholesterol-rich domains by extracellular cholesterol oxidase as was described previously
(19). Briefly, RAW 264.7 or N7 cells were treated with 0.5 µM TO-901317, treated or not
with 10 µM CdCl2 and simultaneously labelled for 24 h with [3H]cholesterol (Amersham-GE,
specific radioactivity 1.81 TBq/mmol; final radioactivity 75 kBq/ml) at 37°C. Final amount
of labelled cholesterol in the cells was similar for all cells and conditions. Cells were then
treated with cholesterol oxidase for 3 h at 4°C. Lipids were extracted and samples together
with lipid standards were fractionated by TLC (19).
The third approach analyzed physico-chemical properties of the cell plasma
membrane by Laurdan 2-photon microscopy. RAW 264.7 or N7 cells were plated in 24 well
plates at 0.1 x 10⁶ cells/well. The cells were treated with 0.5 µM TO-901317 for 24 hours
and treated or not with 10 µM CdCl2 for 24 hours. Cells were labelled with 5 µM Laurdan
(6-dodecanoyl-2-dimethylaminonaphtalene; Invitrogen) for 30 min at 37°C, washed three
times with PBS and fixed in 4% paraformaldehyde at room temperature for 20 min. Images
were obtained using TCS SP5 2-photon microscope (Leica) microscope equipped with
photomultiplier tubes and acquisition software (Leica). Laurdan dye was excited at 800 nm
with a 2-photon laser (Mai-Tai HP, Spectra-Physics), and emission intensities were recorded
simultaneously in the ranges of 400-460 nm and 470-530 nm. Laurdan dye intensity images
for each pixel were converted into GP (generalized polarization) images using custom-made
algorithm. The GP is defined as: GP= (I(400-460)-I(470-530)/ (I(400-460)+I(470-530)) where I is the
7
by guest, on July 2, 2018w
ww
.jlr.orgD
ownloaded from
emission intensity. GP distributions were obtained from the histograms of the GP images,
normalized (sum = 100) and fitted to Gaussian distributions using nonlinear fitting algorithm.
Cell fractionation
To isolate the membrane fraction, RAW 264.7 and N7 cells were washed with cold
PBS, re-suspended in 5 mM Tris buffer, incubated for 30 min at 4oC and freeze-thawed
twice. Debris was removed by low-speed centrifugation and supernatant was subjected to
centrifugation at 100,000 x g for 1 h at 4oC. Pellet was resuspended in buffer containing 50
mM Tris, protease and phosphatase inhibitors cocktail (Roche), 2 mM β-mercaptoethanol and
1% Triton X-100.
Lipid rafts from membrane fraction of RAW 264.7 and N7 cells labelled with
[3H]cholesterol were isolated by centrifugation in OptiPrep density gradient medium (Sigma)
according to manufacturer’s instructions. Fractions were analyzed by Western blot
developed with anti-GM1 and anti-ABCA1 antibodies.
Isolation of intracellular and membrane fractions of HeLa-ABCA1 cells was
performed using commercially available Pierce Cell Surface Protein Isolation Kit (Thermo
Scientific) following manufacturer’s protocol, equal amounts of protein were loaded on the
purification column. Fractionation was assessed via Western blot for membrane and
cytosolic protein markers.
Biotinylation of ABCA1
Cells were activated with TO-901317 (0.5 μM), treated with CdCl2 (10 μM) for 24 h
and incubated for 30 min at 4oC in PBS with Sulfo-NHS-SS-Biotin (Pierce) (final
8
by guest, on July 2, 2018w
ww
.jlr.orgD
ownloaded from
concentration 0.5 mg/ml). Cells were scraped into PBS containing protease and phosphatase
inhibitor cocktail (Roche), homogenized, large debris removed by low speed centrifugation
and membrane fraction was isolated as described above. Equal amounts of protein were
mixed with UltraLink Plus immobilized streptavidin gel and incubated for 18 h at 4oC. After
extensive washing, beads were mixed with loading buffer containing 50 mM DTT, heated at
37oC for 30 min and the gel was pelleted. The pelleted gel was separated by SDS-PAGE and
blotted with antibodies to ABCA1 and GAPDH.
Confocal microscopy
For imaging, HeLa-ABCA1-GFP cells were grown on 35 mm glass bottom cell
culture dishes. GM1 staining was performed using Alexa Fluor 555/CT-B conjugate
(Invitrogen). Lysosome labelling was performed using Organelle LightsTM specifically
labelling lysosome-associated membrane protein-1 (LAMP-1). Twenty four hours prior to
imaging, cells were transduced with the Organelle Lights Lysosomes-RFP reagent according
to the manufacturer protocol (Invitrogen). Images were captured with a Zeiss LSM 510
Confocal Microscope equipped with integrated on-stage incubator chamber. The chamber
provides constant temperature at 37oC and is supplied with humidified 5% CO2. Two
channel confocal time-series were captured at pixel resolution of 0.175 μm while image
frames measured 512x512 pixels. Emission filtering was achieved by inserting on the
backward light path high pass 545 and 490 beam splitters in addition to a high pass 505 filter.
Images were taken by sequential line acquisition.
Quantitative co-localization was assessed using Volocity software (Perkin-Elmer).
For co-localization the images were first subjected to intensity threshold to eliminate the dark
current registered at the image, followed by extracting the product of the differences from the
9
by guest, on July 2, 2018w
ww
.jlr.orgD
ownloaded from
mean (PDM). Positive PDM was determined for a single cell, where pixel intensities of GFP
and RFP are varying synchronously and more positive PDM indicates a stronger degree of
co-localization. We used the positive PDM as indicator for co-localizing pixels, since by
definition these pixels represent higher than the main pixel value (over threshold) for both
channels and reduce the probability of including adjacent structures in the co-localization
outcome. This protocol was applied to 10 cells per sample.
Cholesterol efflux
Cholesterol efflux was measured as described previously (20). Briefly, cells were
incubated in serum-containing medium supplemented with [3H]cholesterol (75 kBq/ml) for
48 h. Cells were then washed with PBS and incubated for 4 h in serum-free medium
containing LXR agonist TO-901317. Apolipoprotein A-I was then added to the final
concentration of 30 μg/ml. Aliquots of medium and cells were counted. The efflux was
calculated as a proportion of radioactivity moved from medium to cells (minus efflux to
medium without acceptors).
Cholesteryl ester biosynthesis
Cells were incubated for 18 h in serum-containing medium in the presence of 50
μg/ml of acetylated LDL (AcLDL). Cholesteryl ester biosynthesis was then assessed by
incorporation of [14C]oleic acid into cholesteryl esters over 2 h as described previously (3).
MTT assay – One hundred µl of 3-(4,5-dimethylthiazol-2-yl)-2,5-diphenyltetrazolium
bromide (MTT) was added per 500 µl cell culture media, and cultures were incubated at 37oC
for 3 to 4 hours. The MTT/media mixture was removed, and 200 µl of an isopropanol/HCl
10
by guest, on July 2, 2018w
ww
.jlr.orgD
ownloaded from
mixture (500 ml isopropanol, 1.667 ml 12 M HCl) was used to dissolve cell pellets. The
resulting supernatant was plated into 96 well plates and read in an ELISA reader at 570 nm.
Phagocytosis assay
RAW 264.7 and N7 cells were activated with LXR agonist TO-901317 (0.5 μM) and,
where indicated, treated with CdCl2 (10 μM) for 24 h. Phagocytosis was assessed using
Phagocytosis Assay (Invitrogen) according to the manufacturer’s instructions. For induced
phagocytosis, cells were preconditioned by incubation for 18 h at 37oC with 1 μg/ml of LPS.
Endocytosis assay
RAW 264.7 and N7 cells were washed extensively with PBS, and then incubated for 1
h at 4oC (binding) or 37oC (internalization + binding) in serum-containing medium with
FITC-CT-B conjugate (Invitrogen) (final concentration 0.5 μg/ml), scraped and analyzed by
flow cytometry. Binding data is reported as mean fluorescence intensity (MFI) of cells
maintained at 4oC.
Statistics
Unless indicated otherwise, the figures show the results of a representative experiment
out of 2-4 identical experiments. Statistical analysis was performed using one-way ANOVA.
Unless indicated otherwise, means ± SEM of quadruplicate determinations are presented.
11
by guest, on July 2, 2018w
ww
.jlr.orgD
ownloaded from
RESULTS
In this study, we used mouse macrophage cell line N7, which is derived from RAW
264.7 cells and is stably transfected with HIV-1 Nef under Cd-activated promoter (14). This
cell line was used because it is the only available cell line stably transfected with Nef under
control of a regulated promoter, and parent RAW 264.7 cells were previously used to study
the effects of Nef (3). Activation of N7 cells with CdCl2 led to a time-dependent elevation of
the abundance of Nef, which levelled-off after 24 h (Fig. 1A). However, low level
expression of Nef was observed in N7 cells not activated with CdCl2, necessitating
comparison of N7 cells to parent RAW 264.7 macrophages. To provide an additional control
in these circumstances, we also tested three anti-Nef siRNAs at two concentrations. All
siRNAs achieved over 70% reduction of Nef expression in N7 cells (Fig. 1B). In the
subsequent experiments we used siRNANef#3 at concentration 20 nM.
To confirm the effect of Nef on cholesterol homeostasis in this model, we assessed
cholesteryl ester biosynthesis, a surrogate measure of cholesterol accumulation, in these cells.
Consistent with our previous findings in HIV-infected human macrophages (3), incorporation
of [14C]oleic acid into cholesteryl esters in N7 cells after loading with cholesterol by
incubation with AcLDL was 50% higher than in RAW 264.7 cells (Fig. 1C). Knock down of
Nef expression in N7 cells with Nef siRNA brought cholesteryl ester biosynthesis in these
cells to the level observed in RAW 264.7 cells, while transfection with control siRNA had no
effect (Fig. 1C) showing that the observed effects were mediated by Nef and were not due to
clonal variation between RAW 264.7 and N7 cell lines. For subsequent experiments we
compared N7 cells directly to RAW 264.7 cells.
Nef stimulates formation of lipid rafts
12
by guest, on July 2, 2018w
ww
.jlr.orgD
ownloaded from
There is no commonly accepted approach to evaluate the amount of cholesterol in rafts
and/or abundance of rafts; therefore, we used three independent methods to assess the effect
of Nef on the abundance of lipid rafts. First, we used flow cytometry to assess binding to
cells of cholera toxin subunit B, which binds specifically to the accepted marker of rafts,
GM1. Results of these experiments are presented in Fig. 2A. Binding of CT-B to N7 cells
expressing Nef increased twofold compared to the parent RAW 264.7 cells and increased
further upon stimulation of Nef expression by CdCl2. Although CdCl2 slightly decreased
binding of CT-B to RAW 264.7 cells, the difference was not statistically significant. Both
Nef-targeted and control siRNAs reduced CT-B binding, but the specifically targeted siRNA
reduced binding to the level observed in RAW 264.7 cells while CT-B binding to N7 cells
treated with siRNAc was still significantly higher than binding to RAW cells (Fig. 2A).
Second, we used a biochemical approach assessing the susceptibility of plasma
membrane cholesterol to oxidation by external cholesterol oxidase. Cholesterol accessible to
the external enzyme has been suggested to be located in cholesterol-rich domains of the
plasma membrane exposed to the cell surface, including caveolae (19) (RAW 264.7 cells and
presumably N7 cells derived from RAW 264.7 cells do not have caveolae (21)) and lipid rafts
(22). Results of these experiments are presented in Fig. 2B and show that Nef increased the
proportion of cholesterol accessible to oxidation relative to total cholesterol.
Third, we measured membrane fluidity by analyzing Laurdan fluorescence recorded by
a 2-photon microscopy (23, 24). The lipophilic dye Laurdan aligns itself parallel with the
hydrophobic tails of the phospholipids in membranes and undergoes a shift in its peak
emission wavelength from approximately 500 nm in fluid membranes to approximately 440
nm in ordered membranes due to partial penetration of water molecules into more fluid
membranes (23). A normalized ratio of the two emission regions, calculated as the general
polarization, provides a relative measure of polarity that can be equated to membrane order
13
by guest, on July 2, 2018w
ww
.jlr.orgD
ownloaded from
(24). Analysis of RAW 264.7 and N7 cells using this approach demonstrated that Nef
expression increased the GP value (Fig. 2C), indicating an increase in membrane order,
which is the biophysical hallmark of lipid rafts. Thus, although each raft detection method
individually may not be unequivocal, data from each of the three methods support the
conclusion that the presence of Nef increased the abundance of lipid rafts.
We further confirmed this finding using HIV-infected monocytes. Consistent with the
findings in N7 cells, the percentage of cells with measurable CT-B binding increased from
4.2% to 14.3% when uninfected cells were compared to HIV-infected monocyte-derived
macrophages (Fig. 2D), indicating that HIV-1 infection increases the abundance of lipid rafts
in natural infection and validating N7 cells as a model for analysis of Nef effects in
macrophages.
Inhibition of ABCA1 stimulates Nef-dependent formation of rafts
Given that Nef inhibits ABCA1-dependent cholesterol efflux while increasing the
abundance of cholesterol in rafts, we investigated if these two cholesterol trafficking
pathways (Nef-dependent and ABCA1-dependent) are connected. One possibility was that
Nef “hijacks” ABCA1 and uses the ABCA1-dependent pathway to transfer cholesterol to
rafts, instead of transferring it to an extracellular acceptor. Alternatively, Nef may compete
with ABCA1 for cholesterol. To distinguish between these two possibilities, we inhibited
ABCA1-dependent cholesterol trafficking and investigated the effect of this inhibition on
Nef-dependent trafficking of cholesterol to rafts. We expected that if ABCA1 is critical to
Nef-dependent cholesterol trafficking, inhibition of ABCA1 would also inhibit Nef-
dependent cholesterol delivery to lipid rafts.
14
by guest, on July 2, 2018w
ww
.jlr.orgD
ownloaded from
First, we used functional inhibitors of cholesterol trafficking, Blocking Lipid Transfer
(BLT) compounds. BLT compounds inhibit ABCA1 and scavenger receptor type B1 (SR-
B1)-dependent trafficking of cholesterol for efflux without affecting the abundance of the
transporters (25). Two BLT compounds, BLT1 and BLT4, effectively inhibited ABCA1-
dependent cholesterol efflux to apoA-I from RAW 264.7 cells (Fig. 3A). Consistent with our
previous report showing suppression of cholesterol efflux by Nef (3), the efflux from N7 cells
was about half of that from RAW 264.7 cells (Fig. 3B). Only BLT1 caused a small further
inhibition of cholesterol efflux, presumably through cross-inhibition of SR-B1-dependent
efflux (25). Abundance of rafts in this experiment was assessed using the cholesterol oxidase
method. BLT compounds did not have a statistically significant effect on the abundance of
rafts in RAW 264.7 cells (Fig. 3C). However, in N7 cells BLT compounds significantly
increased the abundance of rafts (Fig. 3D). Similar results were obtained using the CT-B
binding method of lipid raft analysis (Supplemental Fig. I). These findings indicate that
inhibition of ABCA1 function without altering its abundance is sufficient to enhance effects
of Nef.
Next, we used siRNA to knock-down ABCA1 in RAW 264.7 and N7 cells. In both cell
types approximately 80% knockdown efficiency was achieved (Fig. 3E) resulting in an
almost complete elimination of specific cholesterol efflux to apoA-I (not shown). When the
abundance of rafts was assessed by cholesterol oxidase susceptibility, knockdown of ABCA1
caused a statistically significant increase of lipid rafts in both RAW 264.7 and N7 cells,
however, the magnitude of the effect was much greater in N7 cells activated with CdCl2 (Fig.
3F). When lipid raft abundance was assessed by CT-B binding, knockdown of ABCA1 did
not affect abundance of rafts in RAW 264.7 cells, but caused a statistically significant
increase in raft abundance in N7 cells (Fig. 3G).
15
by guest, on July 2, 2018w
ww
.jlr.orgD
ownloaded from
In summary, both functional inhibition of the ABCA1-dependent cholesterol trafficking
pathway and knock-down of ABCA1 increased the capacity of Nef to transfer cholesterol to
lipid rafts. Nef may do it directly, as suggested by Peterlin’s group (8), or indirectly, for
example by interfering with normal cholesterol trafficking pathways connecting cholesterol
synthesis, lipid raft formation, and efflux. Combined with our recent finding that stimulation
of ABCA1 expression by LXR agonists decreases Nef-dependent cholesterol delivery to rafts
(6), these results indicate that Nef does not utilize ABCA1 for cholesterol trafficking to rafts.
Rather, Nef-dependent inhibition of ABCA1 may contribute to raft modulation.
Nef reduces ABCA1 stability and promotes its re-localization away from the cell surface
To better understand the Nef-dependent inhibition of ABCA1, we next analyzed the
effect of Nef on catabolism and intracellular distribution of ABCA1 in macrophages. To
assess the rate of catabolism of ABCA1, cells were treated with LXR agonist TO-901317 for
24 h to maximally stimulate expression of ABCA1 (26). TO-901317 was then withdrawn,
effectively halting ABCA1 production, and abundance of ABCA1 was followed for another
24 h in the presence or absence of apoA-I. Results of this experiment are shown in Fig. 4A.
In the presence of apoA-I, the abundance of ABCA1 in RAW 264.7 cells did not change after
a 24 h incubation even when ABCA1 transcription was effectively stopped by withdrawal of
TO-901317 (lane 2 versus 1); however, ABCA1 abundance decreased by approximately 40%
in the absence of apoA-I (lane 3 versus 1). In N7 cells, the abundance of ABCA1 decreased
by 60% in the presence of apoA-I (lane 5 versus 4) and by 90% in the absence of apoA-I
(lane 6 versus 4). These differences were not due to differences in ABCA1 expression as the
16
by guest, on July 2, 2018w
ww
.jlr.orgD
ownloaded from
abundance of ABCA1 mRNA was not affected by Nef (Fig. 4B). Thus, Nef may increase
degradation of ABCA1.
We assumed that the impairment of ABCA1 functionality and turnover by Nef may be
related to changes in the sub-cellular localization of ABCA1. We first hypothesized that,
analogous to its effect on cholesterol distribution, Nef may also facilitate ABCA1 transfer to
rafts, as Nef is known to transfer a number of proteins to lipid rafts (27, 28). Such
redistribution of ABCA1 from its usual non-raft location (29) may cause its dysfunction and
instability. To test this hypothesis, we isolated raft and non-raft fractions of the plasma
membrane and analyzed them for ABCA1. The abundance of ABCA1 in the raft fraction of
N7 cells was 27% lower and in the non-raft fraction was 38% higher than that in RAW 264.7
cells (Fig. 4C). Thus, Nef did not increase the abundance of ABCA1 in rafts. Further, we
assessed the accessibility of ABCA1 to biotinylation, which shows the level of ABCA1
exposure on the cell surface. The abundance of biotinylated ABCA1 in N7 cells was
approximately 3 times lower than that in RAW 264.7 cells (Fig. 4D) despite similar levels of
total ABCA1 (Fig. 4A). We therefore conclude that ABCA1 in Nef-expressing cells is not
re-localized to the raft fraction but becomes less exposed at the cell surface, providing a
possible explanation for impaired functionality and/or increased turnover of ABCA1.
Nef induces degradation of ABCA1 in lysosomes
To further investigate the interaction of Nef and ABCA1, we employed another model,
HeLa cells stably transfected with ABCA1-GFP. We have previously demonstrated that
ABCA1-GFP in this model functions effectively in promoting cholesterol efflux to apoA-I
(15, 16). This model offers the advantage of fluorescently tagged ABCA1 expression which
17
by guest, on July 2, 2018w
ww
.jlr.orgD
ownloaded from
allows for easy tracking of ABCA1 trafficking and localization. Furthermore, ABCA1 in
these cells is under control of the CMV promoter excluding any transcriptional effects of Nef.
To assess the effect of Nef on ABCA1 distribution, HeLa-ABCA1 cells transiently
transfected with Nef or an empty vector were treated with biotin, lysed, and passed through
an anti-biotin column; both bound and unbound fractions were analyzed by Western blot.
The bound fraction represents ABCA1 exposed at the cell surface, while the unbound fraction
represents ABCA1 in a mixture of membranes, mainly intracellular, but also the inner leaflets
of the plasma membrane. The overall abundance of ABCA1 in cells transfected with Nef
was less than half compared to mock transfected HeLa-ABCA1 cells. While the abundance
of both cell surface and intracellular ABCA1 was decreased, the effect of Nef on intracellular
ABCA1 was greater (Fig. 5A). Consequently the ratio of cell surface/intracellular ABCA1 in
Nef-transfected cells was 1.5 fold higher than in mock transfected cells (Fig. 5B), despite an
overall lower amount of cell surface ABCA1.
The same model, HeLa-ABCA1 cells, was used to further investigate the mechanisms
of Nef-induced redistribution of ABCA1. Nef has been shown to re-route proteins such as
CD4 to lysosomes for degradation (30). We hypothesized that the same mechanism may be
responsible for reduction of intracellular ABCA1 by Nef, while ABCA1 on the plasma
membrane would be less susceptible. To investigate this possibility, we examined the co-
localization of ABCA1 and the lysosomal marker, LAMP-1, in the presence or absence of
Nef. GFP-ABCA1 was clearly visible in control cells and in cells transfected with Nef. As
shown in Figs. 5C and 5D, ABCA1-GFP and LAMP-1-RFP displayed increased co-
localization in the presence of Nef, suggesting Nef-mediated targeting of ABCA1 to
lysosomes.
18
by guest, on July 2, 2018w
ww
.jlr.orgD
ownloaded from
The increased co-localization of ABCA1 and LAMP-1 in the presence of Nef suggests
that Nef may stimulate ABCA1 degradation via the lysosomal pathway. We tested this
hypothesis by examining the effect of a lysosomal inhibitor, chloroquine, on Nef-mediated
ABCA1 degradation. Nef- or mock-transfected HeLa-ABCA1-GFP cells were treated with
chloroquine for 48 h and abundance of ABCA1 was examined by Western blot (Figs. 6A, B).
Inhibition of lysosomal activity prevented Nef-mediated reduction of ABCA1 protein
abundance. Thus, Nef mediated reduction of ABCA1 abundance depends, at least partially,
on a lysosomal degradation pathway. This was further confirmed when the effect of
chloroquine on cholesterol efflux was studied. When Nef or mock-transfected HeLa-ABCA1
cells were treated with chloroquine, Nef-mediated inhibition of ABCA1-specific efflux was
reversed (Fig. 6C).
The effect of Nef on macrophage functions
Inhibition of ABCA1 activity and increased abundance of lipid rafts in Nef-
expressing cells may have significant effects on macrophage immune functions (31). To
investigate this possibility, we first assessed the effect of Nef on endocytosis. Using GFP-
conjugated CT-B, which binds to lipid raft-associated GM1, we found increased CT-B
binding to N7 cells versus RAW 264.7 macrophages (Fig. 7A). This is consistent with Nef-
mediated increase of lipid raft abundance. However, internalization of bound CT-B was
much less efficient in N7 than in RAW 264.7 cells: whereas mean fluorescence intensity
increased 5.6-fold when RAW 264.7 cells were incubated at 37oC instead of 4oC, in N7 cells
the increase was only 1.2-fold. A similar outcome was observed when another function of
macrophages, phagocytosis, was analyzed using particles with pH-sensitive fluorescent dye
19
by guest, on July 2, 2018w
ww
.jlr.orgD
ownloaded from
pHrodo. Both lipopolysaccharide (LPS)-stimulated (Fig. 7B) and un-stimulated (Fig. 7C)
phagocytosis was severely impaired in N7 cells as compared to RAW 264.7 cells.
Furthermore, treatment of N7 cells with Nef siRNA restored the level of LPS-stimulated
phagocytosis in these cells to that in RAW 264.7 cells (Fig. 7B). Therefore, Nef inhibits
endocytic and phagocytic functions of macrophages.
HIV-1 infectivity negatively correlates with ABCA1 expression in host cell
We have previously demonstrated that pharmacological stimulation of ABCA1
expression inhibits HIV-1 infectivity by depleting viral cholesterol (6). An intriguing
consequence of this finding is that HIV infectivity may be influenced by the level of ABCA1
abundance in infected cells. To investigate this possibility, we compared HIV infectivity in
two human cell types that are the primary targets of natural HIV-1 infection, macrophages
and T lymphocytes. Monocyte-derived macrophages (MDM) have high abundance of
ABCA1 which was readily activated by an LXR agonist TO-901317 (Fig. 8A). Peripheral
blood leukocytes (PBL) have undetectable levels of ABCA1 under basal conditions, but
ABCA1 expression in these cells can be up-regulated with the LXR agonist. Consistent with
our expectations, infectivity of HIV-1 produced by “high ABCA1” cell type, MDM, was
about 30% of that of virus produced by “low ABCA1” cell type, PBL (Fig. 8B). This
difference was eliminated when ABCA1 in MDM was suppressed by siRNA (Fig. 8B).
Thus, high expression of ABCA1 in host cells is detrimental for HIV-1 infectivity.
20
by guest, on July 2, 2018w
ww
.jlr.orgD
ownloaded from
DISCUSSION
In this study we investigated the interaction between viral and host pathways of
cholesterol trafficking: the Nef-mediated transfer of cholesterol to lipid rafts and ABCA1-
dependent cholesterol efflux. Both pathways transfer cholesterol from intracellular
compartments to the plasma membrane, but the eventual fate of cholesterol is different: the
Nef pathway utilizes cholesterol for formation of lipid rafts required for viral assembly while
ABCA1 facilitates cholesterol release from cells to an extracellular acceptor. The two
pathways intrinsically oppose each other as the Nef-dependent pathway results in formation
of rafts while the ABCA1-dependent pathway leads to disruption of rafts (32, 33). Thus, it
would be beneficial for the virus to either subvert or suppress the ABCA1-dependent
cholesterol trafficking. We considered two possible interactions between the viral and host
pathways of cholesterol trafficking. One possibility was that HIV hijacks the cellular
ABCA1-dependent pathway diverting the flow of cholesterol away from non-raft sites
suitable for efflux (29) and to lipid rafts. The hijack strategy is often used by
microorganisms, especially viruses, to compensate for limitations in the size of their genome
(34). Another possibility was that HIV suppresses ABCA1 functionality to preserve
cholesterol needed by the virus.
To distinguish between these two possibilities we investigated whether inhibition of the
ABCA1-dependent pathway would affect Nef-dependent cholesterol trafficking to rafts. We
expected that if ABCA1 is hijacked by the Nef-dependent pathway, functional and physical
inhibition of ABCA1 would inhibit Nef-mediated cholesterol delivery to rafts. Contrary to
these expectations, we observed a stimulation of Nef-dependent trafficking of cholesterol to
rafts after reducing ABCA1 levels or after inhibiting ABCA1-dependent cholesterol
21
by guest, on July 2, 2018w
ww
.jlr.orgD
ownloaded from
trafficking. Combined with the observation that pharmacological stimulation of ABCA1
expression inhibits HIV infectivity (6), these findings suggest that HIV does not utilize
ABCA1 to transfer cholesterol to rafts, but rather the two pathways compete with each other.
We used two cellular models to investigate the mechanisms of ABCA1 inhibition by
Nef: RAW 264.7 macrophages stably transfected with Nef and HeLa-ABCA1 cells
transiently transfected with Nef. In both cell types the amount of ABCA1 on the surface of
the cells was dramatically reduced by Nef, which may be one mechanism of cholesterol
efflux inhibition in Nef-expressing cells. Surprisingly, in LXR agonist-stimulated
macrophages stably transfected with Nef the total abundance of ABCA1 was not reduced, an
observation in conflict with the findings in a HeLa cell model and in other cells transiently
transfected with Nef (3, 35). However, when LXR agonist was removed and cells were
incubated in serum-free medium (to remove protection of ABCA1 from degradation by
apoA-I), the amount of ABCA1 in Nef-expressing macrophages rapidly declined below its
level in control cells under the same conditions. This finding suggests that the apparent
redistribution of ABCA1 may be associated with its enhanced degradation. Experiments in
HeLa cells co-transfected with ABCA1 and Nef indicated that this degradation is likely to
take place in lysosomes.
Given that increased abundance of lipid rafts is considered pro-inflammatory, while
functional ABCA1 is considered anti-inflammatory (4), and that lipid rafts function to
promote endocytosis and phagocytosis in macrophages (36), we expected to see an increase
of raft-associated functional activities in Nef-expressing cells. Surprisingly, despite increased
binding of CT-B to Nef-expressing or HIV-infected macrophages, endocytosis and
phagocytosis in these cells were impaired. This finding is in conflict with a previous report
by Kedzierska et al (37) who found that Nef does not inhibit phagocytosis of Mycobacterium
avium complex (MAC) by monocytes. However, that study did not identify any increase in
22
by guest, on July 2, 2018w
ww
.jlr.orgD
ownloaded from
phagocytosis by Nef, suggesting that either phagocytosis in that model did not depend on
lipid rafts, or that phagocytosis stimulating and inhibiting effects of Nef nullified each other.
The mechanism of endocytosis and phagocytosis impairment in our model is unclear, but it is
Nef-mediated and may be related to the effects of Nef on trafficking of membrane-bound
proteins to and from rafts (38).
Our finding that infectivity of HIV-1 virions produced by lymphocytes is much higher
than infectivity of virions released by MDM, and that this difference is eliminated when
ABCA1 expression in MDM is knocked down by siRNA, is consistent with our previous
report that ABCA1 inhibits HIV-1 infectivity via decreasing cholesterol in lipid rafts and thus
limiting cholesterol incorporated into nascent HIV virions (6). However, this is the first
demonstration that such activity may have implications for HIV-1 replication in natural target
cells. Higher infectivity of virions produced from cells with low ABCA1 expression, such as
non-activated T lymphocytes or undifferentiated monocytes, may partially compensate for
lower virus production by these cells.
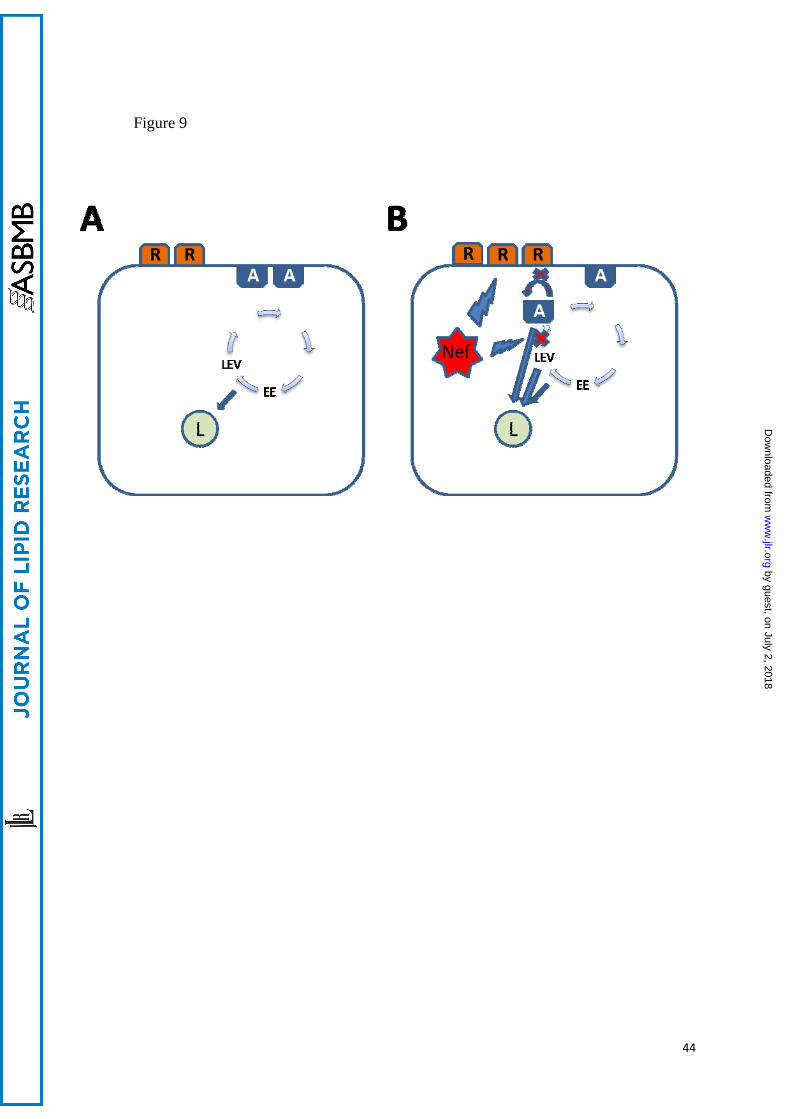
Taken together, results of this study demonstrate that Nef triggers a re-localization of
ABCA1 making it less accessible at the cell surface and more susceptible to degradation,
resulting in an inhibition of cholesterol efflux and increased abundance of lipid rafts. We
propose the following model of this phenomenon (Fig. 9). Under normal circumstances,
ABCA1 re-circulates between plasma membrane, where it is located in non-raft
compartments, and intracellular compartments, mainly early endosomes, late endocytic
vesicles, and lysosomes (16) (Fig. 9A). Nef may affect re-circulation by directly or indirectly
preventing ABCA1 from returning to the cell surface, instead re-directing it to lysosomes;
reduced ABCA1 abundance on plasma membrane promotes formation of more rafts. On the
other hand, Nef by itself may stimulate formation of rafts reducing abundance of non-raft
23
by guest, on July 2, 2018w
ww
.jlr.orgD
ownloaded from
compartment suitable for ABCA1, shifting a balance between plasma membrane and
intracellular ABCA1 toward the latter. However, ABCA1 does not accumulate in the
intracellular compartments; instead, with possible assistance of Nef, the flow of ABCA1
shifts toward lysosomes causing rapid degradation of ABCA1 (Fig. 9 B). Preventing
degradation of ABCA1 in the lysosomes apparently shifts the balance back toward the
plasma membrane. The result of this activity is two-fold: it promotes viral assembly and
infectivity, and it affects functional capacity of targeted cells, in particular macrophages.
This study implicates ABCA1 as a key molecule targeted by HIV to facilitate viral
propagation at the same time disabling cellular defences, and underscores the role of ABCA1
as an innate anti-HIV factor. The mechanisms described in this study may not be unique for
HIV and may be used by other microorganisms whose life cycles depend upon raft
cholesterol to achieve the same outcome.
Acknowledgements
The following reagent was obtained through the NIH AIDS Research and Reference
Reagent Program, Division of AIDS, NIAID, NIH: TZM-bl from Dr. John C. Kappes, Dr.
Xiaoyun Wu and Tranzyme Inc. N7 mouse macrophage cell line was obtained from the
Centre for AIDS Reagents (NIBSC).
This study was supported by the NIH grants HL093818, HL101274 and AI078743 (MB
and DS), grant from the National Health and Medical Research Council of Australia 526615
(DS and MB) and in part by the Victorian Government’s OIS Program and by the District of
Columbia Developmental Centre for AIDS Research (DC D-CFAR), an NIH-funded program
(1P30AI087714 - 01). DS is a Fellow of the National Health and Medical Research Council
of Australia (grant 586607).
24
by guest, on July 2, 2018w
ww
.jlr.orgD
ownloaded from
References:
1. Bukrinsky, M., and D. Sviridov. 2006. Human immunodeficiency virus infection and
macrophage cholesterol metabolism. J. Leukoc. Biol. 80: 1044-1051.
2. Rose, H., J. Hoy, I. Woolley, U. Tchoua, M. Bukrinsky, A. Dart, and D. Sviridov.
2008. HIV infection and high density lipoprotein metabolism. Atherosclerosis 199: 79-86.
3. Mujawar, Z., H. Rose, M. P. Morrow, T. Pushkarsky, L. Dubrovsky, N.
Mukhamedova, Y. Fu, A. Dart, J. M. Orenstein, Y. V. Bobryshev, M. Bukrinsky, and D.
Sviridov. 2006. Human Immunodeficiency Virus Impairs Reverse Cholesterol Transport
from Macrophages. PLoS Biology 4: e365.
4. Fitzgerald, M. L., Z. Mujawar, and N. Tamehiro. 2010. ABC transporters,
atherosclerosis and inflammation. Atherosclerosis 211: 361-370.
5. Asztalos, B. F., Z. Mujawar, M. P. Morrow, A. Grant, T. Pushkarsky, C. Wanke, R.
Shannon, M. Geyer, F. Kirchhoff, D. Sviridov, M. L. Fitzgerald, M. Bukrinsky, and K. G.
Mansfield. 2010. Circulating Nef induces dyslipidemia in simian immunodeficiency virus-
infected macaques by suppressing cholesterol efflux. J. Infect. Dis. 202: 614-623.
6. Morrow, M. P., A. Grant, Z. Mujawar, L. Dubrovsky, T. Pushkarsky, Y. Kiselyeva, L.
Jennelle, N. Mukhamedova, A. T. Remaley, F. Kashanchi, D. Sviridov, and M. Bukrinsky.
2010. Stimulation of the Liver X Receptor Pathway Inhibits HIV-1 Replication via Induction
of ATP-Binding Cassette Transporter A1. Mol. Pharmacol. 78: 215-225.
7. Arora, V. K., B. L. Fredericksen, and J. V. Garcia. 2002. Nef: agent of cell
subversion. Microbes Infect 4: 189-199.
8. Zheng, Y. H., A. Plemenitas, C. J. Fielding, and B. M. Peterlin. 2003. Nef increases
the synthesis of and transports cholesterol to lipid rafts and HIV-1 progeny virions. Proc.
Natl. Acad. Sci. U S A 100: 8460-8465.
25
by guest, on July 2, 2018w
ww
.jlr.orgD
ownloaded from
9. van 't Wout, A. B., J. V. Swain, M. Schindler, U. Rao, M. S. Pathmajeyan, J. I.
Mullins, and F. Kirchhoff. 2005. Nef induces multiple genes involved in cholesterol synthesis
and uptake in human immunodeficiency virus type 1-infected T cells. J. Virol. 79: 10053-
10058.
10. Zheng, Y. H., A. Plemenitas, T. Linnemann, O. T. Fackler, and B. M. Peterlin. 2001.
Nef increases infectivity of HIV via lipid rafts. Curr. Biol. 11: 875-879.
11. Giese, S. I., I. Woerz, S. Homann, N. Tibroni, M. Geyer, and O. T. Fackler. 2006.
Specific and distinct determinants mediate membrane binding and lipid raft incorporation of
HIV-1(SF2) Nef. Virology 355: 175-191.
12. Gerlach, H., V. Laumann, S. Martens, C. F. Becker, R. S. Goody, and M. Geyer.
2010. HIV-1 Nef membrane association depends on charge, curvature, composition and
sequence. Nat Chem Biol 6: 46-53.
13. Brugger, B., E. Krautkramer, N. Tibroni, C. E. Munte, S. Rauch, I. Leibrecht, B.
Glass, S. Breuer, M. Geyer, H. G. Krausslich, H. R. Kalbitzer, F. T. Wieland, and O. T.
Fackler. 2007. Human immunodeficiency virus type 1 Nef protein modulates the lipid
composition of virions and host cell membrane microdomains. Retrovirology 4: 70.
14. Cooke, S. J., K. Coates, C. H. Barton, T. E. Biggs, S. J. Barrett, A. Cochrane, K.
Oliver, J. A. McKeating, M. P. Harris, and D. A. Mann. 1997. Regulated expression vectors
demonstrate cell-type-specific sensitivity to human immunodeficiency virus type 1 Nef-
induced cytostasis. J. Gen. Virol. 78 ( Pt 2): 381-392.
15. Mukhamedova, N., Y. Fu, M. Bukrinsky, A. T. Remaley, and D. Sviridov. 2007. The
Role of Different Regions of ATP-Binding Cassette Transporter A1 in Cholesterol Efflux.
Biochemistry 46: 9388-9398.
16. Neufeld, E. B., A. T. Remaley, S. J. Demosky, J. A. Stonik, A. M. Cooney, M.
Comly, N. K. Dwyer, M. Zhang, J. Blanchette-Mackie, S. Santamarina-Fojo, and H. B.
26
by guest, on July 2, 2018w
ww
.jlr.orgD
ownloaded from
Brewer, Jr. 2001. Cellular Localization and Trafficking of the Human ABCA1 Transporter. J.
Biol. Chem. 276: 27584-27590.
17. Brace, R. J., B. Sorrenson, D. Sviridov, and S. P. A. McCormick. 2010. A gel-based
method for purification of apolipoprotein A-I from small volumes of plasma. J. Lipid Res. 51:
3370-3376.
18. Wei, X., J. M. Decker, H. Liu, Z. Zhang, R. B. Arani, J. M. Kilby, M. S. Saag, X. Wu,
G. M. Shaw, and J. C. Kappes. 2002. Emergence of resistant human immunodeficiency virus
type 1 in patients receiving fusion inhibitor (T-20) monotherapy. Antimicrob. Agents.
Chemother. 46: 1896-1905.
19. Sviridov, D., N. Fidge, G. Beaumier-Gallon, and C. Fielding. 2001. Apolipoprotein
A-I stimulates the transport of intracellular cholesterol to cell-surface cholesterol-rich
domains (caveolae). Biochem. J. 358: 79-86.
20. Mukhamedova, N., G. Escher, W. D'Souza, U. Tchoua, A. Grant, Z. Krozowski, M.
Bukrinsky, and D. Sviridov. 2008. Enhancing apolipoprotein A-I-dependent cholesterol
efflux elevates cholesterol export from macrophages in vivo. J. Lipid Res. 49: 2312-2322.
21. Patlolla, J. M., M. V. Swamy, J. Raju, and C. V. Rao. 2004. Overexpression of
caveolin-1 in experimental colon adenocarcinomas and human colon cancer cell lines. Oncol
Rep 11: 957-963.
22. Le Lay, S., Q. Li, N. Proschogo, M. Rodriguez, K. Gunaratnam, S. Cartland, C.
Rentero, W. Jessup, T. Mitchell, and K. Gaus. 2009. Caveolin-1-dependent and -independent
membrane domains. J. Lipid Res. 50: 1609-1620.
23. Gaus, K., T. Zech, and T. Harder. 2006. Visualizing membrane microdomains by
Laurdan 2-photon microscopy. Mol. Membr. Biol. 23: 41-48.
24. Owen, D. M., C. Rentero, A. Magenau, A. Abu-Siniyeh, and K. Gaus. 2011.
Quantitative imaging of membrane lipid order in cells and organisms. Nat. Protoc. 7: 24-35.
27
by guest, on July 2, 2018w
ww
.jlr.orgD
ownloaded from
25. Nieland, T. J. F., A. Chroni, M. L. Fitzgerald, Z. Maliga, V. I. Zannis, T.
Kirchhausen, and M. Krieger. 2004. Cross-inhibition of SR-BI- and ABCA1-mediated
cholesterol transport by the small molecules BLT-4 and glyburide. J. Lipid Res. 45: 1256-
1265.
26. Rigamonti, E., G. Chinetti-Gbaguidi, and B. Staels. 2008. Regulation of Macrophage
Functions by PPAR-{alpha}, PPAR-{gamma}, and LXRs in Mice and Men. Arterioscler.
Thromb. Vasc. Biol. 28: 1050-1059.
27. Rauch, S., K. Pulkkinen, K. Saksela, and O. T. Fackler. 2008. Human
immunodeficiency virus type 1 Nef recruits the guanine exchange factor Vav1 via an
unexpected interface into plasma membrane microdomains for association with p21-activated
kinase 2 activity. J. Virol. 82: 2918-2929.
28. Djordjevic, J. T., S. D. Schibeci, G. J. Stewart, and P. Williamson. 2004. HIV type 1
Nef increases the association of T cell receptor (TCR)-signaling molecules with T cell rafts
and promotes activation-induced raft fusion. AIDS Res Hum Retroviruses 20: 547-555.
29. Mendez, A. J., G. Lin, D. P. Wade, R. M. Lawn, and J. F. Oram. 2001. Membrane
lipid domains distinct from cholesterol/sphingomyelin-rich rafts are involved in the ABCA1-
mediated lipid secretory pathway. J. Biol. Chem. 276: 3158-3166.
30. daSilva, L. L., R. Sougrat, P. V. Burgos, K. Janvier, R. Mattera, and J. S. Bonifacino.
2009. Human immunodeficiency virus type 1 Nef protein targets CD4 to the multivesicular
body pathway. J. Virol. 83: 6578-6590.
31. Yvan-Charvet, L., N. Wang, and A. R. Tall. 2010. Role of HDL, ABCA1, and
ABCG1 Transporters in Cholesterol Efflux and Immune Responses. Arterioscler. Thromb.
Vasc. Biol. 30: 139-143.
32. Koseki, M., K.-i. Hirano, D. Masuda, C. Ikegami, M. Tanaka, A. Ota, J. C. Sandoval,
Y. Nakagawa-Toyama, S. B. Sato, T. Kobayashi, Y. Shimada, Y. Ohno-Iwashita, F.
28
by guest, on July 2, 2018w
ww
.jlr.orgD
ownloaded from
Matsuura, I. Shimomura, and S. Yamashita. 2007. Increased lipid rafts and accelerated
lipopolysaccharide-induced tumor necrosis factor-{alpha} secretion in Abca1-deficient
macrophages. J. Lipid Res. 48: 299-306.
33. Landry, Y. D., M. Denis, S. Nandi, S. Bell, A. M. Vaughan, and X. Zha. 2006. ATP-
binding Cassette Transporter A1 Expression Disrupts Raft Membrane Microdomains through
Its ATPase-related Functions. J. Biol. Chem. 281: 36091-36101.
34. Manes, S., G. del Real, and A. C. Martinez. 2003. Pathogens: raft hijackers. Nat. Rev.
Immunol. 3: 557-568.
35. Mujawar, Z., N. Tamehiro, A. Grant, D. Sviridov, M. Bukrinsky, and M. L.
Fitzgerald. 2010. Mutation of the ATP Cassette Binding Transporter A1 (ABCA1) C-
Terminus Disrupts HIV-1 Nef Binding but Does Not Block the Nef Enhancement of ABCA1
Protein Degradation. Biochemistry 49: 8338-8349.
36. Nagao, G., K. Ishii, K. Hirota, K. Makino, and H. Terada. 2010. Role of lipid rafts in
phagocytic uptake of polystyrene latex microspheres by macrophages. Anticancer. Res. 30:
3167-3176.
37. Kedzierska, K., J. Mak, A. Jaworowski, A. Greenway, A. Violo, H. T. Chan, J.
Hocking, D. Purcell, J. S. Sullivan, J. Mills, and S. Crowe. 2001. nef-deleted HIV-1 inhibits
phagocytosis by monocyte-derived macrophages in vitro but not by peripheral blood
monocytes in vivo. AIDS 15: 945-955.
38. Roeth, J. F., and K. L. Collins. 2006. Human immunodeficiency virus type 1 Nef:
adapting to intracellular trafficking pathways. Microbiol. Mol. Biol. Rev. 70: 548-563.
29
by guest, on July 2, 2018w
ww
.jlr.orgD
ownloaded from
FOOTNOTES
2These authors contributed equally to the study.
3Current address: Harvard School of Public Health AIDS Initiative, Department of
Immunology and Infectious Diseases, Harvard School of Public Health, Boston, MA, USA.
Abbreviations: ABCA1, ATP binding cassette transporter A1; AcLDL, acetylated LDL;
CT-B, cholera toxin subunit B; GP, generalized polarization; LAMP-1, lysosome-associated
membrane protein-1; LXR, liver X receptor; MDM, monocyte-derived macrophages; PBL,
peripheral blood leukocytes; PDM, product of the differences from the mean.
30
by guest, on July 2, 2018w
ww
.jlr.orgD
ownloaded from
FIGURE LEGENDS
Figure 1. Analysis of cholesteryl ester biosynthesis in RAW 264.7 and N7 cells. A –
Nef expression in N7 cells. N7 cells were incubated for the indicated periods of time with
CdCl2 (10 μMol/L) and the abundance of Nef in total cell lysate was analysed by Western
Blot. Left lane – lysate of RAW 264.7 cells. B – The effect of transfection of N7 cells with
siRNA on the abundance of Nef. siRNAC – control (scrambled) siRNA, siRNANef – siRNA to
Nef. C- Cholesteryl ester biosynthesis assessed as described in Materials and Methods. Both
N7 and RAW 264.7 cells were treated with CdCl2. Mean ± SEM of quadruplicate
determinations are presented. *p<0.05 (versus RAW 264.7 cells); #p<0.01 (versus un-
transfected N7 cells).
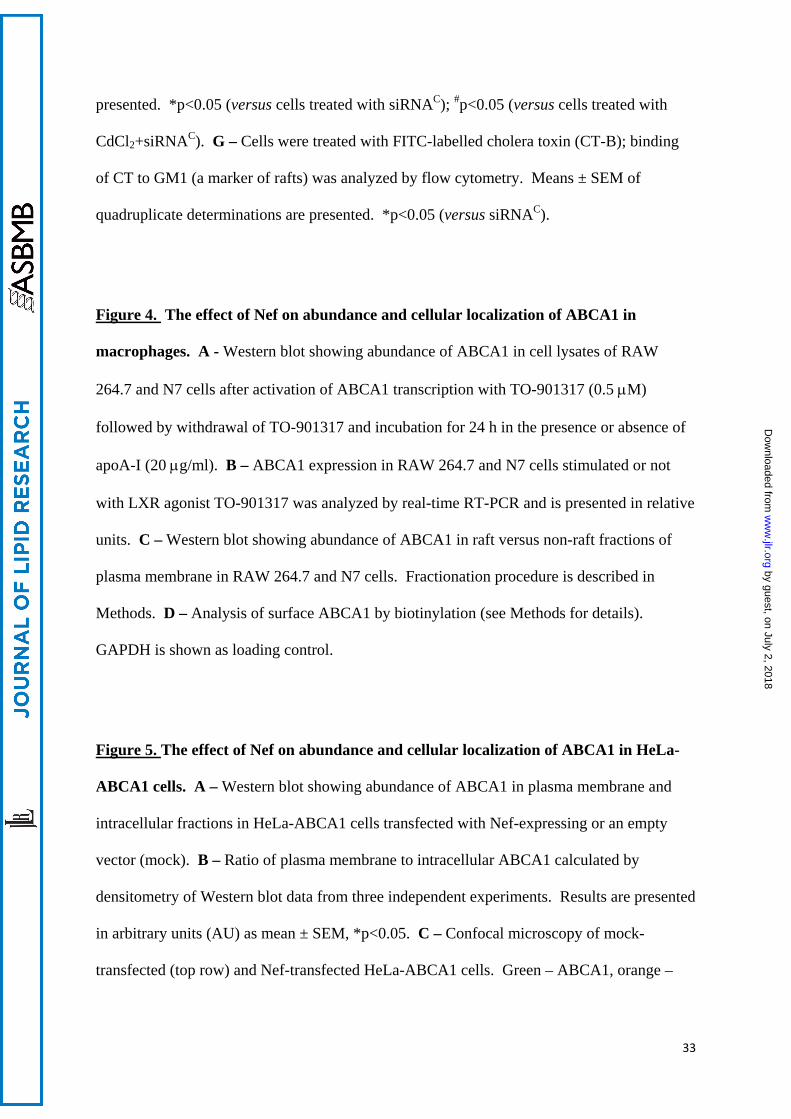
Figure 2. Nef induces transport of cholesterol to lipid rafts. A – RAW 264.7 cells, N7
cells and N7 cells activated with CdCl2 were treated with cholera toxin B subunit (0.5 μg/ml);
binding of CT-B to GM1 (a marker of rafts) was analyzed by flow cytometry. Results are
presented as Mean Fluorescence Intensity ± SEM of quadruplicate determinations. *p<0.05
(versus RAW 264.7 cells), #p<0.01 (versus N7 cells). B - RAW 264.7 cells, N7 cells and N7
cells activated with CdCl2 were labelled with [3H]cholesterol and treated with cholesterol
oxidaze for 3 h on ice as described in Methods. Lipids were extracted and separated using
TLC. Ratio of [3H]oxysterol to [3H]cholesterol is an indication of susceptibility of plasma
membrane cholesterol to oxidation by extracellular cholesterol oxidase reflecting proportion
of cholesterol in cholesterol-rich domains. Mean ± SEM of quadruplicate determinations are
presented. *p<0.05 (versus RAW 264.7 cells). C - RAW 264.7 cells, N7 cells and N7 cells
activated with CdCl2 were stained with Laurdan dye (5 µM) and GP value at the plasma
membrane was analyzed in 20 images using 2-photon microscopy as described in Methods.
31
by guest, on July 2, 2018w
ww
.jlr.orgD
ownloaded from
*p<0.05 (versus RAW 264.7 cells). ). D – Monocyte-derived macrophages were infected or
not with HIV-1 ADA and 14 days post infection were treated with FITC-conjugated CT-B at
4oC. Results are presented as a contour plot.
Figure 3. The effect of ABCA1 trafficking inhibitors and ABCA1 knockdown on raft
abundance. A-D - The effect of ABCA1-dependent trafficking inhibitors on cholesterol
efflux and raft abundance. RAW 264.7 (A, C) or N7 (B, D) cells were labelled with
[3H]cholesterol, treated with a CdCl2, and treated for 4 h with one of the BLT compounds
(final concentration 10 μM for BLT-1 and 80 μM for BLT-4) or a vehicle. Cells were then
washed and incubated with apoA-I (20 μg/ml) for 2 h and cholesterol efflux was measured as
described in Methods (A, B). Alternatively, cells were treated with cholesterol oxidase for 3
h on ice and oxidation of plasma membrane cholesterol was assessed as described in Methods
(C, D). A-D - Mean ± SEM of quadruplicate determinations are presented. A - *p<0.05
(versus vehicle); B - #p<0.01 (versus RAW 264.7 cells treated with vehicle), *p<0.05 (versus
N7 cells treated with vehicle); C – no significant differences between groups; D - #p<0.01
(versus RAW 264.7 cells treated with vehicle), *p<0.01 (versus N7 cells treated under
identical conditions). E-G - RAW 264.7 or N7 cells were treated with CdCl2, labelled with
[3H]cholesterol and either mock-transfected or transfected with ABCA1 siRNA
(siRNAABCA1) or a control siRNA (siRNAC) as described in Methods. E – Western blot
showing ABCA1 abundance in cell lysate of activated RAW 264.7 and N7 cells, un-
transfected (control) or transfected with scrambled siRNA (siRNAc) or ABCA1 siRNA
(siRNAABCA1); abundance of GAPDH was used as loading control. F - Cells were treated
with cholesterol oxidase for 3 h on ice and oxidation of plasma membrane cholesterol was
assessed as described in Methods. Means ± SEM of quadruplicate determinations are
32
by guest, on July 2, 2018w
ww
.jlr.orgD
ownloaded from
presented. *p<0.05 (versus cells treated with siRNAC); #p<0.05 (versus cells treated with
CdCl2+siRNAC). G – Cells were treated with FITC-labelled cholera toxin (CT-B); binding
of CT to GM1 (a marker of rafts) was analyzed by flow cytometry. Means ± SEM of
quadruplicate determinations are presented. *p<0.05 (versus siRNAC).
Figure 4. The effect of Nef on abundance and cellular localization of ABCA1 in
macrophages. A - Western blot showing abundance of ABCA1 in cell lysates of RAW
264.7 and N7 cells after activation of ABCA1 transcription with TO-901317 (0.5 μM)
followed by withdrawal of TO-901317 and incubation for 24 h in the presence or absence of
apoA-I (20 μg/ml). B – ABCA1 expression in RAW 264.7 and N7 cells stimulated or not
with LXR agonist TO-901317 was analyzed by real-time RT-PCR and is presented in relative
units. C – Western blot showing abundance of ABCA1 in raft versus non-raft fractions of
plasma membrane in RAW 264.7 and N7 cells. Fractionation procedure is described in
Methods. D – Analysis of surface ABCA1 by biotinylation (see Methods for details).
GAPDH is shown as loading control.
Figure 5. The effect of Nef on abundance and cellular localization of ABCA1 in HeLa-
ABCA1 cells. A – Western blot showing abundance of ABCA1 in plasma membrane and
intracellular fractions in HeLa-ABCA1 cells transfected with Nef-expressing or an empty
vector (mock). B – Ratio of plasma membrane to intracellular ABCA1 calculated by
densitometry of Western blot data from three independent experiments. Results are presented
in arbitrary units (AU) as mean ± SEM, *p<0.05. C – Confocal microscopy of mock-
transfected (top row) and Nef-transfected HeLa-ABCA1 cells. Green – ABCA1, orange –
33
by guest, on July 2, 2018w
ww
.jlr.orgD
ownloaded from
LAMP-1. D – Quantitation of the co-localization of ABCA1 and LAMP-1 was performed by
Volocity Software. *p<0.05 versus mock-transfected cells.
Figure 6. The effect of chloroquine on Nef-induced downregulation of ABCA1 and
cholesterol efflux. A – Western blot showing abundance of ABCA1 in HeLa-ABCA1 cells
transfected with Nef or empty vector (mock) and treated or not treated with chloroquine (50
μM). B – Densitometry of the ABCA1-specific bands. Results are presented as mean ±
SEM of four independent experiments similar to that shown in Fig. 4A. *p<0.05. C -
Cholesterol efflux to apoA-I from HeLa-ABCA1 transfected with Nef or an empty vector and
treated or not treated with chloroquine (50 μM). Results are presented as mean ± SEM of
three independent experiments, *p<0.01.
Figure 7. The effect of Nef on macrophage functions. A – Binding (4oC) and
internalization (37oC) of FITC-labelled cholera toxin (CT-B) by CdCl2-treated N7 and RAW
264.7 cells. Results are presented as mean fluorescence intensity of one representative
experiment out of two performed. *p<0.001 (versus 4oC). B - LPS-stimulated phagocytosis
in RAW 264.7 cells and N7 cells activated or not with CdCl2 was assessed by measuring
fluorescence of pHrodo pH-sensitive particles (Invitrogen). Results are presented as mean
fluorescent intensity ± SEM of three independent experiments, *p<0.001. C - Unstimulated
phagocytosis in RAW 264.7 cells and N7 cells activated or not with CdCl2. Results are
presented as mean fluorescent intensity ± SEM of three independent experiments, *p<0.001.
Figure 8. Analysis of HIV-1 infectivity. A – Western blot showing ABCA1 abundance in
human monocyte-derived macrophages (MDM) and peripheral blood leukocytes (PBL) with
or without activation with LXR agonist TO-901317 (1 μM). B – HIV-1 ADA collected from
MDM and PBL was normalized by p24 content, and viral infectivity was tested on TZM-bl
34
by guest, on July 2, 2018w
ww
.jlr.orgD
ownloaded from
indicator cells by measuring luciferase activity. MDM were transfected with ABCA1-
directed or control siRNA (see Methods). Results of one representative experiment out of
three performed with cells from different donors are presented in Relative Luminescence
Units (RLU) as mean ± SEM of triplicate determinations, *p<0.01 (versus PBL). #p<0.01
(versus siRNAC).
Figure 9. Proposed model of the effect of Nef on ABCA1 abundance. A – Under normal
circumstances ABCA1 (A) re-circulates between plasma membrane, where it is located in
non-raft compartments (rafts – R), and intracellular compartment, mainly early endosomes
(EE), late endocytic vesicles, (LEV) and lysosomes (L). B- Nef may affect re-circulation by
preventing ABCA1 from returning to the cell surface, instead re-directing it to lysosomes;
reduced ABCA1 abundance on plasma membrane leads to the formation of more rafts. Nef
may also stimulate formation of rafts by reducing the abundance of non-raft compartment
suitable for ABCA1, thus shifting a balance between plasma membrane and intracellular
ABCA1 toward the latter. ABCA1 that is unable to reach plasma membrane is also re-
directed to lysosomes, possibly with the assistance of Nef.
35
by guest, on July 2, 2018w
ww
.jlr.orgD
ownloaded from

Figure 1
25
MW (kDa)
0 4 8 18 24 30 48RAW
A
Time (h)B
Non-transfected
siRNAc
siRNANef #1
siRNANef #1
siRNANef #2
siRNANef #2
siRNANef #3
siRNANef #3
C20 nM 30 nM
[14C
]ole
ate
Inco
rpor
atio
n in
to C
hols
eter
yl E
ster
s(d
pm/m
g ce
ll pr
otei
n x1
03 )
0
5
10
15
20
25RAW 264.7 N7
+ siRNANef
+ siRNAC
*
#
+ siRNANef
Control Control
36
by guest, on July 2, 2018w
ww
.jlr.orgD
ownloaded from
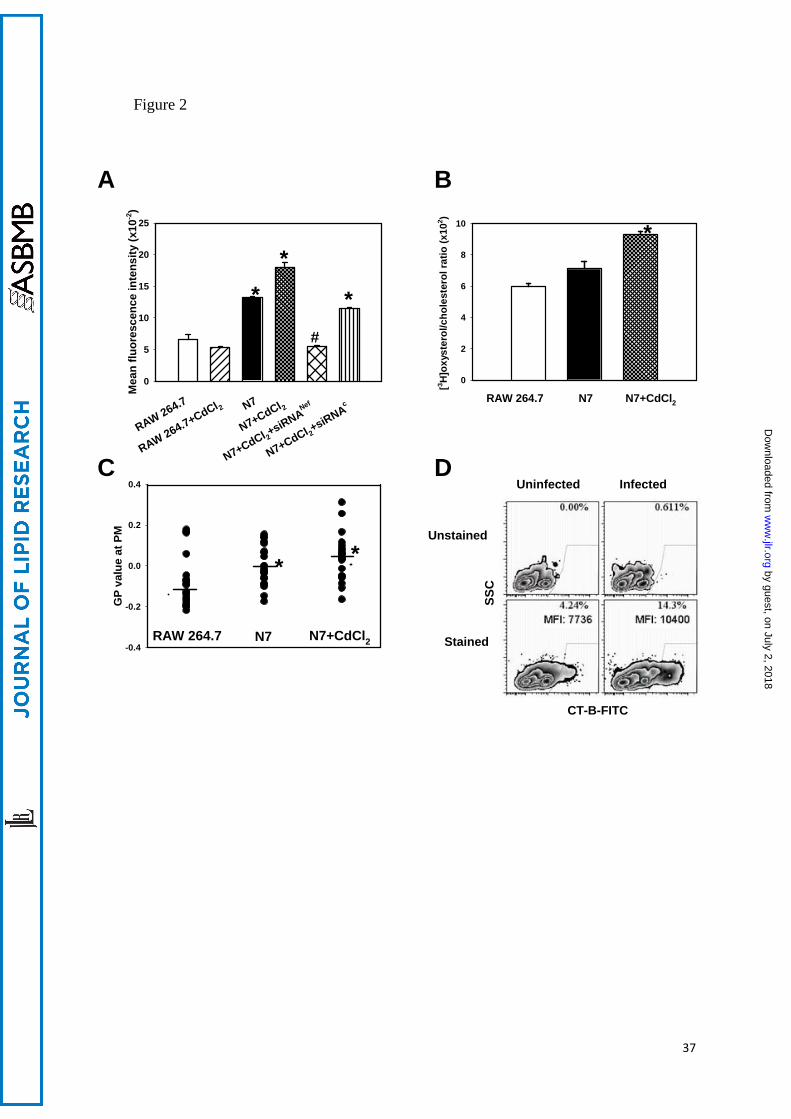
Figure 2
Mea
n flu
ores
cenc
e in
tens
ity (x
10-2
)G
P va
lue
at P
M
-0.4
-0.2
0.0
0.2
0.4
[3 H]o
xyst
erol
/cho
lest
erol
ratio
(x10
2 )
0
5
10
15
20
25
0
2
4
6
8
10 **
*
A B
* *
C
RAW 264.7 N7+CdCl2N7
#
DUninfected Infected
Unstained
Stained
CT-B-FITC
SSC
RAW 264.7
RAW 264.7+CdCl 2 N7
N7+CdCl 2
N7+CdCl 2+siRNA
Nef
N7+CdCl 2+siRNA
c RAW 264.7 N7 N7+CdCl2
*
37
by guest, on July 2, 2018w
ww
.jlr.orgD
ownloaded from
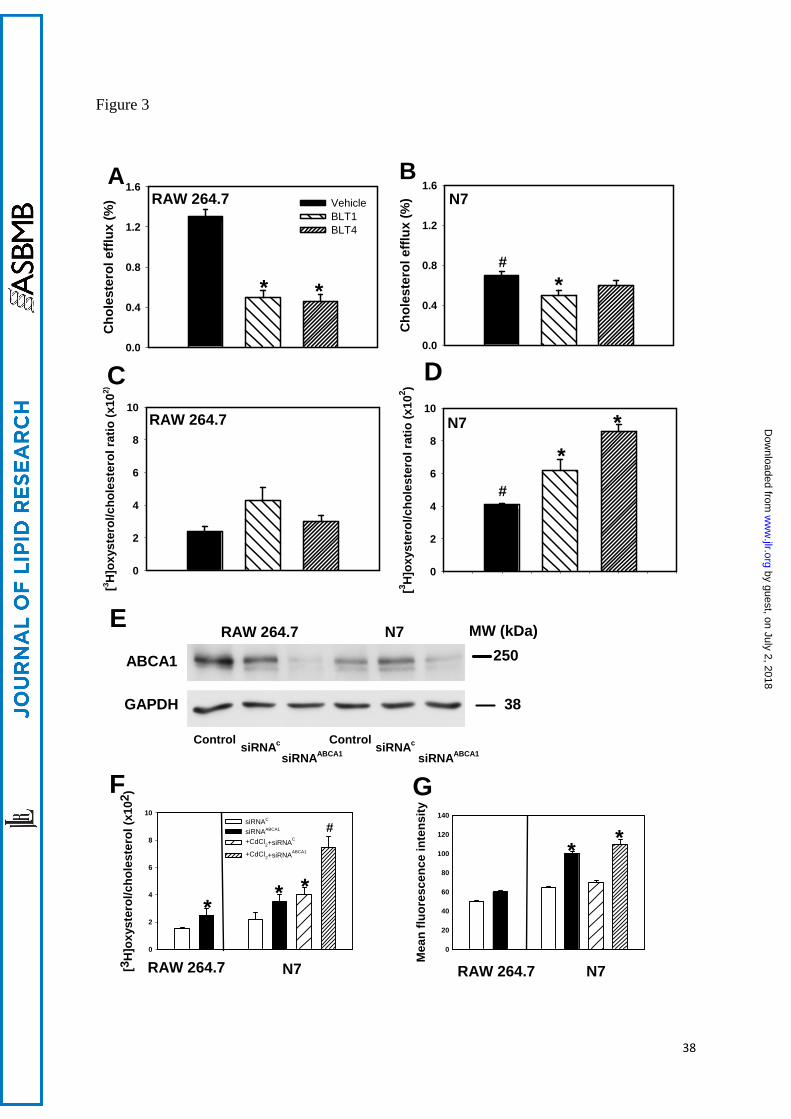
Figure 3
[3H
]oxy
ster
ol/c
hole
ster
ol (x
102 )
0
2
4
6
8
10siRNAC
siRNAABCA1
+CdCl2+siRNAC
+CdCl2+siRNAABCA1
Mea
n flu
ores
cenc
e in
tens
ity
0
20
40
60
80
100
120
140
N7RAW 264.7
**
*
#
*
MW (kDa)
siRNAc
*
siRNAABCA1
Cho
lest
erol
effl
ux (%
)
0.0
0.4
0.8
1.2
1.6VehicleBLT1BLT4
Cho
lest
erol
effl
ux (%
)
0.0
0.4
0.8
1.2
1.6
**
RAW 264.7 N7
*#
[3 H]o
xyst
erol
/cho
lest
erol
ratio
(x10
2)
0
2
4
6
8
10[3 H
]oxy
ster
ol/c
hole
ster
ol ra
tio (x
102 )
0
2
4
6
8
10*
*#
DCRAW 264.7 N7
A B
E
GF
RAW 264.7 N7
250ABCA1
38GAPDH
siRNAcControlsiRNAABCA1
Control
RAW 264.7 N7
38
by guest, on July 2, 2018w
ww
.jlr.orgD
ownloaded from
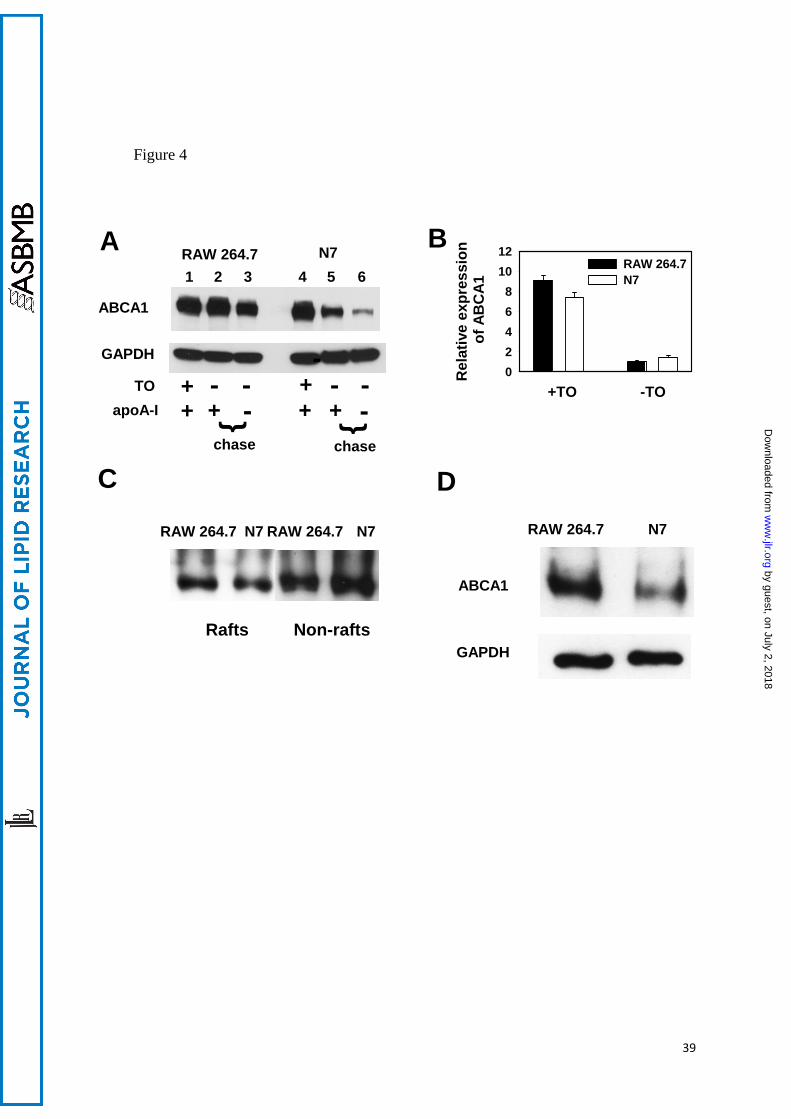
Figure 4
C
RAW 264.7 N7A
Rel
ativ
e ex
pres
sion
of A
BC
A1
02468
1012
RAW 264.7
ABCA1
GAPDHRafts Non-rafts
DRAW 264.7 N7 RAW 264.7 N7 RAW 264.7 N7
N7
B
+TO -TO
ABCA1
GAPDH
apoA-ITO + -
++
++ +-
--- -
-
1 4 532 6
chase
{
chase
{
39
by guest, on July 2, 2018w
ww
.jlr.orgD
ownloaded from
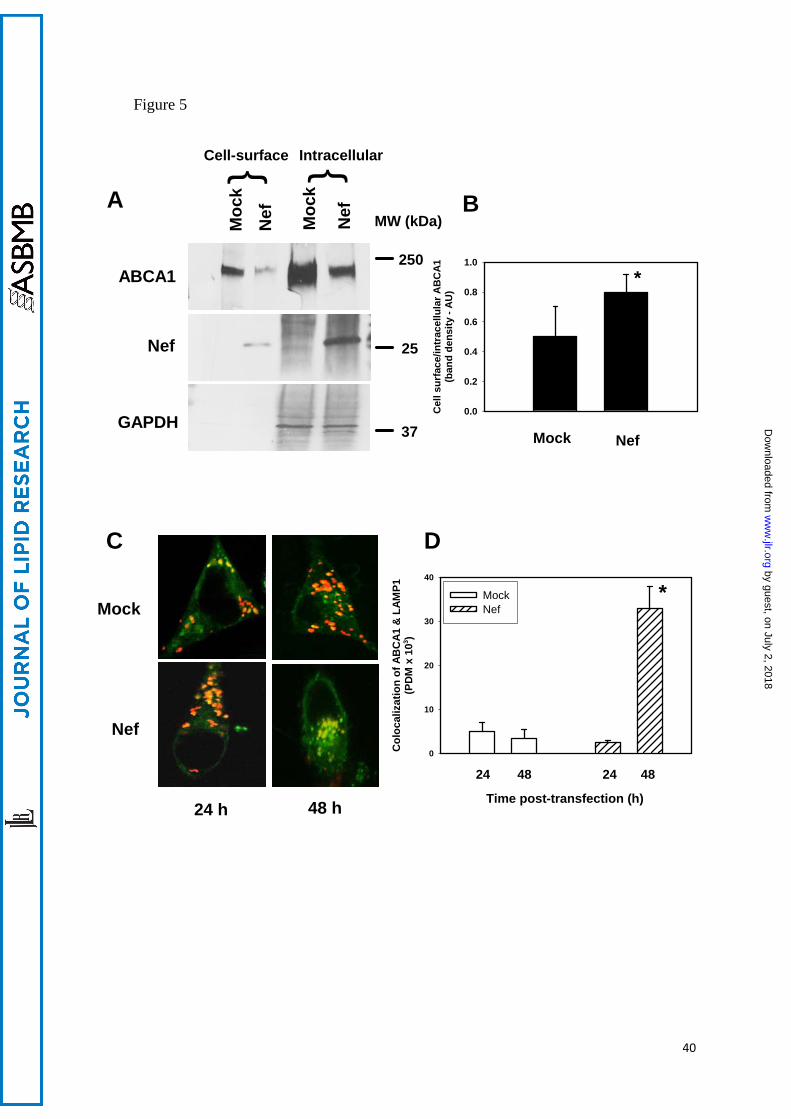
Figure 5
Col
ocal
izat
ion
of A
BC
A1 &
LAM
P1(P
DM
x 1
03 )
0
10
20
30
40
MockNef
Time post-transfection (h)
24 482448
B
C
Mock
Nef
24 h 48 h
*
ABCA1
Nef
GAPDH
Moc
k
Nef Moc
k
Nef
Cell-surface Intracellular} }
A
250
25
MW (kDa)
0.0
0.2
0.4
0.6
0.8
1.0
Cel
l sur
face
/intr
acel
lula
r AB
CA
1(b
and
dens
ity -
AU
)Mock Nef
D
*
37
40
by guest, on July 2, 2018w
ww
.jlr.orgD
ownloaded from
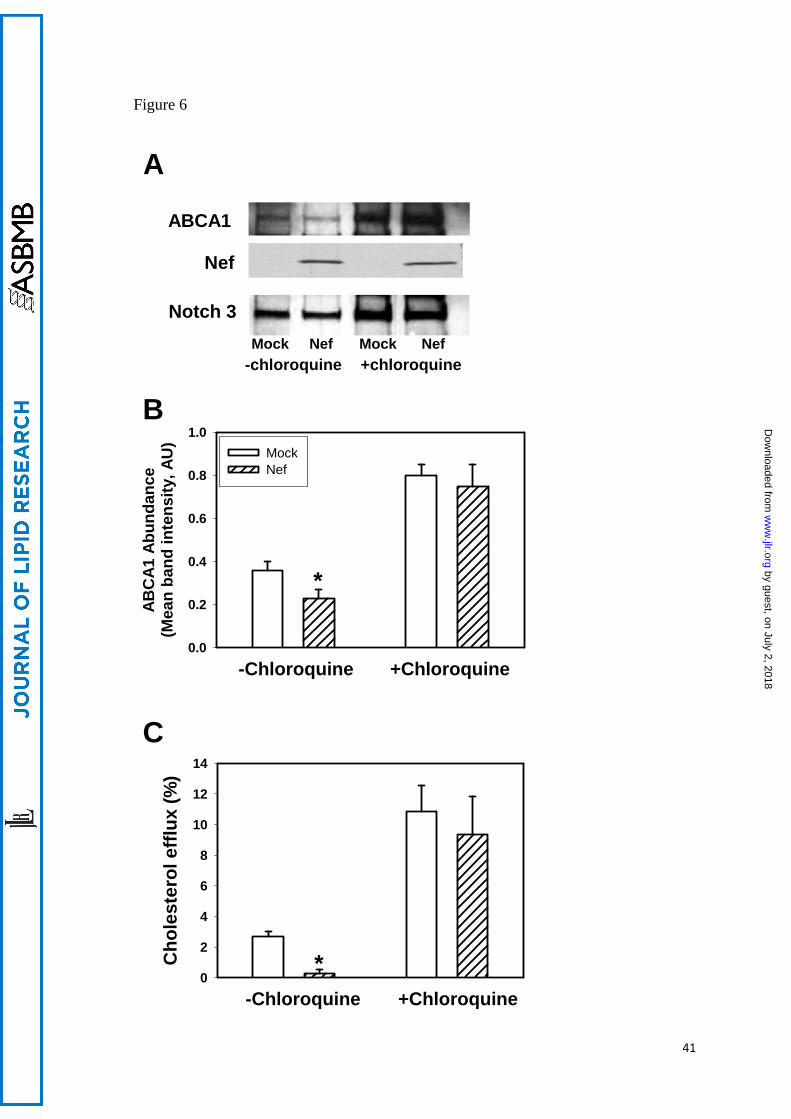
Figure 6
ABC
A1 A
bund
ance
(Mea
n ba
nd in
tens
ity, A
U)
0.0
0.2
0.4
0.6
0.8
1.0MockNef
Cho
lest
erol
effl
ux (%
)
0
2
4
6
8
10
12
14
*
A
*
C
B
-Chloroquine
-Chloroquine
+Chloroquine
+Chloroquine
ABCA1
Nef
Notch 3Mock MockNef Nef
-chloroquine +chloroquine
41
by guest, on July 2, 2018w
ww
.jlr.orgD
ownloaded from
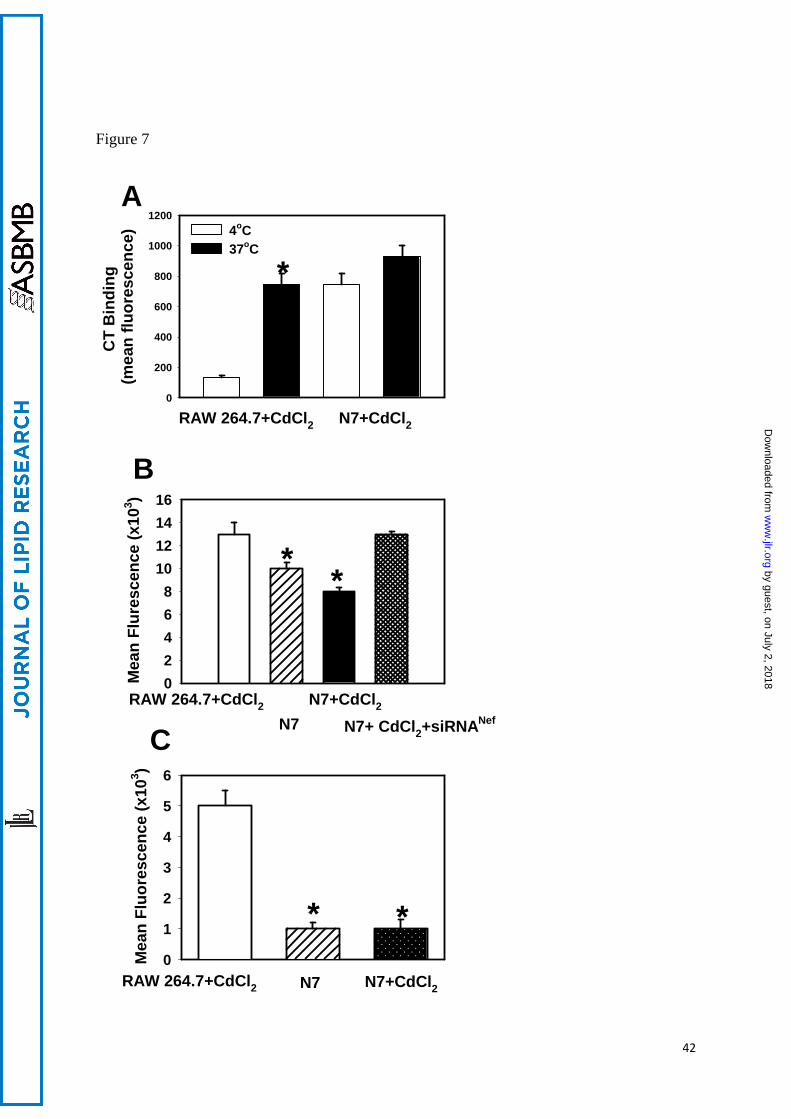
Figure 7
Mea
n Fl
ures
cenc
e (x
103 )
02468
10121416
Mea
n Fl
uore
scen
ce (x
103 )
0
1
2
3
4
5
6
B
A
**
0
200
400
600
800
1000
12004oC
CT
Bin
ding
(m
ean
fluor
esce
nce)
37oC
CRAW 264.7+CdCl2
N7N7+CdCl2
N7+ CdCl2+siRNANef
N7 N7+CdCl2
**
RAW 264.7+CdCl2
RAW 264.7+CdCl2 N7+CdCl2
*
42
by guest, on July 2, 2018w
ww
.jlr.orgD
ownloaded from
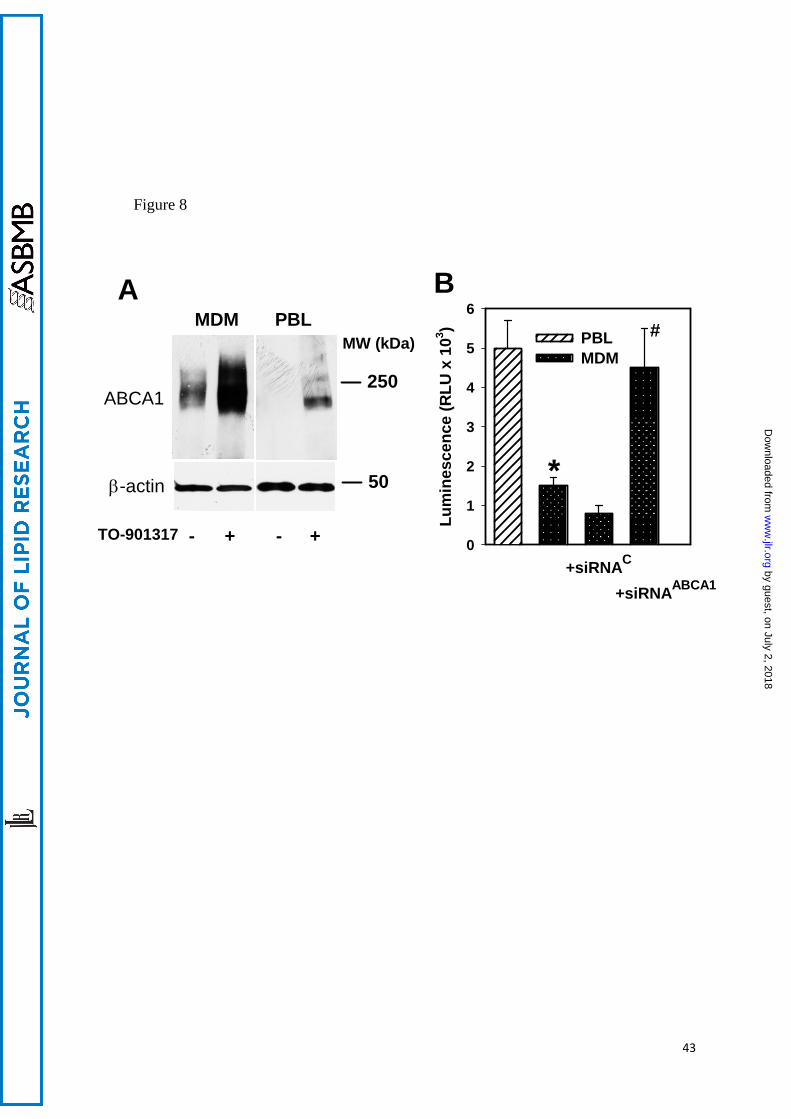
Figure 8
0
1
2
3
4
5
6
Lum
ines
cenc
e (R
LU x
103 )
PBLMW (kDa)
250MDM
50
TO-901317 + +- -
MDM PBLA B
+siRNAC
ABCA1
β-actin
+siRNAABCA1
#
*
43
by guest, on July 2, 2018w
ww
.jlr.orgD
ownloaded from