Embed Size (px)
Citation preview


History, the Past, and Public Culture: Results from a National Survey © 2021 by the American Historical Association A web version of this report and its underlying survey data are available on the American Historical Association website: http://historians.org/history-culture-survey Suggested citation: Peter Burkholder and Dana Schaffer, History, the Past, and Public Culture: Results from a National Survey (Washington, DC: American Historical Association, 2021).
The views expressed in this report are those of the authors and do not necessarily reflect views of the American Historical Association or its members. The authors acknowledge the generous financial support provided by the National Endowment for the Humanities, without which this study would not have been possible. Additional seed funding came from the provost’s office of Fairleigh Dickinson University.

Table of Contents History, the Past, and Public Culture | 2
Table of Contents
Project Leadership ........................................................................................................................................ 3
Introduction .................................................................................................................................................. 4
1. How does the public define “history”? ................................................................................................. 9 2. Why does the public care about the past (if it cares at all)? .............................................................. 14 3. Where do people get their history? .................................................................................................... 18 4. Which sources of the past are viewed as trustworthy? ..................................................................... 25 5. How does the public want to learn about the past? .......................................................................... 38 6. What have the public’s history education experiences been like? .................................................... 46 7. What aspects of the past does the public want to learn more about? .............................................. 53 8. How much does the public value the field of history and historians’ work? ..................................... 64 9. What are the public’s attitudes toward a changing and uncomfortable past? .................................. 77 10. Is there a link between historical outlooks and civic engagement? ................................................... 90
Appendix A. Survey Development and Methodology ........................................................................... 100 Appendix B. Survey Instrument and Topline Results ............................................................................ 101 Appendix C. Project Advisers ................................................................................................................ 110
Acknowledgments ..................................................................................................................................... 112

Project Leadership History, the Past, and Public Culture | 3
Project Leadership Peter Burkholder (PhD, University of Minnesota) is professor of history at Fairleigh Dickinson University. He has received distinguished faculty awards for both teaching and research at FDU, and he is the recipient of the American Historical Association’s William and Edwyna Gilbert Award for the best article on teaching the past. Burkholder serves on the national advisory board of the Society for History Education, the editorial board of The Teaching Professor, and the consulting editorial board of College Teaching. Dana Schaffer (MA, American University) is deputy director of the American Historical Association. Prior to joining the AHA staff in 2013, Schaffer served as the assistant director at the Gilder Lehrman Center for the Study of Slavery, Resistance, and Abolition at Yale University. She previously coordinated educational programs for the Smithsonian Associates and directed an oral history project on the 1968 unrest in Washington, DC. Schaffer currently serves as chair of the Advisory Committee for National History Day and as treasurer for the National Coalition for History.

Introduction History, the Past, and Public Culture | 4
Introduction This project aspired to take America’s historical pulse by assessing public perceptions of, and engagement with, the discipline of history and the past. Americans are clearly interested in history: consider for example the mere existence of a “History Channel” on television, the persistence of genealogy in popular culture, the ubiquity of history books on bestseller lists, and the unflagging popularity of films and video games that engage historical topics. Project leaders sought to lend some precision to the cluttered landscape of assumptions about the breadth and depth of this interest. We hope that our conclusions will help cultural organizations, K–12 and higher education institutions, state humanities councils, journalists, policymakers, and others better understand their audiences and broaden the relevance of historical work to public culture. A partnership between the American Historical Association and Fairleigh Dickinson University, with generous funding from the National Endowment for the Humanities, the project measured the American public’s perceptions and uses of history through a national poll. But this was not the first time such a survey has been conducted. Over 20 years ago, Roy Rosenzweig and David Thelen published a systematic attempt to measure the apparent disconnect between academic historians and the American public on experiences with and utilization of the past. The Presence of the Past: Popular Uses of History in American Life (1998) drew on a survey of 1,453 Americans, queried by telephone about their connections to the past and how those connections influenced daily life and hopes for the future. Far from being a “gotcha” quiz to show how ignorant Americans are of history (which itself has a long and sordid past), Rosenzweig and Thelen were primarily concerned with what people do know about history, why it is important, how they use it, and why it seems to diverge from academics’ own understandings and uses. Rosenzweig and Thelen’s work deeply influenced how historians thought about reaching audiences beyond the classroom and the academy for two decades. But it is precisely because of this influence that their study needed to be reconsidered, reconceptualized, and redone. This is especially important as history increasingly becomes a political football and social wedge issue, while approaching the 250th anniversary of the nation’s independence and an incumbent commemorative agenda that is responsive to public culture and historical consciousness. Although our initial intent was to provide a straightforward update to Rosenzweig and Thelen’s findings, it quickly became apparent that a neat replication would not be optimal. Too many changes had affected the public’s interactions and interests with the past, while other issues first raised by Rosenzweig and Thelen called for more in-depth investigation. Consultations with our diverse advisory board, as well as focus group sessions conducted at the 2019 annual meeting of the American Association of State and Local History (AASLH), resulted in a host of new issues that both puzzled and intrigued those working in history-related fields. A new survey instrument, albeit with overlaps with Rosenzweig and Thelen’s work, was needed to answer these novel questions and concerns. (More detailed information on this instrument, as well as how and to whom it was administered, can be found in Appendix A and Appendix B.) A new survey was all the more important since the general public now receives information about the past in ways that were only nascent (e.g., websites, 24-hour news channels) or simply did not exist (e.g., social media, podcasts, mass consumer DNA testing) when Rosenzweig and Thelen did their work.

Introduction History, the Past, and Public Culture | 5
Approaches to teaching history have likewise changed considerably in the interim, with some experimentation in moving from a predominant “coverage” methodology to a growing school of “historical thinking.” Such developments and changes might have had an impact on the American public’s perceptions of the past and/or engagement with history, but no one had attempted to measure them systematically. Growing political polarization, racist violence, and “history wars” to control the past and the teaching thereof added to our perception that we were operating in a climate considerably changed from the 1990s. If our findings and discussion sometimes seem to tilt toward these issues and the demographics that animate them, it is because of this unique moment in history that we are living through. In conducting such a survey, we found ourselves in good company. Two related reports issued in 2020 were also products of national-level investigations. More general in scope was The Humanities in American Life, published by the American Academy of Arts and Sciences, based on a poll of 5,015 adults. Though encompassing all humanities disciplines, the report’s findings are largely complementary to our own. A history-specific report from AASLH, Communicating about History: Challenges, Opportunities, and Emerging Recommendations, seeks ways to breach the divide between professional historians and the general public. In taking up the mantle of Rosenzweig and Thelen’s earlier study but shifting from a survey to a focus groups approach, AASLH’s work likewise has much in common with the present project. Researchers involved in both projects were tapped to serve on our own advisory board. Through the advisory committee meetings and focus groups and having logged more virtual sessions than we now care to remember, we ended up with a survey instrument addressing roughly 10 main issues that form the basis of this report. We aimed to provide as much survey data in user-friendly format as possible for these topics, including well over 150 charts illustrating our results. These include not only topline findings, but cross-tabulations for selected demographic groups or for correlations between poll questions. An alphanumeric code always appears in parentheses (D1, for example), referring the reader to the survey question in Appendix B upon which the illustrated data are based. Figures highlight notable differences, but sometimes point to similarities as well, which can be equally important. We hope these visualizations are more useful than a blizzard of numbers on a spreadsheet could ever be. Still, there are literally thousands of possible cross-tabulations from our data, and our report displays charts for only a fraction of them. For those with the desire and technical acumen, the complete raw survey data are available on the AHA website. Report Overview First, we sought to explore how the public defines “history.” Rosenzweig and Thelen made a strategic decision in their survey from the 1990s to substitute “the past” for “history,” on the basis that “history” was perhaps too formal, while “the past” might better resonate with respondents. Although true, the researchers ended up with personal experiences that sometimes strained the distinction, often recounting stories that clearly meant something to respondents but revealed evidence of limited understandings of broader contexts. As practitioners in the discipline, we wanted to know what history, with all its attendant baggage, means to the public. Our results in Section 1 show not only broad consensus on the matter, but more far-reaching implications for Americans’ curiosity about, and empathy for, the past and other people. The questions undergirding Section 2 were geared toward determining why the public cares about history, if it cares at all. Here, we found that various factors drove people to want to know more about

Introduction History, the Past, and Public Culture | 6
the past, including learning for learning’s sake, entertainment, and possibly for legacy reasons. Yet, we also discovered that a sizeable proportion of the public has no interest at all in learning history. Cross-tabulations reveal interesting variations between demographic groups on all these factors. Where people turn to for historical information is the focus of Section 3. As educators, we are susceptible to assuming an air of self-importance, expecting classrooms and teachers to be the go-to sources for anyone wanting to know more about the past. But of course, the public has a diverse and ever-expanding menu of possibilities, many of which bypass formal education settings and, for better or for worse, any sort of quality control. Knowing the relative frequencies of people’s utilization of these sources is vital to understanding what the public knows about the past, how and why it knows it, and how those in the history field might better engage broader society. Section 4 ascertains how trustworthy those diverse sources of the past are—at least in the public’s mind. In doing so, we follow in the footsteps of Rosenzweig and Thelen, who likewise measured trust in sources, though our own list of informants on the past is considerably expanded. We learned that levels of trust are often functions of respondents’ ages, races and ethnicities, and political party affiliations. We also found that the most trusted sources were not always the most utilized, suggesting that pursuit of truth is not necessarily at the top of the public’s mind when seeking historical information. We turned our attention in Section 5 to how the public prefers to learn history. Specifically, do people desire an unmediated experience, one where they personally consult texts and artifacts and draw their own conclusions? Or do they favor a more passive approach, one where an assumed expert does the heavy lifting of interpretation and simply reports it? Along with those measurements, we investigated the role of entertainment in the history learning process, especially whether learners felt amusement is an asset or detriment. Though ours were measures only of people’s learning preferences, not actual outcomes, the findings should provide educators and public historians with valuable information on audience expectations, realistic or otherwise. The state of history education at the high school and college levels comes under scrutiny in Section 6. In particular, do these settings emphasize knowledge of facts or historical thinking skills? Have these experiences been positive, negative, or incomplete? And what effect do these educational encounters have on learners’ desire to learn more about the past? As often happened, we found that respondents’ backgrounds often correlated with attitudes, setting up interesting cause-and-effect questions about the role of formal history education settings in shaping society’s views and values. Which aspects of history most interest people? Section 7 takes a two-pronged approach to this issue by first determining which sources of information most and least motivate the public to learn more about the past. Once again, the correlations between source utilization, trustworthiness, and ability to spark interest are not always in alignment. From there, we measured whether respondents view a variety of topics as equally or more important to baselines, and the degrees to which a selection of historical subjects intrigue them. Those working in the history discipline produce knowledge for the public, but is that information necessarily what people want to know? If not, where are the gaps? Section 8 provides some intriguing, if at times frustrating, answers to these questions. By comparing respondents’ views on the value of history education versus learning about other fields, we see where knowledge of the past rates. We

Introduction History, the Past, and Public Culture | 7
then asked whether historians seem to be giving adequate attention to a range of topics, with the results varying considerably by demographic group. Section 9 tackles the hot-button issue of historical revisionism. Do people expect our knowledge of the past to change? If so, why? And are the answers respondents gave a function of beliefs about what constitutes history? We then turn to the tendentious questions of whether history education should celebrate or question the nation’s past, and whether it is acceptable to make others uncomfortable by teaching about painful subjects. As one can imagine, there was considerable disagreement among subgroups, but some unexpected commonality, too. We close out the report in Section 10 with the question of how various outlooks on the past guide people’s civic engagement. Are there causal links? Are overlaps simply coincidental? Or are other factors even more important to fostering a participatory public? The survey data provide valuable food for thought. Each section begins with a summary of our findings and ends with the problems and opportunities we detect arising out of it. We have primarily focused on presenting the survey results clearly, drawing comparisons with other findings when appropriate, and making observations as they occurred to us. We suspect that readers will see many things that we did not, or will be able to explain some of our findings in ways that eluded us. When that happens, we hope those people will share their insights with the wider history community. The Plusses and Pitfalls of Polling Educators are well aware of the pros and cons of multiple-choice tests. On the plus side, the format allows one to assess familiarity with a broad range of subject matter quickly and efficiently. But a downside is that it is difficult to dig much below surface-level knowledge, to ask follow-up questions based on responses, and to understand the “how” and “why” of a person’s thinking. So it was with our poll, administered to an online probability panel of 1,816 adults. Take the public’s uses of, and trust in, sources of the past. The survey quite efficiently measured respondents’ relative utilization of a variety of sources, as well as people’s thoughts on those sources’ ability to convey truthful information. Although we learned that documentary films and television are the most frequently consulted fonts of historical content, we cannot be sure why that is the case, how much time people spend watching them, or what viewers learn from these sources. Moreover, we do not know which programs and films people are watching, let alone whether we would classify them as history-based or even documentaries. A follow-up survey or focus group sessions could tease out that information. The confidence that people place in sources of the past raises a related problem. Our poll measured only perceptions of trustworthiness, which should not be equated with an empirical measure of actual reliability. The same dynamic was attached to many other survey items, where having people register their attitudes was the goal. This does not mean that perceptions are unimportant. People make decisions all the time based on emotional responses, while believing their judgments are objective and evidence-driven. The past itself and the discipline of history can be both casualty and beneficiary of this phenomenon.

Introduction History, the Past, and Public Culture | 8
At base, this is a matter of direct versus indirect measures. Take the survey’s finding that most respondents believed they learn better when history is presented as entertainment. Although people clearly thought that to be the case (an indirect measure of learning), only scrutiny of their actual learning (a direct measure) could tell us whether the belief is grounded in reality. Once again, perceptions matter. But readers of this report should exercise caution when basing decisions on such findings. For instance, when a majority of people tell us that they actively investigate issues that conflict with extant knowledge, we are wary: confirmation bias is a powerful force. So, too, are the sophisticated algorithms used in search engines and social media to push users into like-minded spheres. There is a good chance that many respondents’ answers here are more aspirational than real, and that some survey answers reflect what the respondents think they should respond rather than what they actually believe. Conducting our survey in the fall of 2020, during the worst global pandemic in over a century, presented unique challenges. Eighty percent of our respondents indicated that movements in their communities had been somehow restricted, while plans to visit a museum or historic site were curtailed for 34 percent of them. Making things more complicated was the nation’s careening toward a hotly contested and divisive presidential election, further exacerbated by national protests and violence in the wake of George Floyd’s murder in Minneapolis. In the final analysis, it is impossible to disentangle our results from those factors. Yet as historians, we knew that no pristine moment of harmony, no golden oasis of reconciliation, was forthcoming, even if delaying the poll had been an option (it was not). We thus reasonably adjusted things as needed, such as extending the timeframe back to January 2019 (well before COVID-19 was on the radar) when asking about visits to museums and historic sites. Other results, such as partisan views on the celebration or questioning of US history, likely bear the marks of circumstance, but this is true of anything that records a snapshot in time. Indeed, one may find added value in this survey’s results as an artifact of the tumultuous context in which it was carried out. Pitfalls aside, we are hopeful, even confident, that our poll results offer valuable insights into the public’s views on, and uses of, history. That said, we are likewise aware that our efforts constitute just a small step on a never-ending journey, since any single fortuitous answer here inevitably leads to several other questions, with the latter often more vexing than the original. Perhaps we should recall the English writer and lexicographer Samuel Johnson as he reflected on his monumental dictionary project. Unable to achieve perfection or finality, he compared his plight to the ancient Arcadians chasing after the sun. For, try as they did, whenever they reached the crest of the hill upon which the sun appeared to sit, they found that it was still the same distance away.

How does the public define “history”? History, the Past, and Public Culture | 9
1. How does the public define “history”?
Summary: A sizeable majority of survey respondents equated “history” with nuts-and-bolts factual material as opposed to explanations about the past. That said, there are measurable differences in those views as a function of such factors as age and political affiliation. Moreover, those favoring an explanatory view of history showed signs of greater interest in, and perhaps empathy for, peoples and events far removed from the respondents.
Practicing historians probably have a good idea, even a sophisticated one, about what history is. But such definitions are likely complex and nuanced, and there is little reason to think that laypeople share them. A two-pronged goal of this survey was to determine how the public conceives of history and how such conceptions help shape other attitudes toward the past. Given a selection of five possibilities, two-thirds of the poll’s respondents indicated a belief that history is primarily an assembly of names, dates, and other facts about what happened in the past (Figure 1). This belief is not strictly incorrect, insofar as basic facts serve as building blocks of serious historical inquiry. Similarly, laypersons are sometimes heavily reliant on professional historians’ interpretations of the past, especially for distant events where methods and language may constitute formidable roadblocks. In such cases, understandings of history depend greatly on what historians say about it. Still, the public’s history-equals-facts outlook highlights a gulf between practicing historians and the audiences the former serve. While acknowledging the fundamental importance of facts, academics generally see history more as an explanation of past experiences. In fact, when Burkholder polled working historians and other professionals on this issue at a virtual AHA session in January 2021, the great majority selected the explanation’s definition, while nobody opted for facts. Yet only a small minority (17 percent) of those in the national survey shared professionals’ explanatory views (also Figure 1). Based on their survey from the 1990s, Rosenzweig and Thelen likewise perceived a disconnect between professional and amateur attitudes toward and uses of the past, suggesting that this dynamic remains largely unchanged in the aggregate. Subsequent studies by Sam Wineburg and others suggest that historians think about the past in fundamentally different ways than do nonhistorians, thus framing the issue as “historical thinking” as opposed to a basic mastery of factual material.
Figure 1: Survey respondents’ preferred best definitions for “history.” (D1)
66%5%
17%
9%
3%Names, dates, and other factsabout what happened in the past
What people remember about thepast
An explanation of experiences inthe past
What historians have concludedabout the past
Something else

How does the public define “history”? History, the Past, and Public Culture | 10
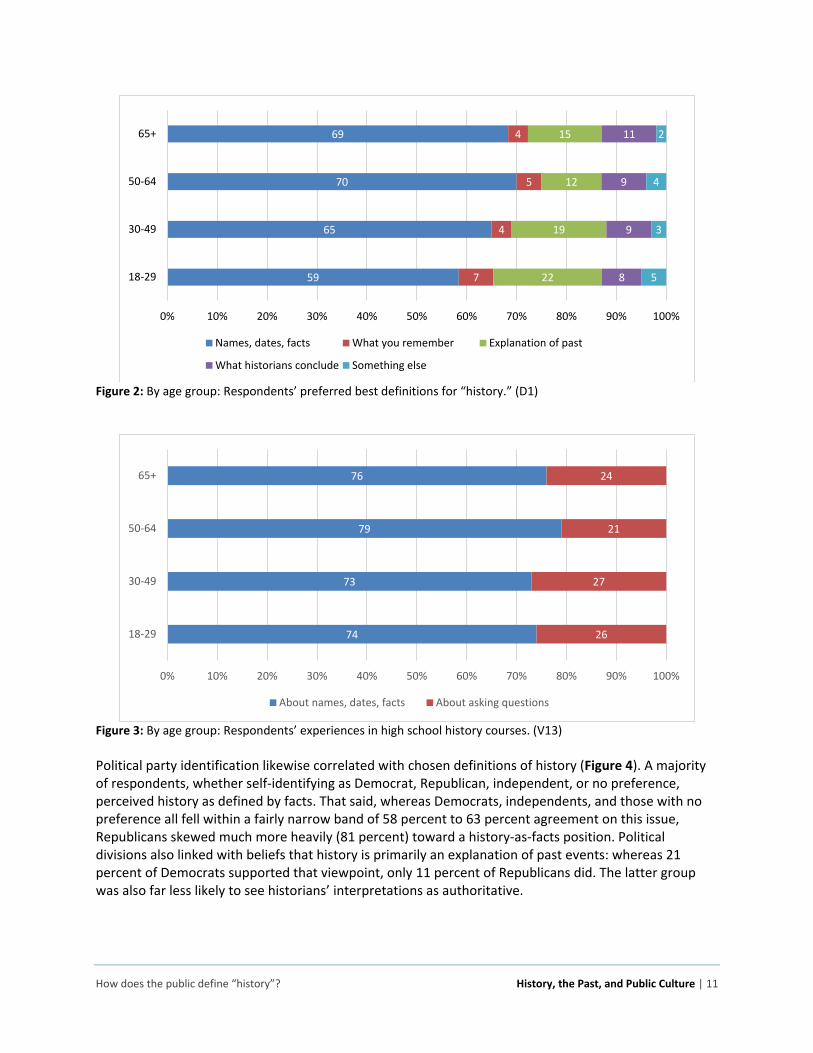
Lest respondents felt constrained by our five options, we included a text box to elicit alternative definitions or additional information from those who indicated that history is “something else.” Only 64 replied, meaning our sample is too small to draw any strong conclusions. Nevertheless, 15 of the responses (23 percent of the subset who offered additional information) indicated that history is some sort of combination of all the choices listed in the question. Several others used the open-ended option as an opportunity to voice a grievance. “History can be nothing more than lies and stories believed and written down as fact,” wrote one, while another opined that history is “written by the winners, most often neglecting to inform later readers of what or who else was affected.” Frustration with perceived subjectivity was evident. “History is the facts of the past without modern interpretations” is how one put it. Two others felt that history “is an incomplete view of the past, likely biased,” which “should be recorded without personal bias.” An additional response was emphatic that “History is what HAPPENED in the past, not what anyone thinks happened,” thereby eschewing any explanation component altogether. A handful seemed to push the facts stance to an extreme, as when a respondent said that history encompasses “all things that have occurred before the present moment,” joined by another’s belief that anything from one second in the past “all the way to billions of years ago” is fair game. Countering that ecumenical view was a belief that history is “long enough ago to be able to see and understand the impact,” or, as another stated, “long enough in the past that the only real witnesses are dead.” Other responses underscored the importance of evidence and human agency in making sense of it, often in quasi-scientific speak. These included “documented factual data” and people’s reactions to it, “recorded history and what can be deduced from science,” “a recording both written and oral,” or “what can be concluded from scientific research of the past.” Another small grouping saw history as a resource for the betterment of humankind, as seen in the field’s ability “to help us . . . understand human nature and improve over time.” As one more put it, “History is the opportunity to learn from our past successes and mistakes to improve our futures.” The importance of history-as-facts versus history-as-explanation outlooks becomes evident when considering cross-tabulations. Notably, one sees a certain amount of progress in breaching this divide as a function of age (Figure 2). Whereas 69 percent of those age 65+ and 70 percent of those 50–64 saw history mostly as raw facts, the numbers decline with younger cohorts: 65 percent for ages 30–49, dropping to 59 percent for ages 18–29 (though all of these remain majority figures). Meanwhile, there is a corresponding increase in those viewing history as an explanation as one moves down the age charts, from 15 percent in the 65+ group to 22 percent in the 18–29 one. Whether this is a function of curricular changes over the decades is not certain, though we note that there was broad agreement across age cohorts that high school history courses heavily favored factual command over asking questions about the past (Figure 3). College-level classes were not as skewed toward raw content, but even here, 44 percent of those surveyed said that names, dates, and facts predominated. This is further discussed in Section 6.
How does the public define “history”? History, the Past, and Public Culture | 11
Figure 2: By age group: Respondents’ preferred best definitions for “history.” (D1)
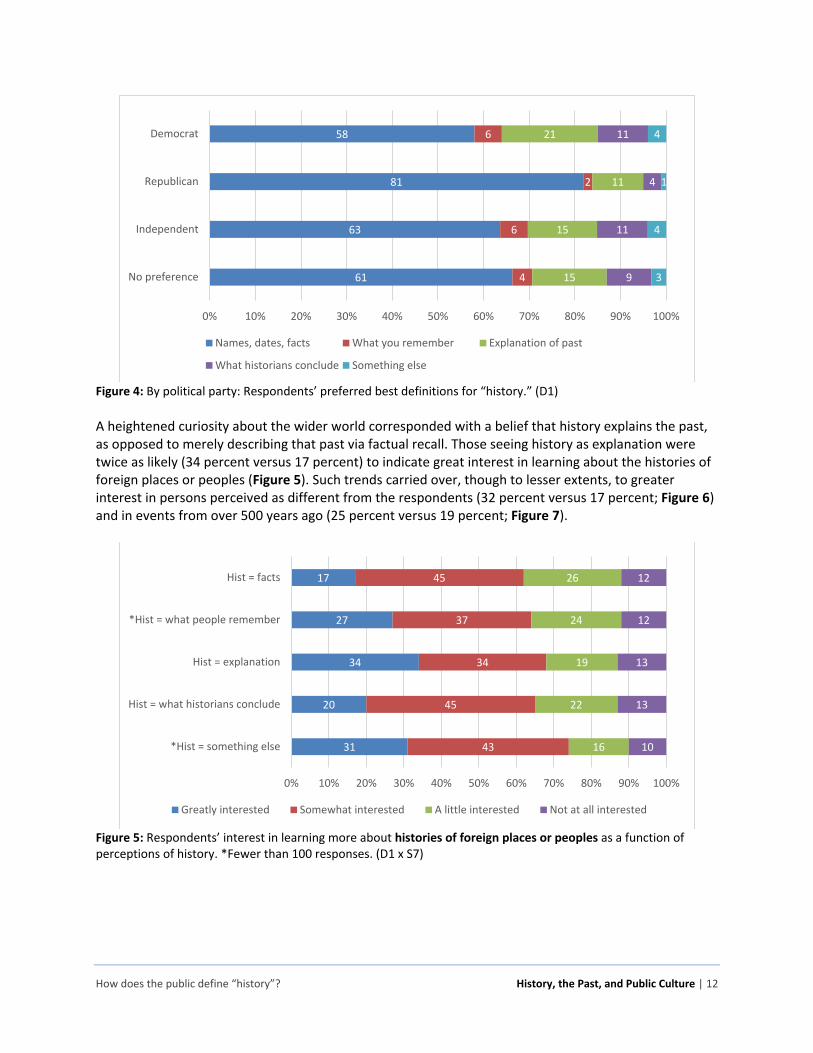
Figure 3: By age group: Respondents’ experiences in high school history courses. (V13) Political party identification likewise correlated with chosen definitions of history (Figure 4). A majority of respondents, whether self-identifying as Democrat, Republican, independent, or no preference, perceived history as defined by facts. That said, whereas Democrats, independents, and those with no preference all fell within a fairly narrow band of 58 percent to 63 percent agreement on this issue, Republicans skewed much more heavily (81 percent) toward a history-as-facts position. Political divisions also linked with beliefs that history is primarily an explanation of past events: whereas 21 percent of Democrats supported that viewpoint, only 11 percent of Republicans did. The latter group was also far less likely to see historians’ interpretations as authoritative.
59
65
70
69
7
4
5
4
22
19
12
15
8
9
9
11
5
3
4
2
0% 10% 20% 30% 40% 50% 60% 70% 80% 90% 100%
18-29
30-49
50-64
65+
Names, dates, facts What you remember Explanation of past
What historians conclude Something else
74
73
79
76
26
27
21
24
0% 10% 20% 30% 40% 50% 60% 70% 80% 90% 100%
18-29
30-49
50-64
65+
About names, dates, facts About asking questions
How does the public define “history”? History, the Past, and Public Culture | 12
Figure 4: By political party: Respondents’ preferred best definitions for “history.” (D1) A heightened curiosity about the wider world corresponded with a belief that history explains the past, as opposed to merely describing that past via factual recall. Those seeing history as explanation were twice as likely (34 percent versus 17 percent) to indicate great interest in learning about the histories of foreign places or peoples (Figure 5). Such trends carried over, though to lesser extents, to greater interest in persons perceived as different from the respondents (32 percent versus 17 percent; Figure 6) and in events from over 500 years ago (25 percent versus 19 percent; Figure 7).
Figure 5: Respondents’ interest in learning more about histories of foreign places or peoples as a function of perceptions of history. *Fewer than 100 responses. (D1 x S7)
61
63
81
58
4
6
2
6
15
15
11
21
9
11
4
11
3
4
1
4
0% 10% 20% 30% 40% 50% 60% 70% 80% 90% 100%
No preference
Independent
Republican
Democrat
Names, dates, facts What you remember Explanation of past
What historians conclude Something else
31
20
34
27
17
43
45
34
37
45
16
22
19
24
26
10
13
13
12
12
0% 10% 20% 30% 40% 50% 60% 70% 80% 90% 100%
*Hist = something else
Hist = what historians conclude
Hist = explanation
*Hist = what people remember
Hist = facts
Greatly interested Somewhat interested A little interested Not at all interested

How does the public define “history”? History, the Past, and Public Culture | 13
Figure 6: Respondents’ interest in learning more about people perceived as different as a function of perceptions of history. *Fewer than 100 responses. (D1 x S7)
Figure 7: Respondents’ interest in learning more about history over 500 years ago as a function of perceptions of history. *Fewer than 100 responses. (D1 x S7)
Challenges and opportunities: The public’s persistent view of “history” as mostly an assembly of facts results in a simplistic understanding of the past, one that is at odds with that of practicing historians. Overcoming this impasse is both important and difficult, given the public’s long-standing outlook and an education system that often reinforces simplicity. Nevertheless, there are signs of an appetite for history-as-inquiry, which results in not only a better understanding of the past, but increased interest in the broader world.
42
24
32
26
17
36
42
41
38
47
15
25
17
23
26
8
10
10
13
11
0% 10% 20% 30% 40% 50% 60% 70% 80% 90% 100%
*Hist = something else
Hist = what historians conclude
Hist = explanation
*Hist = what people remember
Hist = facts
Greatly interested Somewhat interested A little interested Not at all interested
31
30
25
22
19
38
34
40
37
38
16
23
20
25
29
15
13
15
16
14
0% 10% 20% 30% 40% 50% 60% 70% 80% 90% 100%
*Hist = something else
Hist = what historians conclude
Hist = explanation
*Hist = what people remember
Hist = facts
Greatly interested Somewhat interested A little interested Not at all interested
Why does the public care about the past (if it cares at all)? History, the Past, and Public Culture | 14
2. Why does the public care about the past (if it cares at all)?
Summary: The great majority of survey respondents indicated interest in history for reasons transcending classroom requirements. In fact, formal education held little attraction as a motivator to learn about the past. Meanwhile, a nontrivial proportion of respondents voiced no interest at all in learning history. In all cases, cross-tabulations expose differences as a function of age, education level, gender, race/ethnicity, and political affiliation.
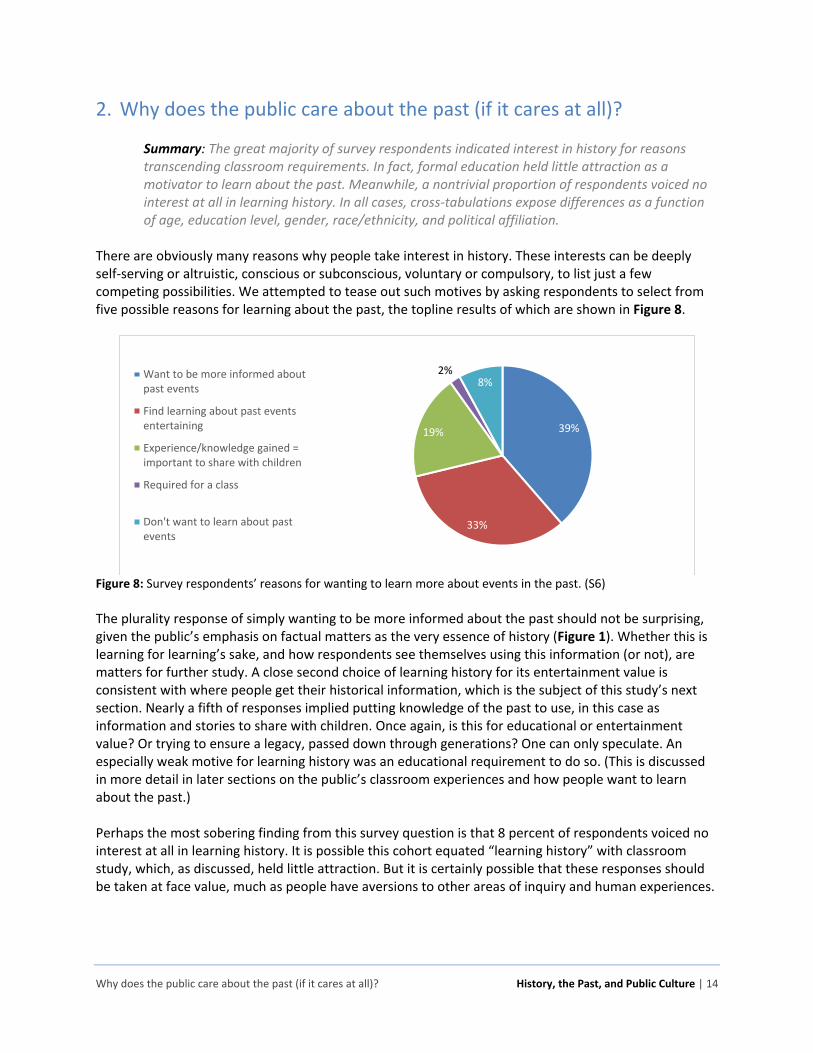
There are obviously many reasons why people take interest in history. These interests can be deeply self-serving or altruistic, conscious or subconscious, voluntary or compulsory, to list just a few competing possibilities. We attempted to tease out such motives by asking respondents to select from five possible reasons for learning about the past, the topline results of which are shown in Figure 8.
Figure 8: Survey respondents’ reasons for wanting to learn more about events in the past. (S6) The plurality response of simply wanting to be more informed about the past should not be surprising, given the public’s emphasis on factual matters as the very essence of history (Figure 1). Whether this is learning for learning’s sake, and how respondents see themselves using this information (or not), are matters for further study. A close second choice of learning history for its entertainment value is consistent with where people get their historical information, which is the subject of this study’s next section. Nearly a fifth of responses implied putting knowledge of the past to use, in this case as information and stories to share with children. Once again, is this for educational or entertainment value? Or trying to ensure a legacy, passed down through generations? One can only speculate. An especially weak motive for learning history was an educational requirement to do so. (This is discussed in more detail in later sections on the public’s classroom experiences and how people want to learn about the past.) Perhaps the most sobering finding from this survey question is that 8 percent of respondents voiced no interest at all in learning history. It is possible this cohort equated “learning history” with classroom study, which, as discussed, held little attraction. But it is certainly possible that these responses should be taken at face value, much as people have aversions to other areas of inquiry and human experiences.
39%
33%
19%
2%8%
Want to be more informed aboutpast events
Find learning about past eventsentertaining
Experience/knowledge gained =important to share with children
Required for a class
Don't want to learn about pastevents

Why does the public care about the past (if it cares at all)? History, the Past, and Public Culture | 15
It is worth examining this “no interest” response more closely by subgroups. Those reaching double-digit uninterest in history included people of color (10 percent), men of color (10 percent), those living in southern states (10 percent), people without a college degree (11 percent), Blacks (11 percent), women (11 percent), white women (11 percent), and those without any political party preference (15 percent). Those scoring lowest on this item (i.e., least likely to voice uninterest in learning history) were men (7 percent), Democrats and independents (7 percent), respondents in western states (7 percent), people over the age of 65 (6 percent), white men (5 percent), and those with a college degree (4 percent). Instances where demographic groups differed by at least 10 percent on particular motives included college versus non–college graduates (Figure 9; namely to be more informed as a motive), race (Figure 10; importance of sharing history with children), race and ethnicity (Figure 11; multiple motives), race/ethnicity/gender (Figure 12; multiple motives), and political party affiliation (Figure 13; to be more informed).
Figure 9: By education level: Respondents’ reasons for wanting to learn more about events in the past. (S6)
Figure 10: By race: Respondents’ reasons for wanting to learn more about events in the past. (S6)
32
48
32
32
22
16
2
1
11
4
0% 10% 20% 30% 40% 50% 60% 70% 80% 90% 100%
No college degree
College degree
To be more informed about past Find learning about past entertaining
Important to share with my children Required for class
Don't want to learn about past
33
41
28
34
26
16
3
1
10
8
0% 10% 20% 30% 40% 50% 60% 70% 80% 90% 100%
Person of color
White
To be more informed about past Find learning about past entertaining
Important to share with my children Required for class
Don't want to learn about past

Why does the public care about the past (if it cares at all)? History, the Past, and Public Culture | 16
Figure 11: By race/ethnicity: Respondents’ reasons for wanting to learn more about events in the past. *Fewer than 100 responses. (S6)
Figure 12: By race/ethnicity/gender: Respondents’ reasons for wanting to learn more about events in the past. (S6)
43
39
27
34
41
23
32
34
23
34
22
17
26
31
16
3
3
4
2
1
8
9
9
11
8
0% 10% 20% 30% 40% 50% 60% 70% 80% 90% 100%
*Other
*2+ races
Hispanic
Black
White
To be more informed about past Find learning about past entertaining
Important to share with my children Required for class
Don't want to learn about past
35
37
29
45
23
33
34
34
27
18
25
15
5
1
2
1
9
11
10
5
0% 10% 20% 30% 40% 50% 60% 70% 80% 90% 100%
Female person of color
White female
Male person of color
White male
To be more informed about past Find learning about past entertaining
Important to share with my children Required for class
Don't want to learn about past

Why does the public care about the past (if it cares at all)? History, the Past, and Public Culture | 17
Figure 13: By political party: Respondents’ reasons for wanting to learn more about events in the past. (S6)
Challenges and opportunities: The fact that 8 percent of the public sees no value in learning about the past is alarming, especially since that number tilts more heavily toward people of color and those without college degrees. Still, that figure must be balanced against the 91 percent of respondents whose motives for learning history appear to be intrinsic. School seems to be a weak motivator to become better acquainted with the past, but respondents with college degrees were considerably less likely to dismiss the discipline altogether than were their nondegreed peers. In this sense, higher education appears to have a positive effect.
26
39
40
40
31
34
33
29
26
18
17
21
2
2
1
2
15
7
9
7
0% 10% 20% 30% 40% 50% 60% 70% 80% 90% 100%
No preference
Independent
Republican
Democrat
To be more informed about past Find learning about past entertaining
Important to share with my children Required for class
Don't want to learn about past

Where do people get their history? History, the Past, and Public Culture | 18
3. Where do people get their history?
Summary: Respondents reported utilizing a wide variety of sources to learn about the past, but those sources were consulted to widely varying degrees. Forms of history that could be consumed more passively were preferred, while more traditional sources of the past tended to be consulted less often. Nevertheless, there were notable differences in utilization of sources among demographic subgroups.
Whatever their motives for learning history, as seen in the previous section, survey respondents indicated clear preferences for how they acquire knowledge of the past. Given a range of 19 sources of history (Figure 14), the top three choices were all video format: documentary film/TV, fictional film/TV, and TV news. Of note is that such sources are readily available, usually take minimal effort to engage, and may ask for little imagination on the part of the viewer. Meanwhile, more traditional forms of history fared considerably worse: historic site visits (8th place), museum visits (10th), nonfiction history books (12th), and college history courses (last place). As opposed to video, these latter forms of history usually take greater intentionality or effort to interact with or utilize. A variety of other sources, some of which have been linked with disinformation writ large, received varying degrees of attention as sources of the past. These include Wikipedia (6th place), social media (14th), and history-themed video games (17th). A later section of this report indicates that these preferences for sources do not necessarily correlate with trustworthiness in the minds of respondents.
Figure 14: Share of respondents who utilized various sources since January 2019 to learn about the past. (S1)
8%
11%
11%
12%
25%
26%
26%
32%
33%
35%
37%
38%
39%
46%
55%
59%
62%
66%
69%
0% 10% 20% 30% 40% 50% 60% 70% 80%
College course
DNA test
History-related video game
History lecture
Podcast/radio program
Social media
Historical fiction book
Nonfiction history book
Genealogy work
Museum visit
Disc. w/ community member
Historic site visit
Religious document
Wikipedia
Newspaper/magazine
Non-Wikipedia
TV news
Fictional film/TV
Documentary film/TV

Where do people get their history? History, the Past, and Public Culture | 19
The preferences for the most popular sources described above were mostly consistent as a function of age groups. There was little difference, for example, between older and younger respondents when it came to watching either a documentary (66–72 percent watched documentaries) or fictionalized history film, TV program, or video (65–67 percent utilized this form). Even utilization of religious documents to learn about the past did not vary much as a function of age cohort, though use increased incrementally as respondents got older (35–41 percent consulted religious documents). More pronounced differences by age group did emerge elsewhere. Respondents were progressively more likely by age to consult TV news (Figure 15), though a clear majority of all age cohorts over 30 reported utilization. Newspapers or newsmagazines saw a similar tendency as a function of age, but in this case, only a minority of the 18–29 age bracket reported use (Figure 16). Those broader trends reversed when it came to such sources as social media (Figure 17) and history-themed video games (Figure 18), with the likelihood of utilization decreasing with older people. Yet even in these latter two cases, it was only a minority of respondents in all age bands who indicated any use.
Figure 15: By age group: Respondents’ utilization of cable or network TV news to learn about the past. (S1)
Figure 16: By age group: Respondents’ utilization of newspapers or magazine articles to learn about the past. (S1)
52
58
65
73
48
42
35
27
0% 10% 20% 30% 40% 50% 60% 70% 80% 90% 100%
18-29
30-49
50-64
65+
Utilized Did not utilize
46
53
55
68
54
47
45
32
0% 10% 20% 30% 40% 50% 60% 70% 80% 90% 100%
18-29
30-49
50-64
65+
Utilized Did not utilize

Where do people get their history? History, the Past, and Public Culture | 20
Figure 17: By age group: Respondents’ utilization of social media to learn about the past. (S1)
Figure 18: By age group: Respondents’ utilization of history-related video games to learn about the past. (S1) Similarities and differences by political party identification largely mirrored those for age groups. Whether Democrat, Republican, or independent (those without party preference consistently skewed a bit lower), respondents nearly equally reported turning to documentary (62–70 percent) or fictionalized film and TV (61–70 percent), TV news (56–65 percent), newspapers and magazines (45–60 percent), and historic sites (31–41 percent) for information about the past. Notable divides for preferred sources of the past nevertheless did occur as a function of political affiliation. Such sources included religious documents (Figure 19), which were consulted by a majority of Republican respondents but by only a minority of other parties; Wikipedia (Figure 20), which Democrats and independents preferred by double digits compared with Republicans and those with no party
35
26
21
20
65
74
79
80
0% 10% 20% 30% 40% 50% 60% 70% 80% 90% 100%
18-29
30-49
50-64
65+
Utilized Did not utilize
24
14
6
2
76
86
94
98
0% 10% 20% 30% 40% 50% 60% 70% 80% 90% 100%
18-29
30-49
50-64
65+
Utilized Did not utilize
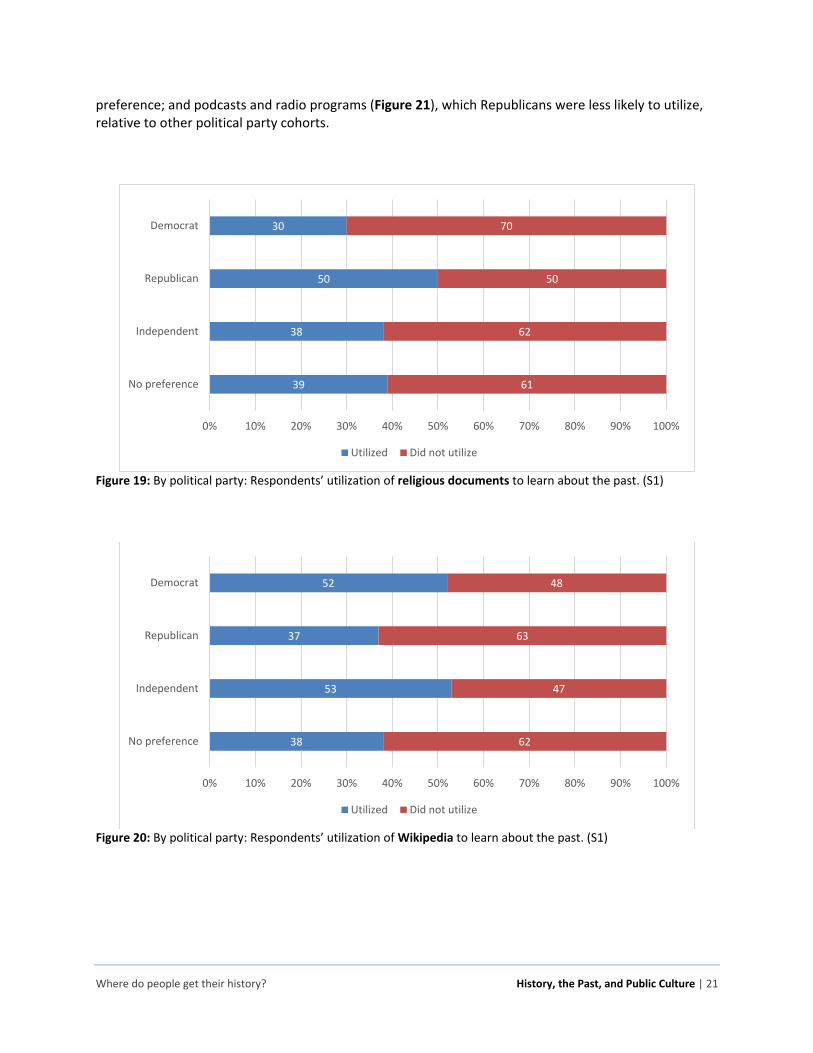
Where do people get their history? History, the Past, and Public Culture | 21
preference; and podcasts and radio programs (Figure 21), which Republicans were less likely to utilize, relative to other political party cohorts.
Figure 19: By political party: Respondents’ utilization of religious documents to learn about the past. (S1)
Figure 20: By political party: Respondents’ utilization of Wikipedia to learn about the past. (S1)
39
38
50
30
61
62
50
70
0% 10% 20% 30% 40% 50% 60% 70% 80% 90% 100%
No preference
Independent
Republican
Democrat
Utilized Did not utilize
38
53
37
52
62
47
63
48
0% 10% 20% 30% 40% 50% 60% 70% 80% 90% 100%
No preference
Independent
Republican
Democrat
Utilized Did not utilize

Where do people get their history? History, the Past, and Public Culture | 22
Figure 21: By political party: Respondents’ utilization of podcasts or radio programs to learn about the past. (S1) Differences in preferences for historical sources went beyond age and political affiliation subgroups. This is illustrated by focusing on documentary video forms of history, the most preferred source for learning about the past (Figure 14). For instance, those with and without a college degree were inclined to turn to documentaries to learn history, but college graduates outpaced non–college grads by 13 points (Figure 22). A majority of men and women likewise reported watching documentaries for history learning purposes, but men were 10 points higher than women (Figure 23). Men’s relative preference for this form of history held, even when broken down further by race: white and men of color were considerably more prone to watch history documentaries than corresponding female groups (Figure 24). Finally, while a majority of Black respondents preferred history documentaries as learning vehicles, that group trailed whites, Hispanics, and other races/ethnicities by double-digit margins (Figure 25).
Figure 22: By education level: Respondents’ utilization of documentary film, TV, and video to learn about the past. (S1)
23
31
16
28
77
69
84
72
0% 10% 20% 30% 40% 50% 60% 70% 80% 90% 100%
No preference
Independent
Republican
Democrat
Utilized Did not utilize
64
77
36
23
0% 10% 20% 30% 40% 50% 60% 70% 80% 90% 100%
No college degree
College degree
Utilized Did not utilize

Where do people get their history? History, the Past, and Public Culture | 23
Figure 23: By gender: Respondents’ utilization of documentary film, TV, and video to learn about the past. (S1)
Figure 24: By race/ethnicity/gender: Respondents’ utilization of documentary film, TV, and video to learn about the past. (S1)
74
64
26
36
0% 10% 20% 30% 40% 50% 60% 70% 80% 90% 100%
Male
Female
Utilized Did not utilize
60
71
65
75
40
29
35
25
0% 10% 20% 30% 40% 50% 60% 70% 80% 90% 100%
Female person of color
Male person of color
White female
White male
Utilized Did not utilize

Where do people get their history? History, the Past, and Public Culture | 24
Figure 25: By race/ethnicity: Respondents’ utilization of documentary film, TV, and video to learn about the past. *Fewer than 100 responses. (S1)
Challenges and opportunities: While there is no strict hierarchy of authoritative sources of the past, some sources are more difficult to consult, understand, and engage with than others. Respondents’ preferences for easily accessible sources requiring little in the way of effort, analysis, and interpretation while sidestepping more challenging sources are thus understandable but limiting. Using preferred formats such as documentary and fictional film as a gateway to other types of sources is one possible approach to expanding the public’s repertoire of historical information.
68
62
71
57
70
32
38
29
43
30
0% 10% 20% 30% 40% 50% 60% 70% 80% 90% 100%
*Other
*2+ races
Hispanic
Black
White
Utilized Did not utilize

Which sources of the past are viewed as trustworthy? History, the Past, and Public Culture | 25
4. Which sources of the past are viewed as trustworthy?
Summary: Just because the public frequently turns to a particular source for information about history does not necessarily make that source trustworthy in respondents’ eyes. Tangible repositories of the past such as museums and historic sites take top billing here, with fictionalized versions of history and social media at the other pole. Within those topline results, however, are substantial discrepancies among demographic groups.
There is no rigorous empirical order for the trustworthiness of sources of the past. Eyewitness accounts, for example, are always important, but they can also be unreliable. Professional historians often look askance at Hollywood versions of history, but films are valuable cultural artifacts that, even when highly embellished, might be particularly effective at conveying broader lessons about the past and a society’s understandings thereof. Similar dualities attach to the other sources used here. As such, this section discusses the public’s perceptions of source trustworthiness, bearing in mind that no agreed-upon ranking exists. As seen in the previous section, the American public has definite preferences for where it gets information about the past. That said, the most frequently consulted sources were not necessarily considered the most trustworthy. For example, although fictional films and television programs were the second-most popular sources of history, they ranked near the bottom in terms of trustworthiness. Meanwhile, museums were of only middling popularity, but took the top spot for historical dependability. College history professors garnered fourth position as reliable informants, even though the nonfiction work they produce, let alone the courses they teach, were infrequently consulted by respondents. Similar inversions occurred for TV news, newspapers and newsmagazines, non-Wikipedia web search results, and DNA tests. (For all these cases, compare Figure 14 with Figure 26.) These anomalies suggest that the public looks for information about the past where it is convenient or entertaining, not necessarily where it is trustworthy. Thus, although museums and historic sites are perceived as reliable places to gain knowledge about the past, the intentionality required to interact with them suggests they are consulted somewhat infrequently. Nonfiction books are seen as reasonably dependable sources of history, but they might require greater effort to obtain and engage with, leaving them underutilized. The costs involved in DNA testing might make it prohibitive to many persons, despite its reputation as a reliable vehicle for information about the past. The public’s great faith placed in museums deserves special attention. In their survey from the 1990s, Rosenzweig and Thelen likewise found that museums were the most trusted sources of information about the past (Figure 27), so this notion has not budged in the aggregate over nearly three decades, although it becomes complicated when parsed for various demographics (see later in this section).

Which sources of the past are viewed as trustworthy? History, the Past, and Public Culture | 26
Figure 26: Survey respondents’ trust placed in 20 sources to provide an accurate account of history. (T1)
2
2
6
6
7
7
9
13
13
15
17
18
18
24
26
31
31
31
49
56
12
18
34
45
48
48
36
51
57
43
55
43
52
49
47
30
45
53
39
34
32
37
42
34
32
34
37
27
23
28
20
23
21
18
17
21
14
13
8
6
54
43
19
15
14
11
19
10
7
14
8
16
8
9
10
17
10
4
5
4
0% 10% 20% 30% 40% 50% 60% 70% 80% 90% 100%
History-related video games
Social media
Fictional films & TV
Podcast/radio programs
TV news
Discussions w/ community member
Historical fiction books
Newspapers & magazines
Non-Wikipedia searches
Wikipedia
History lectures
DNA tests
High school teachers
Personal geneaology research
Nonfiction books
Religious documents
College professors
Documentary films/videos
Historic sites
Museums
A great deal Some Just a little None

Which sources of the past are viewed as trustworthy? History, the Past, and Public Culture | 27
Figure 27: Trust placed in seven sources to provide an accurate account of history, on a ten-point scale. “Trustworthy” = scores of 8–10; “ambivalent” = 4–7; “untrustworthy” = 1–3. Based on Rosenzweig and Thelen, Presence of the Past, Table 1.3, p. 21. Why is so much faith placed in museums? The present survey did not drill down further into the issue, but project co-author Burkholder has informally investigated this matter with his undergraduates many times over the years. In his experiments, museums are always the top choice of students seeking the most trustworthy information about the past. When asked why this is the case, respondents’ answers boil down to two main categories. First, objects in museums are perceived as not only representing history but being history. Those objects are thus assumed to be unbiased links to the past, which differentiates them from mere facsimiles of history such as researchers’ books and articles. Of course, survival, selection, and display biases attach to museum objects, but those shortcomings rarely occur to museum visitors. A second oft-heard explanation is that museums are collaborative enterprises. The fact that many people are presumed to be involved in displays, explain students, serves as a form of quality control against misrepresentation. Asked about quality-control issues in the production of traditional historical scholarship, few learners are aware of legitimate versus nonlegitimate publication venues, the peer-review process, or the reality that researchers collaborate with other academics in the form of using and referencing previous scholars’ works. These conclusions remain tentative, but they may point to an important breach between professional historians and the public they serve. That said, some consistencies between source utilization and perceived trustworthiness stand out. Respondents viewed history-related video games as highly unreliable sources of the past, and they utilized these games infrequently as well. Social media was deemed untrustworthy, ranking near the bottom of the pack, while only a quarter of respondents reported turning to it for historical information. Religious documents moved only slightly, from 7th out of 19 in terms of use to the top quartile for reliability. (For all these findings, compare Figure 14 with Figure 26.)
11
32
36
54
64
69
80
67
59
55
41
33
29
19
22
9
9
5
3
2
1
0% 10% 20% 30% 40% 50% 60% 70% 80% 90% 100%
Movies & TV
Nonfiction books
High school teachers
College history profs
Eyewitnesses
Relatives' accounts
Museums
Trustworthy Ambivalent Untrustworthy

Which sources of the past are viewed as trustworthy? History, the Past, and Public Culture | 28
Cross-tabulations yield other results of note. Although museums and historic sites occupied first and second place, respectively, as trustworthy sources of the past overall (Figure 26), people of color and whites registered starkly different views. As for who trusted museums a great deal, a 13-point spread separated these two groups, while a 12-point difference applied to historic sites (whites were more trusting in each case). At the other end of the spectrum, people of color were twice as likely to view these sources of the past as not at all trustworthy, though such numbers were quite small overall (Figure 28 and Figure 29). Elsewhere, whites and people of color had mostly similar views on other sources’ reliability.
Figure 28: By race: Respondents’ trust placed in museums to provide an accurate account of history. (T1)
Figure 29: By race: Respondents’ trust placed in historic sites to provide an accurate account of history. (T1) Survey results further indicate that museums and historic sites carry partisan baggage. Democrats were more likely to place a great deal of trust in museums than were other party affiliates (Figure 30), while Republicans’ strong faith in historic sites surpassed all others’ by at least nine points (Figure 31).
48
61
37
32
9
5
6
3
0% 10% 20% 30% 40% 50% 60% 70% 80% 90% 100%
Person of color
White
A great deal Some Just a little None
42
54
41
38
11
6
6
3
0% 10% 20% 30% 40% 50% 60% 70% 80% 90% 100%
Person of color
White
A great deal Some Just a little None

Which sources of the past are viewed as trustworthy? History, the Past, and Public Culture | 29
Figure 30: By political party: Respondents’ trust placed in museums to provide an accurate account of history. (T1)
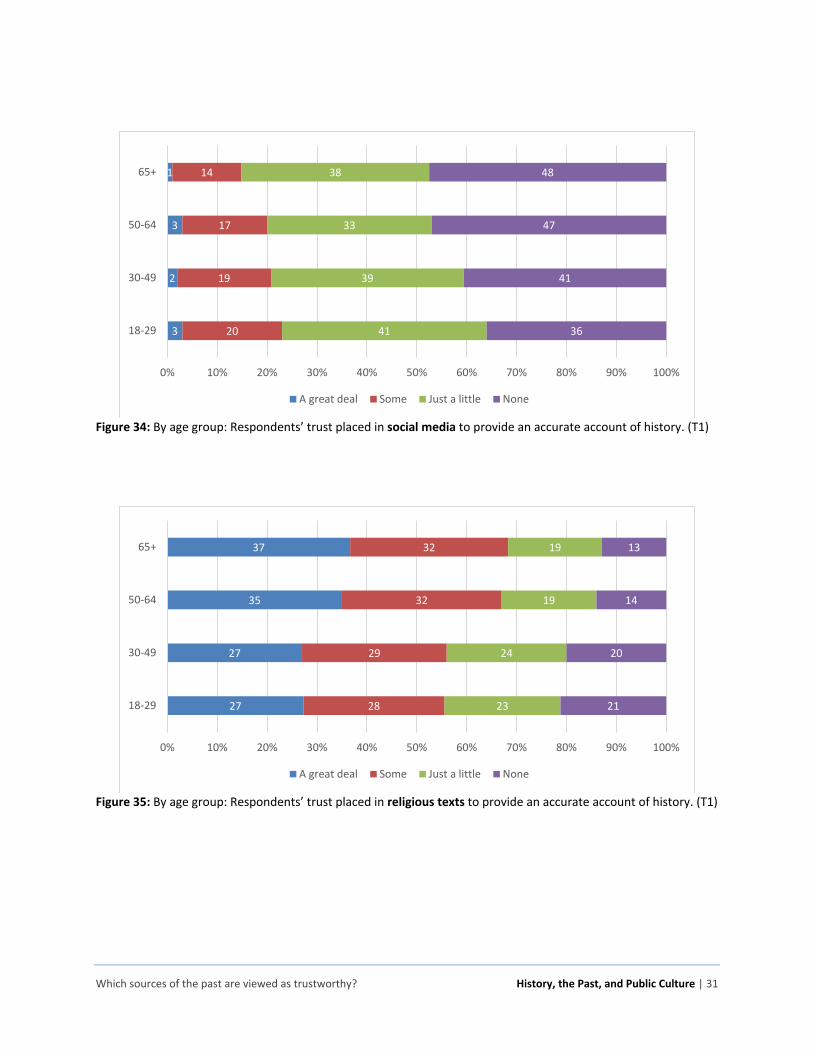
Figure 31: By political party: Respondents’ trust placed in historic sites to provide an accurate account of history. (T1) Views on the trustworthiness of sources of the past were fairly uniform by age groups. However, there were notable differences for several sources: family genealogy research (Figure 32) and DNA testing (Figure 33), where older respondents saw such work as more reliable than younger ones; social media, where younger respondents were less apt to view it as not at all reliable than were their elders (Figure 34); religious texts, where respondents became more trusting as they aged (Figure 35); and history-themed video games, where older age-bands were far more distrustful than were their younger counterparts (Figure 36). These differences may be explained by greater or lesser familiarity with specific sources as a function of age, though the survey has no direct data to this point.
48
53
56
63
34
39
36
29
11
6
5
5
7
2
4
4
0% 10% 20% 30% 40% 50% 60% 70% 80% 90% 100%
No preference
Independent
Republican
Democrat
A great deal Some Just a little None
42
48
57
47
38
41
35
40
12
9
6
6
8
2
3
6
0% 10% 20% 30% 40% 50% 60% 70% 80% 90% 100%
No preference
Independent
Republican
Democrat
A great deal Some Just a little None

Which sources of the past are viewed as trustworthy? History, the Past, and Public Culture | 30
Figure 32: By age group: Respondents’ trust placed in family genealogy research to provide an accurate account of history. (T1)
Figure 33: By age group: Respondents’ trust placed in DNA testing to provide an accurate account of history. (T1)
17
22
25
32
52
47
50
49
21
20
16
14
10
10
8
6
0% 10% 20% 30% 40% 50% 60% 70% 80% 90% 100%
18-29
30-49
50-64
65+
A great deal Some Just a little None
14
15
17
26
43
40
48
42
25
27
20
21
19
18
15
11
0% 10% 20% 30% 40% 50% 60% 70% 80% 90% 100%
18-29
30-49
50-64
65+
A great deal Some Just a little None
Which sources of the past are viewed as trustworthy? History, the Past, and Public Culture | 31
Figure 34: By age group: Respondents’ trust placed in social media to provide an accurate account of history. (T1)
Figure 35: By age group: Respondents’ trust placed in religious texts to provide an accurate account of history. (T1)
3
2
3
1
20
19
17
14
41
39
33
38
36
41
47
48
0% 10% 20% 30% 40% 50% 60% 70% 80% 90% 100%
18-29
30-49
50-64
65+
A great deal Some Just a little None
27
27
35
37
28
29
32
32
23
24
19
19
21
20
14
13
0% 10% 20% 30% 40% 50% 60% 70% 80% 90% 100%
18-29
30-49
50-64
65+
A great deal Some Just a little None

Which sources of the past are viewed as trustworthy? History, the Past, and Public Culture | 32
Figure 36: By age group: Respondents’ trust placed in history-related video games to provide an accurate account of history. (T1) There are some stark divisions as a function of political party affiliation. Emblematic of the ongoing “history wars” are the contrasting views on high school and college-level teachers, where Republicans indicated they were far less trusting of the educational system than their Democratic counterparts (Figure 37 and Figure 38). Perhaps unsurprisingly, a similar dynamic applied to confidence in public history lectures (Figure 39). Other conflicting cases pertained to documentary films and videos, in which Democrats were more likely to place a great deal of trust than were Republicans (Figure 40); social media, where Republicans and independents alike registered considerably greater skepticism than did Democrats and those with no preference (Figure 41); newspaper and magazine articles, which were deemed a great deal or somewhat more trustworthy by Democrats and independents, relative to Republicans and those with no party preference (Figure 42); and religious texts, where Democrats and Republicans differed prominently at the two poles (Figure 43). Even the perceived reliability of museums and historic sites—the two sources of the past that rated the highest overall (Figure 26 above)—came down to political leanings. Democrats were more likely to place a great deal of trust in museums than were their Republican counterparts (Figure 44), while that relationship flipped when it came to historic sites (Figure 45).
3
1
2
16
14
11
7
38
38
27
24
43
47
60
69
0% 10% 20% 30% 40% 50% 60% 70% 80% 90% 100%
18-29
30-49
50-64
65+
A great deal Some Just a little None

Which sources of the past are viewed as trustworthy? History, the Past, and Public Culture | 33
Figure 37: By political party: Respondents’ trust placed in high school teachers to provide an accurate account of history. (T1)
Figure 38: By political party: Respondents’ trust placed in college and university professors to provide an accurate account of history. (T1)
15
16
13
26
48
54
54
50
27
21
23
18
10
9
10
6
0% 10% 20% 30% 40% 50% 60% 70% 80% 90% 100%
No preference
Independent
Republican
Democrat
A great deal Some Just a little None
24
31
18
44
42
46
45
44
22
13
22
6
12
10
16
6
0% 10% 20% 30% 40% 50% 60% 70% 80% 90% 100%
No preference
Independent
Republican
Democrat
A great deal Some Just a little None

Which sources of the past are viewed as trustworthy? History, the Past, and Public Culture | 34
Figure 39: By political party: Respondents’ trust placed in public history lectures to provide an accurate account of history. (T1)
Figure 40: By political party: Respondents’ trust placed in documentary films or videos to provide an accurate account of history. (T1)
13
15
10
26
52
61
57
52
22
19
25
15
13
5
8
7
0% 10% 20% 30% 40% 50% 60% 70% 80% 90% 100%
No preference
Independent
Republican
Democrat
A great deal Some Just a little None
27
29
25
38
46
56
59
49
20
13
14
9
7
1
3
4
0% 10% 20% 30% 40% 50% 60% 70% 80% 90% 100%
No preference
Independent
Republican
Democrat
A great deal Some Just a little None

Which sources of the past are viewed as trustworthy? History, the Past, and Public Culture | 35
Figure 41: By political party: Respondents’ trust placed in social media to provide an accurate account of history. (T1)
Figure 42: By political party: Respondents’ trust placed in newspapers or magazine articles to provide an accurate account of history. (T1)
3
1
1
4
23
15
15
19
37
37
36
39
37
47
48
38
0% 10% 20% 30% 40% 50% 60% 70% 80% 90% 100%
No preference
Independent
Republican
Democrat
A great deal Some Just a little None
11
11
7
19
44
56
46
55
32
24
36
19
13
10
11
7
0% 10% 20% 30% 40% 50% 60% 70% 80% 90% 100%
No preference
Independent
Republican
Democrat
A great deal Some Just a little None

Which sources of the past are viewed as trustworthy? History, the Past, and Public Culture | 36
Figure 43: By political party: Respondents’ trust placed in religious texts to provide an accurate account of history. (T1)
Figure 44: By political party: Respondents’ trust placed in museums to provide an accurate account of history. (T1)
32
23
47
24
35
31
29
29
16
27
15
25
18
19
9
22
0% 10% 20% 30% 40% 50% 60% 70% 80% 90% 100%
No preference
Independent
Republican
Democrat
A great deal Some Just a little None
48
53
56
63
34
39
36
29
11
6
5
5
7
2
4
4
0% 10% 20% 30% 40% 50% 60% 70% 80% 90% 100%
No preference
Independent
Republican
Democrat
A great deal Some Just a little None

Which sources of the past are viewed as trustworthy? History, the Past, and Public Culture | 37
Figure 45: By political party: Respondents’ trust placed in historic sites to provide an accurate account of history. (T1)
Challenges and opportunities: Just as Rosenzweig and Thelen found over 20 years ago, the American public continues to trust museums above all other sources of the past. Similarly, fictional films and TV rank low, though their last-place ranking in Rosenzweig and Thelen has now been supplanted by social media and video games. Beyond topline results, trust in sources varies considerably as a function of age, race/ethnicity, and political leanings. Bearing in mind that trustworthiness is largely a matter of perception, educators have an enormous opportunity to get the public thinking about why some sources are considered more reliable than others, whether those assumptions are valid, and how a particular source could move up or down the trustworthiness spectrum. Greater awareness of such issues could go a long way in improving both historical knowledge and information literacy.
42
48
57
47
38
41
35
40
12
9
6
6
8
2
3
6
0% 10% 20% 30% 40% 50% 60% 70% 80% 90% 100%
No preference
Independent
Republican
Democrat
A great deal Some Just a little None

How does the public want to learn about the past? History, the Past, and Public Culture | 38
5. How does the public want to learn about the past?
Summary: A healthy majority of respondents reported preferring unmediated learning experiences with history via direct consultations with texts and artifacts, as opposed to receiving information from an expert. The public also voiced a penchant for history that challenges extant knowledge, even though most also felt that being entertained offered learning benefits. Although there were variations by subgroups, there is more consistency than discrepancy in the survey results.
We saw in Sections 3 and 4 that respondents consulted and trusted various sources about the past to varying degrees. Moreover, frequency of source use and trust in those sources did not always align. In addition to such preferences, results revealed that the public has inclinations for how it best learns about the past. A word of caution is in order: these results reflect only preferences and are thus indirect measures of what or how well people actually learn. Direct measures of learning would consist of ascertaining what exactly people learned and how well they learned it, which was beyond the scope of our poll but is common in classroom assessments. Moreover, it is well documented in metacognition studies that people, especially nonexperts in a discipline, tend to inaccurately estimate their own knowledge and abilities in that field. (See the chapter by John Girash in Applying Science of Learning in Education for an overview.) That said, respondents indicated they preferred to encounter history on its own terms and to actively investigate it, rather than passively receive it. This is reflected in the 64 percent who wanted to learn by reading or looking at historical documents and artifacts, as opposed to the 36 percent who desired to obtain information from an expert (Figure 46). How well those results would hold up in practice, especially when learners encountered ambivalent, confusing, or even contradictory readings and evidence, is debatable: direct measures are warranted to tease out such things. Survey results here, as elsewhere, may be more aspirational than reflective of reality.
Figure 46: Survey respondents’ preferred mode of learning about the past. (T2) Differences in attitudes in how best to encounter the past crop up in cross-tabulations. Our survey results suggest that younger respondents have a striking level of faith in, and engagement with, the apparent authenticity of physical objects and primary documents, as opposed to the authority of the teacher as intermediary (Figure 47), a finding with obvious ramifications for classroom approaches.
64%
36%Reading/looking at artifacts from past
Receiving information from an expert

How does the public want to learn about the past? History, the Past, and Public Culture | 39
Curiously, those with a college degree were considerably more likely to prefer expert interpretations of the past, relative to their non–college degree counterparts (Figure 48). (This is possibly explained by college graduates’ prolonged exposure to professors, who were highly trusted to accurately convey the past; see Figure 26 above.) The other notable outlier here was party identification, where Republicans voiced preferences by at least 10 points over other groups to eschew expert interpretations of the past (Figure 49).
Figure 47: By age group: Respondents’ preferred method to learn about the past. (T2)
Figure 48: By education level: Respondents’ preferred method to learn about the past. (T2)
52
65
66
70
48
35
34
30
0% 10% 20% 30% 40% 50% 60% 70% 80% 90% 100%
18-29
30-49
50-64
65+
Reading/looking at artifacts Receiving info from expert
68
55
32
45
0% 10% 20% 30% 40% 50% 60% 70% 80% 90% 100%
No college degree
College degree
Reading/looking at artifacts Receiving info from expert

How does the public want to learn about the past? History, the Past, and Public Culture | 40
Figure 49: By political party: Respondents’ preferred method to learn about the past. (T2) Delving into history by independently reading and looking at artifacts from the past inevitably confronts learners with challenges, even contradictions, to preconceived notions. How did respondents report dealing with such dissonance? A clear majority of those surveyed indicated a preference for history that challenges their understandings as opposed to confirming any knowledge they might already possess (Figure 50; compare with Figure 136). We should be very cautious with such results since respondents could be ascribing a fairmindedness to themselves that does not materialize in practice. Indeed, recent studies of Americans’ information gathering habits reveal a population that increasingly self-selects (or is pushed by sophisticated computer algorithms) into knowledge-affirming partisan camps.
Figure 50: Survey respondents’ preference for history that challenges or reinforces extant knowledge. (V9) Although a majority of all demographic groups reported a preference for challenges to their extant historical knowledge, some notable differences did occur. Those without a college degree were nearly twice as likely than degree holders to prefer familiar over challenging history (Figure 51). The cautionary note in the previous paragraph notwithstanding, such data might underscore the value of college education in opening minds to new ideas. Hispanics were more prone to favor reinforcing history (33 percent) than were whites (26 percent) or Blacks (22 percent) (Figure 52). Political affiliations resulted in
66
64
76
52
34
36
24
48
0% 10% 20% 30% 40% 50% 60% 70% 80% 90% 100%
No preference
Independent
Republican
Democrat
Reading/looking at artifacts Receiving info from expert
73%
27%Drawn to history that challengeswhat I know
Prefer history that reinforces what Iknow

How does the public want to learn about the past? History, the Past, and Public Culture | 41
especially wide fault lines, with Republicans being more than twice as likely to prefer familiar historical information (41 percent) than were Democrats (20 percent) and independents (19 percent), while those with no party preference fell in between (Figure 53).
Figure 51: By education level: Respondents’ preference for history that challenges or reinforces extant knowledge. (V9)
Figure 52: By race/ethnicity: Respondents’ preference for history that challenges or reinforces extant knowledge. *Fewer than 100 responses. (V9)
68
83
32
17
0% 10% 20% 30% 40% 50% 60% 70% 80% 90% 100%
No college degree
College degree
Drawn to history that challenges what I know Prefer history that reinforces what I know
74
72
67
78
74
26
28
33
22
26
0% 10% 20% 30% 40% 50% 60% 70% 80% 90% 100%
*Other
*2+ races
Hispanic
Black
White
Drawn to history that challenges what I know Prefer history that reinforces what I know

How does the public want to learn about the past? History, the Past, and Public Culture | 42
Figure 53: By political party: Respondents’ preference for history that challenges or reinforces extant knowledge. (V9) We also measured the perceived role of entertainment in the learning process. A great majority of respondents (73 percent) felt that it was easier to learn history when it was presented as entertainment, a perception that helps explain some of the public’s preferred sources of the past (Figure 14). A healthy majority of all demographic groups maintained this view in the cross-tabulations. Yet, we note that it is easy to conflate entertainment with learning, especially in the minds of nonexperts. Cognitive psychologists have shown that the act of learning is actually quite difficult and is not “fun” or some cognate thereof. Finally, we note that sources of the past geared toward entertainment, such as fictional films/TV and video games, garnered little trust in the public’s mind (Figure 26). A certain amount of cognitive dissonance seems to be on display. Readers should thus exercise considerable caution when drawing conclusions from these data. Learning preferences and actual results are not necessarily congruent. Even the public’s own survey responses hint at this, as when the sources respondents reported turning to most frequently were often not the same ones perceived as conveying reliable information about the past. Younger respondents were more likely than older ones to voice a predilection for entertainment in the history learning process (Figure 54), but the acquisition of a college degree had little effect on this preference (Figure 55). Hispanics voiced the most support for entertainment, with Blacks’ and whites’ attitudes steadily diminishing on the issue (Figure 56). Women surpassed men by 11 points in the value placed on entertainment (Figure 57), a correlation that held to greater or lesser degrees when broken down by gender, race, and ethnicity (Figure 58). Differences by political party or region of the country were token.
70
81
59
80
30
19
41
20
0% 10% 20% 30% 40% 50% 60% 70% 80% 90% 100%
No preference
Independent
Republican
Democrat
Drawn to history that challenges what I know Prefer history that reinforces what I know

How does the public want to learn about the past? History, the Past, and Public Culture | 43
Figure 54: By age group: Respondents’ views on the role of entertainment in the history learning process. (V6)
Figure 55: By education level: Respondents’ views on the role of entertainment in the history learning process. (V6)
78
79
68
67
22
21
32
33
0% 10% 20% 30% 40% 50% 60% 70% 80% 90% 100%
18-29
30-49
50-64
65+
Easier to learn when presented as entertainment
Don't learn as much when presented as entertainment
75
71
25
29
0% 10% 20% 30% 40% 50% 60% 70% 80% 90% 100%
No college degree
College degree
Easier to learn when presented as entertainment
Don't learn as much when presented as entertainment

How does the public want to learn about the past? History, the Past, and Public Culture | 44
Figure 56: By race/ethnicity: Respondents’ views on the role of entertainment in the history learning process. *Fewer than 100 responses. (V6)
Figure 57: By gender: Respondents’ views on the role of entertainment in the history learning process. (V6)
67
75
83
75
71
33
25
17
25
29
0% 10% 20% 30% 40% 50% 60% 70% 80% 90% 100%
*Other
*2+ races
Hispanic
Black
White
Easier to learn when presented as entertainment
Don't learn as much when presented as entertainment
68
79
32
21
0% 10% 20% 30% 40% 50% 60% 70% 80% 90% 100%
Male
Female
Easier to learn when presented as entertainment
Don't learn as much when presented as entertainment

How does the public want to learn about the past? History, the Past, and Public Culture | 45
Figure 58: By gender/race/ethnicity: Respondents’ views on the role of entertainment in the history learning process. (V6)
Challenges and opportunities: It is understandable, even heartening, that the public wants to commune directly with the past, and that people seem so willing to have their knowledge and beliefs challenged. Yet, there is reason for skepticism. Developing the skills to examine historical texts and artifacts is hard work and, while intellectually satisfying, is rarely entertaining. Accommodating new and discordant information is likewise difficult. Utilizing commonly consulted sources of the past such as documentary and fictional films and TV—sources that usually include an entertainment component—as vehicles to help teach the past is just one way to possibly square this circle.
80
73
79
64
20
27
21
36
0% 10% 20% 30% 40% 50% 60% 70% 80% 90% 100%
Female person of color
Male person of color
White female
White male
Easier to learn when presented as entertainment
Don't learn as much when presented as entertainment

What have the public’s history education experiences been like? History, the Past, and Public Culture | 46
6. What have the public’s history education experiences been like?
Summary: If much of the public is predisposed to defining history as an assembly of facts, part of the reason may stem from how the subject is taught in classroom settings. Our findings indicate that high school and college focus to greater or lesser degrees on factual matters, though respondents nonetheless reported increased interest in the discipline as a result of their experiences. Answers to open-ended questions exposed other areas of success and concern for instruction of the past.
We saw in Section 1 that respondents heavily equated “history” with basic facts. Nevertheless, the public also strongly felt, by a 90 percent to 10 percent split, that history can be learned everywhere, not just in classrooms. While we acknowledge that educational settings are not the sole learning points of the past, it stands to reason that those formal settings do help shape people’s attitudes toward the discipline and the public’s desire to know more about it. Given a binary choice of whether their high school classrooms emphasized either basic facts or questions about the past, 76 percent of those surveyed selected the former. That split held steady for most demographic subgroups (see the age groups breakdown in Figure 3), but there were exceptions. Only 68 percent of Hispanic respondents reported a primary focus on factual material (Figure 59), while white women exceeded the overall rate with 81 percent (Figure 60). Party identification also saw double-digit differences between Democrats and Republicans (Figure 61).
Figure 59: By race/ethnicity: Respondents’ experiences in high school history courses. *Fewer than 100 responses. (V13)
67
73
68
73
79
33
27
32
27
21
0% 10% 20% 30% 40% 50% 60% 70% 80% 90% 100%
*Other
*2+ races
Hispanic
Black
White
About names, dates, facts About asking questions

What have the public’s history education experiences been like? History, the Past, and Public Culture | 47
Figure 60: By gender/race/ethnicity: Respondents’ experiences in high school history courses. (V13)
Figure 61: By political party: Respondents’ experiences in high school history courses. (V13) This heavy emphasis on factual material in high school did not seem to have an overly dissuasive effect on history learners: 68 percent of respondents said their experiences made them want to know more about the past. As above, there were some subgroup outliers voicing interest higher than that number as a result of high school (Hispanics, 76 percent) or lower (white women, 61 percent). A pedagogical cause and effect thus possibly presents itself: the more a class emphasizes questioning the past, the more interest it sparks in learners. The reverse may be true as well: history courses that focus primarily
67
71
81
76
33
29
19
24
0% 10% 20% 30% 40% 50% 60% 70% 80% 90% 100%
Female person of color
Male person of color
White female
White male
About names, dates, facts About asking questions
76
77
81
70
24
23
19
30
0% 10% 20% 30% 40% 50% 60% 70% 80% 90% 100%
No preference
Independent
Republican
Democrat
About names, dates, facts About asking questions

What have the public’s history education experiences been like? History, the Past, and Public Culture | 48
on factual material provoke greater lack of interest in the subject. Such relationships are corroborated by cross-referencing high school approaches to history with motivation to learn: by a significant ratio of greater than seven-to-one, inquiry-based investigation led to a reported increased desire to learn more about the past (Figure 62). Whether that relationship holds up in actual practice or is more wishful thinking is another matter.
Figure 62: Respondents’ reported motivation to learn more history as function of fact-based versus inquiry-based history courses. (V13 x V14) High school experiences are readily compared with those of college history courses. The latter registered far fewer responses indicating concentration on factual matters (44 percent) and a greater proportion who learned to question the past (56 percent). Still, the 44 percent figure shows that the “coverage” approach to teaching history is alive and well, even at the higher ed level. Other results are ambiguous on this matter. In a sign that the coverage model may be falling out of favor in college, it was the youngest survey cohort that reported the greatest emphasis on asking historical questions in its classes (Figure 63). That must be balanced against the roughly equal proportions of respondents with and without college degrees, who indicated continuity of experiences from high school to university (Figure 64).
Figure 63: By age group: Respondents’ experiences in college history courses. (V15)
68
9
32
91
0% 10% 20% 30% 40% 50% 60% 70% 80% 90% 100%
Inquiry-based
Fact-based
Encouraged to learn more Discouraged from learning more
38
47
46
43
62
53
54
57
0% 10% 20% 30% 40% 50% 60% 70% 80% 90% 100%
18-29
30-49
50-64
65+
About names, dates, facts About asking questions

What have the public’s history education experiences been like? History, the Past, and Public Culture | 49
Figure 64: By education level: Respondents’ experiences in college history courses. (V15) Different college experiences as a function of race and ethnicity (Figure 65) were the inverse of those at the high school level (Figure 59), though sample sizes for people of color with college degrees were too small to draw any firm conclusions. Meanwhile, the centrality of basic facts in college history classes diminished proportionately for all political party groups (Figure 66), relative to the high school results (Figure 61).
Figure 65: By race/ethnicity: Respondents’ experiences in college history courses. *Fewer than 100 responses. (V15)
45
43
55
57
0% 10% 20% 30% 40% 50% 60% 70% 80% 90% 100%
No college degree
College degree
About names, dates, facts About asking questions
37
26
53
47
43
63
74
47
53
57
0% 10% 20% 30% 40% 50% 60% 70% 80% 90% 100%
*Other
*2+ races
*Hispanic
*Black
White
About names, dates, facts About asking questions

What have the public’s history education experiences been like? History, the Past, and Public Culture | 50
Figure 66: By political party: Respondents’ experiences in college history courses. *Fewer than 100 responses. (V15) Open-ended survey questions shed much additional light on the formal history education experience. Respondents were asked to provide words or short phrases in three text boxes describing their high school experiences in history classes. Not everyone gave responses (52 percent could not remember their courses well enough, while an additional 6 percent reported not having taken a history/social studies class), let alone in all three boxes. But for the remaining 42 percent, the three opportunities elicited 1,591 answers that were then coded and quantified as follows (see Figure 67).
Figure 67: Respondents’ associations made with high school history courses. N = 1,591 (three rounds of responses). (SCH1) Responses that indicated positive or negative experiences were straightforward. These included words such as “amazing,” “educational,” “enlightening,” “fascinating,” and “interesting,” which accounted for 9
49
41
53
38
51
59
47
62
0% 10% 20% 30% 40% 50% 60% 70% 80% 90% 100%
*No preference
Independent
Republican
Democrat
About names, dates, facts About asking questions
9%
6%
34%
10%
11%
5%
9%
10%5%
Positive experience
Negative experience
Factoid
Course name/broad subject area
Broader historical lesson
Emphasis on facts
Workload and learning statements
Incomplete history encountered
Uncategorized

What have the public’s history education experiences been like? History, the Past, and Public Culture | 51
percent of all responses. Negative words and phrases included “boring,” “dry,” “inept,” “not meaningful,” “poorly taught,” and “uninteresting,” and amounted to 6 percent of the total. The plurality of responses (34 percent) were classified as factoids, where respondents seemed to draw from their wells of basic factual knowledge. These might include dates such as “1492,” persons like “Abraham Lincoln,” events such as “Boston Tea Party,” or even common historical quotes like “Give me liberty or give me death.” Another category placed responses in what seemed to be either course titles or broad subject areas. These included such answers as “European history,” “freedom,” “government,” and “war,” and accounted for 10 percent of all responses. Broader history lessons, including well-worn bromides, comprised another grouping, with responses including “empires rise and fall,” “history repeats itself” (and myriad permutations of George Santayana’s famous quote), and even judgments like “capitalism is not just.” Together, these were 11 percent of the total. Five percent of the answers were indicative of educational experiences that emphasized raw facts—usually in a negative manner, so that this category could be plausibly added to the 6 percent of negative responses described earlier. The present category was comprised of phrases like “cramming information,” “lots of dates,” “memorization,” and “rote learning.” An additional grouping was based on learning statements and workload estimates. “Document analysis,” “learned about other cultures,” “difficult,” and “lots of reading” (neither of which we viewed as necessarily negative) are some examples, which made up 9 percent of the results. Ten percent of the responses indicated that the history encountered was incomplete or lacking in some way. Most of these, too, could be interpreted as being at least somewhat negative. Words and phrases included “biased,” “Caucasian-based,” “Eurocentric,” “half-truth,” “limited,” “not enough primary sources,” and “whitewashed.” A final grouping (5 percent of total) defied any sort of categorization. The same criteria were used to code and quantify 814 responses on experiences in college-level courses, the results of which are displayed in Figure 68. This time, 88 percent of those who had taken history class at this level weighed in with at least one response. Comparing high school and college-level results from the open-ended responses leads to the following observations. First, college experiences are a bit more positive/less negative than those of high school. These are perhaps unfair comparisons, since college populations are largely self-selected, whereas high school constitutes compulsory education. Still, the differences are not enormous. If responses in the categories of “emphasis on facts” and “incomplete history encountered” are added to the strictly negative classification, as discussed above, then 21 percent of high school responses become negative, compared with 12 percent for college.

What have the public’s history education experiences been like? History, the Past, and Public Culture | 52
Figure 68: Respondents’ associations made with college history courses. N = 814 (three rounds of responses). (SCH3) While college factoid responses were less common than for high school, factoids were still the plurality response for both levels of instruction. This is consistent with a trend pointed out earlier, where an emphasis on straight facts became less prevalent as history education progressed; yet it also suggests that even higher education settings continue to emphasize factual material more than anything else. Responses referring to broad subject areas were nearly twice as common at the college level (19 percent) than high school (10 percent). There seem to be two possibilities here. First, such results may indicate relatively more emphasis in college courses on broader concepts than on isolated facts, a possibility that is reinforced by the relative frequencies of factoid responses (28 percent college, 34 percent high school) and factual emphasis (3 percent college, 5 percent high school) at each level. This possibility is further reinforced when considering workload/learning statements for each (15 percent college, 9 percent high school). Second, the college results may simply be an artifact of the greater variety of history courses than are generally available in high schools. Additional surveys or focus groups could help clarify the issue. Finally, high school responses were more than twice as likely (10 percent) to reference incomplete versions of history than were college reactions (4 percent). Whether this is again a function of the survey cohorts, access to a broader selection of classes at the college level to fill subject matter gaps, or something else awaits further investigation.
Challenges and opportunities: There are many reasons why facts may predominate in history education, ranging from high-stakes exam requirements to ease of assessment to audience expectations. College-level courses struck respondents as more concerned with analyzing the past as opposed to simply knowing it, but the same factors afflicting high school teachers might serve as bottlenecks for professors, too. As seen in other parts of this report, the public indicates that it prefers analysis to memorization, and that it welcomes challenges to presumptions. In theory, those findings give the green light to more ambitious teaching approaches, but only if learners and instructors are willing to accept the complexity, ambiguity, and even discomfort that are part of the bargain.
14%
5%
28%
19%
5%3%
15%
4%7%
Positive experience
Negative experience
Factoid
Course name/broad subject area
Broader historical lesson
Emphasis on facts
Workload and learning statements
Incomplete history encountered
Uncategorized
What aspects of the past does the public want to learn more about? History, the Past, and Public Culture | 53
7. What aspects of the past does the public want to learn more about?
Summary: Respondents weighed in on various sources of the past and how much those sources encouraged them to learn more history. As we have seen in respondents’ thoughts on other areas of historical sources, there is more variability than consistency between engagement, trustworthiness, and utilization. Survey results also show that the majority of people see distant people, places, and topics as equally important to more proximate ones, though there are often double-digit differences between subgroups.
It is natural for people to have inclinations toward or away from various areas of the past. Those inclinations, however, run the risk of limiting historical knowledge and curiosity, such as when individuals care about what affects them personally and little else. Restricted interests and knowledge also severely limit the scope of information that can be brought to bear on issues, which can result in people living with a veritable “perpetual now” mindset, where all situations are without historical parallel or precedent. One of history educators’ goals, it seems to us, is to broaden society’s interests and push people into unknown, even uncomfortable confrontations with the past. Survey results indicate the public is open to such persuasion (see for example Figure 50). One way to broaden society’s historical interests is to understand which sources of the past foster the greatest interest in learning. This is not to say that educators should favor certain types of sources over others, since all types have their inherent strengths and weaknesses. Moreover, prodding learners to struggle with challenging or unfamiliar materials can lead to significant educational gains. The results in Figure 69, where respondents registered degrees to which various sources encouraged them to learn more history, are worth considering. Even more interesting is to compare these results with Figure 14 (utilization of sources of the past) and Figure 26 (trust placed in sources of the past). Such comparisons reveal that religious documents spurred the most interest, even though the degree to which they were consulted was only middling, and despite coming in fifth place in terms of trustworthiness. Other sources saw rather stark inversions. Podcasts ranked high in piquing interests but fared poorly in terms of utilization and trust. Documentary films and videos received very high marks for accuracy and utilization, but mediocre ones for inciting interest in the past. Museums, the most trusted venues of history, were only in the top third as motivators to learn more, and only the top half for utilization. Views toward fictional film and TV bordered on schizophrenic: with abysmal rankings for trustworthiness and fostering more learning, but very high utilization rates. There were also some constants. Social media and history-related video games were perennial bottom-feeders across all categories. Such incongruent results reinforce and build upon a point made in Section 4, namely that the sources to which the public turns most often for information about the past are not the same ones that are most trusted or likely to provoke more interest. Whether historians should try to somehow bring all three measures into alignment as some sort of pedagogical holy grail is probably moot. Rather, it is likely more a case of teaching the inherent potentials and pitfalls of a variety of source types, while selecting those that are most conducive to a given educational goal.
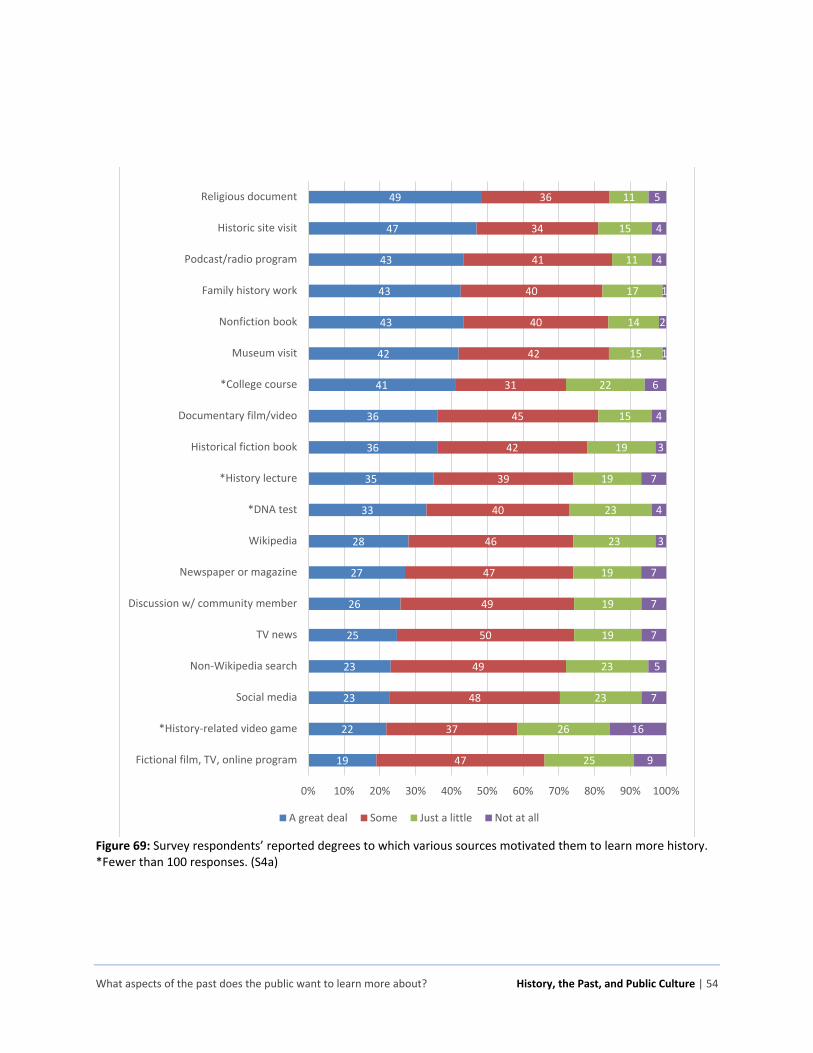
What aspects of the past does the public want to learn more about? History, the Past, and Public Culture | 54
Figure 69: Survey respondents’ reported degrees to which various sources motivated them to learn more history. *Fewer than 100 responses. (S4a)
19
22
23
23
25
26
27
28
33
35
36
36
41
42
43
43
43
47
49
47
37
48
49
50
49
47
46
40
39
42
45
31
42
40
40
41
34
36
25
26
23
23
19
19
19
23
23
19
19
15
22
15
14
17
11
15
11
9
16
7
5
7
7
7
3
4
7
3
4
6
1
2
1
4
4
5
0% 10% 20% 30% 40% 50% 60% 70% 80% 90% 100%
Fictional film, TV, online program
*History-related video game
Social media
Non-Wikipedia search
TV news
Discussion w/ community member
Newspaper or magazine
Wikipedia
*DNA test
*History lecture
Historical fiction book
Documentary film/video
*College course
Museum visit
Nonfiction book
Family history work
Podcast/radio program
Historic site visit
Religious document
A great deal Some Just a little Not at all

What aspects of the past does the public want to learn more about? History, the Past, and Public Culture | 55
The survey also attempted to capture which historical subjects most interested the public. Much strife and pain has been associated with matters of race and ethnicity in recent years, including the imbroglio over the teaching of “critical race theory.” It is thus essential to point out that 89 percent of our respondents said that knowledge of the history of others was just as important to know as was knowledge of the respondents’ own racial or ethnic communities (Figure 70). Whether this represents genuine sentiments or is tinged by social desirability is uncertain, but such data show how unreflective some headline-grabbing controversies are of the broader American public’s views.
Figure 70: Survey respondents’ views on the importance of racial or ethnic community history. (V4) Cross-tabulations show that people of color were more likely (though never overwhelmingly so) to favor knowing the histories of their own racial or ethnic groups than were whites (Figure 71). Breaking things down further, men of color were most inclined to find interest in their own communities, while white women were the least (Figure 72). African Americans were most likely to favor their own history, though only 27 percent believed that knowledge of other racial/ethnic groups was somehow less worthy of attention (Figure 73). Political party affiliation (Figure 74) and region of the country (Figure 75) seemed not to matter, as results largely replicated topline figures. Clearly, there is a lot more toleration and even interest in those of other racial/ethnic groups than politicians and the media would lead us to believe.
Figure 71: By race: Respondents’ views on the importance of racial or ethnic community history. (V4)
11%
89%
Knowledge of own racial/ethiccommunity more important
Knowledge of others just asimportant as own racial/ethiccommunity
16
9
84
91
0% 10% 20% 30% 40% 50% 60% 70% 80% 90% 100%
Person of color
White
Own racial/ethic group more important Others just as important

What aspects of the past does the public want to learn more about? History, the Past, and Public Culture | 56
Figure 72: By gender/race/ethnicity: Respondents’ views on the importance of racial or ethnic community history. (V4)
Figure 73: By race/ethnicity: Respondents’ views on the importance of racial or ethnic community history. *Fewer than 100 responses. (V4)
13
20
7
11
87
80
93
89
0% 10% 20% 30% 40% 50% 60% 70% 80% 90% 100%
Female person of color
Male person of color
White female
White male
Own racial/ethic group more important Others just as important
10
10
11
27
9
90
90
89
73
91
0% 10% 20% 30% 40% 50% 60% 70% 80% 90% 100%
*Other
*2+ races
Hispanic
Black
White
Own racial/ethic group more important Others just as important

What aspects of the past does the public want to learn more about? History, the Past, and Public Culture | 57
Figure 74: By political party: Respondents’ views on the importance of racial or ethnic community history. (V4)
Figure 75: By region: Respondents’ views on the importance of racial or ethnic community history. (V4) Just as other racial and ethnic groups can seem foreign to outsiders, so can the distant past seem to those in the present. Humans live through only thin slices of “history,” however defined. That being the case, is the public as interested in what transpired more than 100 years ago as it is in more recent events?
11
8
12
12
89
92
88
88
0% 10% 20% 30% 40% 50% 60% 70% 80% 90% 100%
No preference
Independent
Republican
Democrat
Own racial/ethic group more important Others just as important
13
10
12
10
87
90
88
90
0% 10% 20% 30% 40% 50% 60% 70% 80% 90% 100%
Northeast
Midwest
South
West
Own racial/ethic group more important Others just as important

What aspects of the past does the public want to learn more about? History, the Past, and Public Culture | 58
The survey exposed general interest in things beyond a typical lifespan, with 81 percent of respondents saying that events from a century ago are just as important as more recent ones. This suggests empathy for the more distant past, though decidedly less so than for people of different races and ethnicities, as outlined above. Perhaps unsurprisingly, age made a difference: the older the respondents, the more likely they were to value things further back in time (Figure 76). Notable outliers were African Americans, who voiced nominally more support for distant events than did other racial and ethnic groups (Figure 77). Results consistent with topline figures marked other demographics.
Figure 76: By age group: Respondents’ views on the importance of events over 100 years ago. (V5)
Figure 77: By race/ethnicity: Respondents’ views on the importance of events over 100 years ago. *Fewer than 100 responses. (V5)
25
19
18
17
75
81
82
83
0% 10% 20% 30% 40% 50% 60% 70% 80% 90% 100%
18-29
30-49
50-64
65+
Recent history more important Distant history just as important
23
21
20
14
20
77
79
80
86
80
0% 10% 20% 30% 40% 50% 60% 70% 80% 90% 100%
*Other
*2+ races
Hispanic
Black
White
Recent history more important Distant history just as important

What aspects of the past does the public want to learn more about? History, the Past, and Public Culture | 59
Another survey item adds context to the reported attitudes toward ethnic communities and the distant past. That item asked respondents how interested they are in learning about seven different historical fields. As shown in Figure 78, 57 percent voiced great or some interest in learning more about their own ethnic group, while the number was 60 percent for events from over 500 years ago (i.e., premodern history, as opposed to just a century ago). While those are majority figures, they are the lowest of the seven choices. In fact, these two topics also registered the highest levels of uninterest from respondents. The greatest importance fell to the item closest to home: the family (80 percent answered great or some interest, combined). Despite this professed curiosity for things familial, note that respondents reported elsewhere only infrequently partaking in genealogy work and DNA testing (Figure 14), thus showing how an indirect measure can differ from a more direct one. And while national history took the second spot at 77 percent combined, another survey item found that 82 percent of respondents thought it was just as important to know about foreign history as US history—a higher number than the 64 percent combined interest in foreign places/peoples shown in Figure 78.
Figure 78: Respondents’ interest in learning more about the histories of seven topics. (S7) Some notable trends and differences in these attitudes appeared when broken down by demographic groups. For example, younger age cohorts registered greater interest in foreign places or peoples than did their older counterparts (Figure 79), but that trend reversed when it came to the importance of one’s own country (Figure 80). People of color were far more concerned with learning more about their own ethnic group than were whites (Figure 81), yet those two demographics were largely on par in the other six areas. The effects of politics showed through as well. Democrats displayed considerably more interest in learning about their own ethnic groups (Figure 82) and people perceived as different (Figure 83), while Republicans voiced somewhat greater curiosity about the history of their own country (Figure 84).
22
22
18
21
21
33
45
35
38
44
43
44
44
35
25
26
26
24
24
15
14
18
15
12
12
11
8
7
0% 10% 20% 30% 40% 50% 60% 70% 80% 90% 100%
My ethnic group
Events > 500 years ago
My state or local community
Foreign places/peoples
People different from me
My country
My own family
A great deal Some Just a little Not at all

What aspects of the past does the public want to learn more about? History, the Past, and Public Culture | 60
Figure 79: By age group: Respondents’ interest in learning more about the histories of foreign places or peoples. (S7)
Figure 80: By age group: Interest in learning more about the history of own country. (S7)
28
21
17
19
37
45
45
42
22
24
24
26
13
10
14
13
0% 10% 20% 30% 40% 50% 60% 70% 80% 90% 100%
18-29
30-49
50-64
65+
A great deal Some Just a little Not at all
26
31
36
41
45
46
41
43
21
16
13
12
9
7
9
4
0% 10% 20% 30% 40% 50% 60% 70% 80% 90% 100%
18-29
30-49
50-64
65+
A great deal Some Just a little Not at all

What aspects of the past does the public want to learn more about? History, the Past, and Public Culture | 61
Figure 81: By race: Respondents’ interest in learning more about the history of own ethnic group. (S7)
Figure 82: By political party: Respondents’ interest in learning more about the history of own ethnic group. (S7)
Figure 83: By political party: Respondents’ interest in learning more about the histories of people who are different. (S7)
40
12
32
37
17
29
11
22
0% 10% 20% 30% 40% 50% 60% 70% 80% 90% 100%
Person of color
White
A great deal Some Just a little Not at all
21
17
13
34
33
37
36
34
28
30
29
18
18
16
23
14
0% 10% 20% 30% 40% 50% 60% 70% 80% 90% 100%
No preference
Independent
Republican
Democrat
A great deal Some Just a little Not at all
20
19
11
31
40
49
45
42
26
24
29
18
14
7
14
9
0% 10% 20% 30% 40% 50% 60% 70% 80% 90% 100%
No preference
Independent
Republican
Democrat
A great deal Some Just a little Not at all

What aspects of the past does the public want to learn more about? History, the Past, and Public Culture | 62
Figure 84: By political party: Respondents’ interest in learning more about the history of own country. (S7) The centrality of US history was also measured from the angle of how important respondents felt it was when compared against non-US history. Data on this issue show that a majority always expressed a great deal or some interest in American history, but comparing this topic directly against the histories of foreign places yielded only 18 percent who thought the US should be privileged (the majority 82 percent felt the two were equally important). Those proportions held remarkably steady across age groups, education levels, genders, races/ethnicities, genders/races/ethnicities, and regions of the country. The one cross-tabulation generating substantial disagreement was political party identification, where Republicans and Democrats split by wide margins (Figure 85). These findings put the differences shown in Figure 84 in even starker relief.
Figure 85: By political party: Respondents’ views on the importance of US history versus non-US history. (V3)
28
34
38
33
41
45
45
44
18
15
12
17
13
7
6
7
0% 10% 20% 30% 40% 50% 60% 70% 80% 90% 100%
No preference
Independent
Republican
Democrat
A great deal Some Just a little Not at all
15
16
30
11
85
84
70
89
0% 10% 20% 30% 40% 50% 60% 70% 80% 90% 100%
No preference
Independent
Republican
Democrat
US more important Other places equally important

What aspects of the past does the public want to learn more about? History, the Past, and Public Culture | 63
Challenges and opportunities: News headlines would have us believe that the country is hopelessly divided, but the results in this section paint a different picture, at least in theory. Despite some real demographic disparities, we see that the majority of respondents were quite tolerant of, even interested in, learning about people, places, and events far removed from themselves. While some sources of the past resonate with the public more than others, we note that all of them motivate at least half of respondents to learn more history. Whether that range of interests and source materials is being adequately exploited by the professional historians to reach the public is an open question.

How much does the public value the field of history and historians’ work? History, the Past, and Public Culture | 64
8. How much does the public value the field of history and historians’ work?
Summary: The supposed inutility of a history degree has become a cliché, reinforced by declining history enrollment figures on college campuses. Despite that, respondents voiced strong support for the importance of learning about the past, even relative to ostensibly more practical fields—a trend that held across demographic groups. What is lacking, survey results indicate, is historians’ adequate treatment of certain peoples and topics, while others garner too much attention.
It is impossible not to use history in some way as we go through our daily lives, even if that use is only rudimentary or subconscious. But such frequent usage does not necessarily translate to perceived value, as we saw in the cases of historical source utilization (Section 3), trust in sources (Section 4), and the ability of those sources to generate interest in the past (Section 7). To employ a comparison, most Americans utilize numbers and basic mathematics every day, but this does not mean that the country is awash in math lovers. But while STEM disciplines are seeing steady or even increasing interest at the college level, history numbers, measured both by numbers of majors and enrollments, have slid downward since a high point around 2012. As of this writing, history course enrollments and majors appear to have bottomed out and are even rising at some institutions. But the numbers are still lower than they were a decade ago. Using those figures as a proxy for society’s value in the field is a grim calculus. We employed a blunt-force survey question to measure people’s value of history. However, simply asking whether they felt the field was valuable or not is a “costless choice,” insofar as there would be no downside in answering in the affirmative. Instead, we inquired whether respondents felt it was equally or less valuable to learn about the past than about the more popular and seemingly more useful fields of business and engineering. The results were inconsistent with college enrollment figures, as 84 percent of respondents said that history education is just as important as those two professional fields (Figure 86). That result held fairly steady across age groups (Figure 87), genders (Figure 88), education levels (Figure 89), races and ethnicities (Figure 90), political party affiliations (Figure 91), and regions of the country (Figure 92). If the public indeed sees such parity between programs, it is not voting with its feet that way on college campuses.
Figure 86: Respondents’ perceived value of learning history compared with business or engineering. (V8)
84%
16%History as important to learn inschool as business or engineering
History less important to learn inschool than business or engineering

How much does the public value the field of history and historians’ work? History, the Past, and Public Culture | 65
Figure 87: By age group: Respondents’ perceived value of learning history compared with business or engineering. (V8)
Figure 88: By gender: Respondents’ perceived value of learning history compared with business or engineering. (V8)
Figure 89: By education level: Respondents’ perceived value of learning history compared with business or engineering. (V8)
80
86
83
88
20
14
17
12
0% 10% 20% 30% 40% 50% 60% 70% 80% 90% 100%
18-29
30-49
50-64
65+
History just as important History less important
82
87
18
13
0% 10% 20% 30% 40% 50% 60% 70% 80% 90% 100%
Male
Female
History just as important History less important
85
83
15
17
0% 10% 20% 30% 40% 50% 60% 70% 80% 90% 100%
No college degree
College degree
History just as important History less important
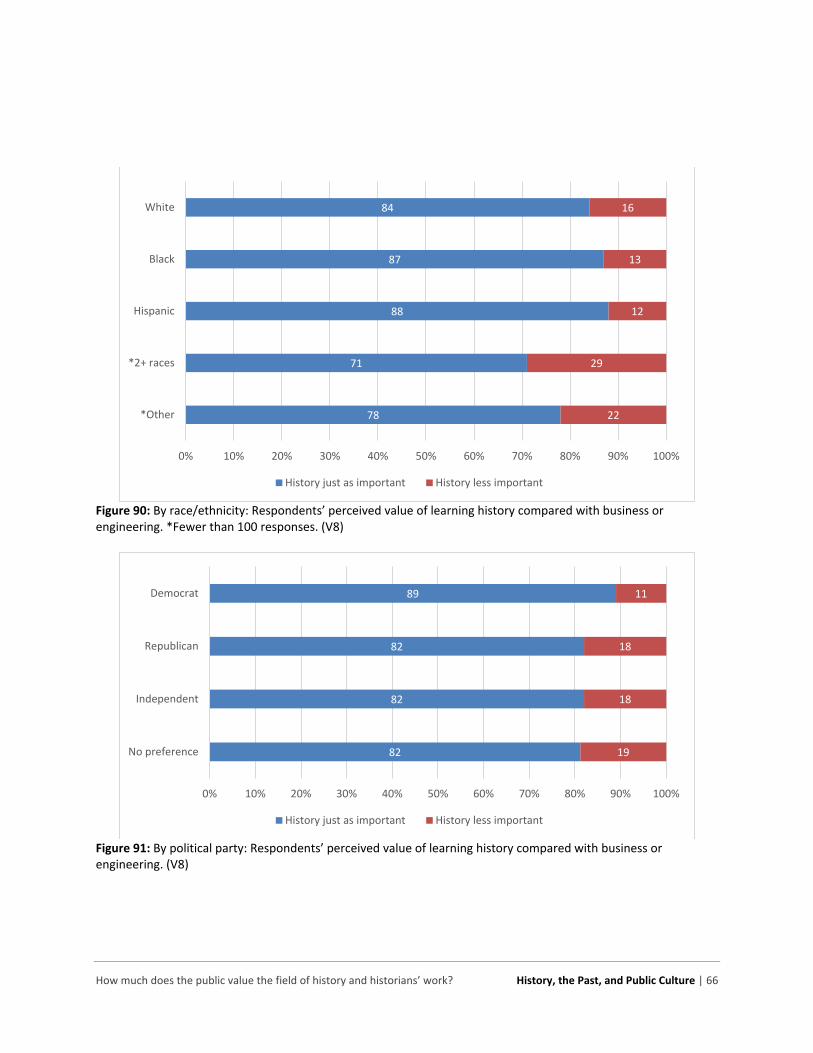
How much does the public value the field of history and historians’ work? History, the Past, and Public Culture | 66
Figure 90: By race/ethnicity: Respondents’ perceived value of learning history compared with business or engineering. *Fewer than 100 responses. (V8)
Figure 91: By political party: Respondents’ perceived value of learning history compared with business or engineering. (V8)
78
71
88
87
84
22
29
12
13
16
0% 10% 20% 30% 40% 50% 60% 70% 80% 90% 100%
*Other
*2+ races
Hispanic
Black
White
History just as important History less important
82
82
82
89
19
18
18
11
0% 10% 20% 30% 40% 50% 60% 70% 80% 90% 100%
No preference
Independent
Republican
Democrat
History just as important History less important

How much does the public value the field of history and historians’ work? History, the Past, and Public Culture | 67
Figure 92: By region: Respondents’ perceived value of learning history compared with business or engineering. (V8) Another way of measuring the value that the public attaches to history was to ask whether historians were perceived as paying adequate attention to various issues. In other words, do historians serve the needs of society in terms of the information they produce? To answer that question, we gave survey-takers nine historical subjects and asked if historians seem to give them sufficient consideration (Figure 93). It is important to note that these responses track public perceptions rather than reflect historians’ actual efforts put toward these areas of the past. Yet, the results give insights on which topics respondents believe are underserved by historians. At the two poles were the subjects of men and women: the former, indicated respondents, garner too much attention, while the latter, not enough. The safely traditional topic of politics and government ranked second in receiving an excess of historians’ time, but was tied with the more progressive subject of LGBTQ history. This is where turning to measurements of “about the right amount” of treatment is instructive. The topics of the Founding Fathers, the military, and men—all mainstream by most standards—reached 50 percent or higher in terms of adequate treatment. Meanwhile, LGBTQ’s last-place ranking for sufficient attention (19 percent) is joined by racial and ethnic minorities (28 percent) and women (35 percent) as historical subjects that have struggled for greater recognition. This is reinforced by the latter three topics’ leading rankings as areas needing more attention from professionals. The dissonant stance of LGBTQ history as a subject perceived as receiving both too much and not enough treatment, and with the fewest respondents voicing sufficient attention, seems to show it as a polarizing subfield in today’s society.
84
83
85
84
16
17
15
16
0% 10% 20% 30% 40% 50% 60% 70% 80% 90% 100%
Northeast
Midwest
South
West
History just as important History less important

How much does the public value the field of history and historians’ work? History, the Past, and Public Culture | 68
A final observation about the data in Figure 93 is that perceptions of not enough attention (reaching as high as 52 percent) greatly outweighed those of too much (topping out at only 27 percent). And while three topics were perceived as receiving adequate treatment in the minds of at least half of respondents, six subfields failed to reach majority consensus. The overall picture is thus one where historians are seen as coming up short in dealing with many subjects that matter most to the public.
Figure 93: Respondents’ perceptions of attention paid to various subjects by historians. (V18) A key component to addressing this deficit, and therefore to augmenting history’s value in the public eye, is to recognize the dissimilar views of various demographics on these issues. Although it is assumed that survey-takers answer questions dispassionately, it is sometimes hard not to see dissatisfaction, even frustration, in their responses about the attention paid to some subgroups and topics by historians. The consideration given to women was seen as clearly lacking overall, but female respondents gave evidence of feeling especially shortchanged (Figure 94; curiously, we note that 13 percent of female survey-takers did not have thoughts on the matter). Conversely, women believed that men are overstudied in history, relative to their male counterparts’ views (Figure 95). A similar dynamic emerged from Blacks, Hispanics, and other people of color when asked about historians’ work on racial and ethnic minorities (Figure 96).
27
22
22
17
16
15
10
11
4
53
49
19
45
48
50
51
28
35
8
19
40
25
19
23
25
51
52
13
10
19
13
17
12
14
10
10
0% 10% 20% 30% 40% 50% 60% 70% 80% 90% 100%
Men
Politics & government
LGBTQ
Religious groups
Business leaders
Military
Founding Fathers
Racial/ethnic minorities
Women
Too much About right Not enough Don't know

How much does the public value the field of history and historians’ work? History, the Past, and Public Culture | 69
Figure 94: By gender: Respondents’ perceptions of attention paid to women by historians. (V18)
Figure 95: By gender: Respondents’ perceptions of attention paid to men by historians. (V18)
Figure 96: By race/ethnicity: Respondents’ perceptions of attention paid to racial and ethnic minorities by historians. *Fewer than 100 responses. (V18)
5
2
40
30
48
54
7
13
0% 10% 20% 30% 40% 50% 60% 70% 80% 90% 100%
Male
Female
Too much About right Not enough Don't know
21
32
59
46
10
7
9
16
0% 10% 20% 30% 40% 50% 60% 70% 80% 90% 100%
Male
Female
Too much About right Not enough Don't know
9
14
5
4
14
25
34
26
12
31
56
41
54
69
46
9
12
15
15
8
0% 10% 20% 30% 40% 50% 60% 70% 80% 90% 100%
*Other
*2+ races
Hispanic
Black
White
Too much About right Not enough Don't know

How much does the public value the field of history and historians’ work? History, the Past, and Public Culture | 70
Partisanship also appeared as a wedge. Republicans were far less likely than any other party adherents to believe that women (Figure 97), ethnic/racial minorities (Figure 98), and the LGBTQ community (Figure 99) are disregarded in historical work. For their part, Democrats pointed to men (Figure 100), the military (Figure 101), and the Founding Fathers (Figure 102) as topics receiving undue consideration.
Figure 97: By political party: Respondents’ perceptions of attention paid to women by historians. (V18)
Figure 98: By political party: Respondents’ perceptions of attention paid to racial and ethnic minorities by historians. (V18)
2
5
5
2
30
36
53
22
44
50
34
69
25
9
8
7
0% 10% 20% 30% 40% 50% 60% 70% 80% 90% 100%
No preference
Independent
Republican
Democrat
Too much About right Not enough Don't know
9
12
20
5
24
29
46
15
43
51
26
74
24
8
9
7
0% 10% 20% 30% 40% 50% 60% 70% 80% 90% 100%
No preference
Independent
Republican
Democrat
Too much About right Not enough Don't know

How much does the public value the field of history and historians’ work? History, the Past, and Public Culture | 71
Figure 99: By political party: Respondents’ perceptions of attention paid to LGBTQ individuals by historians. (V18)
Figure 100: By political party: Respondents’ perceptions of attention paid to men by historians. (V18)
19
22
41
9
16
21
26
15
30
43
14
62
35
14
19
14
0% 10% 20% 30% 40% 50% 60% 70% 80% 90% 100%
No preference
Independent
Republican
Democrat
Too much About right Not enough Don't know
20
27
9
43
45
53
73
40
9
9
8
8
26
11
10
10
0% 10% 20% 30% 40% 50% 60% 70% 80% 90% 100%
No preference
Independent
Republican
Democrat
Too much About right Not enough Don't know

How much does the public value the field of history and historians’ work? History, the Past, and Public Culture | 72
Figure 101: By political party: Respondents’ perceptions of attention paid to the military by historians. (V18)
Figure 102: By political party: Respondents’ perceptions of attention paid to the Founding Fathers by historians. (V18) Attitudes on these matters might change for two reasons, according to survey data. One reason is age, and there are two plausible scenarios for what forces could be at work. The first runs as follows. Younger people are more tolerant of traditionally neglected groups, such as the LBGTQ community (Figure 103) and racial/ethnic minorities (Figure 104); at the same time, the youngest group are less interested in mainstream topics such as the Founding Fathers (Figure 105) and the military (Figure 106). Younger demographics then carry those values into their later years, in which case society’s principles as a whole change. Contrariwise, the data might indicate that people’s values mutate as they mature,
10
17
3
25
39
49
59
48
22
25
30
16
28
9
7
11
0% 10% 20% 30% 40% 50% 60% 70% 80% 90% 100%
No preference
Independent
Republican
Democrat
Too much About right Not enough Don't know
7
10
2
18
40
53
56
49
22
27
33
18
30
10
9
14
0% 10% 20% 30% 40% 50% 60% 70% 80% 90% 100%
No preference
Independent
Republican
Democrat
Too much About right Not enough Don't know

How much does the public value the field of history and historians’ work? History, the Past, and Public Culture | 73
whereby the younger cohort increasingly comes to hold beliefs that its forebears held earlier, and the cycle begins anew. This latter scenario leaves society’s opinions more or less unchanged on such historical matters. Because survey results represent a snapshot in time, and because these scenarios look only at bivariate relationships, it is hard to know which one is more on target.
Figure 103: By age group: Respondents’ perceptions of attention paid to LGBTQ individuals by historians. (V18)
Figure 104: By age group: Respondents’ perceptions of attention paid to racial and ethnic minorities by historians. (V18)
15
19
26
28
18
17
23
19
50
44
31
36
17
20
20
17
0% 10% 20% 30% 40% 50% 60% 70% 80% 90% 100%
18-29
30-49
50-64
65+
Too much About right Not enough Don't know
9
7
15
15
26
24
31
29
55
56
45
48
10
13
9
8
0% 10% 20% 30% 40% 50% 60% 70% 80% 90% 100%
18-29
30-49
50-64
65+
Too much About right Not enough Don't know

How much does the public value the field of history and historians’ work? History, the Past, and Public Culture | 74
Figure 105: By age group: Respondents’ perceptions of attention paid to the Founding Fathers by historians. (V18)
Figure 106: By age group: Respondents’ perceptions of attention paid to the military by historians. (V18) The second factor signaled in the survey data is higher education. Those with a college degree were far more likely than non–degree holders to perceive historians’ lack of treatment of women (Figure 107), racial/ethnic minorities (Figure 108), and the LGBTQ community (Figure 109); they also felt that historians give too much attention to the military (Figure 110) and men (Figure 111). Differences for other topics by education were marginal, though nondegreed respondents always registered higher “don’t know” rates, often by double digits. We cannot be sure of the reason for these discrepancies. Do college courses lead to students’ more progressive outlooks? Or are individuals with those views already in place more apt to obtain college degrees? The answer need not be strictly binary.
20
14
5
3
46
48
54
55
19
21
28
33
15
18
12
9
0% 10% 20% 30% 40% 50% 60% 70% 80% 90% 100%
18-29
30-49
50-64
65+
Too much About right Not enough Don't know
23
20
9
8
44
44
55
57
19
21
26
24
13
14
10
10
0% 10% 20% 30% 40% 50% 60% 70% 80% 90% 100%
18-29
30-49
50-64
65+
Too much About right Not enough Don't know

How much does the public value the field of history and historians’ work? History, the Past, and Public Culture | 75
Figure 107: By education level: Respondents’ perceptions of attention paid to women by historians. (V18)
Figure 108: By education level: Respondents’ perceptions of attention paid to racial/ethnic minorities by historians. (V18)
Figure 109: By education level: Respondents’ perceptions of attention paid to LGBTQ individuals by historians. (V18)
3
5
37
31
47
61
14
4
0% 10% 20% 30% 40% 50% 60% 70% 80% 90% 100%
No college degree
College degree
Too much About right Not enough Don't know
12
10
29
25
46
60
13
5
0% 10% 20% 30% 40% 50% 60% 70% 80% 90% 100%
No college degree
College degree
Too much About right Not enough Don't know
24
19
20
19
34
50
23
12
0% 10% 20% 30% 40% 50% 60% 70% 80% 90% 100%
No college degree
College degree
Too much About right Not enough Don't know

How much does the public value the field of history and historians’ work? History, the Past, and Public Culture | 76
Figure 110: By education level: Respondents’ perceptions of attention paid to the military by historians. (V18)
Figure 111: By education level: Respondents’ perceptions of attention paid to men by historians. (V18)
Challenges and opportunities: Results in this section are a tale of the glass being half full and half empty. On the plus side, there is strong majority support for the central importance of learning about the past, but unfortunately, that sentiment is not translating into a better situation on college campuses. The AHA has actively promoted solutions to this issue, and it at least appears that the enrollments ship is no longer taking on water. Respondents voiced the need for historians to devote greater or less attention to a variety of subjects, but it appears that any adjustment runs the risk of alienating as many people as it assuages. Navigating this minefield is no simple task.
11
22
49
52
24
19
15
6
0% 10% 20% 30% 40% 50% 60% 70% 80% 90% 100%
No college degree
College degree
Too much About right Not enough Don't know
21
37
53
53
10
5
16
5
0% 10% 20% 30% 40% 50% 60% 70% 80% 90% 100%
No college degree
College degree
Too much About right Not enough Don't know

What are the public’s attitudes toward a changing and uncomfortable past? History, the Past, and Public Culture | 77
9. What are the public’s attitudes toward a changing and uncomfortable past?
Summary: A majority of Americans across nearly all demographic groups surveyed recognize that interpretations of history should change, but their understandings of why those changes take place vary. Additionally, nearly two-thirds of those surveyed agreed that it is acceptable to teach history about the harm done to others, even if such an approach causes learners discomfort. The widest divisions, especially as a function of political party affiliation, surfaced when people were asked whether history should question or celebrate the nation’s past.
The term “revisionist history,” often used pejoratively, is an accusation of deliberately distorting irrefutable historical “facts” to serve a particular political agenda or viewpoint. However, when asked whether what we know about the history of people and events should ever change, a clear majority (62 percent) of our survey respondents agreed that it should (Figure 112). This is an especially salient point, given that the public overwhelmingly sees history mostly as an assembly of objective factual material (Figure 1). As such, a majority of respondents (61 percent) believed that our knowledge of the past changes only when new information comes to light, as opposed to when extant facts are reinterpreted (Figure 113). Indeed, those harboring such a facts-based view of history were least likely to think that our understanding of the past should ever shift (Figure 114). This indicates a belief that history is immutable, whereby revisionism is something to be viewed with skepticism. When broken out by age, the differences in views about the mutability of the past are only minor (ranging from 60–65 percent), with the youngest group, 18- to 29-year-olds, most likely to agree that historical understandings should change (Figure 115). We see more significant differences when education level is considered: 77 percent of respondents with a college degree believe interpretations of history should alter, while only 54 percent (still a majority) of those without a college education agree (Figure 116).
Figure 112: Survey respondents’ views on whether knowledge of the history of people and events should ever change. (HR1)
62%
38%Knowledge of history should change
Knowledge of history should notchange
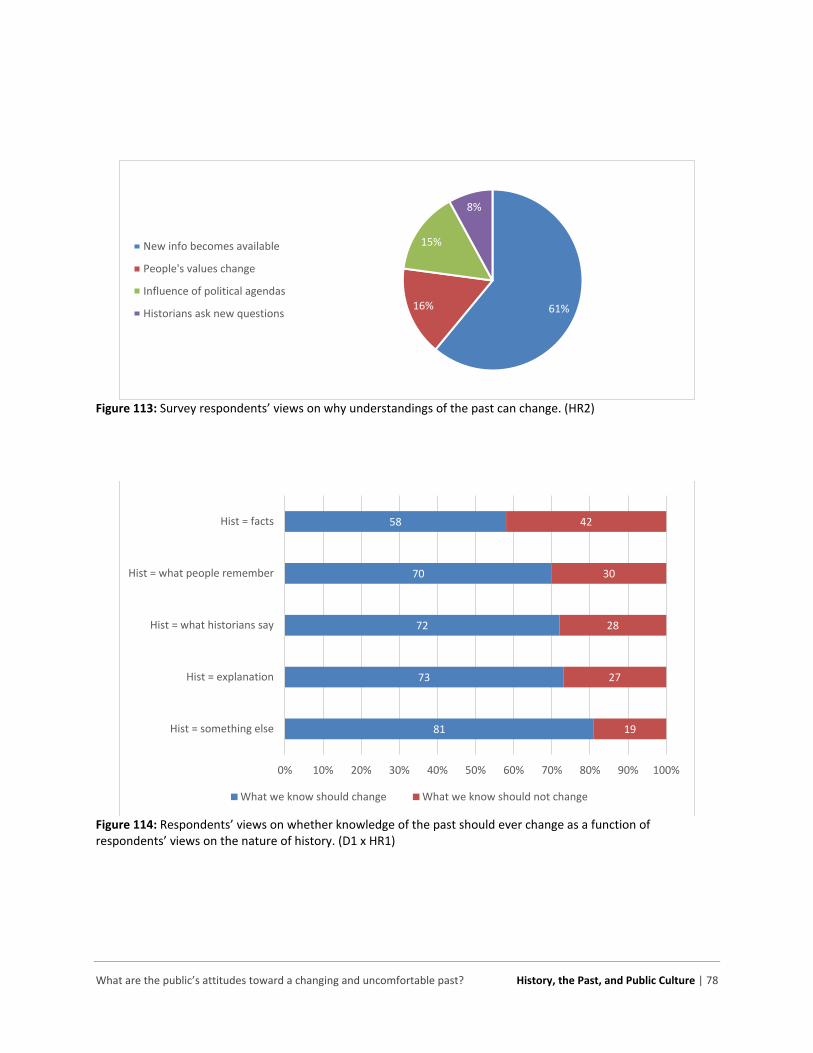
What are the public’s attitudes toward a changing and uncomfortable past? History, the Past, and Public Culture | 78
Figure 113: Survey respondents’ views on why understandings of the past can change. (HR2)
Figure 114: Respondents’ views on whether knowledge of the past should ever change as a function of respondents’ views on the nature of history. (D1 x HR1)
61%16%
15%
8%
New info becomes available
People's values change
Influence of political agendas
Historians ask new questions
81
73
72
70
58
19
27
28
30
42
0% 10% 20% 30% 40% 50% 60% 70% 80% 90% 100%
Hist = something else
Hist = explanation
Hist = what historians say
Hist = what people remember
Hist = facts
What we know should change What we know should not change

What are the public’s attitudes toward a changing and uncomfortable past? History, the Past, and Public Culture | 79
Figure 115: By age group: Respondents’ views on whether knowledge of the history of people and events should ever change. (HR1)
Figure 116: By education level: Respondents’ views on whether knowledge of the history of people and events should ever change. (HR1) However, when examined through the lens of either race/ethnicity or political party affiliation, we see three outliers in attitudes toward revisionist history. For Hispanic respondents (Figure 117) and those identifying as Republicans or no party preference (Figure 118), a slight majority (52 percent each) believed that interpretations of history should not change. Such figures juxtapose considerably with those of whites and Blacks (Figure 117) and Democrats and independents (Figure 118).
65
62
62
60
35
38
38
40
0% 10% 20% 30% 40% 50% 60% 70% 80% 90% 100%
18-29
30-49
50-64
65+
Knowledge of history should change Knowledge of history should not change
54
77
46
23
0% 10% 20% 30% 40% 50% 60% 70% 80% 90% 100%
No college degree
College degree
Knowledge of history should change Knowledge of history should not change

What are the public’s attitudes toward a changing and uncomfortable past? History, the Past, and Public Culture | 80
Figure 117: By race/ethnicity: Respondents’ views on whether knowledge of the history of people and events should ever change. *Fewer than 100 responses. (HR1)
Figure 118: By political party: Respondents’ views on whether knowledge of the history of people and events should ever change. (HR1) To our survey respondents, it is that variable nature of historical knowledge that makes it particularly difficult to grasp. A related poll item asked respondents to reflect on the complexity of the discipline, particularly whether learning history is challenging because basic facts and our understandings thereof do or do not shift. Sixty-three percent admitted to the complexity of the past due to changing understandings of basic facts (compare this with the 62 percent who felt historical knowledge should change in Figure 112). The connection between malleable historical knowledge and difficulty understanding the past filtered down to age bracket subgroups (Figure 119; compare with Figure 115),
77
59
48
62
64
23
41
52
38
36
0% 10% 20% 30% 40% 50% 60% 70% 80% 90% 100%
*Other
*2+ races
Hispanic
Black
White
Knowledge of history should change Knowledge of history should not change
48
70
48
74
52
30
52
26
0% 10% 20% 30% 40% 50% 60% 70% 80% 90% 100%
No preference
Independent
Republican
Democrat
Knowledge of history should change Knowledge of history should not change

What are the public’s attitudes toward a changing and uncomfortable past? History, the Past, and Public Culture | 81
to education demographics (Figure 120; compare with Figure 116), to racial/ethnic groups (Figure 121; compare with Figure 117), and rather starkly to political parties (Figure 122; compare with Figure 118). Here, we note that Republicans were the sole respondents where only a minority (45 percent) thought learning history was difficult—most likely because this group’s conception of the historical record was static.
Figure 119: By age group: Respondents’ views on complexity of learning history as function of changing facts. (V1)
Figure 120: By education level: Respondents’ views on complexity of learning history as function of changing facts. (V1)
64
62
58
66
36
38
42
34
0% 10% 20% 30% 40% 50% 60% 70% 80% 90% 100%
18-29
30-49
50-64
65+
Learning history complex because understandings of facts change
Learning history not complex because facts don't change
58
71
42
29
0% 10% 20% 30% 40% 50% 60% 70% 80% 90% 100%
No college degree
College degree
Learning history complex because understandings of facts change
Learning history not complex because facts don't change
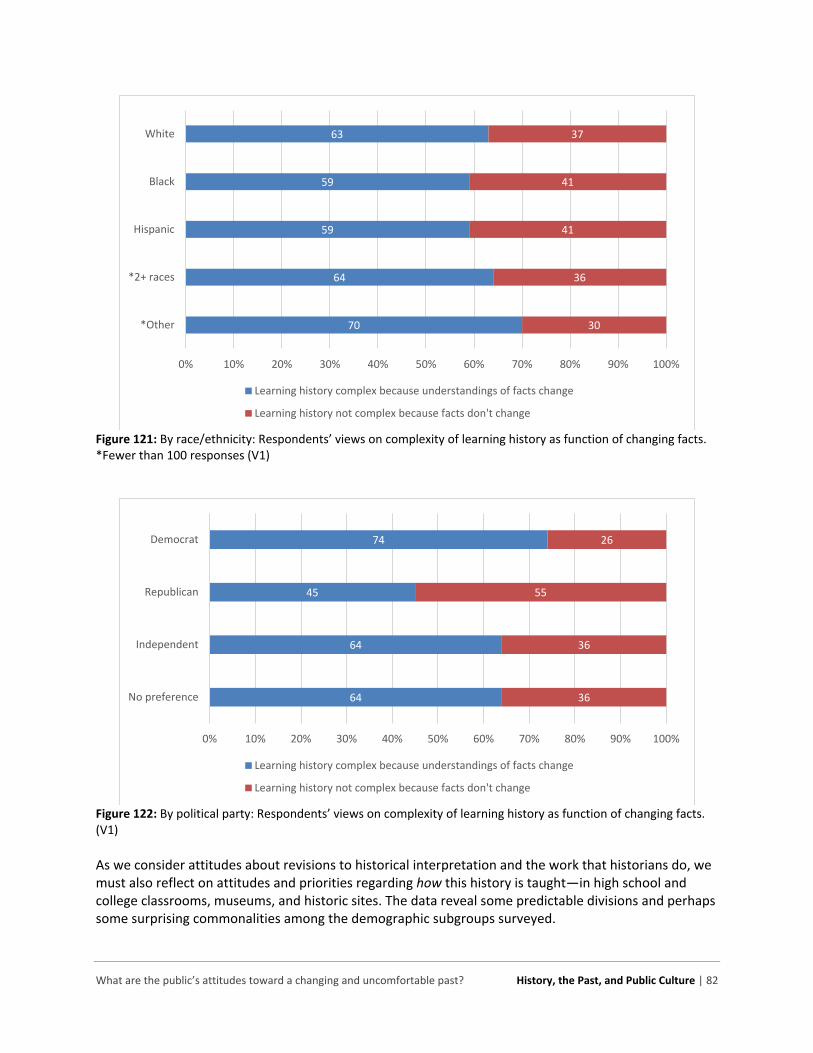
What are the public’s attitudes toward a changing and uncomfortable past? History, the Past, and Public Culture | 82
Figure 121: By race/ethnicity: Respondents’ views on complexity of learning history as function of changing facts. *Fewer than 100 responses (V1)
Figure 122: By political party: Respondents’ views on complexity of learning history as function of changing facts. (V1) As we consider attitudes about revisions to historical interpretation and the work that historians do, we must also reflect on attitudes and priorities regarding how this history is taught—in high school and college classrooms, museums, and historic sites. The data reveal some predictable divisions and perhaps some surprising commonalities among the demographic subgroups surveyed.
70
64
59
59
63
30
36
41
41
37
0% 10% 20% 30% 40% 50% 60% 70% 80% 90% 100%
*Other
*2+ races
Hispanic
Black
White
Learning history complex because understandings of facts change
Learning history not complex because facts don't change
64
64
45
74
36
36
55
26
0% 10% 20% 30% 40% 50% 60% 70% 80% 90% 100%
No preference
Independent
Republican
Democrat
Learning history complex because understandings of facts change
Learning history not complex because facts don't change

What are the public’s attitudes toward a changing and uncomfortable past? History, the Past, and Public Culture | 83
When asked whether history should celebrate or question the nation’s past, there was a relatively even split among all respondents, with 47 percent believing history should question America’s past while 53 percent think history should celebrate it (Figure 123). The divisions become wider when accounting for age, education level, and race/ethnicity. The youngest respondents, 18- to 29-year-olds (57 percent), were more likely than older respondents (42–48 percent) to agree that history should question America’s past (Figure 124). A majority of college-educated respondents (57 percent) believed the nation’s past should be questioned, compared to only 42 percent of those without college degrees (Figure 125). Whites (58 percent) were somewhat or greatly more likely than respondents of color (51 percent Hispanics, 31 percent Blacks) to believe that the past should be celebrated (Figure 126). Some regional differences showed up on this matter, but those differences were not particularly broad (Figure 127). Most strikingly, 84 percent of Republicans thought that history should celebrate our nation’s past, while 70 percent of Democrats said that history should question it (Figure 128).
Figure 123: Survey respondents’ views on whether history should celebrate nation’s past. (V12)
Figure 124: By age group: Respondents’ views on whether history should celebrate nation’s past. (V12)
53%
47%History should celebrate nation's past
History should question nation's past
43
52
58
57
57
48
42
43
0% 10% 20% 30% 40% 50% 60% 70% 80% 90% 100%
18-29
30-49
50-64
65+
Should celebrate nation's past Should question nation's past

What are the public’s attitudes toward a changing and uncomfortable past? History, the Past, and Public Culture | 84
Figure 125: By education level: Respondents’ views on whether history should celebrate nation’s past. (V12)
Figure 126: By race/ethnicity: Respondents’ views on whether history should celebrate nation’s past. *Fewer than 100 responses. (V12)
58
43
42
57
0% 10% 20% 30% 40% 50% 60% 70% 80% 90% 100%
No college degree
College degree
Should celebrate nation's past Should question nation's past
48
52
51
31
58
52
48
49
69
42
0% 10% 20% 30% 40% 50% 60% 70% 80% 90% 100%
*Other
*2+ races
Hispanic
Black
White
Should celebrate nation's past Should question nation's past

What are the public’s attitudes toward a changing and uncomfortable past? History, the Past, and Public Culture | 85
Figure 127: By region: Respondents’ views on whether history should celebrate nation’s past. (V12)
Figure 128: By political party: Respondents’ views on whether history should celebrate nation’s past. (V12) The “history wars” are evident in legislation currently introduced in at least 26 states that would restrict the discussion of “divisive concepts” in public education institutions. There is clear partisan division between Republicans who support these bills and Democrats who oppose them. However, the survey data reveal that regardless of political identity—or even age, race, gender, or education level—most Americans agree that honest reckoning with their histories is needed, even if that history makes learners feel uncomfortable. Thus, the “history wars” making headlines and causing so much strife are somewhat of a chimera, insofar as the agendas being pushed by political figures are often unreflective of the will of their constituents. Asked whether it was acceptable to make learners uncomfortable by teaching the harm some people have done to others, over three-fourths of respondents said it was (Figure 129). That breakdown
50
53
57
48
50
47
43
52
0% 10% 20% 30% 40% 50% 60% 70% 80% 90% 100%
Northeast
Midwest
South
West
Should celebrate nation's past Should question nation's past
53
51
84
30
47
49
16
70
0% 10% 20% 30% 40% 50% 60% 70% 80% 90% 100%
No preference
Independent
Republican
Democrat
Should celebrate nation's past Should question nation's past

What are the public’s attitudes toward a changing and uncomfortable past? History, the Past, and Public Culture | 86
remained largely constant across age groups (Figure 130), education levels (Figure 131), genders (Figure 132), and geographic locations (Figure 133). Even by political affiliation the similarities held steady, with 78 percent of Democrats and 74 percent of Republicans supporting the appropriateness of confronting painful history (Figure 134). The only outlier here was among Hispanic respondents, where just 58 percent—still a clear majority—defended making history learners uncomfortable (Figure 135).
Figure 129: Survey respondents’ views on uncomfortable history. (V7)
Figure 130: By age group: Respondents’ views on uncomfortable history. (V7)
23%
77%
Teaching past shouldn't makepeople uncomfortable even if aboutharm some did to others
Acceptable to teach history aboutharm done to others even if itcauses discomfort
21
25
23
23
79
75
77
77
0% 10% 20% 30% 40% 50% 60% 70% 80% 90% 100%
18-29
30-49
50-64
65+
Teaching past shouldn't make people uncomfortable even if about harm some did to others
Acceptable to teach history about harm done to others even if it causes discomfort

What are the public’s attitudes toward a changing and uncomfortable past? History, the Past, and Public Culture | 87
Figure 131: By education level: Respondents’ views on uncomfortable history. (V7)
Figure 132: By gender: Respondents’ views on uncomfortable history. (V7)
Figure 133: By region: Respondents’ views on uncomfortable history. (V7)
29
13
71
87
0% 10% 20% 30% 40% 50% 60% 70% 80% 90% 100%
No college degree
College degree
Teaching past shouldn't make people uncomfortable even if about harm some did to others
Acceptable to teach history about harm done to others even if it causes discomfort
24
23
76
77
0% 10% 20% 30% 40% 50% 60% 70% 80% 90% 100%
Male
Female
Teaching past shouldn't make people uncomfortable even if about harm some did to others
Acceptable to teach history about harm done to others even if it causes discomfort
22
20
25
23
78
80
75
77
0% 10% 20% 30% 40% 50% 60% 70% 80% 90% 100%
Northeast
Midwest
South
West
Teaching past shouldn't make people uncomfortable even if about harm some did to others
Acceptable to teach history about harm done to others even if it causes discomfort

What are the public’s attitudes toward a changing and uncomfortable past? History, the Past, and Public Culture | 88
Figure 134: By political party: Respondents’ views on uncomfortable history. (V7)
Figure 135: By race/ethnicity: Respondents’ views on uncomfortable history. *Fewer than 100 responses. (V7) Another clear majority—90 percent of respondents overall, and never less than 88 percent of any demographic subgroup—indicated that when history makes them feel uncomfortable, they choose to
33
15
26
22
67
85
74
78
0% 10% 20% 30% 40% 50% 60% 70% 80% 90% 100%
No preference
Independent
Republican
Democrat
Teaching past shouldn't make people uncomfortable even if about harm some did to others
Acceptable to teach history about harm done to others even if it causes discomfort
22
24
42
21
19
78
76
58
79
81
0% 10% 20% 30% 40% 50% 60% 70% 80% 90% 100%
*Other
*2+ races
Hispanic
Black
White
Teaching past shouldn't make people uncomfortable even if about harm some did to others
Acceptable to teach history about harm done to others even if it causes discomfort

What are the public’s attitudes toward a changing and uncomfortable past? History, the Past, and Public Culture | 89
further investigate rather than avoid it (Figure 136; compare with Figure 50). Those numbers remained remarkably steady, never varying by more than just a few points, across all demographics studied here. We note that such views may be more aspirational than real: only further research could determine whether respondents actually follow through on their pledge to delve into distressing material or actively seek out information that questions assumed facts. Nevertheless, the data underscore how out-of-step current legislative efforts are in attempting to curtail examination of painful topics in US history. This mirrors other political hot-button issues such as gun purchase background checks, where legislators routinely block increased regulation despite overwhelming support of their constituents across the political spectrum.
Figure 136: Respondents’ reported action taken when encountering uncomfortable history. (V11)
Challenges and opportunities: Although current political divisions about the purposes and priorities of teaching history in public institutions are significant, Americans, regardless of age, race/ethnicity, gender, education level, or political identity, are eager and willing to learn about histories that make them uncomfortable. It is likewise evident that a belief in the historical record as unchanging is associated with an understanding that history is primarily an agglomeration of facts, as opposed to a dynamic field that is constantly being reassessed. Shifting the focus from simply knowing the past to understanding its fluid properties and innate complexity would surely help, but such change constitutes a heavy lift for both the public and the professionals who serve them.
90%
10%
Further investigate it
Avoid further investigation
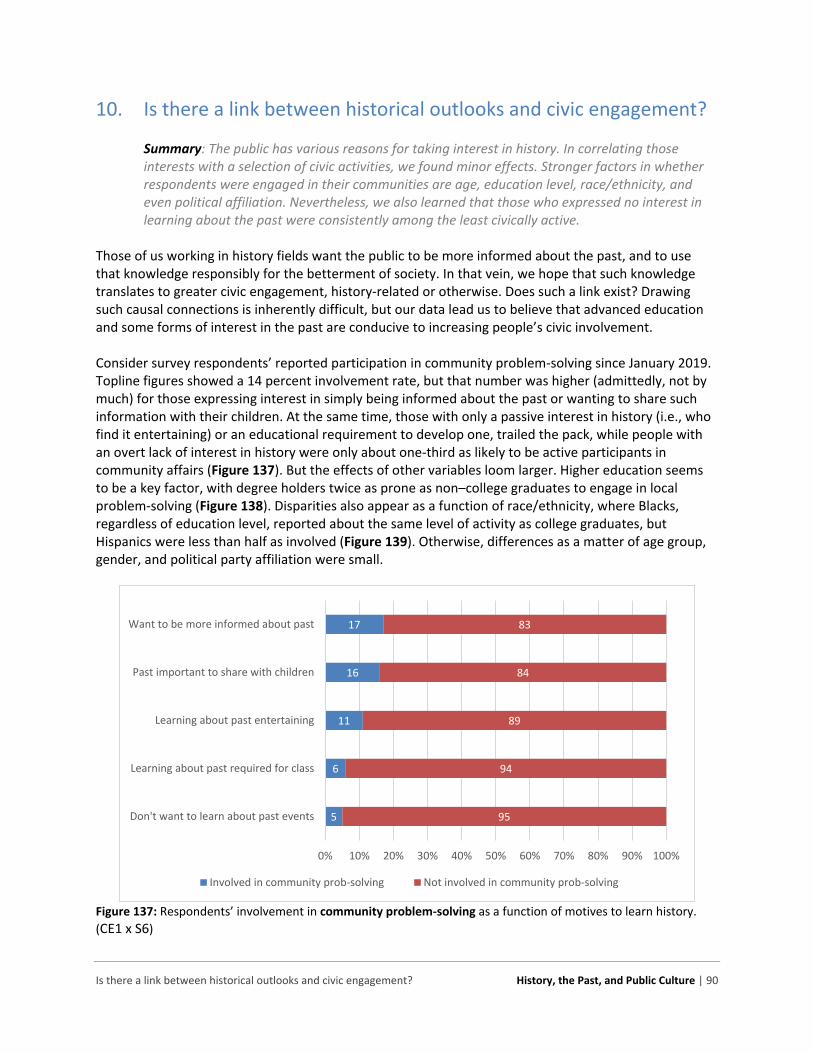
Is there a link between historical outlooks and civic engagement? History, the Past, and Public Culture | 90
10. Is there a link between historical outlooks and civic engagement?
Summary: The public has various reasons for taking interest in history. In correlating those interests with a selection of civic activities, we found minor effects. Stronger factors in whether respondents were engaged in their communities are age, education level, race/ethnicity, and even political affiliation. Nevertheless, we also learned that those who expressed no interest in learning about the past were consistently among the least civically active.
Those of us working in history fields want the public to be more informed about the past, and to use that knowledge responsibly for the betterment of society. In that vein, we hope that such knowledge translates to greater civic engagement, history-related or otherwise. Does such a link exist? Drawing such causal connections is inherently difficult, but our data lead us to believe that advanced education and some forms of interest in the past are conducive to increasing people’s civic involvement. Consider survey respondents’ reported participation in community problem-solving since January 2019. Topline figures showed a 14 percent involvement rate, but that number was higher (admittedly, not by much) for those expressing interest in simply being informed about the past or wanting to share such information with their children. At the same time, those with only a passive interest in history (i.e., who find it entertaining) or an educational requirement to develop one, trailed the pack, while people with an overt lack of interest in history were only about one-third as likely to be active participants in community affairs (Figure 137). But the effects of other variables loom larger. Higher education seems to be a key factor, with degree holders twice as prone as non–college graduates to engage in local problem-solving (Figure 138). Disparities also appear as a function of race/ethnicity, where Blacks, regardless of education level, reported about the same level of activity as college graduates, but Hispanics were less than half as involved (Figure 139). Otherwise, differences as a matter of age group, gender, and political party affiliation were small.
Figure 137: Respondents’ involvement in community problem-solving as a function of motives to learn history. (CE1 x S6)
5
6
11
16
17
95
94
89
84
83
0% 10% 20% 30% 40% 50% 60% 70% 80% 90% 100%
Don't want to learn about past events
Learning about past required for class
Learning about past entertaining
Past important to share with children
Want to be more informed about past
Involved in community prob-solving Not involved in community prob-solving

Is there a link between historical outlooks and civic engagement? History, the Past, and Public Culture | 91
Figure 138: By education level: Respondents’ involvement in community problem-solving. (CE1)
Figure 139: By race/ethnicity: Respondents’ involvement in community problem-solving. *Fewer than 100 responses. (CE1) We see a similar pattern play out in the related activity of volunteer work since early 2019. Once again, the topline figure of involvement (30 percent) is a bit lower than the 36 percent for people expressing a general interest in history, and about on par with figures for other motives. A lack of interest in history is negatively correlated with volunteerism by a wide margin (Figure 140). College education (Figure 141) and race (Figure 142) are two other key variables in predicting volunteer activities, though in this case, whites’ involvement exceeds that of people of color by double digits.
10
20
90
80
0% 10% 20% 30% 40% 50% 60% 70% 80% 90% 100%
No college degree
College degree
Involved in community prob-solving Not involved in community prob-solving
15
12
9
21
14
85
88
91
79
86
0% 10% 20% 30% 40% 50% 60% 70% 80% 90% 100%
*Other
*2+ Races
Hispanic
Black
White
Involved in community prob-solving Not involved in community prob-solving

Is there a link between historical outlooks and civic engagement? History, the Past, and Public Culture | 92
Figure 140: Respondents’ involvement in volunteer work as a function of motives to learn history. (CE3 x S6)
Figure 141: By education level: Respondents’ involvement in volunteer work. (CE3)
Figure 142: By race: Respondents’ involvement in volunteer work. (CE3)
12
27
31
31
36
88
73
69
69
64
0% 10% 20% 30% 40% 50% 60% 70% 80% 90% 100%
Don't want to learn about past events
Learning about past entertaining
Learning about past required for class
Past important to share with children
Want to be more informed about past
Involved in volunteer work Not involved in volunteer work
23
42
77
58
0% 10% 20% 30% 40% 50% 60% 70% 80% 90% 100%
No college degree
College degree
Involved in volunteer work Not involved in volunteer work
24
34
76
66
0% 10% 20% 30% 40% 50% 60% 70% 80% 90% 100%
Person of color
White
Involved in volunteer work Not involved in volunteer work

Is there a link between historical outlooks and civic engagement? History, the Past, and Public Culture | 93
Political engagement might track with historical curiosity, as sometimes happened in the case of respondents’ contact with an elected official. Twenty-two percent in the overall survey reported such contact, a number equaled or exceeded by those with a general or legacy interest in the past. Those looking to history merely for entertainment or as an educational obligation were less prone to be in touch with a public official, while an expression of uninterest in history was associated with the lowest such activity (Figure 143). In this case of civic engagement, age was likewise a factor, with older respondents being far more likely than younger ones to call on representatives (Figure 144). Greater or lesser involvement as a matter of college education (Figure 145) or race (Figure 146) mirror what we saw in the preceding example of volunteerism. Breaking down the race category further indicates that white men and women were about twice as likely to contact elected officials than were people of color, whether male or female (Figure 147).
Figure 143: Respondents’ contact with an elected official to express an opinion or concern as a function of motives to learn history. (CE4 x S6)
Figure 144: By age group: Respondents’ contact with an elected official to express an opinion or concern. (CE4)
6
9
18
22
28
94
91
82
78
72
0% 10% 20% 30% 40% 50% 60% 70% 80% 90% 100%
Don't want to learn about past events
Learning about past required for class
Learning about past entertaining
Past important to share with children
Want to be more informed about past
Contact made No contact made
18
16
22
32
82
84
78
68
0% 10% 20% 30% 40% 50% 60% 70% 80% 90% 100%
18-29
30-49
50-64
65+
Contact made No contact made

Is there a link between historical outlooks and civic engagement? History, the Past, and Public Culture | 94
Figure 145: By education level: Respondents’ contact with an elected official to express an opinion or concern. (CE4)
Figure 146: By race: Respondents’ contact with an elected official to express an opinion or concern. (CE4)
Figure 147: By gender/race/ethnicity: Respondents’ contact with an elected official to express an opinion or concern. (CE4)
16
32
84
68
0% 10% 20% 30% 40% 50% 60% 70% 80% 90% 100%
No college degree
College degree
Contact made No contact made
13
26
87
74
0% 10% 20% 30% 40% 50% 60% 70% 80% 90% 100%
Person of color
White
Contact made No contact made
13
14
24
29
87
86
76
71
0% 10% 20% 30% 40% 50% 60% 70% 80% 90% 100%
Female person of color
Male person of color
White female
White male
Contact made No contact made

Is there a link between historical outlooks and civic engagement? History, the Past, and Public Culture | 95
The ultimate manifestation of civic engagement is arguably the act of voting. Overall, 52 percent of survey respondents told us they always voted, with another 40 percent indicating variable voting patterns and the remaining 8 percent not registered to vote. Once again, we see those with a general interest in wanting to know more about the past being notably more active than topline figures: 59 percent unfailingly voted, while only 4 percent were not registered. But other motives for being historically informed did not fare as well, with adherents falling below or above the always voting/unregistered thresholds, respectively. For once, those with no interest in the past did not come in last place as stalwart ballot casters, though they did bring up the unregistered rear by more than double the topline results (Figure 148).
Figure 148: Respondents’ voting habits in elections as a function of motives to learn history. (CE2 x S6) Based on these correlations between civic engagement and attitudes toward learning history, one could make the argument that a general curiosity about the past is a net positive. But other reasons for finding interest in history had an ambiguous or even negative effect. Moreover, in the case of voting, other factors appear to weigh much more heavily on people’s decisions to cast ballots or not. Unsurprisingly, age was a major determinant, as those in the 65+ bracket outpaced younger voters by at least 20 points (Figure 149). A similar effect is seen in the voting patterns of college graduates versus their nondegreed peers (Figure 150), and the comparatively low suffrage rates and correspondingly high unregistered number for Hispanics is equally striking (Figure 151). And while Democrats and Republicans reported very similar voting patterns, independents were much less reliable, while the habits of those with no party preference were downright abysmal (Figure 152). We might have always suspected it, but apathy truly is the kill switch to an engaged citizenry.
36
22
48
52
59
45
70
41
39
36
20
8
11
10
4
0% 10% 20% 30% 40% 50% 60% 70% 80% 90% 100%
Don't want to learn about past events
Learning about past required for class
Past important to share with children
Learning about past entertaining
Want to be more informed about past
Always vote Don't always vote Not registered to vote

Is there a link between historical outlooks and civic engagement? History, the Past, and Public Culture | 96
Figure 149: By age group: Respondents’ voting habits in elections. (CE2)
Figure 150: By education level: Respondents’ voting habits in elections. (CE2)
Figure 151: By race/ethnicity: Respondents’ voting habits in elections. *Fewer than 100 responses. (CE2)
38
43
55
75
49
46
39
22
13
11
6
3
0% 10% 20% 30% 40% 50% 60% 70% 80% 90% 100%
18-29
30-49
50-64
65+
Always vote Don't always vote Not registered to vote
46
64
43
33
11
3
0% 10% 20% 30% 40% 50% 60% 70% 80% 90% 100%
No college degree
College degree
Always vote Don't always vote Not registered to vote
43
48
34
53
58
46
48
48
40
36
10
5
17
7
6
0% 10% 20% 30% 40% 50% 60% 70% 80% 90% 100%
*Other
*2+ Races
Hispanic
Black
White
Always vote Don't always vote Not registered to volte

Is there a link between historical outlooks and civic engagement? History, the Past, and Public Culture | 97
Figure 152: By political party: Respondents’ voting habits in elections. (CE2) A final cross-tabulation adds perspective to the relationship between civic engagement and attitudes toward the past. It involves correlating community involvement with a belief in whether our knowledge of history should change (see Section 9 for a discussion of the latter). In these comparisons, we see that those harboring a malleable understanding of past events are more apt to be civically engaged, registering involvement figures that are 8 to 13 points higher than their fixed-knowledge counterparts. This is true of community problem-solving (Figure 153), volunteerism (Figure 154), contact with elected officials (Figure 155), and voting habits (Figure 156). Such findings are suggestive of a correlation between a belief in the variable nature of historical knowledge and in one’s own ability to change the world, keeping in mind the bivariate nature of these relationships.
Figure 153: Respondents’ involvement in community problem-solving as a function of a changing or fixed view on historical knowledge. (CE1 x HR1)
22
50
61
60
52
41
37
36
26
9
3
4
0% 10% 20% 30% 40% 50% 60% 70% 80% 90% 100%
No Preference
Independent
Republican
Democrat
Always vote Don't always vote Not registered to vote
9
17
91
83
0% 10% 20% 30% 40% 50% 60% 70% 80% 90% 100%
Knowledge of history should not change
Knowledge of history should change
Involved in community prob-solving Not involved in community prob-solving

Is there a link between historical outlooks and civic engagement? History, the Past, and Public Culture | 98
Figure 154: Respondents’ involvement in volunteer work as a function of a changing or fixed view on historical knowledge. (CE3 x HR1)
Figure 155: Respondents’ contact with an elected official to express an opinion or concern as a function of a changing or fixed view on historical knowledge. (CE4 x HR1)
Figure 156: Respondents’ voting habits as a function of a changing or fixed view on historical knowledge. (CE2 x HR1)
Challenges and opportunities: The results of this section are a bit mixed, depending on one’s perspective. If one’s goal is to limit citizens’ participation in society, as a current raft of state-sponsored voter suppression legislation seeks to do, then a few options readily present themselves. Meddling in people’s historical outlooks, which is the apparent objective of restrictions on the teaching of so-called “divisive concepts,” would appear to make little difference, since there are only minor correlations between historical outlooks and civic
22
35
78
65
0% 10% 20% 30% 40% 50% 60% 70% 80% 90% 100%
Knowledge of history should not change
Knowledge of history should change
Involved in volunteer work Not involved in volunteer work
15
25
85
75
0% 10% 20% 30% 40% 50% 60% 70% 80% 90% 100%
Knowledge of past should not change
Knowledge of past should change
Have contacted elected official Have not contacted elected official
47
55
42
38
11
7
0% 10% 20% 30% 40% 50% 60% 70% 80% 90% 100%
Knowledge of past should not change
Knowledge of past should change
Always vote Don't always vote Not registered

Is there a link between historical outlooks and civic engagement? History, the Past, and Public Culture | 99
engagement. However, if people’s interests in the past are so completely short-circuited that they stop caring altogether, our findings show that the effects on public action can be more profound. Less pessimistically, getting citizens a college education and ensuring they live into their senior years are two indirect but seemingly reliable ways to promote civic engagement. The fact that history is a cornerstone to many undergraduate programs is thus a reason for optimism.
Appendix A. Survey Development and Methodology History, the Past, and Public Culture | 100
Appendix A. Survey Development and Methodology In order to arrive at a survey with questions that reflect how Americans conceive of and interact with history, the project team enlisted the assistance of a national advisory committee and convened several focus group meetings with regional experts. The first advisory committee meeting was held in August 2019 in Washington, DC, with a collection of esteemed public and academic historians, think tank leaders, and museum directors. The focus group discussions took place in late August 2019 during several sessions at the annual meeting of the American Association of State and Local History in Philadelphia. The full list of participants for the Advisory Committee and focus groups can be found in Appendix C. Over the course of these meetings, the groups considered questions from Rosenzweig and Thelen’s original study relative to today’s inquiry and what was important for including on a survey of Americans and history in 2020. Advisors suggested that the national survey should repeat enough of the original queries of Presence of the Past to suggest how public perceptions have changed (or not) over a quarter of a century. But the survey should also create new metrics, especially regarding assessing the impact of various cultural changes in American society over the past two decades, such as how the general public receives information about the past (e.g., websites, social media, 24-hour news channels) and in how approaches to teaching history have also changed. Upon conclusion of these discussions, the project directors, working in conjunction with staff at the Fairleigh Dickinson University Poll, arrived at a questionnaire that reflected this balance. Following the qualitative component to questionnaire construction, the project team engaged Ipsos Public Affairs (Ipsos) to conduct the national survey. The History, Past, and Public Culture Study used Ipsos’s KnowledgePanel®, the largest online panel in the United States that relies on probability-based sampling methods for recruitment to provide a representative sampling frame for adults in the United States. The target population was comprised of noninstitutionalized adults ages 18 and older residing in the United States. The sample consisted of general population adults ages 18 and older and an augmented sample of 18- to 29-year-olds. Ipsos invited one adult from a representative sample of households to partake in this survey. Selected panel members received an email invitation to complete the survey and were asked to do so at their earliest convenience. A total of 1,816 US adults completed the survey. Data collection was conducted in English and Spanish from October 2–18, 2020. Statistical results are weighted to correct known demographic discrepancies. The total sample design effect for this survey is 1.1396, and the margin of sampling error for the complete set of weighted data is plus or minus 2.45 percentage points. Details on the sampling, questionnaire design, data collection, processing, and weighting can be found online in the Ipsos Methodology Report.

Appendix B. Survey Instrument and Topline Results History, the Past, and Public Culture | 101
Appendix B. Survey Instrument and Topline Results D1. First, which of the following BEST describes what you think the term “history” means? History is names, dates, and other facts about what happened in the past ........................ 66% History is what people remember about the past ................................................................ 5% History is an explanation of experiences in the past ............................................................ 17% History is what historians have concluded about the past ................................................... 9% Something else ...................................................................................................................... 3% N = 1811 D2. In your own words, please tell us what you think the term “history” means? [Asked of respondents who selected “something else” in D1] [Verbatim responses] S1. Since January of 2019, did you do any of the following activities to learn about events in the past? Took a college course, either in person or online ................................................................. 8% (143) Listened to a podcast or radio program about historical events .......................................... 25% (449) Watched a documentary film or video about historical events ........................................... 69% (1253) Went on social media, including Twitter, Facebook, Snapchat, Instagram, and other sources to learn about historical events ............................................................................... 26% (453) Watched cable or network television news about historical events .................................... 62% (1126) Read a newspaper or magazine article about historical events, either online or in print ... 55% (1114) Visited a museum in person or online .................................................................................. 35% (1012) Visited a historic site, such as a battlefield, monument, or building, either in person or online ................................................................................................................................ 38% (695) Read a nonfiction book about historical events ................................................................... 32% (584) Read a historical fiction book ................................................................................................ 26% (481) Talked with someone in my community about historical events ......................................... 37% (690) Read a religious document, such as the Bible or Qur’an ...................................................... 39% (692) Took a DNA test such as those offered by companies like 23andMe and AncestryDNA ..... 11% (201) Attended a lecture about history, either in person or online ............................................... 12% (212) Looked into the history of your family or worked on your family tree ................................ 33% (621) Watched a fictional film, television, or online program set in the past ............................... 66% (1212) Consulted Wikipedia about historical events ....................................................................... 46% (845) Did a search on the internet (not including Wikipedia) about historical events .................. 59% (1073) Played history-related video games...................................................................................... 11% (217) S2. Are there other activities not mentioned that you did since January of 2019 to learn about the past? If yes, please specify: Yes [Verbatim responses] ...................................................................................................... 11% I did not do anything since January of 2019 to learn about the past ................................... 89%
N = 1816 S3. Out of these, which FIVE did you use the most for learning about events since January of 2019? [Asked only of those who selected more than 5 sources in S1 and S2; otherwise S3 skipped] Summary measure of sources identified as those relied upon most frequently through combination of S1 and S2.

Appendix B. Survey Instrument and Topline Results History, the Past, and Public Culture | 102
Took a college course, either in person or online ................................................................. 5% (71) Listened to a podcast or radio program about historical events .......................................... 12% (184) Watched a documentary film or video about historical events ........................................... 55% (770) Went on social media, including Twitter, Facebook, Snapchat, Instagram, and other sources to learn about historical events ............................................................................... 14% (197) Watched cable or network television news about historical events .................................... 42% (530) Read a newspaper or magazine article about historical events, either online or in print ... 33% (464) Visited a museum in person or online .................................................................................. 18% (266) Visited a historic site, such as a battlefield, monument, or building, either in person or online ................................................................................................................................ 18% (277) Read a nonfiction book about historical events ................................................................... 17% (276) Read a historical fiction book ................................................................................................ 10% (154) Talked with someone in my community about historical events ......................................... 15% (211) Read a religious document, such as the Bible or Qur’an ...................................................... 26% (298) Took a DNA test such as those offered by companies like 23anMe and AncestryDNA ....... 6% (81) Attended a lecture about history, either in person or online ............................................... 4% (59) Looked into the history of your family or worked on your family tree ................................ 18% (254) Watched a fictional film, television, or online program set in the past ............................... 37% (446) Consulted Wikipedia about historical events ....................................................................... 27% (414) Did a search on the internet (not including Wikipedia) about historical events .................. 36% (524) Played history related video games ...................................................................................... 3% (53) S4b. Please identify how much, if at all, each of these made you want to learn more about history.
A great deal Some Just a little Not at all N Took a college course, either in person or online 41% 31% 22% 6% 71 Listened to a podcast or radio program about historical events 43% 41% 11% 4% 184
Watched a documentary film or video about historical events 36% 45% 15% 4% 768
Went on social media, including Twitter, Facebook, Snapchat, Instagram, and other sources to learn about historical events
23% 48% 23% 7% 196
Watched cable or network television news about historical events 25% 50% 19% 7% 527
Read a newspaper or magazine article about historical events, either online or in print
27% 47% 19% 7% 464
Visited a museum in person or online 42% 42% 15% 1% 266 Visited a historic site, such as a battlefield, monument, or building, either in person or online
47% 34% 15% 4% 277
Read a nonfiction book about historical events 43% 40% 14% 2% 276 Read a historical fiction book 36% 42% 19% 3% 153 Talked with someone in my community about historical events 26% 49% 19% 7% 209

Appendix B. Survey Instrument and Topline Results History, the Past, and Public Culture | 103
A great deal Some Just a little Not at all N Read a religious document, such as the Bible or Qur’an 49% 36% 11% 5% 298
Took a DNA test such as those offered by companies like 23andMe and AncestryDNA 33% 40% 23% 4% 81
Attended a lecture about history, either in person or online 35% 39% 19% 7% 59
Looked into the history of your family or worked on your family tree 43% 40% 17% 1% 254
Watched a fictional film, television, or online program set in the past 19% 47% 25% 9% 444
Consulted Wikipedia about historical events 28% 46% 23% 3% 414 Did a search on the internet (not including Wikipedia) about historical events 23% 49% 23% 5% 522
Played history related video games 22% 37% 26% 16% 53 S5a. Following any of these activities, did you take any action as a result of what you learned? This can include seeking out additional information, visiting a historical site or museum (either in-person or online), contacting a public official about historical preservation, or something else. Yes. If yes, what did you do? [Verbatim responses] ............................................................. 30% (N = 541) S6. Which of the following reasons BEST describes why you want to learn about events in the past? [Programming Note: Rotate and record response order, but keep “I do not want to learn about past events” last.] I want to be more informed about past events .................................................................... 39% I find learning about past events entertaining ..................................................................... 33% The experience or knowledge gained by learning about past events is important to share with my children .................................................................................................... 19% Learning about past events is required for a class ............................................................... 2% I do not want to learn about past events ............................................................................. 8%
N = 1811 S7. How much, if at all, would you like to learn more about the following:
A great deal Some Just a little Not at all N
The histories of foreign places or people 21% 43% 24% 12% 1811 My own family’s history 45% 35% 14% 7% 1809 The history of my country 33% 44% 15% 8% 1810 The history of my ethnic group 22% 35% 25% 18% 1815 History that happened more than 500 years ago 22% 38% 26% 15% 1810
Histories of people who are different from me 21% 44% 24% 11% 1811
The history of my state or local community 18% 44% 26% 12% 1810

Appendix B. Survey Instrument and Topline Results History, the Past, and Public Culture | 104
S8. Did you have plans to visit a museum or historic site, such as a battlefield, monument, building, or neighborhood, this summer that you could not accomplish because of pandemic related closures? Yes ......................................................................................................................................... 34% No .......................................................................................................................................... 66%
N = 1815 SCH1. Thinking back on your experiences in high school history or social studies classes, what words or short phrases come to mind? [Recorded responses] ............................................................................................................ 42% Don’t know or remember ..................................................................................................... 52% I did not take any history or social studies classes in high school ........................................ 6% N = 1816 SCH2. Did you take any history courses in college? Yes ......................................................................................................................................... 52% No .......................................................................................................................................... 40% Don’t remember ................................................................................................................... 8% N = 1179 SCH3. Thinking back on your experiences in college history classes, what words or short phrases come to mind? [Recorded responses] ............................................................................................................ 88% Don’t know or remember ..................................................................................................... 12%
N = 627
T1. How much, if at all, do you trust each of the following sources to provide an accurate account of history?
A great deal Some Just a little Not at all N
High school teachers 18% 52% 21% 8% 1796 College and university professors 31% 45% 14% 10% 1793 Podcasts or radio programs 6% 45% 34% 15% 1791 Documentary films or videos 31% 53% 13% 4% 1799 Social media, including Twitter, Facebook, Snapchat, Instagram, and other sources 2% 18% 37% 43% 1800
Cable or network television news 7% 48% 32% 14% 1796 Newspapers or magazine articles, either online or in print 13% 51% 27% 10% 1794
Museums 56% 34% 6% 4% 1794 Historic sites, such as battlefields, monuments, buildings, and neighborhoods 49% 39% 8% 5% 1799
Nonfiction books 26% 47% 17% 10% 1793 Historical fiction books 9% 36% 37% 19% 1800 Conversations with people in my community 7% 48% 34% 11% 1798

Appendix B. Survey Instrument and Topline Results History, the Past, and Public Culture | 105
A great deal Some Just a little Not at all N
Religious documents, such as the Bible or Qur’an 31% 30% 21% 17% 1796
DNA tests such as those offered by companies like 23andME and AncestryDNA 18% 43% 23% 16% 1796
Public lectures about history 17% 55% 20% 8% 1787 Genealogy research about my family 24% 49% 18% 9% 1796 Fictional films, television, or online programs about the past 6% 34% 42% 19% 1795
Wikipedia 15% 43% 28% 14% 1801
Information from searches done on the Internet, not including Wikipedia 13% 57% 23% 7% 1792
History-related video games 2% 12% 32% 54% 1794 T2. Which of the following statements BEST describes you personally even if neither statement is perfect: I prefer to learn about history by reading or looking at documents and objects from the past, such as diaries, letters, maps or clothing items from the past .............................. 64% I prefer to learn about history by receiving information from an expert, such as a teacher, professor, or museum professional ........................................................................ 36%
N = 1804 HR1. In your opinion, should what we know about the history of people and events ever change? Yes ......................................................................................................................................... 62% No .......................................................................................................................................... 38%
N = 1804 HR2. Which of the following statements BEST explain why YOU think our understanding of what happened in history changes from time to time: [Asked if previous question = Yes] New information becomes available that requires people to change their understanding of history ....................................................................................................... 61% As values change, people reconsider their understanding of history .................................. 16% The political agendas of historians, museum directors, and other leaders in the field of history influence the teaching of history .................................................................. 15% As times change historians ask new questions ..................................................................... 8% N = 1140 CE1. Since January 2019, have you worked with others in your community to try to solve a community problem, either in-person or online? Yes ......................................................................................................................................... 14% No .......................................................................................................................................... 86% N = 1814

Appendix B. Survey Instrument and Topline Results History, the Past, and Public Culture | 106
CE2. How often do you vote in elections? All of the time ....................................................................................................................... 52% Most of the time ................................................................................................................... 24% Some of the time .................................................................................................................. 7% Only a little of the time ......................................................................................................... 4% None of the time ................................................................................................................... 5% Not registered to vote ........................................................................................................... 8% N = 1806 CE3. Since January 2019, have you done any volunteer activities through or for an organization, either in person or online? Yes ......................................................................................................................................... 30% No .......................................................................................................................................... 70% N = 1812 CE4. Since January 2019, did you contact an elected official to register your opinion or express a concern? Yes ......................................................................................................................................... 22% No .......................................................................................................................................... 79% N = 1811 Here are some pairs of statements that will help us understand how you feel about a number of things. Please indicate which statement comes closer to your own views, even if neither is exactly right. V1. Please indicate which statement comes closer to your own views, even if neither is exactly right. Learning about history is not very complicated because facts don’t change ....................... 38% Learning about history is complicated because our understanding of facts often changes ........................................................................................................................ 63% N = 1797 V3. Please indicate which statement comes closer to your own views, even if neither is exactly right. It is more important to know about the history of the United States than the history of other parts of the world ................................................................................................... 18% It is just as important to know about the history of other parts of the world as it is to know about the history of the United States ....................................................................... 82%
N = 1791
V4. Please indicate which statement comes closer to your own views, even if neither is exactly right. It is more important to know about the history of my racial or ethnic community than the history of others ............................................................................................................. 11% It is just as important to know about the history of others as it is to know about the history of my racial or ethnic community ............................................................................. 89%
N = 1791

Appendix B. Survey Instrument and Topline Results History, the Past, and Public Culture | 107
V5. Please indicate which statement comes closer to your own views, even if neither is exactly right. Knowing about events that happened in the past 100 years is more important than knowing about events that happened a very long time ago ................................................ 20% Knowing about events that happened a very long time ago is just as important as knowing about events that happened in the past 100 years ............................................... 81%
N= 1795 V6. Please indicate which statement comes closer to your own views, even if neither is exactly right. History is easier for me to learn about when it is presented as entertainment .................. 73% When history is presented as entertainment, I don’t learn much ....................................... 27% N = 1786 V7. Please indicate which statement comes closer to your own views, even if neither is exactly right. Teaching about the past should not make people feel uncomfortable even if that history is about harm that some groups did to others ......................................................... 23% It is acceptable to teach history about harm that some groups did to others, even if that makes people feel uncomfortable ............................................................................. 77%
N = 1795 V8. Please indicate which statement comes closer to your own views, even if neither is exactly right. History is as important to learn about in school as business or engineering ....................... 84% History is less important to learn about in school than business or engineering................. 16% N = 1798 V9. Please indicate which statement comes closer to your own views, even if neither is exactly right. I am drawn to history that challenges what I think I already know about events, people, and places in the past .............................................................................................. 73% I prefer history that reinforces what I already know about events, people, and places in the past .................................................................................................................. 27%
N = 1787 V10. Please indicate which statement comes closer to your own views, even if neither is exactly right. History is something you mainly learn about in schools ...................................................... 10% History is something you can learn about anywhere ........................................................... 90% N = 1805 V11. Please indicate which statement comes closer to your own views, even if neither is exactly right. When I encounter something in history that makes me uncomfortable, I try to learn more about that event, time, place, or person ................................................................................................ 90% I avoid learning more about something in history that makes me feel uncomfortable ....... 10% N = 1788 V12. Please indicate which statement comes closer to your own views, even if neither is exactly right. History should celebrate the nation’s past ........................................................................... 53% History should question the nation’s past ............................................................................ 47% N = 1792

Appendix B. Survey Instrument and Topline Results History, the Past, and Public Culture | 108
V13. Please indicate which statement comes closer to your own views, even if neither is exactly right. My high school history courses were about names, dates, and other facts ........................ 76% My high school history classes taught me to ask questions about history .......................... 25% N = 1794 V14. Please indicate which statement comes closer to your own views, even if neither is exactly right. My high school history courses made me want to learn more about history ...................... 68% My high school history courses discouraged me from learning more about history ........... 32% N = 1789 V15. Please indicate which statement comes closer to your own views, even if neither is exactly right. [Asked of those with college attendance history] My college history courses were about names, dates, and facts ......................................... 44% My college history classes taught me to ask questions about history ................................. 56% N = 622 V16. Please indicate which statement comes closer to your own views, even if neither is exactly right. [Asked of those with college attendance history] My college history courses made me want to learn more about history ............................. 83% My college history courses discouraged me from learning more about history .................. 17% N = 624 V18. Please indicate whether or not you believe historians and their work (including museums, textbooks, etc.) have paid too much attention, about the right amount of attention, or not enough attention to the following groups and institutions.
Too much attention
About the right amount of attention
Not enough attention Don’t know N
Women 4% 35% 52% 10% 1804 Racial and ethnic minorities 11% 28% 51% 10% 1806 Religious groups and institutions 17% 45% 25% 13% 1804 Lesbian, gay, bisexual, transgender, and queer individuals
22% 19% 40% 19% 1800
Politics and government 22% 49% 19% 10% 1800 The military 15% 50% 23% 12% 1803 Business leaders 16% 48% 19% 17% 1801 Men 27% 53% 8% 13% 1801 The Framers of the Declaration of Independence or US Constitution 10% 51% 25% 14% 1802
V19. And finally, do you live in a community where there have been or are current restrictions on where you can go and what you can do because of the coronavirus pandemic? Yes ......................................................................................................................................... 80% No .......................................................................................................................................... 20% N = 1810

Appendix B. Survey Instrument and Topline Results History, the Past, and Public Culture | 109
Just a few more questions for classification purposes. QPID100. Generally speaking, do you think of yourself as a... Republican ............................................................................................................................ 27% Democrat .............................................................................................................................. 34% Independent .......................................................................................................................... 24% Another party, please specify [Verbatim response] ............................................................. 2% No preference ....................................................................................................................... 13% N = 1804 GENDERX. Do you consider yourself… Female ................................................................................................................................... 52% Male ...................................................................................................................................... 47% Gender nonconforming......................................................................................................... 0% Prefer not to answer ............................................................................................................. 1% N = 1813

Appendix C. Project Advisers History, the Past, and Public Culture | 110
Appendix C. Project Advisers Advisory Committee Members The following advisers were consulted as part of the survey development process. Members of the advisory committee reconvened following the administration of the survey to provide input into the analysis and reporting of the data. Ted R. Bromund The Heritage Foundation John Dichtl American Association for State & Local History Kathleen Franz National Museum of American History Matthew Gibson Virginia Humanities Kimberly Gilmore HISTORY®/A+E Networks James R. Grossman American Historical Association Anthea M. Hartig National Museum of American History John Marks American Association for State & Local History
Katharina Matro Walter Johnson High School John R. McNeill Georgetown University William “Brother” Rogers Mississippi Department of Archives and History George Sanchez University of Southern California James H. Sweet University of Wisconsin, Madison David P. Thelen Indiana University Robert B. Townsend American Academy of Arts and Sciences
Focus Group Members The following advisers were consulted as part of the survey development process during focus group meetings at the August 2019 American Association for State and Local History (AASLH) conference in Philadelphia. Bill Brewster First Division Museum at Cantigny Christy Crisp Georgia Historical Society Susan Ferentinos Public History Research, Writer, and Consultant
Benjamin Filene North Carolina Museum of History John Fleming National Museum of African American Music Susan Fletcher The Navigators

Appendix C. Project Advisers History, the Past, and Public Culture | 111
Sydney Garcia San Diego Museum of Man David Glassberg University of Massachusetts Amherst Heather Huyck National Collaborative for Women’s History Sites Harry Klinkhamer Venice Museum & Archives Carlos Maldonado Delaware Public Archives Stephanie Martinez Dr Pepper Museum & Free Enterprise Institute Erin Mast President Lincoln’s Cottage George McDaniel McDaniel Consulting, LLC
Patrick McGuire Elkhart County Historical Museum Patricia Mooney-Melvin Loyola University Chicago Bill Peterson Arizona Historical Society Ann Toplovich Tennessee Historical Society Ken Turino Historic New England Jennifer Van Haaften Wisconsin Veterans Museum Scott Wands Connecticut Humanities Adrienne Whaley Museum of the American Revolution

Acknowledgments History, the Past, and Public Culture | 112
Acknowledgments This project was made possible by the generous financial support of the National Endowment for the Humanities and a seed grant provided by the Office of the Provost at Fairleigh Dickinson University. We are especially grateful to Krista Jenkins (Pew Charitable Trusts), who, in her former role as professor of political science at Fairleigh Dickinson University and director of the FDU Poll, provided leadership in developing the survey instrument and interpreting the results. Thanks are owed as well to Scott Keeter, who reviewed drafts of the survey and provided helpful feedback.