Embed Size (px)
Citation preview

title History, Landforms, and Vegetation of the Estuary’s Tidal Marshes
creator B. F. Atwater, S. G. Conard, J. N. Dowden, C. W. Hedel, R. L. MacDonald, W. Savage
Subject benthic, ecology, geology/soils, ocean waves, vegetation, plants
Description History, Events Before the California Gold Rush, Events Since the California Gold Rush, Landforms, Plains Near High-Tide Levels, Sloping Surfaces Bordering Mudflats, Waterways, Vegetation, Distribution of Species, Productivity, Acknowledgements, Literature Cited
Coverage San Francisco Bay, Sacramento-San Joaquin Estuary
Temporal 1850-1980
Source Fifty-eighth Annual Meting of the Pacific Division of the American Association for the Advancement of Science, San Francisco State University, San Francisco, California, June 12-16, 1977
Date 1977-06-12
IsPartOf SAN FRANCISCO BAY: THE URBANIZED ESTUARY Investigations into the Natural History of San Francisco Bay and Delta With Reference to the Influence of Man (347-386)
Publisher Pacific Division of the American Association for the Advancement of Science c/o California Academy of Sciences Golden Gate Park San Francisco, California 94118
Issued 1979
Type text
Format 8-1/2" x 11" bound document
Identifier ISBN 0-934394-01-6
Language English
Rghts Copyrighted, Pacific Division of the American Association for the Advancement of Science
Abstract
Around 8,000 to 10,000 years ago, sharply rising sea levels nursed a newborn San Francisco Bay estuary whose tidal marshes probably covered less area than open water. Thereafter the rate of submergence decreased about 10-fold, and by 6,000 years ago sediment began to maintain marshes that later spread across marginal parts San Francisco Bay. By thus counteracting or overtaking submergence, sedimentation created marshes that, as of 1850, covered about 2200 km2, nearly twice as much area as the bays. People have leveed or filled all but approximately 85 km2 of these marshes during the past 125 years. Concurrently, human activities have caused the delivery of enormous quantities of sediment to the bays and the slackening of tidal currents in sloughs, thereby contributing to the creation of nearly 75 km2 of marsh, about half of which remains pristine. Plains situated near high-tide levels are the most extensive landforms of both historic and modern marshes. Tides rather than upland tributaries created most sloughs around the bays, but riverine floods erected natural levees that confined tidal water in the Delta. Tidal marshes around San Francisco Bay typically contain13 or 14 species of vascular plants characteristic of salt marshes and are dominated by common pickleweed (Salicornia pacifica) and California cordgrass (Spartinafoliosa). In the Delta, tidal marshes support about 40 species characteristic of fresh-water marshes and are dominated by tules and bulrushes (Scirpus spp.), cat-tails (Typha spp.), and common reed (Phragraites communis). These contrasting communities overlap around San Pablo Bay, Carquinez Strait, and Suisun Bay. Damage to tules and bulrushes during the drought of 1976-1977 confirms that intolerance of salt causes these plants to disappear toward San Francisco Bay. The disappearance of California cordgrass and common pickleweed toward the Delta, alternatively, may result from unsuccessful competition against tules, bulrushes, and other species. If export equals one quarter of net above-ground productivity, then vascular plants of the tidal marshes collectively contribute about 10 billion grams of carbon per year to other parts of the estuary.
© 2005 Envirospectives, Inc.

HISTORY, LANDFORMS, AND VEGETATIONOF THE ESTUARY’S TIDAL MARSHES
BRIAN F. ATWATERU. S. Geological Survey, 345 Middlefield Road, Menlo Park, CA 94025
SUSAN G. CONARDBotany Department, University of California, Davis, CA 95616
JAMES N. DOWDENCalifornia State Lands Commission, 1807 13th Street, Sacramento, CA 95814*
CHARLES W. HEDELU. S. Geological Survey, 345 Middlefield Road, Menlo Park, CA 94025
RODERICK L. MACDONALDBotany Department, University of California, Davis, CA 95616
WAYNE SAVAGEBiology Department, San Jose State University, San Jose, CA 95192
Around 8,000 to 10,000 years ago, sharply rising sea levels nursed a newbornSan Francisco Bay estuary whose tidal marshes probably covered less area thanopen water. Thereafter the rate of submergence decreased about 10-fold, and by6,000 years ago sediment began to maintain marshes that later spread acrossmarginal parts of San Francisco Bay. By thus counteracting or overtaking sub-mergence, sedimentation created marshes that, as of 1850, covered about 2200km2, nearly twice as much area as the bays. People have leveed or filled all butapproximately 85 km2 of these marshes during the past 125 years. Concurrent-ly, human activities have caused the delivery of enormous quantities of sedimentto the bays and the slackening of tidal currents in sloughs, thereby contributingto the creation of nearly 75 km2 of marsh, about half of which remains pristine.Plains situated near high-tide levels are the most extensive landforms of both his-toric and modern marshes. Tides rather than upland tributaries created mostsloughs around the bays, but riverine floods erected natural levees that confinedtidal water in the Delta. Tidal marshes around San Francisco Bay typically con-tain 13 or 14 species of vascular plants characteristic of salt marshes and aredominated by common pickleweed (Salicornia pacifica) and California cordgrass(Spartinafoliosa). In the Delta, tidal marshes support about 40 species characteris-tic of fresh-water marshes and are dominated by tules and bulrushes (Scirpusspp.), cat-tails (Typha spp.), and common reed (Phragraites communis). Thesecontrasting communities overlap around San Pablo Bay, Carquinez Strait, andSuisun Bay. Damage to tules and bulrushes during the drought of 1976-1977confirms that intolerance of salt causes these plants to disappear toward SanFrancisco Bay. The disappearance of California cordgrass and common pickle-weed toward the Delta, alternatively, may result from unsuccessful competitionagainst tnles, bulrushes, and other species. If export equals one quarter of netabove-ground productivity, then vascular plants of the tidal marshes collectivelycontribute about 10 billion grams of carbon per year to other parts of the estuary.
* The views expressed herein are not necessarily those of the California State Lands Commission (CSLC) orof other bureaus of the State.
Copyright ©1979, Pacific Division, AAAS. 347

SAN FRANCISCO BAY
Though initially regarded as wastelands, tidal marshes of the San Francisco Bay estuary havegained considerable human significance during the past 125 years. The monetary value of thesemarshes derives chiefly from their historical conversion to farmlands, salt ponds, and sites for com-merce, industry, recreation, and residence. Areas of former marshland in the Sacramento-SanJoaquin Delta, for example, currently yield about $300 million in crops, including one quarter ofAmerica’s domestic asparagus (Delta Advisory Planning Commission 1976:77, 80). From im-pounded marshes around San Francisco and San Pablo bays, the Leslie Salt Company annuallyharvests approximately 400,000 metric tons of crude salt worth $7 million (M. Armstrong pers.comm.). Other leveed areas of former tidal mar.,;h attract hunters, particularly north of Suisun Bay,where the annual duck kill equals about 10% of California’s total (Jones and Stokes AssociatesInc., and EDAW, Inc. 1975:46).
Few people deliberately maintained tidal marshes in their pristine condition until the 1960’s,when concern about human encroachment on the bays led to the creation of the San FranciscoBay Conservation and Development Commission (BCDC) (Gilliam 1969). Since 1969, this regula-tory agency has mandated the preservation of most remaining tidal marshes around San Francisco,San Pablo, and Suisun bays. According to the Commission’s findings, tidal marshes warrant suchprotection because, directly or indirectly, they nourish and shelter many estuarine animals (BCDC1969:11). Some people also value pristine tidal marshes as sties for outdoor education or re-creation. In response to this interest, local governments have established parks that preserve tidalmarshes for students, bird-watchers, and strollers.
This chapter reflects the current concern for pristine tidal marshes by providing an overviewof their history, landforms, and vegetation. Drawn partly from unpublished observations by theauthors, the overview also depends on information from published sources, particularly topo-graphic surveys by the U. S. Coast and Geodetic Survey (USC&GS); geologic investigations byGilbert (1917), Pestrong (1963, 1972), and Atwater et al. (1977); and botanical studies by Cooper(1926), Marshall (1948), Hinde (1954), Mason (1957), Cameron (1972), Mahall and Park (1976a,b, c) and Conard et al. (1977). Much additional information remains to be gathered and assimi-lated, so we expect that others will improve many of the ideas put forth in this synthesis.
HISTORY
The discovery of gold at Sutter’s mill in 1848 initiated human activities that have workedvast changes in tidal marshes of the San Francisco Bay estuary. Before the Gold Rush, people in-terfered with few of the natural processes that create, maintain, or destroy tidal marshes. Since theGold Rush, however, people have leveed or filled most preexisting marshes, accidentally promotedthe erosion of others, and created some new marshes by both accident and design.
Events Before the California Gold Rush
Rates of submergence (rise in sea level relative to the land) and sedimentation largely con-trolled the areal extent of tidal marshes in the San Francisco Bay estuary between the inception ofthe estuary and the arrival of the Forty-Niner:g about 10,000 years later. Known tidal-marsh de-posits older than 8,000 years form lenses no more than a few meters thick and underlie sedimentsthat accumulated in open-water bay environments. This distribution implies that 8,000 to 10,000years ago a discontinuous fringe of tidal marsh retreated from a rising, spreading bay, presumablybecause sediments accumulated in tidal marshes less rapidly than the level of the Bay climbed.
By about 6,000 years ago, the rate of submergence had slowed by nearly lO-fold to its subse-quent average of 1-2 m per millenium (Atwater 1979, Fig. 5), thereby allowing sedimentation to
348

ATWATER ET AL: TIDAL MARSHES
counterbalance submergence in some parts of the estuary. In the western Delta, peat as thick as 20
m indicates that vertical accretion in marshes has kept pace with submergence during the past4,000-6,000 years (Weir 1950; Schlemon and Begg 1973). A balance between sedimentation andsubmergence likewise accounts for thick accumulations of tidal-marsh deposits in Massachusetts(Mudge 1858; Davis 1910; Redfield 1972).
The establishment of extensive tidal marshes around southern San Francisco Bay appears tohave occurred later than in the Delta, probably close to 4,000 years after the rate of submergencereached 1-2 m per millenium (Atwater et al. 1977). This delay is evidenced by deposits of tidal-flatmud that typically underlie peaty tidal-marsh sediments at elevations close to modern mean tidelevel (MTL) (Table 1). The boundary between tidal-fiat and tidal-marsh sediment records thecolonization of mudflats by marsh plants, so it marks the inception of a marsh (Shaler 1886:364-365). The date at which MTL equalled the elevation of this boundary approximates theminimal ages of the marsh because California cordgrass (Spartina foliosa), the pioneer vascularplant of San Francisco Bay’s mudflats, colonizes surfaces near MTL (Pestrong 1972; Hinde 1954).Approximately equating MTL with mean sea level, estimating former mean sea levels from radio-carbon-dated marsh deposits elsewhere in southern San Francisco Bay (Atwater 1979, Fig. 5), and
correcting elevations for local subsidence due to withdrawal of groundwater (Poland 1971), weinfer that marshes such as Palo Alto Baylands originated within the past 2,000 years. The 4,000-yrlag between the inception of a slow rate of submergence and the creation of such marshes prob-
ably represents the time required for sedimentation to make up for the effects of earlier, morerapid submergence.
TABLE 1. DATUMS FOR TIDE LEVELS AND HEIGHTS.a
Datum Abbreviation Definition
Mean higher high water MHHW
Mean high water MHW
Mean tide level MTL
Mean low water MLW
Mean lower low water MLLW
Mean sea level
National GeodeticVertical Datumof 1929
MSL
NGVD
Average height of the higher of the daily high tides
Average height of all high tides
Plane halfway between mean high water and meanlow water, also called half-tide level
Average height of all low tides
Average height of the lower of the daily low tides.Adopted as plane of reference for hydrographicsurveys and nautical charts of the west coast ofthe United States
Average height of the water surface for all stages ofthe tide, determined from hourly readings
The standard datum for heights across the nation.Formerly called the "U.S. Coast and GeodeticSurvey sea-level datum of 1929," and originallydetermined from mean sea levels at 26 tide sta-tions in the United States and Canada. General-ly differs from local mean sea level (Fig. 1), soit is best regarded as an arbitrary datum thathappens to be close to mean sea level.
a Tidal datums are ideally determined from 19 years of measurement, but shorter series of observations
may be compared with a long-term record to determine mean values.
349
SA
N F
RA
NC
ISC
O B
AY
35
0
AT
WA
TE
R E
T A
L: T
IDA
L M
AR
SH
ES
351

SAN FRANCISCO BAY
¯ Tidal marsh at whlchvosculor plantshave been iO~rntified
¯ Tidal marshintention(~lly created o~restored ~nC~ 197:5
ISLANDPOINTSon Peblo 8oy
CHINACAMP
8NOOGRASS SLOUGH
~¢ocromenfo-~
Son dooquin De~to ~
DUMBARTON POINT
Fig. 2. San Francisco Bay estuary and the Sacramento-San Joaquin River Delta. Locations ofnewly created marshes follow Kingsley and Boerger (1976), Knutson et al. (1976), and Harveyet al. (1977:85). Thin lines approximate shorelines or margins of tidal marsh ca. 1860 as shown oncompilations by Gilbert (1917: 76) and Nichols and Wright (1971).
Events since the California Gold Rush
Early surveys by Ringgold (1852) and the USC&GS portray the San Francisco Bay estuaryas it appeared during the California Gold Rush. Collectively, the tidal marshes and open-water bayscovered about 3400 km2, an area slightly larger than Rhode Island. The area of tidal marsh wasnearly double the area of the bays, with the Delta marshes making up about 1400 km2 and themarshes bordering San Francisco, San Pablo, and Suisun bays accounting for another 800 km~
(Gilbert 1917:78).Approximately 95% of the estuary’s tidal marshes have been leveed or ffdled since the Gold
Rush (Figs. 1, 3). The typical age of levees varies with location and appears to depend on the
352
ATWATER ET AL: TIDAL MARSHES
CONDITIONOF MARSH
M~tly p~istine sincedote of creotio~
Mostly leveed orfilled by peopleduring the indicatedperiod of time
APPROXIMATEDATE OF CREATION
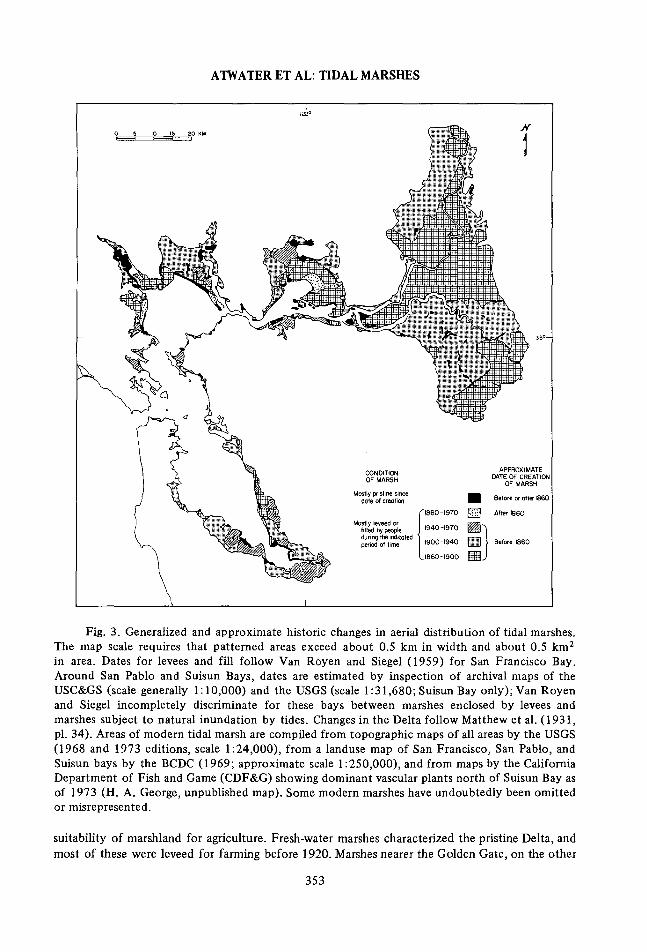
OF MARSH
Fig. 3. Generalized and approximate historic changes in aerial distribution of tidal marshes.The map scale requires that patterned areas exceed about 0.5 km in width and about 0.5 km2
in area. Dates for levees and fill follow Van Royen and Siegel (1959) for San Francisco Bay.Around San Pablo and Suisun Bays, dates are estimated by inspection of archival maps of theUSC&GS (scale generally 1:10,000) and the USGS (scale 1:31,680; Suisun Bay only); Van Royenand Siegel incompletely discriminate for these bays between marshes enclosed by levees andmarshes subject to natural inundation by tides. Changes in the Delta follow Matthew et al. (1931,pl. 34). Areas of modern tidal marsh are compiled from topographic maps of all areas by the USGS(1968 and 1973 editions, scale 1:24,000), from a landuse map of San Francisco, San Pablo, andSuisun bays by the BCDC (1969; approximate scale 1:250,000), and from maps by the CaliforniaDepartment of Fish and Game (CDF&G) showing dominant vascular plants north of Suisun Bay asof 1973 (H. A. George, unpublished map). Some modern marshes have undoubtedly been omittedor misrepresented.
suitability of marshland for agriculture. Fresh-water marshes characterized the pristine Delta, andmost of these were leveed for farming before 1920. Marshes nearer the Golden Gate, on the other
353
SAN FRANCISCO BAY
o ]
SECONDS
2
I20 METERS
LOCAL DATUM(1896-1898)
4~- LOCAL DATUM(1852-1857)
_~NORTH AMERICAN 1927 DATUM(1931-present)
~.U. S, STANDARD DATUM(1902-1930)
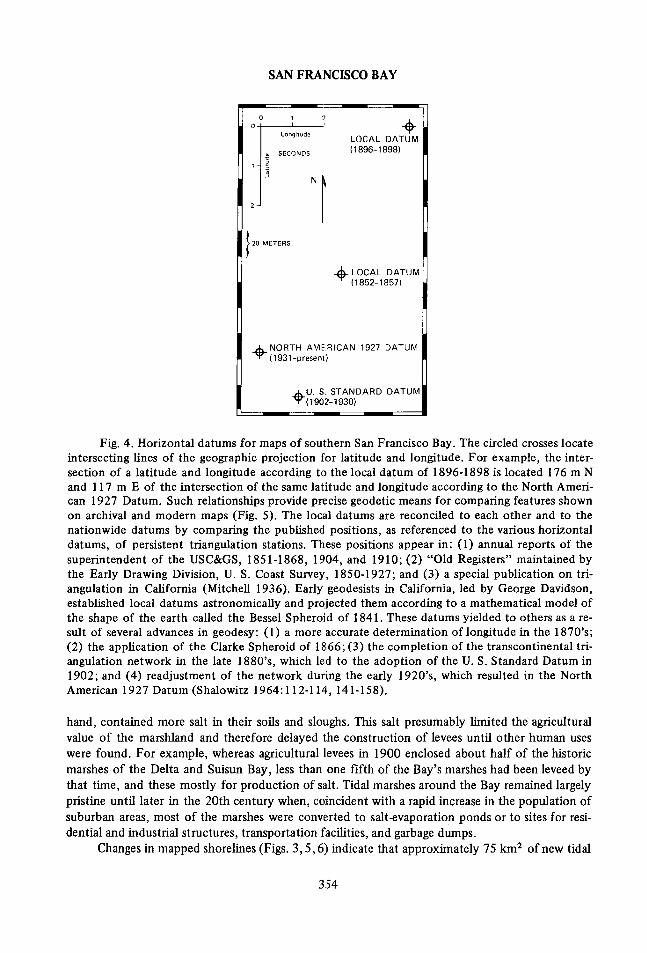
Fig. 4. Horizontal datums for maps of southern San Francisco Bay. The circled crosses locateintersecting lines of the geographic projection for latitude and longitude. For example, the inter-section of a latitude and longitude according to the local datum of 1896-1898 is located 176 m Nand 117 m E of the intersection of the same latitude and longitude according to the North Ameri-can 1927 Datum. Such relationships provide precise geodetic means for comparing features shownon archival and modern maps (Fig. 5). The local datums are reconciled to each other and to thenationwide datums by comparing the published positions, as referenced to the various horizontaldatums, of persistent triangulation stations. These positions appear in: (1) annual reports of thesuperintendent of the USC&GS, 1851-1868, 1904, and 1910; (2) "Old Registers" maintained bythe Early Drawing Division, U. S. Coast Survey, 1850-1927; and (3) a special publication on tri-angulation in California (Mitchell 1936). Early geodesists in California, led by George Davidson,established local datums astronomically and projected them according to a mathematical model ofthe shape of the earth called the Bessel Spheroid of 1841. These datums yielded to others as a re-sult of several advances in geodesy: (1) a more accurate determination of longitude in the 1870’s;(2) the application of the Clarke Spheroid of 1866; (3)the completion of the transcontinental tri-angulation network in the late 1880’s, which led to the adoption of the U. S. Standard Datum in1902; and (4) readjustment of the network during the early 1920’s, which resulted in the NorthAmerican 1927 Datum (Shalowitz 1964:112-114, 141-158).
hand, contained more salt in their soils and sloughs. This salt presumably limited the agriculturalvalue of the marshland and therefore delayed the construction of levees until other human useswere found. For example, whereas agricultural levees in 1900 enclosed about half of the historicmarshes of the Delta and Suisun Bay, less than one fifth of the Bay’s marshes had been leveed bythat time, and these mostly for production of salt. Tidal marshes around the Bay remained largelypristine until later in the 20th century when, coincident with a rapid increase in the population ofsuburban areas, most of the marshes were converted to salt-evaporation ponds or to sites for resi-dential and industrial structures, transportation facilities, and garbage dumps.
Changes in mapped shorelines (Figs. 3,5,6) indicate that approximately 75 km2 of new tidal
3:54
ATWATER ET AL: TIDAL MARSHES
marsh have appeared around San Francisco, San Pablo, and Suisun bays since the Gold Rush. Itseems likely that humans accidentally created much of this marshland by supplying sediment tothe bays and by building levees and jetties that promoted deposition.
The widespread and rapid expansion of marshland during the late 19th century (Fig. 6)probably resulted in large measure from contemporaneous hydraulic mining in the Sierra Nevada.Between 1853 and 1884, gold miners washed prodigious quantities of sediment into Sierranstreams. Further downstream, this debris caused damage to farmlands and waterways and therebyled to court injunctions that effectively halted hydraulic mining (Gilbert 1917:11; Briscoe 1979).Much debris travelled even further and entered the San Francisco Bay estuary, as evidenced by thewave of river-bottom sediment, presumably sand and gravel, that crested near the northern end ofthe Delta between 1890 and 1900 (Fig. 1, "minimum low water"). Clay and f’me silt from thehydraulic mines should have reached the estuary sooner because they move in suspension, anddeposition of this free sediment apparently caused both shoaling of subtidal areas in San Pablo andSuisun bays and rapid horizontal expansion of marshlands into mudflats of northern Suisun Bay,western San Pablo Bay, and southern San Francisco Bay during the late 19th century (Gilbert1917: 36, 86-88; Figs. 1, 6). The delivery of mining debris to the margins of southern San Francis-co Bay may be doubted because few subtidal areas of this bay shoaled greatly during the late 19thcentury (Fig. 6; Krone 1979) and because Ferdinand Westdahl, the topographer who mappedmuch of the expanded marshland, designated commercial oyster shells and Oakland’s growing portas the causes of tidal-marsh accretion (Westdahl 1897). Nevertheless, large quantities of silt- andclay-size mining debris certainly reached San Pablo Bay; some of this sediment undoubtedlyentered the layer of low-salinity water that, according to McCulloch et al. (1970) and Carlson andMcCulloch (1974), spreads across southern San Francisco Bay during periods of high dischargefrom the Sacramento River; and, once delivered to southern San Francisco Bay, mining debrismight have preferentially accumulated on marginal tidal fiats as clay and silt appear to be doingtoday (Conomos and Peterson 1977).
Tidal marshes have probably received additional sediment from farmlands (Gilbert 1917: 36),urbanized uplands (Knott 19’/3), and dredged channels and harbors. Moreover, many futuremarshes may rest entirely on dredged material if, as currently planned, public agencies mitigate thedisposal of dredged material by intentionally creating tidal marshes on spoils. Beginning with theexperiments of H. T. Harvey during the 1960’s, both independent parties and members of the U.S.Army Corps of Engineers have demonstrated that people can establish such marshes by plantingseeds, seedlings, and cuttings of Califomia cordgrass in previously barren areas (Knutson et al.1976; Kingsley and Boerger 1976; Fig. 2).
Levees and jetties have also contributed to the creation of marshiands, particularly duringthe 20th century. Construction of levees around tidal marshes almost invariably preceded and pro-bably caused the historic appearance of new marshes along the banks of sloughs that formerlyserved the marshes (K. Dedrick pers. comm.). Presumably, sediment accumulated because thelevees prevented exchange of water with the former tidal marshes and thereby slackened currentsin the sloughs (Gilbert 1917:102-103). Levees may have also promoted expansion of marshland in-to the bays by reducing the area in which sediment could accumulate. According to Robert Nadey(pers. comm.), this effect may account for part of the spectacular growth of marshes into westernSan Pablo Bay during the period of hydraulic mining. Extension of a jetty south of Mare Islandduring the 20th century coincides with shoaling of nearby tidal fiats (Smith 1965) and expansionof nearby marshland. The jetty probably caused these changes because, during the late 19th cen-tury, the marsh eroded rather than advanced, even though other parts of San Pablo Bay were trap-ping large quantities of hydraulic-mining debris (Figs. 6, 7).
Many changes in mapped shorelines indicate erosion rather than deposition at the bayward
355

SA
N F
RA
NC
ISC
O B
AY
35
6

ATWATER ET AL: TIDAL MARSHES
margins of tidal marshes (Fig. 6). As inferred by Gilbert (1917:21-22), such retreat may result inpart from a rise in sea level relative to the land. Other contributing factors include burrowing by anintroduced isopod (Carton 1979).
Available inventories of the areal size of tidal marshes ~t a given date employ different meansof distinguishing "tidal" from "leveed" and rarely discriminate between marshes formed beforeand after 1850. These problems, together with the infrequency of such inventories, currently pre-clude a detailed summary of historic changes in tidal-marsh areas. Even the generalized graphs andmaps (Figs. 1, 3) imply unwarranted precision, as the reader can determine by consulting the citedsources. Despite such deficiencies, our estimates justify several conclusions about the effects oflevees and fill on the San Francisco Bay estuary: (1) The present area of tidal marsh within theentire estuary is about 125 km~, one third of which has originated since 1850. Both Van Royenand Siegel (1959) and Nichols and Wright (1971) offer a much higher figure for the total area ofmarshland because their tallies include many non-tidal leveed marshes. (2) Even excluding the Del-ta, leveed or filled tidal marshes cover far more area than the 140 km~ of open-water baylands thathave been leveed, filled, or converted to tidal marsh since the Gold Rush (Nichols and Wright1971). Thus, tidal marshes rather than open-water bays have provided most of the leveed and filledareas of the San Francisco Bay estuary.
LANDFORMS
Natural topographic features of the tidal marshes of the San Francisco Bay estuary includebroad, nearly fiat surfaces; narrower surfaces that descend into tidal flats, some precipitously;beach ridges and related berms; tidal sloughs; riverine channels and their natural levees; shallowponds and pans; and islands of pre-existing bedrock and sand dunes. The following discussion em-phasizes the principal kinds of marshlands and waterways.
Plains near High-Tide Levels
Around the turn of the century, the "typical tidal marsh" of the San Francisco Bay estuary
Fig. 5. Historic changes in tidal marshes near Dumbarton Point, southern San Francisco Bay.The archival maps copy lines and names from l:10,000-scale plane-table sheets of the USC&GS:T-634, surveyed in 1857 by David Kerr; T-2258, surveyed in 1896 by Fremont Morse and Ferdi-nand Westdahl (low-water line from contemporary hydrographic surveys H-2304 and H-2413);and T-4626, surveyed in 1931 by H. G. Conerly (low-water line from contemporaneous hydro-graphic survey H-5135). The modern map is traced from a 1:24,000-scale photogrammetric map(Newark 7.5-min quadrangle). Additional symbols show old shorelines and inferred areas of ero-sion and deposition. Registration of archival maps to the North American 1927 Datura (Fig. 4)controls the comparisons of charted shorelines. Though subject to uncertainties related to methodand season of surveying, shorelines approximate the bayward limit of vegetation (Gilbert 1917:86;Shalowitz 1964: 177). The density and distribution of sloughs reflects methods of mapping andchanges related to human structures. Morse and Westdahl apparently traced Kerr’s lines for mostof the mid-19th century sloughs (R. Nadey pets. comm.); according to Westdahl’s (1896) descrip-tion of a nearby survey "on the salt marshes only the sloughs used for navigation, the shore-line,the area between the old and new bayshore, and improvements, such as dykes, houses, and salt-works, have been surveyed." Conerly apparently neglected all but the largest sloughs. Differencesbetween modern sloughs and those mapped by Kerr imply that the railroad and salt ponds havedisrupted the original pattern of drainage.
357

SAN FRANCISCO BAY
Approximateperiods of
A. LATE NINETEENTH CENTURY
Apperen~
qreoter than - - _i m in’rot~he:nge ~’~
+ Shallower water i~ -
[] I-minutequadrangle
marsh shorelines
~Advance > I m/yr
¯ LATEST NINETEENTH AND EARLY TWENTIETHCENTURIES
Fig. 6. Historic changes in tidal-marsh shorelines and subtidal bathymetry (A) during the late19th century and (B) during the latest 19th century and early 20th centuries.
SHORELINES. Changes in shoreline area measured by comparing archival topographic mapsthat were prepared by the USC&GS. Comparisons make use of 1:24,000-scale photographic reduc-tions of the CSLC. Most maps are registered to o:ne another by matching persistent features such ashills, rocky shorelines, intricately meandering sloughs, railroad tracks, and occasional triangulationstations. Precise geodetic registration (Figs. 4, 5) is limited to the southern and eastern shores ofSan Francisco Bay. Elsewhere the uncertainties in registration, together with errors in surveying,possible distortion of original map paper, and possible differences in notation for tidal-marshshorelines (Gilbert 1917: 86), prevent resolution of changes that average less than 1 m"yr-1 over 20-to 40-yr intervals.
BATHYMETRY. Changes in bathymetry for subtidal areas excluding sloughs are adapted fromSmith’s (1965) comparison of archival hydrographic maps. Smith compared average depths within1/8-min quadrangles and reported the sum of changes for 1-min quadrangles. The distribution ofareas showing large changes in bathymetry must: be interpreted with reference to index maps be-cause the magnitude of change depends partly on the length of the period of record. Dates on in-dex maps omit numerals for century and millennium.
resembled "a plain traversed by a branching system of sloughs" (Gilbert 1917:75). Excludingsloughs, the relief on such "plains" must have been slight because topographers such as FerdinandWestdahl (1897) used "the level of the salt-marsh in its natural state" as a datum plane for uplandelevations.
Nearly flat surfaces appear to remain the most extensive landforms of the tidal marshes of theSan Francisco Bay estuary (Fig. 7; Bodnar et ~. 1975: Figs. 32, 33; Hinde 1954). These plainscharacterize marshland formed both before and after 1850, and they cross historic shorelineswithout appreciable change in level or relief (China Camp and Mare Island marshes, Fig. 7).
358
ATWATER ET AL: ~[IDAL MARSHES
Within uncertainties of measurement1, most of the broad surfaces (Fig. 7) are probably situ-ated within a few decimeters of MHHW. This coincidence implies a widespread tendency of tidal-marsh surfaces to approach high-tide levels. Presumably, such heights equilibrate deposition, ero-sion, and subsidence (Pestrong 1972).
Differences in elevation between some tidal-marsh plains, however, exceed probable errors inmeasurement. The fiat surface of the marsh at Richardson Bay appears to be situated about 0.2 mbelow MHHW (Fig. 7), and broad parts of several tidal marshes also occupy elevations below MHHWalong the western shore of southern San Francisco Bay northwest of Palo Alto Baylands (K. De-drick, pers. comm.). Typical elevations near Point Pinole, on the other hand, approximately equalMHHW according to third-order leveling (Bodnar et al. 1975: Figs 32, 33), and less precise measure-ments at the nearby China Camp marsh (Fig. 7) suggest similar elevations. Furthermore, marshlandnear Mare Island appears to rise 0.2-0.5 m above MHHW (Fig. 7). Both here and at Palo Alto Bay-lands, however, probable but unmeasured subsidence of the bench mark at the origin of the transect(Table 2, footnotes 3, 5) may erroneously heighten the measured elevations.
These geographic variations in the elevation of marshlands with respect to tidal datums implythat local conditions influence topography. The entrapment of suspended sediment in San Pabloand Suisun bays (Conomos and Peterson 1977), for example, may partly explain why post-1850marshes at Richardson Bay have reached lower levels than contemporaneous marshes at ChinaCamp. Anomalously high elevations near Mare Island may reflect not only such entrapment but alsosoutherly high winds, which potentially pile water above normal high-tide levels, and the nearbyjetty, which has promoted intertidal deposition (see above discussion of levees and jetties). Finally,subsidence due to withdrawal of groundwater (Poland 1971) dropped the tidal marsh at Palo AltoBaylands to a lower level between 1954 and 1965, as evidenced by the spread of cordgrass into areaswhose former elevation may have excluded this plant (Harvey 1966). Most of this marsh is neverthe-less situated at or near MHHW (Fig. 7), so it seems likely that sedimentation has, on the average,largely maintained the level of the marsh against subsidence, which amounts to nearly 1 m since1931 (Table 2, footnote 3).
Uncertainties and geographic variation in the elevations of modern tidal-marsh plains com-pound the problems of defining, relative to tidal datums, the "level of salt-marsh in its natural state"as of the 19th century. One possible solution presumes similarity between the elevations of modernand historic marshes and therefore must allow for differences between localities. Additional compli-cations arise if marshlands have reached unnaturally high levels because of human activities such ashydraulic gold-mining, disposal of dredge spoils, and construction of levees and jetties. A remark byGilbert (1917:77) indirectly supports this hypothesis by equating areas vegetated by tules (Scirpusspp.) and California cordgrass with the "broader parts" of marshes. Currently, these plants mostlygrow along narrow surfaces that descend into mudflats or sloughs (Fig. 7), so it seems possible thatthe few remaining pristine marshlands have risen to extraordinary heights during this century, per-haps by trapping hydraulic-mining debris and dredge spoils. Alternatively, Gilbert erred, perhaps byattributing to all marshlands the characteristics of those that spread across mudflats during the late19th century (Figs. 5, 6) and initially supported California cordgrass and rules rather than common
1 With respect to tide levels, the elevations of modern surfaces reported in Fig. 7 may err by 0.1 m or morebecause of undetermined changes in the published elevations of bench marks and tidal datum planes (Table 2), ex-trapolation or interpolation of datums from distant tide stations, and imprecise methods of leveling. The levelinggenerally fails to meet several of the National Ocean Survey’s (NOS) standards for third-order work (NOS 1974):(1) maximum length of sights-some sights exceed the 90-m standard by 10-30 m; (2) difference in length of for-ward and backward sights-the 10-m standard is met for turning points, but most elevations along transects repre-sent unbalanced forward and backward sights between turning points; and (3) minimum error in closure-completeclosure was not attempted at marshes shown in Fig. 7, and partial closure at China Camp and Palo Alto Baylandsindicate cumulative errors of about 5 cm, roughly three times as large as the standard.
359

SA
N F
RA
NC
ISC
O B
AY
36
0

ATWATER ET AL: TIDAL MARSHES
TABLE 2. REFERENCE STATIONS FOR ELEVATIONS AND TIDAL DATUMS SHOWN IN FIG. 7
MARSH BENCH MARKa
Designation Elevation Year of(m) leveling
Palo Alto Tidal 1.09c 1965Baylands No. 1
Richardson R481 2.60d 1955Bay
China Camp D552 12.56d 1956
Mare Island N466 1.21e 1956
Southampton C467 4.94d 1951Bay
TIDAL DATUMSLocation of gauge Elevations at gauge (m)b
DistancePlace name from marshMLLW MTL MHHW
(km)
Palo Alto 1 -1.3 0.2 1.4Yacht Harbor
San Francisco 10 -0.8 0.1 0.9(Presidio)
Pinole Point 11 -0.9 0.2 1.0
11 -0.8 0.2 1.0
-0.8 0.2 1.0
Hercules
Crockett 4
a From "Vertical Control Data" compiled by the National Geodetic Survey. Datum is NGVD.
b Compiled by the National Ocean Survey (1977a, 1977b) and referenced to leveling completed in 1956 or, forPalo Alto, 1967. Datum is NGVD. See Table 1 for definition of reference planes.
c Repeated leveling by the U. S. Coast and Geodetic Survey indicates that the elevation of Tidal No. 1 de-
creased 0.76 m between 1931 and 1965, chiefly because of regional subsidence accompanying ground-water with-drawal (Poland: 1971). Hinde (1954: 217) apparently used the initial elevation of the benchmark, and his mea-sured elevations may therefore be too high by 0.5 m, the change in elevation of Tidal No. 1 between 1931 and1955. Changes in elevation since the 1965 leveling are ignored here because they are probably 0.2 m or less; arti-ficial recharge of ground water halted subsidence near Palo Alto by 1971 (Poland: 1971).
d Leveled only once by the U. S. Coast and Geodetic Survey. Changes in elevation since year of leveling pre-sumably do not exceed 0.05 m because monument rests on bedrock (D552, C467) or on a concrete pier support-ing a 10-lane bridge (R481).
e According to repeated leveling by the U. S. Coast and Geodetic Survey, bench mark N466 subsided 0.04 m
between 1951 and 1956. No correction for unmeasured, subsequent movement is attempted here, but at least 0.10additional subsidence seems likely because the road embankment beneath the monument overlies compressibleestuadne sediments and because f’fll has been added to the embankment or adjacent road since 1956.
Fig. 7. Generalized landforms, vegetation, and subsurface sediments of some salt- and brack-ish-water tidal marshes. (Vertical exaggeration 50X). Dots on profiles denote places where elevationwas surveyed in 1975 or 1976. Elevations were transferred with a rod and tripod-mounted levelfrom the nearest geodetic or tidal bench mark (Table 2). No correction is made for probable butunmeasured subsidence of bench marks near Palo Alto Baylands and Mare Island. Methods ofsurveying meet only some of the standards for third-order leveling (see footnote 1 in text). Tidaldatums are extrapolated from the nearest long-term tide gauge for which the relationship betweenMLLW and NGVD has been determined (Table 2). Collectively, these procedures may cause mea-sured elevations to err by 0.1 m or more with respect to tidal datums. Elevations away from dots areestimated by extrapolation, chiefly with reference to vegetation. Small channels are generallyomitted. The water surface is at MTL. Gray bands approximate the horizontal position of thebayward limit of vascular plants at the indicated date, as interpreted from archival maps (Figs. 5, 6).The distribution of vascular plants on the surface shows approximate conditions in 1975 (Fig. 10).Appendix A lists native species at all localities except Mare Island. Fossil rhizomes (below-groundstems) and roots are tentatively identified by macroscopic examination of core samples. Most of thetidal-flat mud lacks roots or rhizomes in growth position. The Mare Island diagrams join at center.
361

SAN FRANCISCO BAY
pickleweed (Salicornia pacifica) and salt grass (Distichlis spicata) (see description by Westdahl1896).
Sloping Surfaces Bordering Mudflats
Marshes unquestionably vary in the slope of surfaces that descend into tidal mudflats. NearChina Camp and at Southampton Bay, marshland dips gently into adjacent mudflats (Fig. 7). AtPalo Alto Baylands and Richardson Bay, on the other hand, most of the bayward edge of themarsh drops precipitously.
Gently sloping margins imply net deposition and precipitous margins imply net erosion.Several lines of evidence support these inferences: (1) gently sloping margins correspond withshorelines that typically migrated toward the Bay during the late 19th and early 20th centuries,and precipitous margins characterize shorelines that generally retreated during this period of time(Fig. 6); and (2) precipitous slopes locally correlate with ongoing erosion, as indicated aroundparts of southern San Francisco Bay by blocks of tidal-marsh mud that slump from vertical oroverhanging scarps onto the adjacent mudflat.
Low beach ridges historically bordered some tidal marshes of the San Francisco Bay estu-ary (Gilbert 1917:86), and a few ridges rernain today. Beach ridges apparently impoundedmarshlands near San Lorenzo and thereby created natural salt ponds (Fig. 8). By analogy withsandy barriers that fringe marshes of Delaware Bay (Kraft et al. 1976:98-104), these ridges mayhave contained sand that had been derived from eroding headlands, particularly the ancient dunesands near Oakland (Atwater et al. 1977). Other beach ridges of the San Francisco Bay estuaryare made of shell (Westdahl 1897). A possibly related feature of unknown origin is the broadberm of mud that currently appears to rise above MHHW at the bayward margin of a marsh nearMare Island (Fig. 7). A similar berm probably fi~rced sloughs near this locality to drain away fromSan Pablo Bay in 1856 (Fig. 8).
Waterways
Patterns of tidal-marsh drainage around San Francisco, San Pablo, and Suisun bays dependpartly on the age of surrounding marshland. Whereas prominent meanders characterize the sloughsof marshes created before 1850, the sloughs of younger marshes follow relatively straight pathsthat trend nearly perpendicular to the bayward edge of the marsh. Such direct paths cross modemmarshlands (Fig. 7, China Camp) as well as their 19th-century ancestors (Fig. 5; Westdahl 1897)and therefore appear to have gained little sinuousity since formation. The contrast betweenstraight and meandering sloughs may reflect differences in the rate of formation of marshland if, asseems likely from enormous changes in historic shorelines (Fig. 6), marshes drained by straightchannels initially spread and rose at an extraordinarily rapid pace during the late 19th century.
Tidal water rather than the discharge of upland creeks controls the dimensions of mostsloughs around the bays. Pestrong (1965:32-33) and Gilbert (1917:102-103) implicitly advocatedsuch control, Pestrong by adopting Chapman’s (1960:30) conclusion that sloughs grow because ofthe flow of tidal water to and from an upward-building marsh, and Gilbert by proposing that reduc-tion of this flow, owing to impoundment of marshland behind levees, caused shoaling of a sloughnear Mare Island. Moreover, although the widths of waterways commonly increase with discharge(Myrick and Leopold 1963), the widths of historic tidal sloughs north of San Pablo Bay greatly ta-pered toward upland creeks (Nichols and Wright 1971), so it seems likely that the widths of thesesloughs depended mainly on the areas of their tidal-marsh drainage basins. Such drainage basinsmust also account for the considerable widths of sloughs near Guadalupe Slough and Mare Island(Fig. 8) that drained no major upland creeks.
Riverine floods, on the other hand, probably restricted the reach of tides in the northern
362

ATWATER ET AL: TIDAL MARSHES
Delta by creating natural levees along the channels of rivers and distributaries. Near Babel Slough,the Sacramento River built natural levees about 1 km wide and up to 5 m high (Fig. 9). Suchlevees diminished in height toward Suisun Bay but extended as far downstream as the confluenceof the Sacramento and San Joaquin Rivers (Thompson 1958:26; Ringgold 1852). At autumnal lowstages of the rivers, high tides probably could not surmount many of the levees in the northernDelta, so perhaps only rivefine floods inundated low-lying marshes that were enclosed by naturallyleveed channels. Thus, some areas designated as historical tidal marsh in Figs. 1-3 may have actu-ally been isolated from autumnal tides.
Natural levees in the southern Delta generally reached much lower elevations, as evidencedby archival records (Thompson 1958: 37), by tidal sloughs that transect levees of the San JoaquinRiver (Fig. 9), and by peaty soils along the San Joaquin River that contrast with the bands of inor-ganic soil bordering waterways of the northern Delta (Coshy 1941). Consequently, it seems pro-bable that the southern part of the pristine Delta was flooded and drained more nearly like tidalmarshes of the bays than like the naturally leveed marshes near the Sacramento River.
VEGETATION
Vascular plants~ visually dominate the vegetation of tidal marshes and distinguish the mar-shes from mudflats. Our discussion of these plants considers their distribution with respect to geo-graphic location, elevation, and other environmental variables. In addition, we attempt to estimatethe quantity of organic material that vascular plants of tidal marshes export to the rest of theestuary.
Distribution of Species
Geographic and vertical trends. About 125 species of vascular plants have been reportedfrom tidal marshes of the San Francisco Bay estuary. Most of these species are native to California(Appendix A), but some have been introduced from other parts of the world (Table 3).
Diversity generally increases from San Francisco Bay to the Delta. Whereas individualmarshes around San Francisco Bay typically contain 13 or 14 species of native plants, specificsites in the Delta contain about 40 species. Composite regional lists imply even greater differencesin diversity: only 15 native species reportedly live in tidal marshes around San Francisco Bay,but about 30 reportedly live around San Pablo Bay and Carquinez Strait, 40 around Suisun Bay,and 80 in the Delta.
San Francisco Bay and the Delta differ in kinds as well as numbers of tidal-marsh plants.Inhabitants of San Francisco Bay’s marshes belong to the group of plants that characterizeCalifornia salt marshes (Macdonald 1977). Few species from San Francisco Bay, however, havealso been reported from tidal marshes of the Delta. Rather, the Delta’s marshes are dominated byother plants that typically inhabit low-altitude fresh-water marshes in California (Mason 1957).
Common picldeweed (Salicornia pacifica) and California cordgrass (Spartina foliosa) domi-nate the tidal-marsh vegetation around San Francisco Bay. Common pickleweed generally mono-polizes tidal-marsh plains at elevations near and above MHHW (Hinde 1954:218). Excepting salt-marsh dodder (Cuscuta salina, a parasite on common pickleweed), additional species on tidal-marsh plains typically grow in scattered patches next to sloughs, natural uplands, and man-madelevees. These plants include salt grass (Distichlis spicata), marsh Grindelia (Grindelia humilis),halberd-leaved saltbush (Atriplex patula ssp. hastata), alkali heath (Frankenia grandifolia), and
2 Vascular plants (Phylum Tracheophyta) contain veinlike channels that convey metabolic materialsbetween roots, stems, and leaves. Other kinds of tidal-marsh plants, such as diatoms, are not described in thischapter.
363

SAN FRANCISCO BAY
Fig. 8. Marshes of San Francisco and San Pablo bays as mapped before significant humandisturbance. Locations on Fig. 2.
SOURCES OF INFORMATION. Channels and ponds are traced from unpublished 1:62,500-scale compilations, by D. R. Nichols and N. A. Wright, of l:10,000-scale topographic maps pre-pared shortly after the California Gold Rush by A. F. Rodgers and David Kerr of the U. S. CoastSurvey. Topographic contours, shown near Palo Alto Baylands only, are generalized from a mo-dern 1:24,000-scale topographic map.
INTERPRETATIONS. Sloughs near Palo Alto Baylands, surveyed in 1857, show relation oftidal-marsh channels to active and abandoned mouths of an ephemeral fresh-water stream, SanFrancisquito Creek. The active mouth of this stream joins an average-size slough. The abandonedmouth lacks a comparable connection with San Francisco Bay, and a finger of marsh occupies avestige of the old stream channel. Natural levees of both the active and abandoned courses of SanFrancisquito Creek, built by the stream when it overtopped its banks (Westdahl 1897; Gerow andForce 1968:24-27), cause the topographic con.tours to point downstream, as on a ridge, ratherthan upstream, as in a valley.
Guadalupe Slough followed a shortcut to San Francisco Bay when Rodgers and Kerr surveyedits course in 1857. At some earlier time, marshland presumably intervened between the starredmeander and the bay (K. Lajoie pers. comm.). Erosion along the edge of the Bay probably re-moved this marsh. Similar erosion took place in this area during the late 19th century despite thepredominance of deposition along most other shorelines (Fig. 6).
Ridges at the bayward margins of marshland may have caused water to collect in large pondsnear San Lorenzo and to drain away from San Pablo Bay near Mare Island. Ponds near San Loren-zo appear on maps as old as F. W. Beechey’s chart of San Francisco Bay, surveyed in 1827-1828(Harlow 1850:64). When Kerr mapped them in detail 30 years later, he labelled the largest, "crys-tal salt pond." Predictably, commercial production of salt from San Francisco Bay began in thisarea (Ver Planck 1958:107). The berm along the bayward edge of a modern marsh near Mare Is-land (see Fig. 7) probably resembles the landform that caused the sloughs to drain northwardwhen A. F. Rodgers surveyed them in 1856. A possible ancestor of the discontinuous trough atthe southern edge of the modem marsh supplied Rodgers with a name, "Long Pond", for the tri-angulation station at left.
364

ATWATER ET AL" TIDAL MARSHES
SAN
FRANCISCO
PALO ALTO BAYLANDS GUADALUPE SLOUGH
MARE ISLAND
Tidal channels
Pond
Ephemeral streamTopographic contour
Elevations in meters above NGVD
Land above reach of autumnal high tides
SAN LORENZO
0 I 2 3 Km
365

SAN FRANCISCO BAY
Fig. 9. Marshes of the Sacramento-San Joaquin Delta as mapped before significant humandisturbance. Locations on Fig. 2.
SOURCES OF INFORMATION. The USC&GS prepared no detailed maps of pristine marshesin the Delta until 1930-1940. Most channels and topographic contours on these diagrams are basedon 1:31,680-scale plane-table sheets surveyed in 1906-1908 by the USGS. Some marshes had beenleveed (Fig. 3) and some channels modified before these maps were made. Allowing for errors inmap-making, the courses of river channels match the meanders shown on a 1:250,000-scale mapby Ringgold (1852). The approximate courses of tributaries to Disappointment Slough are sketch-ed from Cosby’s (1941) l:63,360-scale base map and, where highlighted by tonal differences be-tween soils, from modern aerial photographs. Additional waterways probably existed before con-struction of dikes, but tall, dense stands of tules (Scirpus spp.) and other plants undoubtedlyprohibited detailed mapping by plane-table methods. Elevations of natural levees along the Sacra-mento and San Joaquin rivers are consistent with verbal descriptions assembled by Thompson(1958: 36-37).
INTERPRETATIONS. The Sacramento River created most of the landforms near Babel Slough.The complex lobes of high ground, the largest of which enclosed Babel Slough, were built by sedi-ment-laden flood waters that surged over or through the broad natural levees that flank the Sacra-mento River. In the bird-foot delta of the Mis.,dssippi River, such lobes are called crevasse or over-bank splays (Coleman and Gagliano 1964). Paired fingers at the distal ends of the lobes representthe narrow levees of distributaries. Floods converted the Yolo Basin into a lake or river (Gilbert1917:14-15) that accommodated so much more water than its parent that, on occasion, the dis-charge from the Yolo Basin transected and hydraulically dammed the Sacramento River near RioVista (Thompson 1958:448,453). The 1.5-m contour locates the approximate northern limit oftidal water in the historic Yolo Basin during times of low Sacramento River discharge. During suchlow river stages, tides in Yolo Basin probably communicated with the rest of the estuary via thebasin’s outlet near Rio Vista. The top edge of the map approximates the northern boundary oftidal marsh as mapped in 1906-1908 and as generalized in Figs. 2, 3. Additional marshes coveredhigher parts of the Yolo Basin according to the USGS plane-table sheets.
Disappointment Slough and its tributaries more nearly resemble the typical drainages of tidalmarshes bordering the bays. Lacking a river at its head, Disappointment Slough was probably cre-ated and maintained by tidal water that flowed in and out of nearby marshes. Low levees appar-ently forced some adjoining marshes to drain away from the San Joaquin River but, unlike thehigh borders of the Sacramento River near Babel Slough, these levees allowed tidal water to tra-verse the banks of the river in such channels as Disappointment Slough and Twenty-one-mileSlough.
366

ATWATER ET AL: TIDAL MARSHES
BABEL SLOUGH
:,
DISAPPOINTMENT SLOUGH o ~ 2 3 Km
38002’ 30"-
Topographic contour. ~ Channels, chiefly tidal during late.... :~.0 .... Elevolions in meters
...~////-"~-.~
summer and autumn. Arrowabove NGVD. gives direction of flow toward
Suisun Bay.~ Land above reach of most
autumnal high tides Ephemeral distributary
367

SAN FRANCISCO BAY
TABLE 3. COMMON INTRODUCTIONS IN TIDAL MARSHESOF THE SAN FRANCISCO BAY ESTUARY.a
FAMILY
(Monocotyledons)GRAMINEAE
Grass family
(Dicotyledons)CAROPHYLLACEAE
Chickweed familyCHENOPODIACEAE
Goosefoot familyCOMPOSITAE
Sunflower family
CRUCIFERAEMustard family
DIPSACACEAETeasel family
LABIATAEMint family
LEGUMINOSEAPea family
PLANTAGINACEAEPlantain family
POLYGONACEAEBuckwheat family
PONTEDERIACEAEPickerel-weed family
SOLANACEAENightshade family
UMBELLIFERAECarrot family
VERBENACEAEVervain family
Linnean nameSPECIES
Common name
Bromus diandrus Roth var. gussonei (Pad.)Coss & Durieu
B. mollis L.Cortaderia selloana (Schult.) Asch. & Graebn.Festuca elatior L.Hordeum leporinum Link.Polypogon monspeliensis Buckl.Spartina patens (L.) Greene
Spergularia media (L.) Presl.
Atriplex semibaccata R. Br.Chenopodium album L.Cirsium vulgare (Savi) Ten.Cotula australis (Sieber) Hook.C. coronopifolia L.Lepidium lat~folium L.
Dipsacus fullonum L.
Mentha piperita L.
Melilotus albus Desr.
Plantago major L.
Rumex crispus L.
Eichhornia crassipes (Mart.) Solms.
Solanum dulcamara L.S. nodifolium Jacq.Apium graveolens L.Conium maculatum L.Foeniculum vulgare Mill.Lippia nodillora Michx. var. rosea
(D. Don) Munz
Gussone’s dpgut grass
Soft chessPampas grassMeadow fescueHare barleyRabbit’s-foot grassSalt hay
Sand-spurrey
Australian saltbushLamb’s quartersCommon thistleAustralian CotulaBrass buttonsBroad-leaved pepper-grass
Fuiler’s teasel
Peppermint
White sweet clover
Common plantain
Cudy dock
Water hyacinth
Climbing nightshadeSmall-flowered nightshadeCeleryPoison-hemlockSweet fennelGarden Lippia
a The list draws from the same sources as Appendix A. In addition, it includes R. E. Mall’s report of salt hayat Southampton Bay (Munz 1968:195), a find which we have not duplicated either at Southampton Bay oranywhere else in the estuary. Among grasses other than salt hay, all commonly inhabit the landward fringes oftidal marshes around San Pablo and Suisun Bays except for pampas grass, which grows mainly in the Delta. Theprincipal species among dicotyledons include Australian saltbush (all bays), curly dock (San Pablo and Suisunbays in 1975 but not, with a few exceptions, in 1977), brass buttons (wet places near high-tide levels aroundSuisun Bay), and garden Lippia (the Delta).
fleshy Jaumea (Jaumea carnosa). California cordgrass fringes tidal-marsh plains where they descendinto mudflats. Near MTL it forms pure stands, but midway between MTL and MHHW it interming-
les with red pickleweed (Salicornia rubra), and at higher elevations it yields to common pickle-weed. Subsidence due to ground-water withdrawal probably accounts for the anomalous presence
of Califomia cordgrass on the tidal-marsh plain at Palo Alto Baytands (Fig. 7; Harvey 1966).
Common tule (Scirpus acutus), Olney’s bulrush (Scirpus olneyi), cat-tails (Typha spp.), com-
mon reed (Phragmites communis) and arroyo willow (Salix lasiolepis) dominate islands of pristine
368

ATWATER ET AL: TIDAL MARSHES
marsh in the Delta. Typical associates of these plants include swamp knotweed (Polygonumcoccineum), broadfruited bur-reed (Sparganium eurycarpum) and Pacific silverweed (Potentillaegedei) (Scirpus-Phragrnites-Typha association, Table 4). Another associated species is marshbindweed (Calystegia sepium), a morning glory that twines around tules and reeds. Below MTLthese plants yield to monotonous stands of tules (Scirpus acutus and Scirpus californicus) and, inareas of quiet water, to floating aquatic species (Ludwigia association, Table 4).
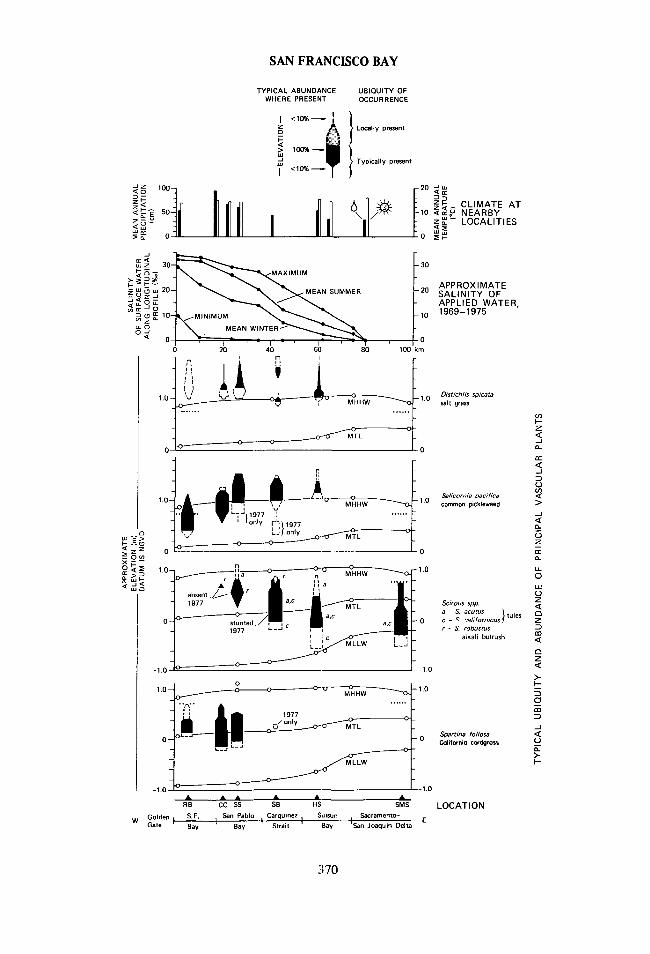
Tidal-marsh plants of San Pablo Bay, Carquinez Strait, and Suisun Bay provide an intricate,mutable transition between salt marshes of San Francisco Bay and freshwater marshes of the Delta(Table 4, Appendix A; Figs. 7, 10). Details of this transition include: (1) Species from oppositeends of the spectrum overlap to varying degrees in the middle. Most salt-marsh plants of San Fran-cisco Bay live around San Pablo Bay and Carquinez Strait (Spartina and Salicornia pacifica associa-tions, Table 4) and also around Suisun Bay (Appendix A). Salt grass and marsh Grindelia evengrow in the western Delta. Neither California cordgrass nor red pickleweed, however, appear togrow east of Carquinez Strait. Cosmopolitan species of the Delta include rules and bulrushes(Scirpus acutus, S. californicus, S. olneyi), cat-tails, and common reed. All of these plants range asfar west as the large sloughs north of San Pablo Bay. East of San Pablo Bay they generally supplantCalifornia cordgrass (Fig. 10; Scirpus californicus association, Table 4). (2) Some common plantsof San Pablo and Suisun bays are scarce or absent in tidal marshes of the Bay and Delta. These spe-cies include alkali bulrush (Scirpus robustus), sea milkwort (Glaux marit#na),.and soft bird’s beak(Cordylanthus mollis). (3) The vertical range and relative abundance of many species vary withgeographic location. Common pickleweed, for instance, shortens its vertical range and reduces itsubiquity and abundance from west to east (Fig. 10). (4) Plant communities change not only fromthe Pacific Ocean to the Sacramento and San Joaquin rivers but also from mouths to heads ofsloughs that drain major upland creeks north of San Pablo and Suisun bays. (5) The vertical andgeographic ranges of some species, most conspicuously the tules and bulrushes, can change signi-ficantly within one or two years (Figs. 10, 11).
Reasons for trends. Environmental variables that may influence the distribution of vascularplants in tidal marshes include the reproductive methods of the plants, the frequency and durationof tidal flooding, and characteristics of the soil such as particle size, salinity, aeration, moisture,and nutrients (Chapman 1960). Competition between species may also restrict the ranges of someplants. Available evidence from the San Francisco Bay estuary used to test several of these possi-bilities implies that soil salinity, tidal inundation, and interspeciflc competition largely control thedistribution of local species.
High soil salinity related to saline tidal water causes many plants to disappear toward SanFrancisco Bay. Too much salt inhibits growth, as evidenced in the case of bulrushes and tules westof the Delta by the decrease in their size and abundance during the drought of 1976-1977 (Figs.10, 11). The damage or demise of these plants mostly reflects the increased salinity of tidal waterrather than the decreased local rainfall because daily high tides inundate the softs of most bulrush-es and tules. Excessive salt likewise appears to discourage the growth of bulrushes, cattails, andrushes (Juncus spp.) in leveed marshes north of Suisun Bay (Mall 1969:36). Consistent with itsreduced seed production in tidal marshes during 1976 and 1977, alkali bulrush produces few seedsin these leveed marshes if vemal soils contain more than 24 % o salt (Mall 1969:38).
The salinity of soils may also contribute to the vertical zonation of vascular plants if, asreported from north of San Pablo Bay, salinity during the growing season increases with elevation(Fig. 12)o According to field and greenhouse studies by Mahall and Park (1976b), salt rather thanaeration or nutrients probably favors pickleweed over cordgrass at high elevations near Black JohnSlough and Mare Island. Similar considerations may account for the scarcity of tules and bulrushesabove high-tide levels around San Pablo Bay, Carquinez Strait, and Suisun Bay.
369
SAN FRANCISCO BAY
50:
e
TYPICAL ABUNDANCE UBIQUITY OFWHERE PRESENT OCCURRENCE
o Locally present
~
~i~iiiiiiii
u~~ Typically present
20 -Ju~
(~ Z<CA\ 1o
0
0 20 40 60 80 100 km
1.0- ’ ’ ;’ 1.0
0rv I0
0
-1.0
0 - i~L,T~ ~-~
-1.0
~ "" ~ :s "CC SS SMSSan Pablo Carquinez Suisun
ISacramento-Golden S,F.
I ~ I EW Gate IBay Bay Strait Bay San Joaquin Delta
- 1.0
-0
-1.0
CLIMATE ATNEARBYLOCALITIES
APPROXIMATESALINITY OFAPPLIED WATER,1969-1975
Distich/is spicatasalt grass
Salicornia pacificacommon pickleweed
Sci~pus Spp,a - S. } rulesacutusc - c ~alifornicusr - S. robustus
alkali bulrush
S~artina foliosaCalifornia co~dgross
LOCATION
370

ATWATER ET AL: TIDAL MARSHES
The frequency and duration of tidal flooding commonly correlate with vertical ranges ofvascular plants in tidal marshes (Johnson and York 1915; Purer 1942; Hinde 1954). For the SanFrancisco Bay estuary, this correlation implies causation according to two lines of evidence: (1)the scarcity of cordgrass, tules, and bulrushes above MHHW (Fig. 10) may indirectly result fromtidal inundation, if, as seems likely, the vertical increase in salinity reflects more prolonged desic-cation at higher elevations; and (2) tidal water may prevent pickleweed from growing at lowelevations by dislocating, suffocating, or leaching seeds and seedlings (Chapman 1960:45-49;
Mahall and Park 1976c).Though the disappearance of species toward the Golden Gate reflects the physiological
hardships of saline water, the disappearance of species toward the Delta may represent a socio-logical consequence of fresh water. According to greenhouse experiments, the principal vascularplants of San Francisco Bay’s tidal marshes grow better in fresh water than in saline water (Bar-
bour and Davis 1970; Barbour 1970; Phleger 1971). The paradoxical disappearance of thesespecies toward the Delta therefore implies either that saline soils uniquely contain vital nutrientsor that other species competitively exclude salt-marsh plants from brackish- and fresh-water areas.The vertical ranges of coexisting, potential competitors (Fig. 10) suggest a role for competition.California cordgrass, for instance, seems to yield to alkali bulrush at elevations greater than 0.5 mat Schultz Slough, but below 0.5 m the abundance of California cordgrass remains the same as atmore saline marshes such as China Camp. Similarly, bulrushes and rules appear to eliminate
Fig. 10. Regional and vertical distribution of the principal vascular plants in six tidal marshesof the northern San Francisco Bay estuary. SYMBOLS FOR UBIQUITY AND ABUNDANCE OFPLANTS (top). Solid lines and black shading indicate widespread occurrence at or near a givenelevation; dashed lines and stippled shading show relatively sparse occurrence. The width of eachfigure represents abundance and ranges from 1-10% (one line-width) to 100% (broadest part offigure). Abundance approximates the area, relative to other vascular plants, covered by the pro-jected canopy of the live individuals of a given species within a 3-m2 circle centered at a point ofmeasured elevation. Symbols depict conditions as of autumn 1975, and principal changes observedin autumn 1977. DISTRIBUTION OF PLANTS ’WITH RESPECT TO APPROXIMATE TIDELEVELS, BAY-WATER SALINITY, AND CLIMATE (main figure). All localities are projected tothe nearest point along a longitudinal profile of the estuary. This procedure generalizes the com-parison of vegetation with longitudinal trends in environmental variables; for example, the waterserving the marsh near Schultz Slough can contain less salt (Matthew et al. 1931:340-364) and riseto slightly higher levels (see MHHW for Lakeville, identified elsewhere in this caption) than waterat the nearest point along the longitudinal profile in southeastern San Pablo Bay. Vertical ranges ofplants were measured along or near leveled transects (Fig. 7; Atwater and Hedel 1976). Withrespect to tidal datums these ranges may err by 0.1 m or more (see text). Horizontal rows of dotsshow the highest elevation of pristine tidal marsh near transects at Richardson Bay and SandMound Slough; plants above this level are rooted in artificial levees. Marshes are abbreviated asfollows: RB, Richardson Bay; CC, China Camp; SS, Scliultz Slough; SB, Southampton Bay; HS,Hill Slough, SMS, Sand Mound Slough (see Fig. 2 for locations). Open circles along lines for tidaldatums represent gauges for which differences between various planes of reference have beendetermined by the NOS (1977a, 1977b; Table 1). Locations of tide gauges are, from west toeast: Presidio (San Francisco); Pinole Point and, for the higher MHHW, on the bottom graph,Lakeville (3 km SE of SS); Crockett (4 km W of SB); entrance of Suisun Slough (about 13 km SWof HS); Port Chicago (between Martinez and Shore Acres), Pittsburg (3 km W of SMS); and OldRiver at Orwood (10 km SE of SMS). Surface-water salinities follow Conomos and Peterson(1977). Climatic data (U. S. Department of Commerce 1964) refer to the following localities, list-ed from west to east: downtown San Francisco; San Rafael (between RB and CC); Hamilton AirForce Base (2 km N of CC); Petaluma (3 km NW of SS); Crockett; Port Chicago; Fairfield (3 km Wof HS); and Antioch (15 km W of SMS).
371

SA
N F
RA
NC
ISC
O B
AY
37
2

ATWATER ET AL: TIDAL MARSHES
CALENDAR YEAR1974 1975 1976 1977
Og 10’>’E
0 Ja A JI O Ja A JI O Ja A JI 0
~m 20
<
]kS. olneyi/~S, robustus~ S. cafifornicus
- 20
-10
,4O
’2O
0 I
1975 1976 1977
GROWING SEASON
Fig. 11. Decrease in size and abundance of Scirpus spp. (bulrushes and tules) bordering Car-quinez Strait during the drought of 1976-1977. The plots are located near the leveled transect atSouthampton Bay (Fig. 7) at approximate elevations of 0.9 m, 0.4 m, and -0.5 m. Conditions in1975 are estimated by comparing (qualitatively) living culms (above-ground stems) in plots alongthe transect in October 1975, with dead culms in September 1976. Measurements and counts ofdead culms attempt to exclude those that grew before 1975, but similarities among dead culms ofdiffering vintage result in large uncertainties, particularly for S. californicus. Conditions in 1976and 1977 were determined from measurements and counts of living plants within the plots, ex-cepting heights for 1977, which had to be scaled elsewhere because of the scarcity and absence ofScirpus within the plots. Vertical bars approximate the range of observed or estimated values. Thetop graph shows monthly averages of salinity of near-surface water at the eastern end of CarquinezStrait (USBR station D-6). The shaded area spans 1 SD (approximately 70%) of the monthly ave-rages from October 1974 to September 1977. Data show that Carquinez Strait contained unusual-ly saline water during the winter and spring of 1976 and 1977.
common pickleweed from the lower part of its salt-water range, as confirmed by the reciprocalspread of common pickleweed into low-lying areas denuded of tall tules and bulrushes during thedrought of 1976-1977 (Fig. 10).
Productivity
According to classic investigations in the southeastern United States, the vascular plants ofextensive tidal marshes supply most of the organic material on which local estuarine animalsdepend (Teal 1962; Day et al. 1973). Recent studies in Georgia and Holland, however, point to
373

SAN FRANCISCO BAY
estuarine algae and riverine or marine debris as principal sources of estuarine food (Haines 1976,
1977; Wolff 1976). Given current controversy about these studies and shortcomings of relatedinformation about the San Francisco Bay estuary, we can hardly guess what percentage of food inthis estuary originates in the vascular plants of its tidal marshes. In the following discussion wemerely assemble information about the production of food in tidal marshes, estimate how much ofthis food enters other parts of the estuary, and offer a tentative comparison with the productionof food by floating algae.
Conventional methods equate export by tidal-marsh plants with a calculated or arbitrarypercentage of their net productivity. Net productivity refers to the quantity of organic matter thatliving plants store in excess of what they respire (Odum 1971:43). Bacteria, insects, and other or-ganisms may consume some of this organic matter in the marsh, and high tides may move anotherfraction toward upland areas; hence, only a fraction of net productivity in a marsh can reach otherparts of the estuary. The simplest measure of net productivity is the seasonal peak in the weight oflive, above-ground, annual tissues (peak standing crop). Peak standing crop underestimates net pro-ductivity, however, because living tissue disappears during the growing season (Hardisky and Rei-mold 1977; Reimold and Linthurst 1977:87; Kirby and Gosselink 1976).
Local measurements of standing crop (reported herein as grams of dry plant material per
SW
PP-CC
8OO
600
400
200
0
20
191o
AUTUMNALWEIGHT OFLIVE, ABOVE-GROUND TISSUES, 1972
Salicornia .....Spartina -- --
AERATION OF SOILAT END OF GROWINGSEASON, 1973(rate of diffusion,ng 02 cm-2,min-1)
0.4
0.2
0
P4 P3 P2 P1
SALINITY OF WATERIN SOIL DURINGGROWING SEASON,1972 (%*)
DOMINANT VASCULAR PLANT0 Salicornia pacificay Spartina foliosa
RELATIVE HEIGHTOF GROUND (rn)
DISTANCE (m)
STATION
Fig. 12. Autumnal weight (dry) of above-ground tissues of Spartina foliosa and Salicorniapacifica and environmental variables of a profile near Black John Slough. Aeration of soil (upper30 cm) at end of 1973 growing season and salinity of water in soil (upper 35 cm) in 1972 are dataof Mahall 1974 and Mahall and Park 1976a, c. These data are compared with normal ocean salini-ties (SW) and the range of salinity of Bay water between Pinole Point (PP) and China Camp (CC)during 1969-75 (station 14 of Conomos and Peterson 1977). Topographic profile is referenced toestimated MHW datum. Vertical bars represent I SD of the measurements at each station; thediameter of dots on lower two graphs exceeds the length of bars.
374

ATWATER ET AL: TIDAL MARSHES
square meter, g’m"2) suggest that vascular plants of the San Francisco Bay estuary produce at leastas much organic material as their counterparts in the eastern United States (Fig. 13). Peak standingcrops of California cordgrass (Spartinafoliosa) range from 300 to 1700 g-m"2, comparable with itseastern relative, smooth cordgrass (Spartina alterniflora). Common pickleweed (Salicornia pacifica)creates standing crops of 500-1200 g-m"x, likewise similar to the salt hay (Spartina patens), saltgrass (Distichlis spicata), and short variety of smooth cordgrass which commonly inhabit high partsof Atlantic-coast marshes. The largest reported above-ground standing crop in North American ti-dal marshes may belong to rules in the Sacramento-San Joaquin Delta which, at low elevationsalong sloughs, grow 3-4 m tall and weigh about 2500 g-m"z.
Adjusted for slight loss during the growing season and extrapolated to other species andlocalities, the standing crops of plants from a variety of marshes (Fig. 13) imply that net above-
SPECIES
alterniflora
Spart,’nafoliosa .....
Salicomiapacifica ......
Distichlisspicata .......
Typha spp ........
Phragmitescommunis ......
Mixed Phragmites, __Tyl~ha, Scirpus spp.
Scirpus sp. cf.S. californicus .....
Scirpus lacustris(cultivated) .....
SEASONAL PEAK IN WEIGHT OFLIVE ABOVE-GROUND TISSUES
(g,m-2)
1000 2000.J. j
~ } tall variety
~ ~, mixed short and~ ~" tall varieties
, ~" N= 15~ N= 16~ N=8
N=15~ N = 24~ ’N=8
"N=5
1000 2000,
300OLOCATION & REFERENCE
Louisiana K&GDelaware DLouisiana K&G
Delaware D
Tota¥ Ck. CBlack John SI. M (P1,P2)Mare Is. M (MI)
Tola¥ Ck. CMare Is. M (M4-M6)
Black John SI. M (P4)
Delaware DVirginia K
New Jersey K
Delaware D
tSandMound A
t Slough
Germany K
3000
Fig. 13. Comparison of peak above-ground standing crops (dry weight) for some tidal-marshplants. Weights refer to annual tissues that were harvested from multiple plots near the end of thegrowing season. Error bar shows 1 SD and N denotes the number of plots. Abbreviations forreferences: A-Brian Atwater unpublished data. Harvests were made in October 1977. Plots, 0.50m: for mixed vegetation and 0.12 m= for Scirpus, are located on a remnant of pristine marsh nearthe transect of Atwater and Hedel (1976, pl. 8). Elevations relative to NGVD are 0.6+0.2 m formixed plots and -0.4+0.2 m for Scirpus. Brown leaves attached to green Phragmites are includedwith live standing crop. Samples were oven-dried to constant weight at 100° C. Infertile flowersprevented definite identification of Scirpus sp. C-Cameron (1972:61, 64, 66; pers. comm.). Graphshows harvests of July 1969. Peak standing crops at Tolay Creek in autumn 1968 were 1400g’m-~ (dry weight) for Spartina and 1050 g’m-2 for Salicornia. D-Compilation by Daiber etal. (1976:76, 78, 82). K-Compilation by Keefe (1972). K & G-Kirby and Gosse[ink (197.6).M-Mahall and Park (1976a): Harvests made in 1972. Weights for Salicornia exclude living stemsfrom previous years. Symbols in parentheses denote stations. Mahall’s Mare Island marsh is locateda few kilometers west of the locality plotted on Fig. 2.
375

SAN FRANCISCO BAY
ground productivity by the vascular plants of our estuary’s tidal marshes averages between 500and 1500 g-m"2-yr"1. Selecting 800 g’m"2"yr"I as a typical value and multiplying by the presentarea of tidal marsh yields an estimated net above-ground productivity of 10x l g.yr"1. Tides andrain flush approximately half of such organic: material from cordgrass marshes (Teal 1962; Dayet al. 1973; Cameron 1972:60), but the average fraction that enters the waterways and bays ofthe San Francisco Bay estuary is probably smaller because of the proximity of most tidal-marshsurfaces to high-tide levels (Fig. 7), which reduces the frequency of tidal flushing relative to thelower areas dominated by California cordgrass. If one fourth of net above-ground productivity
enters other parts of the estuary, then annual export equals 2.5 x 101 o g (dry weight), which inturn equals 101° gC because carbon constitutes about 40% of the dry organic matter (Keefe1972). We therefore estimate that the vascular plants of tidal marshes annually contribute 10 bil-lion grams of carbon to the rest of the San Francisco Bay estuary.
Several perspectives aid in conceptualizing l 0 billion grams of carbon. (1) Net productivityof floating algae in the bays, chiefly diatoms and flagellates, averaged about 200 gC’m"2-yr"1 in1976-77 (Peterson 1979), all of which is available to other aquatic organisms. The bays currentlycover approximately 100 km~ (Conomos and Peterson 1977), so these algae produced 2 x 10¹¹g of carbon, roughly 20 times our estimate of export by vascular plants of tidal marshes. (2)Historic destruction of tidal marshes (Figs. 1, 3) has probably caused a 10- to 20-fold reductionin their export of organic material. (3) At 101 o gC, export from vascular plants of tidal marshestranslates into roughly 5 lbs. of carbon per year for each of the 5 million human inhabitants whosurround the San Francisco Bay estuary.
ACKNOWLEDGMENTS
Persons who contributed opinions, information, or logistical assistance not otherwise ac-knowledged include Joel Bergquist, Frances DeMarco, Harry George, H. T. Harvey, E. J. Helley,R. F. Holland, Zondra Kilpatrick, H. L. Mason, F. H. Nichols, David Plummer, and G. J. West. Ourprincipal illustrators are Yosh Inouye (Fig. 10-13), Barbara Lee (Fig. 5), Hylton Mayne (Fig. 6),and Steven Talco (Figs. 1, 2, 3, 7). The text incorporates suggestions from reviews by John Bris-coe, K. G. Dedrick, R. T. Huffman, J. C. Kraft, Robert Nadey, and G. F. Somers. Authors divideand share responsibilities as follows: Atwater--text, tables, and Figs. 1, 2, 3, 6-13; Conard-Ap-pendix A, Tables 4-5 and related text; Dowden-Figs. 4, 5; Hedel-Figs. 2, 3, 7, 10; Macdonald-Appendix A, Tables 4-5; and Savage-Append:~x A, Table 4. John Coburn (USBR) supplied thesalinity data shown in Fig. 13.
LITERATURE CITED
Abrams, L. 1923-1960. Illustrated flora of the Pacific states. 4 volumes. Stanford UniversityPress, Stanford, Calif.
Atwater, B.F. 1979. Ancient processes at the site of southern San Francisco Bay: movement ofthe crust and changes in sea level. Pages 31-45 in T. J. Conomos, ed. San Francisco Bay: TheUrbanized Estuary. Pacific Division, Amer. Assoc. Advance. Sci., San Francisco, Calif.
Atwater, B. F., and C. W. Hedel. 1976. Distribution of seed plants with respect to tide levels andwater salinity in the natural tidal marshes of the northern San Francisco Bay estuary, Califor-nia. U. S. Geol. Surv. Open-File Rep. 76-389. 41 pp.
Atwater, B. F., C. W. Hedel, and E. J. Helley. 1977. Late Quaternary depositional history, Holo-cene sea-level changes, and vertical crustal movement, southern San Francisco Bay, California.U. S. Geol. Surv. Prof. Paper 1014. 15 pp.
376

ATWATER ET AL: TIDAL MARSHES
Barbour, M.G. 1970. Is any angiosperm an obligate halophyte? Amer. Midl. Nat. 8:105-120.Barbour, M. G., and C. B. Davis. 1970. Salt tolerance of five California salt marsh plants. Amer.
Midl. Nat. 84:262-265.Bodnar, N., Jr. et al. 1975. The relationship between the upper limit of coastal marshes and tidal
datums. National Ocean Survey, preliminary report prepared for the Environmental ProtectionAgency. 84 pp.
Briscoe, J. 1979. Legal problems of tidal marshes. Pages 387-400 in T. J. Conomos, ed. San Fran-cisco Bay: The Urbanized Estuary. Pacific Division, Amer. Assoc. Advance. Sci., San FranciscoCalif.
Cameron, G.N. 1972. Analysis of insect trophic diversity in two salt marsh communities. Ecol-ogy 53:58-73.
Carlson, P. R., and D. S. McCulloch. 1974. Aerial observations of suspended sediment plumes inSan Francisco Bay and the adjacent Pacific Ocean. J. Res. U. S. Geol. Surv. 2(5):519-526.
Carlton, J.T. 1979. Introduced invertebrates of San Francisco Bay. Pages 427-444 in T. J.Conomos, ed. San Francisco Bay: The Urbanized Estuary. Pacific Division, Amer. Assoc. Ad-vance. Sci., San Francisco, Calif.
Ceska, A. and H. Roemer. 1971. A computer program for identifying species-releve groups invegetation studies. Vegetation 23 : 255-276.
Chapman, V. J. 1960. Salt marshes and salt deserts of the world. Interscience. 392 pp.Coleman, J. M. and S. M. Gagliano. 1964. Cyclic sedimentation in the Mississippi River deltaic
plain. Gulf Coast Assoc. Geol. Soc. Trans. 14:67-80.Conard, S. G., R. L. Macdonald, and R. F. Holland. 1977. Riparian vegetation and flora of the
Sacramento Valley. Pages 47-55 in Anne Sands, ed. Riparian Forests of California; Their Ecolo-gy and conservation. Inst. Ecol. Pub. No. 15. University of California, Davis, Calif.
Conomos, T. J. 1979. Properties and circulation of San Francisco Bay water. Pages 47-84 inT. J. Conomos, ed. San Francisco Bay: The Urbanized Estuary. Pacific Division, Amer. Assoc.Advance. Sci., San Francisco, Calif.
Conomos, T. J., and D. H. Peterson. 1977. Suspended-particle transport and circulation in SanFrancisco Bay: an overview. Pages 82-97 in L. E. Cronin, ed. Estuarine Processes. Vol 2. Aca-demic Press, New York.
Cooper, W. S. 1926. Vegetational development on alluvial fans in the vicinity of Palo Alto, Cali-fornia. Ecology 7: 1-30.
Cosby, S. W. 1941. Soil survey of the Sacramento-San Joaquin Delta area, California. U. S. Dep.Agr., Bur. of Chem. and Soils, Series 1935, No. 21. 48 pp.
County Supervisors Association of California. 1975. California county fact book, 1975. Sacra-mento, Calif. 200 pp.
Curry, R. R. 1969. Holocene climatic and glacial history of the central Sierra Nevada, California.Geol. Soc. Amer. Spec. Paper 123. pp. 1-47.
Daiber, F. D. et al. 1976. An atlas of Delaware’s wetlands and estuarine resources. DelawareState Planning Office, Delaware Coastal Management Program, Technical Report No. 2. 528 pp.
Davis, C. A. 1910. Salt marsh formation near Boston and its geological significance. Econ. Geol.5:623-639.
Day, J. W., Jr., W. G. Smith, P. R. Wagner, and W. C. Stowe. 1973. Community structure andcarbon budget of a salt marsh and shallow bay estuarine system in Louisiana. Center for Wet-land Resources, Louisiana State University Pub. No. LSU-SG-72-04. 79 pp.
Delta Advisory Planning Council. 1976. Delta agriculture and soils. Sacramento, Delta Plan Tech-nical Supplement I. 101 pp.
Gerow, B. A., and R. W. Force. 1968. An analysis of the University Village Complex; with areappraisal of central California archeology. Stanford University Press, Stanford, Calif. 209 pp.
Gilbert, G. K. 1917. Hydraulic-mining debris in the Sierra Nevada. U. S. Geol. Surv. Prof. Paper105. 154pp.
Gilliam, H. 1969. Between the devil and the deep blue bay-the struggle to save San Francisco
377

SAN FRANCISCO BAY
Bay. Chronicle Books, San Francisco, Calif. 151 pp.Haines, E. B. 1976. Stable carbon isotope ratios in the biota, soils and tidal water of a Georgia
salt marsh. Estuarine Coastal Mar. Sci. 4:609-616.Haines, E. B. 1977. The origins of detritus in Georgia salt marsh estuaries. Oikos 29:254-259.Hardisky, M. A., and R. J. Reimold. 1977. Salt.-marsh plant geratology. Science 198:612-614.Harlow, N. 1950. The maps of San Francisco Bay from the Spanish discovery in 1769 to the
American occupation. The Book Club of California. 140 pp.Harvey, H.T. 1966. Some ecological aspects of San Francisco Bay. San Francisco Bay Conserva-
tion and Development Commission. 31 pp.Harvey, H. T., H. L. Mason, R. Gill, and T. W. Wooster. 1977. The marshes of San Francisco Bay-
Their attributes and values. Unpublished report prepared for the San Francisco Bay Conserva-tion and Development Commission. 156 pp.
Hinde, H.P. 1954. Vertical distribution of salt marsh phanerogams in relation to tide levels. Ecol.Monog. 24:209-225.
Johnson, D. S., and H. H. York. 1915. The relations of plants to tide levels, a study of factors af-fecting the distribution of marine plants at Cold Spring Harbor, Long Island, New York. Carne-gie Inst. Wash. Pub. 206. 161 pp.
Jones and Stokes Associates, Inc. and EDAW, Inc. 1975. Suisun marsh protection plan, fish andwildlife element. California Dep. Fish Game. 412 pp.
Keefe, C.W. 1972. Marsh production-A summary of the literature. Contrib. Marine Sci. Univ.Texas 16: 163-181.
Kingsley, R. B., and F. C. Boerger. 1976. Experimental marsh planting programs, Marin CountryDay School and Muzzi Marsh. Madrone Assoc., San Rafael, California. Report prepared forGolden Gate Highway and Transportation District. 49 pp.
Kingsley, R. B. et al. 1977. The natural resources of Napa Marsh. Calif. Dep. Fish Game, CoastalWetlands Series No. 19. 96 pp.
Kirby, C. J., and J. G. Gosselink. 1976. Primary production in a Louisiana gulf coast Spartinaalterniflora marsh. Ecology 57: 1052-1059.
Knott, J. M. 1973. Effects of urbanization on sedimentation and floodflows in Colma Creekbasin, California. U. S. Geol. Surv. Open-File Rep. 54 pp.
Knutson, P. et al. 1976. Marshland development. U. S. Army Corps of Engineers, Dredge Dispo-sal Study, San Francisco Bay and Estuary, Appendix K. 300 pp.
Kraft, J. C., E. A. Allen, D. F. Belknap, C. 3. John, and E. M. Maurmeyer. 1976. Delaware’schanging shoreline. Delaware State Planning Office, Coastal Zone Management Program Tech-nical Rep. 1.319 pp.
Krone, R. B. 1979. Sedimentation in the San Francisco Bay system. Pages 85-96 in T. J. Cono-mos, ed. San Francisco Bay: The Urbanized Estuary. Pacific Division, Amer. Assoc. Advance.Sci., San Francisco, Calif.
McCulloch, D. S., D. H. Peterson, P. R. Carlson, and T. J. Conomos. 1970. Some effects of fresh-water inflow on the flushing of south San Francisco Bay. U. S. Geol. Surv. Circ. 637A. 27 pp.
Macdonald, K. B. 1977. Coastal salt marsh. Pages 263-294 in M. G. Barbour and J. Major, eds.Terrestrial Vegetation of California. J. Wiley & Sons, New York.
Mahall, B.E. 1974. Ecological and physiological factors influencing the ecotone between Spar-tina foliosa Trin. and Salicornia virginica L. in salt marshes of northern San Francisco Bay.Ph.D. Thesis. University of California, Berkeley, Calif. 315 pp.
Mahall, B. E., and R. B. Park. 1976a. The ecotone between Spartinafoliosa Trin. and Salicorniavirginica L. in salt marshes of northern San Francisco Bay-I. Biomass and production. J. Ecol.64:421-433.
Mahall, B. E., and R. B. Park. 1976b. The ecotone b.etween Spartina foliosa Trin. and Salicorniavirginica L. in salt marshes of northern San Francisco Bay-H. Soil water and salinity. J. Ecol.64:793-809.
Mahall, B. E., and R. B. Park. 1976c. The ecotone between Spartinafoliosa Trin. and Salicornia
378

ATWATER ET AL: TIDAL MARSHES
virginica L. in salt marshes of northern San Francisco Bay-Ill. Soil aeration and tidal immer-sion. J. Ecol. 64:811-819.
Mall, R. E. 1969. Soil-water-salt relationships of waterfowl food plants in the Suisun marsh ofCalifornia. Calif. Dept. Fish Game, Wildlife Bull. 1. 59 pp.
Marmer, H.A. 1951. Tidal datum planes. U. S. Coast and Geodetic Survey Spec. Publ. 135. 142 pp.Marshall, J. T. 1948. Ecologic races of song sparrows in the San Francisco Bay region I, habitat
and abundance. Condor 50:193-215.Mason, H. L. (undated). Floristics of the Sacramento-San Joaquin Delta and Suisun Marsh (ap-
prox. title). Unpublished manuscript on file in the Sacramento office of the U. S. Army Corpsof Engineers and in the Menlo Park Library of the U. S. Geological Survey. 84 pp.
Matthew, R., and E. E. Blackie. 1931. Economic aspects of a salt water barrier below confluenceof Sacramento and San Joaquin Rivers. Calif. Div. Water Res. Bull. 28. 450 pp.
Matthew, R., J. A. Chase, and D. R. Warren. 1931. Variation and control of salinity in Sacramen-to-San Joaquin Delta and upper San Francisco Bay. Calif. Div. Water Res. Bull. 27. 440 pp.
Mitchell, H. C., compiler. 1936. First and second order triangulation in California. U.S. Coastand Geodetic Survey Spec. Publ. 202. 548 pp.
Mudge, B. F. 1858. The salt marsh formation of Lynn. Proc. Essex Inst. 2:117-119.Mueller-Dombois, D., and H. Ellenberg. 1974. Aims and methods of vegetation ecology. J. Wiley
& Sons, New York. 547 pp.Munz, P. A. 1968. Supplement to a California flora. University of California Press, Berkeley,
Calif. 224 pp.Munz, P. A., and P. A. Keck. 1959. A California flora. University of California Press, Berkeley,
Calif. 1681 pp.Myrick, R. M., and L. B. Leopold. 1963. Hydraulic geometry of a small tidal estuary. U. S. Geol.
Surv. Prof. Paper 422-B. 18 pp.National Ocean Survey. 1977a. Tide tables 1978, west coast of North and South America. U.S.
Dep. of Commerce. 222 pp.National Ocean Survey. 1977b. Untitled list giving difference between National Geodetic Vertical
Datum and mean lower low water for San Francisco Bay and San Joaquin-Sacramento DeltaRegion. National Ocean Survey, Tidal Datum Planes Section. 3 pp.
Nichols, D. R., and N. A. Wright. 1971. Preliminary map of historic margins of marshland. SanFrancisco Bay, California. U. S. Geol. Surv. Open-File Map (scale 1:125,000).
Odum, E.P. 1971. Fundamentals of ecology. 3rd ed. W. B. Saunders Company, Philadelphia,Pa. 574 pp.
Pestrong, R. 1965. The development of drainage patterns of tidal marshes. Stanford Univ. Pub.Geol. Sci., vol. 10, No. 2, 87 pp.
Pestrong, R. 1972. San Francisco Bay tidelands. California Geol. 25:27-40.Peterson, D.H. 1979. Sources and sinks of biologically reactive oxygen, carbon, nitrogen, and si-
lica in northern San Francisco Bay. Pages 175-193 in T. J. Conomos, ed. San Francisco Bay:The Urbanized Estuary. Pacific Division, Amer. Assoc. Advance. Sci., San Francisco, Calif.
Phleger, C.F. 1971. Effect of salinity on growth of a salt marsh grass. Ecology 52:908-911.Poland, J. F. 1971. Land subsidence in the Santa Clara Valley, Alameda, San Mateo, and Santa
Clara Counties, California. U. S. Geol. Surv. Misc. Field Studies Map MF-336 (scale 1:125,000).Powell, W. R., ed. 1964. Inventory of rare and endangered vascular plants of California. Califor-
nia. California Native Plant Society, Berkeley, Calif. 56 pp.Purer, E.A. 1942. Plant ecology of the coastal salt marshlands. Ecol. Monog. 12:83-111.Redfield, A. C. 1972. Development of a New England salt marsh. Ecol. Monog. 42(2):201-237.Reimold, R. J., and R. A. Linthurst. 1977. Primary productivity of minor marsh plants in Dela-
ware, Georgia, and Maine. U. S. Army Eng. Waterways Expt. Station, Tech. Rep. D-77-36.104 pp.
Ringgold, C. 1852. A series of charts, with sailing directions, embracing surveys of the Farallones,the entrance to the bay of San Francisco, bays of San Francisco and San Pablo, straits of
379
SAN FRANCISCO BAY
Carquines [sic] and Suisun bay, confluence of the deltic branches of the Sacramento and SanJoaquin rivers, and the Sacramento river (with the middle fork) to the American river, includingthe cities of Sacramento and Boston, state of California. J. T. Towers, Washington, D. C.48 pp.
San Francisco Bay Conservation and Development Commission. 1969. The San Francisco Bayplan. 43 pp.
Schlemon, R. J., and E. L. Begg. 1973. Late Quaternary evolution of the Sacramento-San Joa-quin Delta, California, Proc. Ninth Congress of the International Union for Quaternary Re-search 1973:259-266.
Shaler, N. S. 1886. Preliminary reports on sea-coast swamps of the eastern United States. U.S.Geol. Surv. 5th Annual Report. pp. 353-398.
Shalowitz, A. L. 1964. Shore and sea boundaries. U. S. Coast and Geodetic Survey Publ. 10-1,vol. 2. 749 pp.
Smith, B. J. 1965. Sedimentation in the San Francisco Bay system. Pages 675-707 in U. S. Dep.Agr. Misc. Publ. 970, Proc. Fed. Interagency Sedimentation Conf. 1965.
Teal, J. M. 1962. Energy flow in the salt marsh ecosystem of Georgia. Ecology 43:614-624.Thompson, J. 1958. Settlement geography of the Sacramento-San Joaquin Delta. Ph.D. Thesis.
Stanford University, Stanford, Calif. 551 pp.U. S. Census Office. 1901. Twelfth Census of the United States taken in the year 1900, vol. 1.
Washington, D. C. 1006 pp.U. S. Department of Commerce. 1964. Climatic summary of the United States, Supplement for
1951-1960. Climatography of the United States, No. 86-4.Van Royen, W., and C. O. Siegel. 1959. Reclamation of marsh, tide, and submerged lands. Pages
75-94 in Future development of the San Francisco Bay Area. U. S. Dep. Commerce, Office ofArea Development.
Ver Planck, W. E. 1958. Salt in California. C~Iif. Div. Mines Bull. 175. 168 pp.Weir, W.W. 1950. Subsidence of peat land.,; of the San Joaquin-Sacramento Delta, California.
Hilgardia 20: 37-56.Westdahl, F. 1896. Descriptive report accompanying a resurvey of San Francisco Bay, California,
Alameda Creek to Beard’s Creek (approx. title). U. S. Coast and Geodetic Survey Register No.2353. 8 pp.
Westdahl, F. 1897. Descriptive report accompanying a resurvey of San Francisco Bay, California,Menlo Park to near Mountain View (appro~:. title). U. S. Coast and Geodetic Survey RegisterNo. 2312. 14 pp.
Wolff, W.J. 1976. A benthic food budget for the Grevelingen estuary, The Netherlands, and aconsideration of the mechanisms causing high benthic secondary production in estuaries. Pages267-280 in B. C. Coull, ed. Ecology of Marine Benthos. Belle W. Baruch Library in Marine Sci-ence, vol. 6. University of South Carolina, Columbia, S.C.
38O
ATWATER ET AL: TIDAL MARSHES
APPENDIX A
COMMON VASCULAR PLANTS IN TIDAL MARSHESOF THE SAN FRANCISCO BAY ESTUARY.
The list excludes introduced species denoted by Munz and Keck (1959). Asterisk designatesrare or endangered plant according to Powell (1964). Scientific names follow Munz (1968) andMunz and Keck (1959) excepting nomenclature for Athyrium, Cornus and Salicornia, whichfollows Mason (1957). Many of the common names are taken from Abrams (1923-1960), andparenthetical descriptions of principal taxonomic groups are abridged from Mason (1957). Abbre-viated headings refer to localities (Fig. 2): Palo Alto Baylands; RB, Richardson Bay; CC, ChinaCamp; SS, Schultz Slough; NA, Napa marshes; SB, Southampton Bay; MZ, Martinez, SA, ShoreAcres; HS, Hill Slough; SN, marshes N of Suisun Bay; BI, Browns Island; SMS, Sand MoundSlough; SGS, Snodgrass Slough; DL, marshes and sloughs in the Delta.Sources of information:PA-Cooper (1926), Hinde (1954), and observations by Atwater in 1976.RB, CC, SS, SB, SA, HS-Collections by Savage in 1975 (SA), 1976 (RB, CC, SS, SB), and 1977(HS), and supplemental observations by Conard and Macdonald in 1976 (SS, SB)and by Atwaterin 1975 (CC) and 1977 (SB).NA-Kingsley et al. (1977, Appendix A), lower-marsh and higher-marsh communities.MZ-Observations by H. L. Mason in 1974.SN, DL-Observations by H. L. Mason ca. 1970, supplemented with reference to earlier collec-tions. Listed species belong to the following communities of Mason (undated, pp. 57-59, 71-75):palustrine, Salicornia, and Distichlis (SN); and neuston, buoyan, palustrine, and willow-fern (DL).BI, SMS, SGS-Reconnaissance by Conard and Macdonald in 1976.
[N. B.: During 1978 and 1979 Atwater collected 40 species at SMS and 38 at SGS, many morethan listed here, and also observed widespread Salicornia pacifica, Jaumea carnosa, and Triglochinmaritima in pristine marshland at BI. Mason’s Eupatorium occidentale is probably Pluchea pur-purascens (Sw.) DC. (marsh-fleabane).]
381

SAN FRANCISCO BAY
~ ~ X
XX X X X X
X
Z X
X X X X ~
XX XXX XX XX
X XX X ~
X X ~X X
X X ~X X XX X XX
X~X~X X~ ~ XX
X XX X X X X
XXX X X
X
~XX X XX
Z
~ Z
<~
382

ATWATER ET AL: TIDAL MARSHES
X XX X X ~ X X
X~ ~ X X X
~ X X X X
~ XX XX X X
X XX X X
X XX X X~ X XXX
X >~X X ~ X
~ XXX X X X
ZO
383

SAN FRANCISCO BAY
X X
x x
XX
X
384
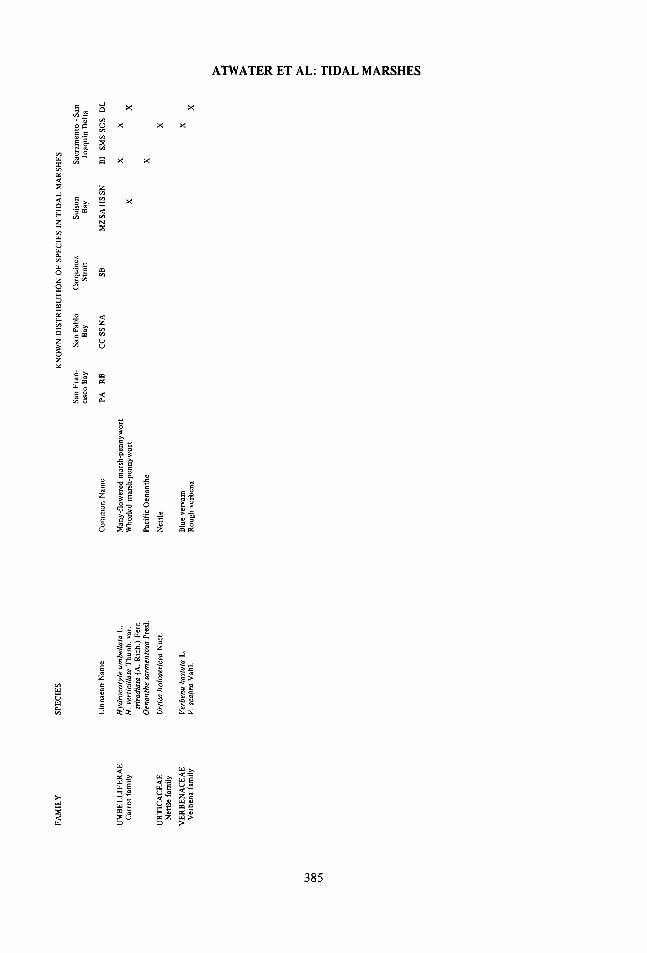
ATWATER ET AL: TIDAL MARSHES
X X
385


![Landforms Mady By Wind [Desert Landforms]](https://img.dokumen.tips/doc/110x75/56813971550346895da1066c/landforms-mady-by-wind-desert-landforms.jpg)