Embed Size (px)
Citation preview
Historical Trends in the Epidemiology of Injury and
Industrial Disease at the B.C. Worker's Compensation Board (1950-1996).
A Report Prepared for the B.C. Royal Commission on the
Worker's Compensation Board
by
Aleck Ostry M.A., M.Sc.
April, 1998.

2
Introduction
In the post-war era, B.C. has moved away from its traditional resource base towards a largely
service economy. During this time both the service sector and older resource industries have
become highly computerized and mechanized. These industrial and technological shifts have
changed the way work is organized and performed in British Columbia and have also been
associated with a profound shift in labour demography.
The purpose of this investigation is to describe changes in industrial injury and disease rates over
the time period 1950 to 1996 and to link these, where possible, to changes in the infrastructure of
the B.C. economy and labour force. Although epidemiological data are used throughout this report
the method and objectives are largely historical. The intent of this investigation is not to produce
epidemiological evidence for association and causation. Rather, it is to develop a broad historical
description of changing disease and injury rates mainly using epidemiological data obtained from
the Workers' Compensation Board (WCB).
Historical trends in the epidemiology of industrial disease and injury cannot be understood
properly unless linked to larger social processes, particularly in the post-war era, which witnessed
a re-shaping of the provincial economy as it moved away from its traditional resource base
towards the service sector. In this investigation, economic and employment data for B.C. was
abstracted from Canadian Labour Force Surveys in order to develop indicators to describe the
extent and timing of three major aspects of this transformation; the switch from resource to
service economy; fluctuations in the business cycle, and the entry of women into the labour force.
One of the drawbacks of conducting a study using WCB data is that most of the detailed
epidemiological information on injury and disease is based on accepted claims. One cannot obtain
underlying rates of industrial disease and injury in the entire working population using data

3
based on accepted injury and disease claims. Although claims acceptance rates are obviously
related to underlying disease and injury rates and temporal change in these, the claims acceptance
process is an administrative and policy filter which limits the extent to which these data can
describe the entire at-risk working population.
In an attempt to more closely examine rates in the population at risk, some emphasis has been
placed on describing death and injury report rates, their fluctuation over the study period, and
their relationship with the three indicators of labour and economic change. Injury and death report
rates are based on the WCB-insured population which in turn will represent much of the working
population at risk for industrial disease and injury. A focus on these reporting rates will still lead
to under-ascertainment of underlying population rates. The extent of this under-ascertainment will
depend on the proportion of the working population which was insured by the WCB at a given
time.
Despite the epidemiological limitations regarding claims rates just outlined, these are used
extensively in this investigation to show changes in the proportions of industrial disease and
injury categories over the study period and also to describe changing trends in industrial disease
and injury claims experience over the study period.
Methods
Two indicators of the social transformation of the B.C. labour force and economy were obtained
from the Canadian Historical Labour Force Survey (Statistics Canada Historical Labour Force
Survey, 1953-1996). The unadjusted yearly B.C. unemployment rate was selected as a rough
indicator of business cycle activity and the B.C. female labour force participation rate was used to
show the increasing gender shift in the labour force.

4
Also, using WCB claims data, the number of time loss claims in the forestry and service sector
were abstracted for each year up to 1996 (British Columbia Workers' Compensation Board Annual
Reports, 1950-1996). The ratio of the number of forestry (class 1) time loss claims compared to
service sector time loss claims (class 6) was calculated for each year and served as an indicator of
the shift away from a resource based and towards a service economy. (Time loss claims are not as
accurate an indicator as the number of workers employed in these two sectors but may be a useful
proxy to measure this.)
Injury data were obtained from Annual Reports for the year 1950 through 1996 (British Columbia
Workers' Compensation Board Annual Reports, 1950-1996). Detailed breakdown of industrial
disease data was only available in the reports from 1959 to the end of 1996. Injury and death
report rates and accepted injury claim rates were available from 1950 to 1996. The denominator
for rates is an estimate of the number of workers insured by the WCB in a given year (British
Columbia Workers' Compensation Board Statistics Dept., 1998).

5
Results
Table 1 shows the three major indicators of social transformation in the labour force.
Table 1 — Three Indicators of Labour and Economic Transition in the B.C. Economy
Time Period
Unemployment Rate* Forest/Service
Female Part. Rate
1953-59 6.1 1.33 24.6
1960-69 6.9 1.13 32.9
1970-79 8.0 .67 43.9
1980-89 11.3 .39 54.6
1990-96 9.4 .25 58.9*Unemployment rate = the unadjusted B.C. unemployment rate (percent). Forest/Service = the number of forestry sector time loss claims divided by the number of service sector time lossclaims.Female Part. Rate=(# women in the labour force/# of women aged 15-65 in the B.C. population)*100.
British Columbia's unemployment rate in the 1950s and 1960s averaged 6.5 percent increasing to
8 percent through the 1970s. The recession of the early 1980s pushed this rate over 11 percent for
most of the decade. During this 43 year span, the B.C. economy witnessed a secular increase in
unemployment of approximately 3.5 percent.
During this same period the ratio of forestry to service sector time loss claims decreased rapidly.
In 1953 there were approximately 1.3 forestry claims for every service sector claim in the
province. By 1966 there were an equal number of claims from the forestry and service sectors. In
1996, for every claim in the forestry sector there were four from the service economy. Used as an
indicator, this suggests a rapid and fairly consistent pace in the rate of change from resource to a
service economy although the pace appears to have slowed after 1980.
The gender shift in the composition of the B.C. workforce has been equally dramatic. In 1956 one
in four working age females was in the labour force. By 1979 fifty percent of women of working
age were in the labour force and by 1996 approximately 60 percent of women of working age were

6
in the labour force. The rate of growth of female labour force participation was fastest during the
1960s and 1970s and (as in the case of the pace of change towards a service economy) slowed
markedly during the late 1980s and 1990s.
While the economy was undergoing these transformations it was also increasing in size
(Table 2).
Table 2 — Provincial Employment and WCB Coverage
Time Period # Employed* # Insured % Insured # Firms
1953-59 490600 377718 77.0 30817
1960-69 664800 511900 77.0 66475
1970-79 1014000 801400 79.0 101400
1980-89 1341200 1017600 75.8 93054
1990-96 1676000 1327714 79.2 90673
* # Employed=total number of workers in the B.C. workforce. # Insured=number of workers insured by the WCB. (Estimate obtained from the WCB statistics department) # Firms=number of firms covered by the WCB. (Obtained from WCB Annual Reports)
The number of workers employed in B.C. nearly quadrupled between the early 1950s and the
1990s as did the number of workers covered by the WCB. And, the number of firms insuring their
workers tripled. However, the number of insured workers per firm peaked in the 1960s and 1970s
at approximately 13. By the 1980s this had dropped to 9.1 and by the 1990s to 6.8 which may
indicate that workers of the 1990s are, in general, distributed across more, and smaller firms, with
less co-workers than they were in the 1960s and 70s.
Insurance coverage at the WCB remained fairly constant between 75 and 80 percent of the
workforce with some decrease in coverage during the 1980s. This means that in terms of the

7
epidemiology of injury and industrial disease, the experience of approximately 25 percent of
workers in the province will not be captured using WCB statistics.
Deaths Reported to the WCB
Table 3 shows that the death report rate to the WCB was 67.3 per one hundred thousand insured
workers during the 1950s. This dropped steeply through the 1960s and by the 1970s was less than
half that observed in the 1950s. During the 1980s and 1990s the death report rate halved again to
14 per one hundred thousand insured workers. In all, the rate at which deaths were reported to the
WCB dropped by 480 percent from the 1950s to the 1990s.
Table 3 — WCB Death Report Rate by Decade
Time Period Death Report Rate*
1950-59 67.3
1960-69 43.0
1970-79 28.0
1980-89 19.4
1990-96 14.0
*Reported deaths per year per one hundred thousand WCB insured workers.
During the post-war era the B.C. economy witnessed a major shift from resources to a service
economy. The number of time loss claims for the forestry industry compared to the service sector
are used, in this investigation, as a crude indicator to illustrate the timing of this shift. Figure 1
shows the death report rate in relation to the ratio of the number of forestry to service sector
claims in B.C. from 1950 to 1996.

8
Figure 1: Death Report Rate and Ratio of Forestry to Service Sector Claims by Year
*Ratio of forest to service sector claims was multiplied by 100 in order to compare with the death report rate. Death report rate= per 100,000 insured workers.
This graph indicates that the shift away from the forestry sector towards the service sector roughly
parallels the decline in the death report rate. (Although the death report rate declined less quickly
than the proportion of forest relative to service sector claims). The decline appears to be more
rapid for both curves from 1950 to the mid-1970s. (The decline is not smooth as there are two
time periods, 1957 - 1964 and 1975 -1979 when the death report rate increases.)
It is possible that the shift towards a service economy could have changed the kinds and intensity
of exposures that workers faced. For example, it is likely, that in an economy moving from
"chainsaws to keyboards" the proportion of insured workers exposed to extremely dangerous,
acute hazards that are potentially deadly has decreased and could, at least partly, explain this drop
9
in the reported death rate. Decreased death report rates could also be due to increased safety
awareness and prevention. Any determination of this would have to be made after controlling for
the large-scale secular changes outlined.
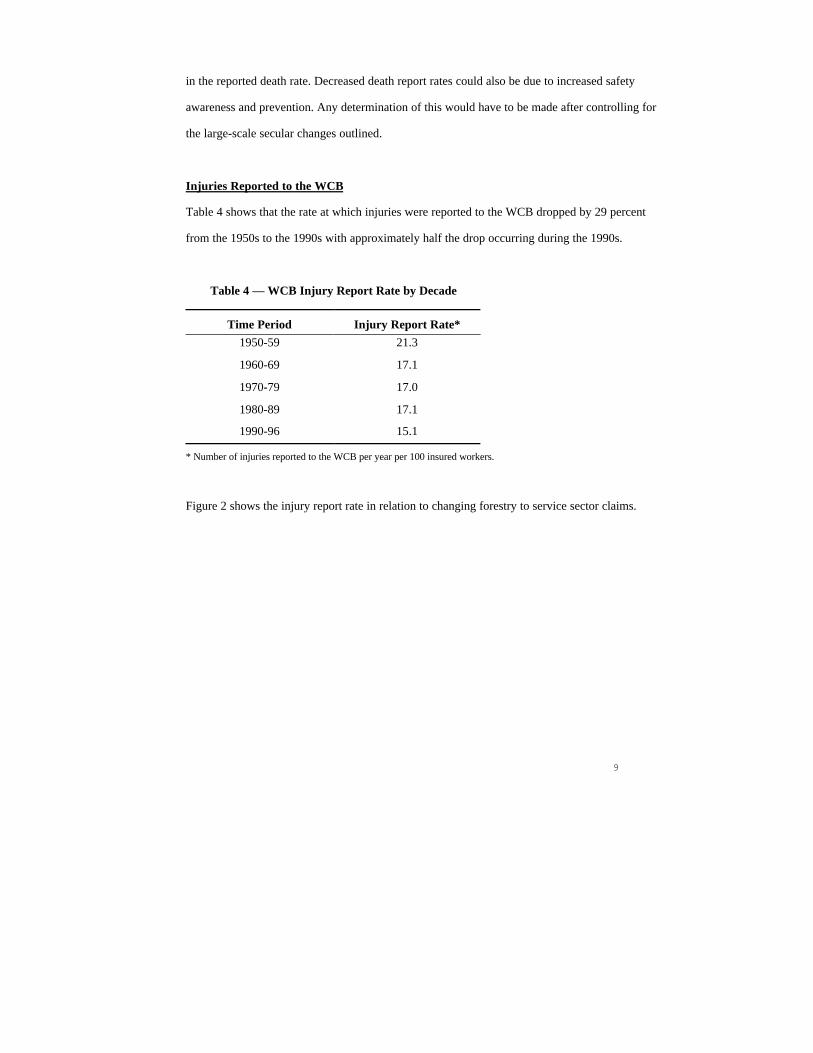
Injuries Reported to the WCB
Table 4 shows that the rate at which injuries were reported to the WCB dropped by 29 percent
from the 1950s to the 1990s with approximately half the drop occurring during the 1990s.
Table 4 — WCB Injury Report Rate by Decade
Time Period Injury Report Rate*
1950-59 21.3
1960-69 17.1
1970-79 17.0
1980-89 17.1
1990-96 15.1
* Number of injuries reported to the WCB per year per 100 insured workers.
Figure 2 shows the injury report rate in relation to changing forestry to service sector claims.

10
Figure 2: Injury Report Rate per 100 Insured Workers and the Ratio ofForestry to Service Sector Claims by Year
* Forest/Service= (the number of forestry sector time loss claims divided by the number of service sector time lossclaims)*10.
Over the time period 1953 to 1996 the injury report rate declined. But, most of this decline had
occurred by 1969. During the decade of the 1970s the injury report rate increased. In 1980 the
injury report rate began to decrease again and by 1992 reached levels seen in 1969. Since 1992
there has been a slight decline in the injury report rate. The sharp declines in the death-report rate
have not been seen for the injury-report rate.
Clearly a number of factors other than change in the structure of the economy may influence the
rate at which injuries are reported to WCB. Injury report rates could also be influenced by WCB,
industry, and union education campaigns. They could also be influenced by a changing mix of

11
workers and firms becoming insured by the WCB over time. Also, a number of studies have
indicated that claims rates (not injury report rates) may be influenced by the business cycle.
For example, in the United States, several studies have shown that workers compensation claim
rates increase with increased business cycle activity (Kossoris, 1943; Robinson, 1988; Kossoris,
1938; Catalano, 1979; Robinson, 1989). In a recent study of back claim rates in Ontario between
1975 and 1993, Brooker used the unemployment rate as a measure of business cycle activity. She
showed that age and gender adjusted back claim rates for the manufacturing, trade, and
construction sectors varied inversely with the unemployment rate (Brooker et al, 1997).
Because injury report rates may be a more "sensitive" measure than injury claim rates (because it
is less affected by administrative and policy decisions within the WCB) injury report rates for the
years 1950 through 1996 were compared to unadjusted B.C. unemployment rates (Figure 3). (It
should be noted that unlike the study by Brooker et al in Ontario, the graph in Figure 3 is
descriptive as age and gender were not controlled.)

12
Figure 3: Injury Report Rate per 100 Insured Workers and Unemployment Rate by Year
The unemployment and injury report rates appear to vary inversely with each other in a regular
pattern year-by-year over the entire time period. This is interesting given that other studies have
shown a similar pattern with accepted claim rates.
Injury Claims in Relation to the Changing Economy
As shown above, injury reports appear to be sensitive to changes in the business cycle (at least as
measured by the unemployment rate). Once an injury is reported to the board it begins the claims
process. Presumably, the relationship between the injury report rate and total claims acceptance
rate will be governed by a combination of the seriousness of reported injury and disease and board
policy in accepting claims. It would also be interesting to know if the claims rates in B.C.
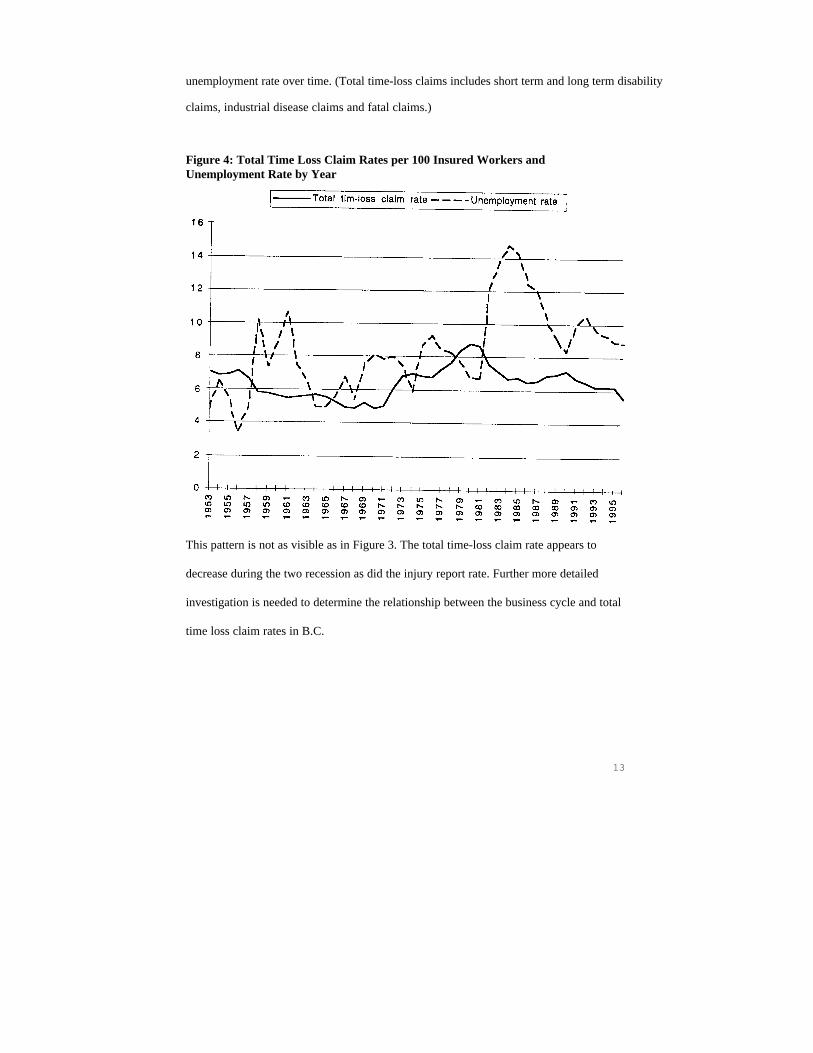
fluctuate with the business cycle. Figure 4 shows the total time-loss claim rate and the
13
unemployment rate over time. (Total time-loss claims includes short term and long term disability
claims, industrial disease claims and fatal claims.)
Figure 4: Total Time Loss Claim Rates per 100 Insured Workers andUnemployment Rate by Year
This pattern is not as visible as in Figure 3. The total time-loss claim rate appears to
decrease during the two recession as did the injury report rate. Further more detailed
investigation is needed to determine the relationship between the business cycle and total
time loss claim rates in B.C.

14
The total time loss claim rate will partly reflect board policies towards claimants. Changes in
policy towards claimants may be partly reflected by change in the proportion of total accepted
time loss claims to reported injuries. Figure 5 graphs total time loss claims as a proportion of the
number of injuries reported by year.
Figure 5: Accepted Total Time-loss claims as a Percentage of Injuries Reported by Year
From 1953 until 1971 approximately one third of injuries reported to the board resulted in an
accepted time-loss claim. From 1972 until 1975 the percentage of accepted claims increased at a
rate of approximately 3 percent per year. The major increase from 1972 to 1973 is likely due to
removal of a three-day waiting period for the filing of claims in 1972. From 1973 the percentage
of accepted claims increased at a rate of 0.5 percent per year, peaking at 40.5 in 1982. Over the
next 3 years to 1985 there was a drop to 40.5 percent. Between 1986 and 1996, the proportion of
accepted claims remained in fairly constant fluctuation between 40.4 and 43.7 percent.

15
The third indicator of social transformation in the labour force, as used in this report, is the
changing participation rate of women in the B.C. economy. Figure 6 shows the trend in female
participation in the labour force in relation to the shift towards a service economy.
Figure 6: Female Participation Rate and Rate of Shift Towards aService Economy in B.C.
*Female part. rate=( number of employed women /total population of women in B.C. between ages 15 and 65)*100 Shift to service=(number of service sector time loss claims/number of forestry sector time loss claims)*10.

16
The movement of women into the labour force roughly parallels the move towards a service
economy. As women entered the labour force in greater numbers and as the economy shifted away
from its traditional resource base what happened to time loss claims for women? Figure 7 shows
the changing female labour force participation rate in relation to the proportion of time loss claims
awarded to women.
Figure 7: Female Participation Rate in the Labour Force and Proportion ofTotal Time Loss Claims Received by Women by Year
*Claims rate= Percentage of total time loss claims received by women. Partic. rate=Female labour force participation rate.

17
In 1953 approximately 1 of every 4 women of working age in B.C. was in the workforce and
women received 7 percent of time-loss claims. Eighteen years later, in 1971, 1 out of 2 women of
working age were in the workforce and female workers received approximately 10 percent of time
loss claims. During the 1970s and 1990s the participation rate for women increased by 10 percent
so that by 1980 half working age women were in the workforce. By 1980 women received 15
percent of time loss claims. Between 1980 and 1996 the female participation rate increased by
just under 10 percent. During this time the proportion of time loss claims received by women rose
from 15 to 26 percent.
Although the rate of female participation in the labour force has slowed since 1980, the rate of
increase in proportion of claims awarded to women increased during this period. From these
purely descriptive data it is not clear why with 60 percent of working age women in the labour
force by 1996 that just over one quarter of claims were awarded to women. Clearly these
descriptive data point to a need to investigate this further.
Changing Pattern of Injury Claims During the Study Period
Short-term time-loss claims represent 94 to 97 percent of total time loss claims during the study
time period. Figure 8 shows the rates for permanent disability, fatal claims, and claims for
industrial disease. (It should be remembered when looking at this chart that, although the
denominator is the number of insured workers, its size is different for each category so that this
graph is only useful in showing the relative patterns of fluctuation of these over time.)

18
Figure 8: Injury Time Loss Claim Rates by Year
*Ltd=Number of permanent time-loss claims accepted per 10,000 insured workers. Fatal claims=Number of fatal claims accepted per 100,000 insured workers. Industrial claims=Number of accepted industrial disease claims per 10,000 insured workers.
The pattern of accepted fatal claims over time is similar to that observed in Figure 1 for reported
deaths and is understandable as approximately 80 percent of reported deaths result in an accepted
fatal claim at the WCB. The pattern of accepted permanent time-loss claims remains
(comparatively) flat over the study period. The pattern of accepted industrial disease claims
appears similar to that demonstrated for total time-loss claims (See Figure 2) and injury report
rates (See Figure 1). As short term time-loss claims account for over 95 percent of total time-loss
claims their pattern over time is essentially the same as the total time-loss claims shown in
Figure 2).
19
Most injury claims at the WCB are for short-term time loss. Such injuries have been classified
into 15 basic categories over the study period (Appendix A). Some of these categories were added
late in the study period. For example, back strain appears in the reports separately from strain in
1979 but not earlier. Other categories have changed names and definition. For example
overexertion existed as a separate category to 1971 but in 1972 was absorbed into "strains".
For purposes of this historical analysis it was felt important to separate strain-based injuries from
injuries resulting from impact (such as falls, struck by, stepping on, etc.). Also, the experience of
WCB's in most jurisdictions indicates that, as a general category, injuries arising from strain have
become increasingly important in the service economy. Appendix A shows the reduction, for the
purposes of this analysis, of these 15 injury categories into 3 categories (strain, impact, and
miscellaneous). Figure 9 shows the number of claims due to strains, impacts, and miscellaneous
causes as a proportion of accepted short term time-loss claims.
20
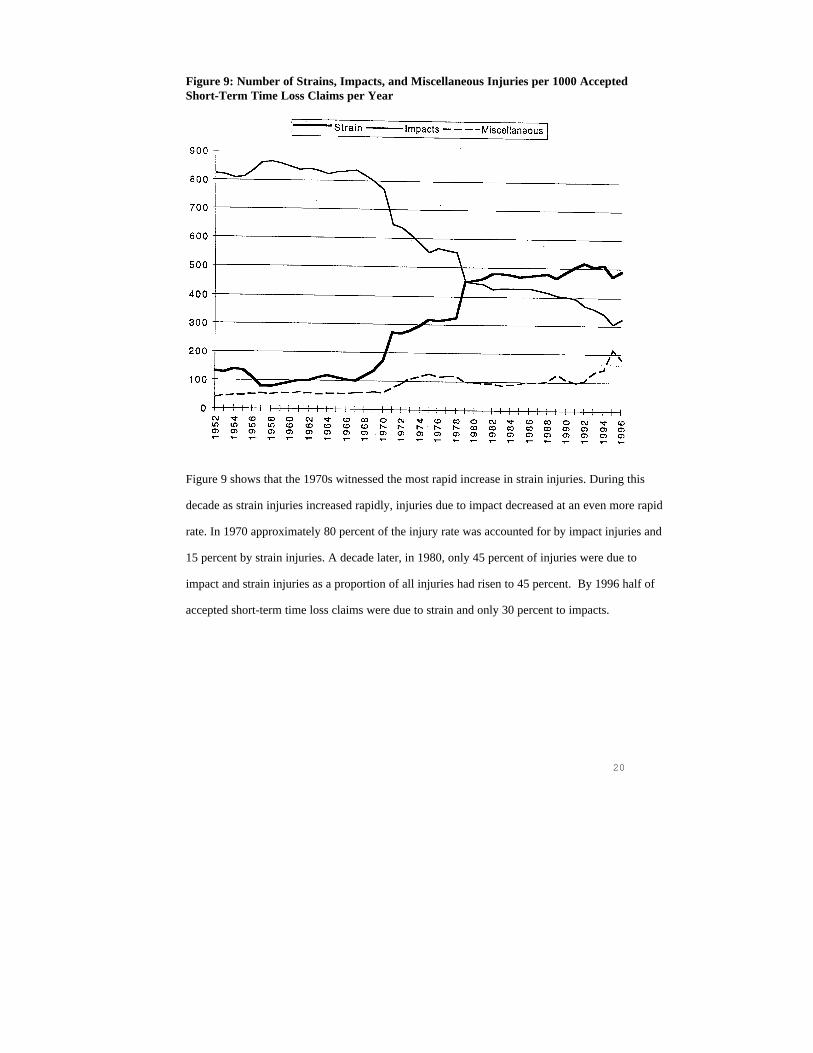
Figure 9: Number of Strains, Impacts, and Miscellaneous Injuries per 1000 AcceptedShort-Term Time Loss Claims per Year
Figure 9 shows that the 1970s witnessed the most rapid increase in strain injuries. During this
decade as strain injuries increased rapidly, injuries due to impact decreased at an even more rapid
rate. In 1970 approximately 80 percent of the injury rate was accounted for by impact injuries and
15 percent by strain injuries. A decade later, in 1980, only 45 percent of injuries were due to
impact and strain injuries as a proportion of all injuries had risen to 45 percent. By 1996 half of
accepted short-term time loss claims were due to strain and only 30 percent to impacts.

21
Because of the changing definition of strain over time and the broadness of the category it is not
clear, at least from the date presented here, what kinds of injuries are within this category and
how "the mix" changed over time. After 1979, back strain is separated from strain so this can be
gauged for the period 1979 to 1996 (Figure 10).
Figure 10: Strain and Back Strain Rate per 1000 Accepted Time Loss Claims per Year
Back strains represent approximately two thirds of strain injury time-loss claims per year from
1979 to 1996. The proportion of back claims to all injury strain claims was very steady during this
time.

22
Patterns of Industrial Disease Claims During the Study Period
Figure 8 showed the rates of acceptance of industrial disease claims over the study period. The
trends for accepted industrial disease claims over time were broadly similar to those for injury
report rates and total accepted time-loss claims (which are almost completely driven by short-term
time-loss claims). That is, increases in the 1970s, were followed by decreases in the first half of
the 1980s. And, the increases of the last half of the 1980s were followed by declines to 1996.
While this describes trends in rates over time, it is necessary to obtain more detailed information
to determine whether the kinds of disease compensated have also changed over time. Accordingly,
the total number of accepted industrial disease claims by major category are shown for each
decade in table 5. These disease categories were obtained by grouping the WCB industrial
disease categories into five large categories. This logic for this categorization was to select disease
groups that remained fairly significant (mostly above 10 percent of disease claims) throughout the
study period. Grouping was also performed on the basis of similarity of exposure and/or outcome
). Appendix B shows these categories in detail.
Table 5 — Average Number of Industrial Disease Claims by Decade
Decade 60-69 70-79 80-89 90-96Respiratory 93.4 126.4 201.0 266.7Hearing loss 11.9 192.7 434.9 722.4RSI 263.5 707.8 2154.5 4252.1Dermatitis 373.4 242.0 266.6 197.7Radiation 65.3 279.6 528.0 538.4Other 203.9 447.0 787.2 1376.4Total 1011.4 1995.5 4372.2 7353.9
Included in the category "Other" were allergic reaction, cancer, and stress for which claims were
first awarded in 1992. These form an insignificant portion of the category "other" for these years.
These three new categories represent from 3 to 4 percent of total industrial disease claims in the
23
years 1992 to 1996. Less than 10 cancers were compensated during these years. Of the three new
categories stress claims comprise 90 percent from 1992 to 1996.
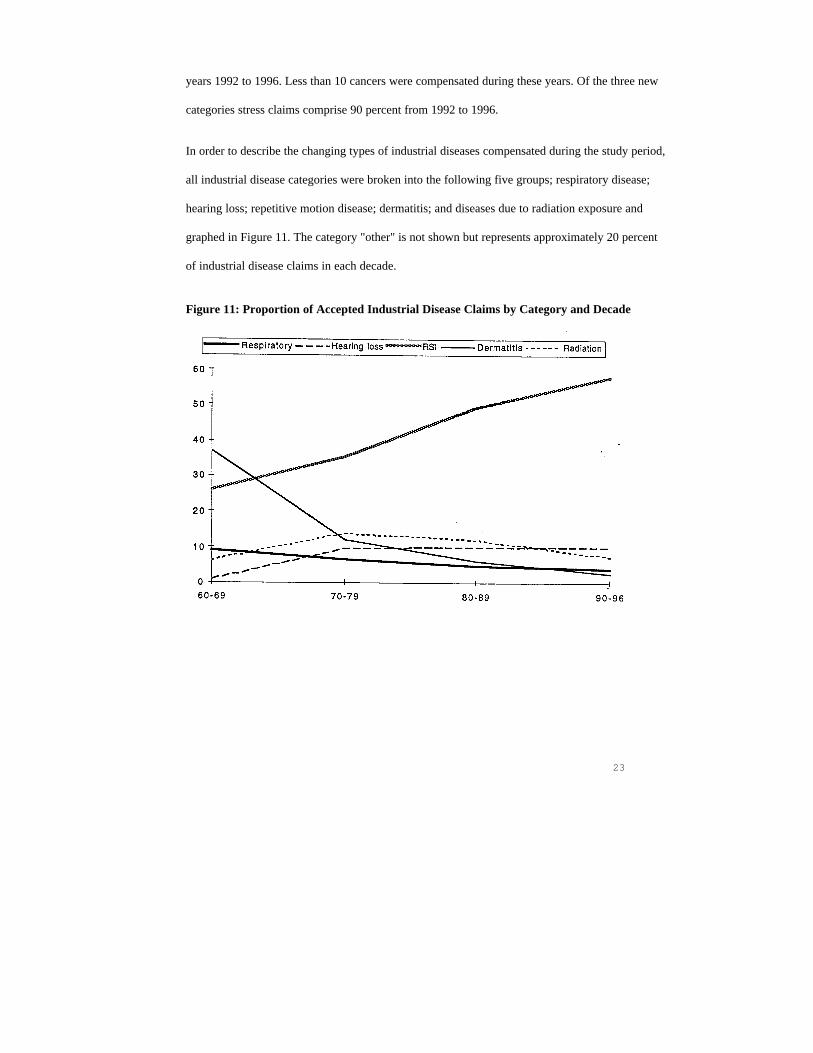
In order to describe the changing types of industrial diseases compensated during the study period,
all industrial disease categories were broken into the following five groups; respiratory disease;
hearing loss; repetitive motion disease; dermatitis; and diseases due to radiation exposure and
graphed in Figure 11. The category "other" is not shown but represents approximately 20 percent
of industrial disease claims in each decade.
Figure 11: Proportion of Accepted Industrial Disease Claims by Category and Decade

24
In the 1960s dermatitis was the largest single category of accepted industrial disease claims
accounting for nearly 40 percent. This was followed by RSI (categorized until 1978 as either
bursitis or tenosynovitis) representing 26 percent of claims. The third largest category in the
1960s comprised respiratory disease. By the 1970s dermatitis had dropped to 10 percent of
disease claims and radiation related disease claims and hearing loss claims had increased to
between 10 and 15 percent of disease claims. Strain claims (bursitis and tenosynovitis and)
represented 35 percent of claims.
Between the 1970s and 1990s, claims for bursitis, tenosynovitis and (after 1979) carpal tunnel
syndrome increased from 35 to 55 percent of all industrial disease claims. Because this is the
single most important industrial disease category for most of the study period, Figure 12 shows
the breakdown within this category.

25
Figure 12: Accepted Repetitive Strain Disease Claim Rates per 1,000 Insured Workers
Rates for tenosynovitis double from 0.5 to 1 accepted claims per 1,000 insured workers between
1959 and 1979 with all of this increase occurring during the decade of the 1970s. Between 1979
and 1987 rates declined to 0.75 claims per 1,000 insured workers. After 1987 there was a steep
increase which peaked in 1992 at 2.2 claims per 1,000 insured workers. Since 1992 these rates
have declined and were 1.6 claims per 1,000 insured workers by 1996. Claims for bursitis and
carpal tunnel appear to follow this same pattern over time.
Conclusions
The B.C. economy made a rapid and profound transition from resource to a largely service
economy from the1950s to the 1990s. During this time female participation in the labour force has
more than doubled and unemployment rates have undergone a secular increase with a particularly
severe increase during the first half of the 1980s. Major changes have also occurred during this

26
time in the number and kinds of injury and industrial disease seen at the WCB. Using broad
socio-economic indicators there appears to be some relationship between major transformation in
the economy and changing rates and kinds of injury and disease. For example, there has been a
dramatic decline in the rate of reported deaths of 480 percent which may be associated with the
shift away from the resource sector with its more acute exposure hazards relative to the service
sector.
As women moved into the labour force at an increasing rate, B.C. shifted towards a service
economy. There were more women than ever before in the labour force by 1996 working mainly in
service sector jobs. In fact, 60 percent of women of working age were in the labour force by 1996.
However, their share of total time-loss claims was only 26 percent. It may be that men are
exposed to more dangerous working conditions than women. It might be useful to investigate this
further by studying the pattern of claims acceptance rates for men and women working in the
same occupations where they are more likely to be exposed to similar hazards. More tightly
focused empirical studies (controlling for age and occupation) may shed light on what appears to
be a gender disparity in accepted claims rates.
A number of studies have linked claims rates with fluctuations in the business cycle. In this
investigation injury report rates show an inverse relationship with the unemployment rate over the
entire study period. This result appears (at least visually) weaker for claims rates and perhaps
only for the last half of the study period. These results should be explored further with properly
controlled (for age and gender) empirical studies in order to determine the veracity of this
apparent association. If these rates are associated with the business cycle then this has important
implications for WCB prevention policy.

27
Another clear pattern which emerges from this investigation is the dominance by the 1990s of
"strain"-related injury and disease claims. After 1980, approximately 50 percent of short term
time loss claims for injury and industrial disease were "strain" related. For the injury claims,
after 1980, approximately two-thirds were "back strain" which was the single largest category of
strain injuries. These data point to a profound transition in the epidemiology of injury and
industrial disease in the province as it has moved towards a service economy.
There are a number of limitations with the approach taken in this report. The three indicators of
social transformation were not developed empirically. They may not be the "best" indicators of the
social transformations they claim to measure. Their choice was governed partly by the availability
of statistical data for the entire time period and partly on commonly accepted ideas about the most
significant changes which have occurred in the labour force over the past four decades.
Also, the data have been used in this investigation in an entirely descriptive fashion. As outlined
in the introduction, the focus has been historical more than epidemiological. Any associations
shown in this investigation are descriptive and must be interpreted as such. Finally, definitions of
disease and injury categories have shifted over time. Still, in analysis involving long time periods,
use of categories which do not remain exactly the same over time may still be useful to show
broad temporal patterns. Again these must be interpreted with caution.
In spite of these caveats this investigation does demonstrate two fundamental points. First, that
this historical approach provides a long time-frame over which rates of industrial injury and
28
disease can be traced in order to identify secular trends in these. This helps better "locate" the
current situation (or at least the situation in 1996) in time.
Second, by contextualizing changing patterns of injury and disease within the major social
transformations in the labour force a first step has been made to further elucidate these. By paying
attention to injury and death report rates versus claims acceptance rates, the impact of social
transormations in the labour force becomes more visisble. The rate of injury report to the WCB
will be less influenced by internal administrative and policy factors than the accepted claims rates
so the impact of social change can be more easily isolated.
This investigation shows descriptively that these social transformations taken together with
complex administrative and policy changes at the WCB may have an impact on disease and injury
trends. That these are intertwined in complex ways is shown in Figure 5 where when the 3-day
waiting period for short term time loss claims was eliminated, the proportion of accepted claims
increased dramatically. This occurred at the time of most rapid labour force transformation both in
terms of the move towards a service economy and in terms of the pace of female participation in
the workforce.
In this investigation attention has been paid mainly to the impact of social transformation of the
labour force on injury and disease. More research needs to be performed to better elucidate the
impacts of these social processes in conjunction with administrative and policy shifts at the WCB.
If these factors, and their interactions, are better understood then evaluation and design of
appropriate prevention programs is placed on a firmer theoretical and empirical basis.

29
Finally, the clear and overwhelming trend towards "strain-related" injuries and disease creates
new challenges for adjudication and prevention. The often "subjective" nature of strain injury and
the relationship between psychosocial factors (stress) and back strain and other strain injuries
complicates identification and adjudication of these. Identification of "strain-producing" work
situations should be a priority. The elucidation of the relationship between "physical" strain
injuries and psychosocial work conditions is also very important as increasingly stress has been
linked with both attitudinal and physiological outcomes (Fox 1993; Karasek 1989; Sharit 1982).

30
References
Brooker A, Frank J, Tarasuk V. (1997) Back Pain Claim Rates and the Business Cycle. Social
Science and Medicine. 45(3), 429-439.
Catalano R. (1979) Health Costs of Economic Expansion: The Case of Manufacturing Accident
Injuries. American Journal of Public Health. 69(8), 189-794.
Fox M L, Dwyer D J, Ganster D C. (1993) Effects of Stressful Job Demands and Control on
Physiological and Attitudinal Outcomes in a Hospital Setting. Academy of Management Journal.
36(2), 289-318.
Karasek R. (1989) Control in the Workplace and its Health-related Aspects. In S Sauter, J. Hurell,
& C. Copper (Eds.), Job Control and Worker Health, 129-159. Chichester, England: Wiley.
Kossoris M D. (1938) Industrial Injuries and the Business Cycle. Monthly Labor Review 46(3),
579-594.
Kossoris M D. (1943) Changes in Injury Frequency Rates and Employment in Manufacturing,
1936-41. Monthly Labor Review. 56(5), 949-954.
Robinson J C. (1988) The Rising Long-term Trend in Occupational Injury Rates. American
Journal of Public Health. 78(3), 276-281.
31
Robinson J C, and Shor G M. (1989) Business-cycle Influences on Work-related Disability in
Construction and Manufacturing. Millbank Quarterly. 67 (Supplement 2, part 1), 92-111.
Sharit J, Salvendy G. (1982) Occupational Stress: Review and Reappraisal. Human Factors. 24,
129-162.
Statistics Canada (1953-1996) Canadian Historical Labour Survey.. Statistics Canada, Ottawa.
Workers' Compensation Board (1950-1996) Annual Reports. WCB, Richmond.
32
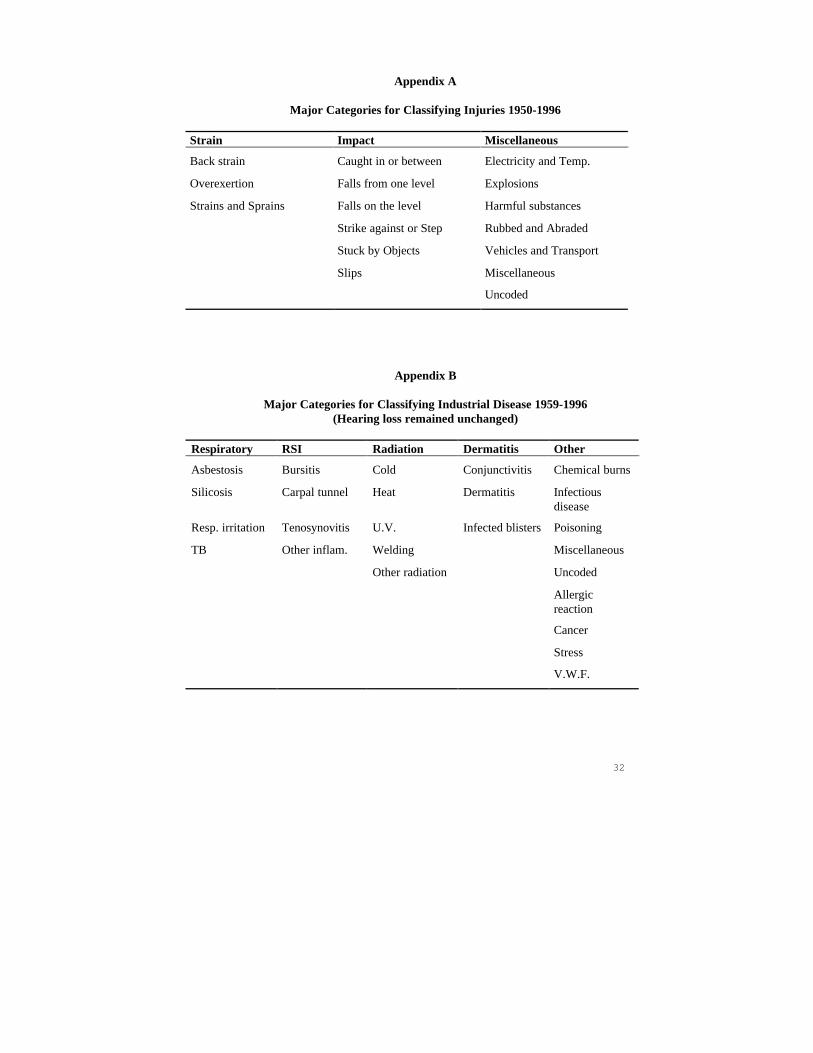
Appendix A
Major Categories for Classifying Injuries 1950-1996
Strain Impact Miscellaneous
Back strain Caught in or between Electricity and Temp.
Overexertion Falls from one level Explosions
Strains and Sprains Falls on the level Harmful substances
Strike against or Step Rubbed and Abraded
Stuck by Objects Vehicles and Transport
Slips Miscellaneous
Uncoded
Appendix B
Major Categories for Classifying Industrial Disease 1959-1996(Hearing loss remained unchanged)
Respiratory RSI Radiation Dermatitis Other
Asbestosis Bursitis Cold Conjunctivitis Chemical burns
Silicosis Carpal tunnel Heat Dermatitis Infectiousdisease
Resp. irritation Tenosynovitis U.V. Infected blisters Poisoning
TB Other inflam. Welding Miscellaneous
Other radiation Uncoded
Allergicreaction
Cancer
Stress
V.W.F.


