Embed Size (px)
Citation preview

Historic Land Values and the 1970s Land Price Bubble
Ron Plain, Professor of Agricultural Economics

Missouri is typical

0200400600800
100012001400160018002000220024002600
50 54 58 62 66 70 74 78 82 86 90 94 98 02 06 10
Year
$/acre
U.S. Farm Real Estate Values, 1950-2011* USDA/NASS
*Includes all land, buildings, and dwellings on farms.
0200400600800
100012001400160018002000220024002600
50 54 58 62 66 70 74 78 82 86 90 94 98 02 06 10
$/acre
*Value of all farm land and buildings.
Missouri Farmland Values, 1950-2011* USDA/NASS

0200400600800
100012001400160018002000220024002600
50 54 58 62 66 70 74 78 82 86 90 94 98 02 06 10
$/acre
Missouri USA
*Value of all farm land and buildings.
Farmland Values, 1950-2011* USDA/NASS

Cropland v Pasture

0200400600800
100012001400160018002000220024002600280030003200
50 54 58 62 66 70 74 78 82 86 90 94 98 02 06 10
Year
$/acre
USDA/NASS Mo. farm real estate
MU good cropland, July
MU good pastureland, July
Comparison of MU Survey and NASS Land Values

Farmland Prices Usually Go Up

0200400600800
100012001400160018002000220024002600
50 54 58 62 66 70 74 78 82 86 90 94 98 02 06 10Year
$/acre
Actual6% Trend
*Value of all farm land and buildings.
Missouri Farmland Values, 1950-2011* USDA/NASS

0200400600800
100012001400160018002000220024002600
50 54 58 62 66 70 74 78 82 86 90 94 98 02 06 10Year
$/acre
Actual6% Trend
*Value of all farm land and buildings.
Missouri Farmland Values, 1950-2011* USDA/NASS
At the start of 2011, Missouri land values were $292/acre above trend.

-250-200-150-100-50
050
100150200250300
1950
1955
1960
1965
1970
1975
1980
1985
1990
1995
2000
2005
2010
Year
$/acre
*Value of all farm land and buildings.
Change in Missouri Farmland Values, 1950-2011* USDA/NASS
Average increase is $40 per year

Changing Farmland Values
Why do land prices go up?
Inflation

0
50
100
150
200
250
50 54 58 62 66 70 74 78 82 86 90 94 98 02 06 10
1982-84=100
Source: Bureau of Labor Statistics
Consumer Price Index, 1950-2011

Changing Farmland Values
Why do land prices go up?
Inflation
Yield

U.S. Average Corn Yield, 1908-2011
020406080
100120140160180
1908
1912
1916
1920
1924
1928
1932
1936
1940
1944
1948
1952
1956
1960
1964
1968
1972
1976
1980
1984
1988
1992
1996
2000
2004
2008
Bu Per Acre
Source: USDA/NASS

Changing Farmland Values
Why do land prices go up?
Inflation
Yield
Fewer acres per person

Price Bubbles

Wikipedia: An economic bubble (sometimes referred to as a speculative bubble, a market bubble, a price bubble, a financial bubble, a speculative mania or a balloon) is "trade in high volumes at prices that are considerably at variance with intrinsic values".

Price bubble: A rapid and unsustainable increase in the price of an item. You know for sure it is a bubble when it pops.

0200400600800
100012001400160018002000220024002600
1910
1915
1920
1925
1930
1935
1940
1945
1950
1955
1960
1965
1970
1975
1980
1985
1990
1995
2000
2005
2010
Year
$/acre
*Value of all farm land and buildings.
Missouri Farmland Values, 1910-2011* USDA/NASS

0200400600800
100012001400160018002000220024002600
1910
1915
1920
1925
1930
1935
1940
1945
1950
1955
1960
1965
1970
1975
1980
1985
1990
1995
2000
2005
2010
Year
$/acre
*Value of all farm land and buildings.
Missouri Farmland Values, 1910-2011* USDA/NASS
Only 2 major price declines

0102030405060708090
10019
10
1915
1920
1925
1930
1935
1940
Year
$/acre
*Value of all farm land and buildings.
Missouri Farmland Values, 1910-1940* USDA/NASS
Peak to trough: a decline of 65%

0102030405060708090
10019
10
1915
1920
1925
1930
1935
1940
Year
$/acre
*Value of all farm land and buildings.
Missouri Farmland Values, 1910-1940* USDA/NASS
First prices give back the W W I gains Then slide further in the Depression

0200400600800
100012001400160018002000220024002600
50 54 58 62 66 70 74 78 82 86 90 94 98 02 06 10
$/acre
*Value of all farm land and buildings.
Missouri Farmland Values, 1950-2011* USDA/NASS
Peak to trough: a decline of 39%

Two parts to a bubble: the boom and the bust

0200400600800
100012001400160018002000220024002600
50 54 58 62 66 70 74 78 82 86 90 94 98 02 06 10
$/acre
*Value of all farm land and buildings.
Missouri Farmland Values, 1950-2011* USDA/NASS
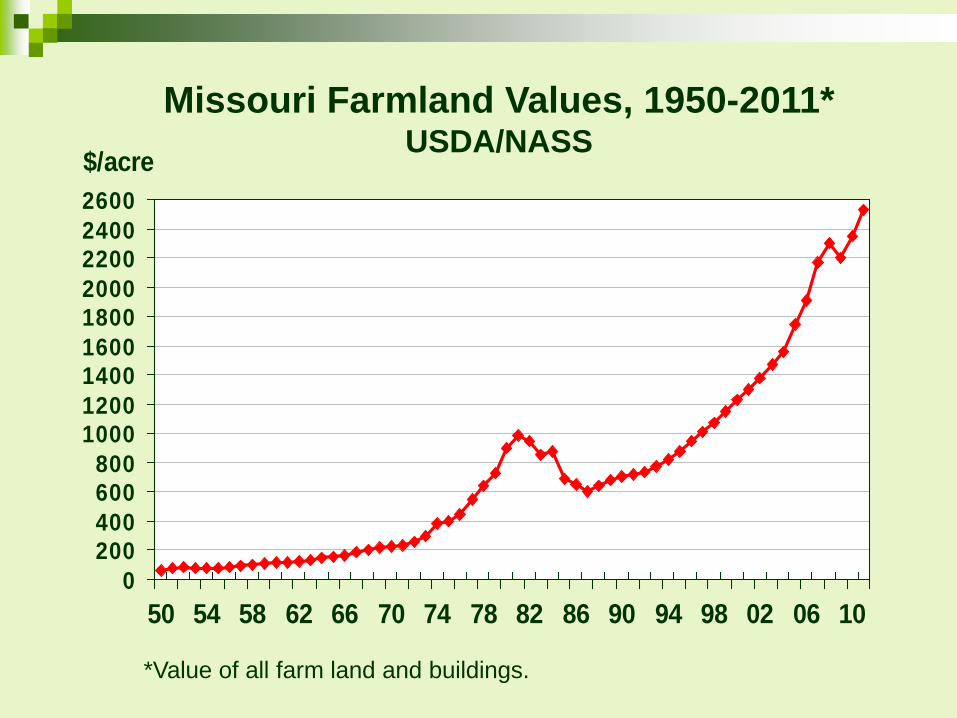
Changing Farmland Values
Why the boom in land prices in the 1970s?
Rising crop prices
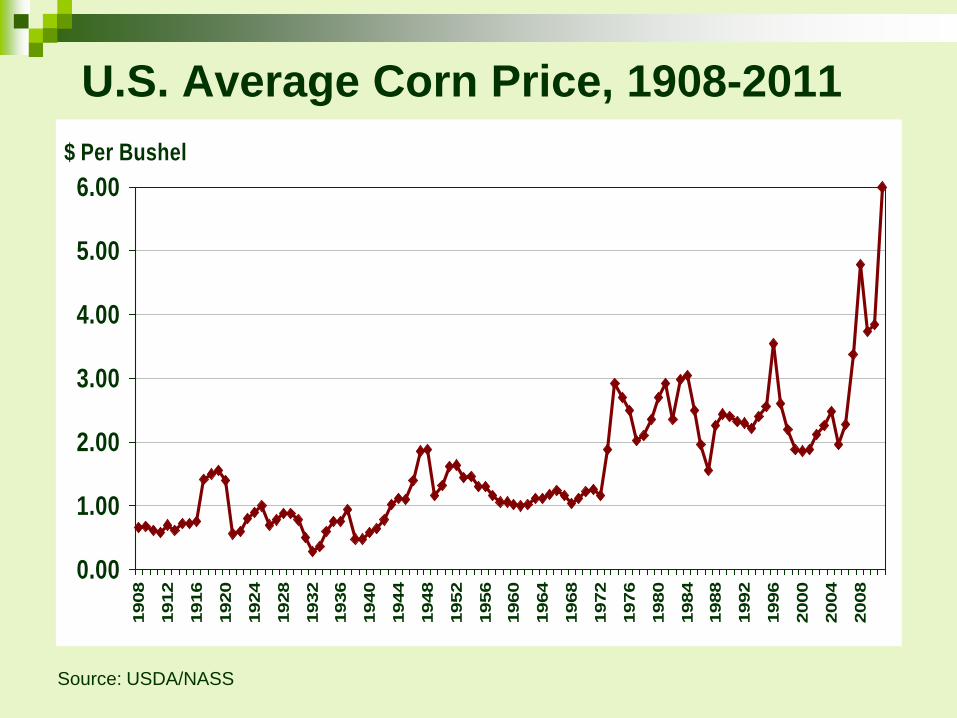
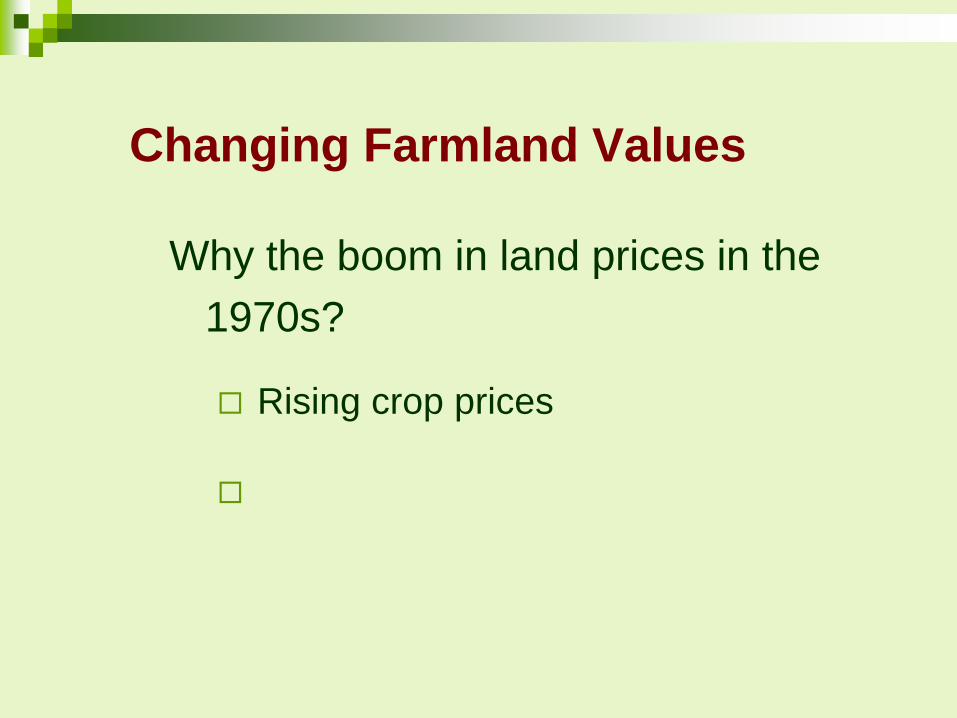
U.S. Average Corn Price, 1908-2011
0.00
1.00
2.00
3.00
4.00
5.00
6.00
1908
1912
1916
1920
1924
1928
1932
1936
1940
1944
1948
1952
1956
1960
1964
1968
1972
1976
1980
1984
1988
1992
1996
2000
2004
2008
$ Per Bushel
Source: USDA/NASS

U.S. Average Corn Price, 1908-2011
0.00
1.00
2.00
3.00
4.00
5.00
6.00
1908
1912
1916
1920
1924
1928
1932
1936
1940
1944
1948
1952
1956
1960
1964
1968
1972
1976
1980
1984
1988
1992
1996
2000
2004
2008
$ Per Bushel
Source: USDA/NASS
1908-1942 35 years Avg $0.78
1942-1972 30 years Avg $1.26
1973-2006 34 years Avg $2.37

U.S. Average Corn Yield, 1908-2011
020406080
100120140160180
1908
1912
1916
1920
1924
1928
1932
1936
1940
1944
1948
1952
1956
1960
1964
1968
1972
1976
1980
1984
1988
1992
1996
2000
2004
2008
Bu Per Acre
Source: USDA/NASS

U.S. Average Corn Gross, 1908-2011
0100200300400500600700800900
100019
0819
1219
1619
2019
2419
2819
3219
3619
4019
4419
4819
5219
5619
6019
6419
6819
7219
7619
8019
8419
8819
9219
9620
0020
0420
08
$ Per Acre
Source: USDA/NASS

Changing Farmland Values
Why the boom in land prices in the 1970s?
Rising crop prices
Low “real” mortgage rates
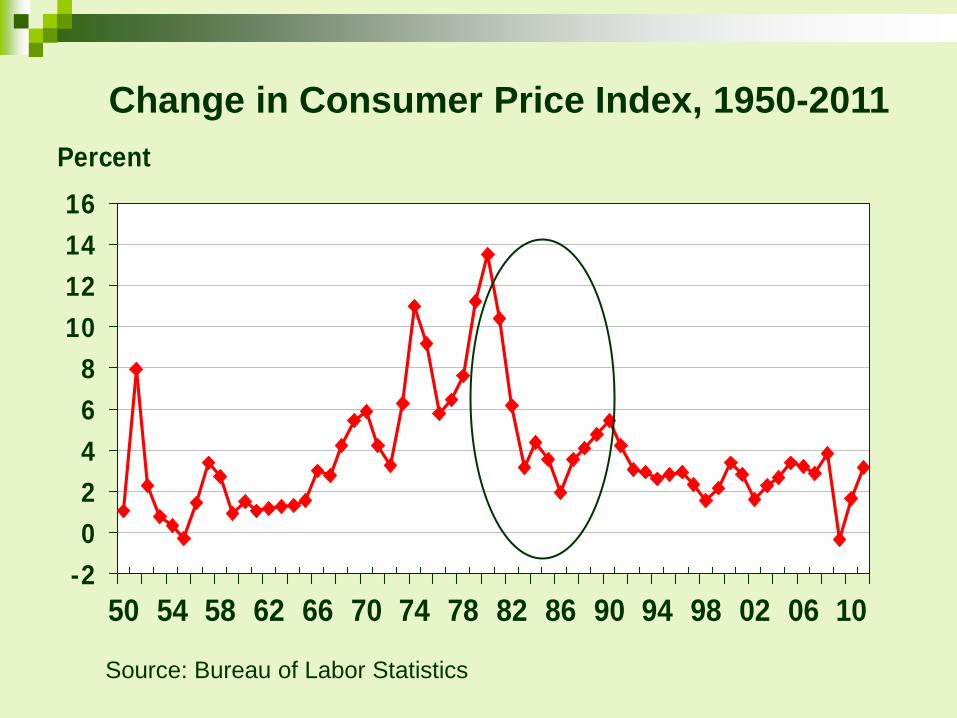
High inflation

-202468
10121416
50 54 58 62 66 70 74 78 82 86 90 94 98 02 06 10
Percent
Source: Bureau of Labor Statistics
Change in Consumer Price Index, 1950-2011

02468
101214161820
50 54 58 62 66 70 74 78 82 86 90 94 98 02 06 10
Percent
Source: Federal Reserve Bank of St Louis
Bank Prime Interest Rates, 1950-2011

-8
-6
-4
-2
0
2
4
6
8
10
50 54 58 62 66 70 74 78 82 86 90 94 98 02 06 10
Percent
Source: Federal Reserve Bank of St Louis
“Real” Bank Prime Interest Rates, 1950-2011
In the 1970s, inflation went up faster than interest rates and “real’ rates fell

Changing Farmland Values
Why the bust in land prices in the 1980s?
Falling crop prices

U.S. Average Corn Price, 1908-2011
0.00
1.00
2.00
3.00
4.00
5.00
6.00
1908
1912
1916
1920
1924
1928
1932
1936
1940
1944
1948
1952
1956
1960
1964
1968
1972
1976
1980
1984
1988
1992
1996
2000
2004
2008
$ Per Bushel
Source: USDA/NASS
1908-1942 35 years Avg $0.78
1942-1972 30 years Avg $1.26
1973-2006 34 years Avg $2.37

Changing Farmland Values
Why the bust in land prices in the 1980s?
Falling crop prices
High “real” mortgage rates
Falling inflation
-202468
10121416
50 54 58 62 66 70 74 78 82 86 90 94 98 02 06 10
Percent
Source: Bureau of Labor Statistics
Change in Consumer Price Index, 1950-2011

02468
101214161820
50 54 58 62 66 70 74 78 82 86 90 94 98 02 06 10
Percent
Source: Federal Reserve Bank of St Louis
Bank Prime Interest Rates, 1950-2011

-8
-6
-4
-2
0
2
4
6
8
10
50 54 58 62 66 70 74 78 82 86 90 94 98 02 06 10
Percent
Source: Federal Reserve Bank of St Louis
“Real” Bank Prime Interest Rates, 1950-2011
In the 1980s, inflation went down faster than interest rates and “real’ rates rose

02468
1012141618
72 76 80 84 88 92 96 00 04 08
%
$0
$500
$1,000
$1,500
$2,000
$2,500
$3,000InterestLand $
Mortgage rates above 11% are associated with declining land values.
Mortgage Rates & Mo. Land Values, 1972-11

-4
-2
0
2
4
6
8
10
12
72 76 80 84 88 92 96 00 04 08
%
$0
$500
$1,000
$1,500
$2,000
$2,500
$3,000Real InterestLand $
“Real” mortgage rates above 7% are associated with declining land values.
Real Mortgage Rates & Mo. Land Values, 1972-11

Changing Farmland Values
Will the future be like the past, with rising crop prices causing a land price boom and rising real interest rates causing a land price bust?

0200400600800
100012001400160018002000220024002600
50 54 58 62 66 70 74 78 82 86 90 94 98 02 06 10Year
$/acre
Actual6% Trend
*Value of all farm land and buildings.
Missouri Farmland Values, 1950-2011* USDA/NASS
At the start of 2011, Missouri land values were $292/acre above trend.

Any Questions?