Embed Size (px)
Citation preview


- 1 -
HIP�&�KNEE�ARTHROPLASTY��REVIEW�OF�2009�ANNUAL�REPORT�
INTRODUCTIONThis report summarises major findings from the Australian Orthopaedic Association National Joint Replacement Registry 2009 Hip and Knee Arthroplasty Report.
The Registry began data collection on 1st September 1999. Implementation was undertaken in a staged manner in each of the Australian states and territories becoming fully national during 2002.
The Department of Health and Ageing funds the Registry. In June 2009 Federal Parliament passed legislation to enable the government to cost-recover this funding from the Orthopaedic industry.
REGISTRY AIMS� Identify the demographic and diagnostic characteristics of patients that affect outcomes. � Provide accurate information on the usage of different types of prostheses. � Analyse the effectiveness of different prostheses and treatment for specific diagnoses. � Evaluate the effectiveness of the large variety of prostheses currently on the market. �
REGISTRY�REPORTS�The main report produced by the Registry is the Hip and Knee Annual Report, which is published mid-September each year. In addition, there are four supplementary reports that complete the Hip and Knee Annual Report.
These include: � Demographics of Hip and Knee Arthroplasty � Demographics of Shoulder, Elbow, Wrist, Ankle and Spinal Disc Arthroplasty � Lay Summary � Analysis of State and Territory Health Data – All Arthroplasty
All reports are available on the Registry website www.dmac.adelaide.edu.au/aoanjrr/publications.jsp.
STATISTICAL METHODSThe Registry describes the time from primary to first revision of a prosthesis using the Kaplan-Meier estimates of survivorship. The estimates are displayed graphically or in tables as yearly cumulative percentage revisions. The cumulative percentage revision at a certain time, for example five years, is the complement (in probability) of the Kaplan-Meier survivorship function at that time, multiplied by 100. The cumulative percentage revision, generically a ‘cumulative failure rate’, accounts for right censoring due to death and ‘closure’ of the database at the time of analysis.
Confidence intervals for the Kaplan-Meier estimates are point-wise Greenwood estimates. Hazard ratios reported from the proportional hazards model are used when judging statistical significance. For each model the assumption of proportional hazards was checked analytically by testing the significance of the interaction between the predictor and the log of time in the standard Cox model.
DATA VALIDATIONThe Registry validates data collected from hospitals by comparing it to data provided by State and Territory health departments. Validation of Registry data is a sequential multi-level matching process against health department unit record data.
For the 2007/08 Registry data, the initial validation resulted in almost 92% of Registry records verified against health department data. Following the retrieval of unreported records and checking of unmatched data, the Registry is able to obtain an almost complete set of data relating to hip and knee joint replacement in Australia.
ACKNOWLEDGEMENTSThe Registry continues to receive support and invaluable assistance from the Federal Government and State and Territory Health Departments. The Registry acknowledges the continued co-operation and support provided by those undertaking the surgery and completing the data forms, in particular all Orthopaedic Surgeons, Registrars and Nursing staff and continued support of all hospitals both public and private that undertake arthroplasty surgery nationally.

- 2 -
HIP AND KNEE REPLACEMENTThe 2009 Annual Report analysed the outcome of 472,989 hip and knee replacements. The number of hip and knee replacements undertaken each year continues to increase. In 2008 there were 71,169 hip and knee replacements (32,201 hips and 38,968 knees). This is an increase of 7.3% in hip and knee replacements in 2008 compared to 2007 (5.8% for hips and 8.5% for knees).
HIP REPLACEMENT
DIAGNOSIS INDICATING HIP REPLACEMENT
The diagnosis for almost all primary partial hips is fractured neck of femur (93.9%). Osteoarthritis is the major reason for primary conventional total and total resurfacing hip replacement (88.3% and 94.2% respectively). The principal cause for revision hip replacement is aseptic loosening/lysis (56.4%). This however varies depending on the different class of primary hip replacement.�
Revision Diagnosis by Type of Primary Hip Replacement
Revision Diagnosis Monoblock Unipolar Modular Bipolar Total Resurfacing Conventional Total %
Revision %
Primary %
Revision %
Primary %
Revision %
Primary %
Revision %
Primary %
Revision %
Primary Loosening/Lysis 51.1 1.9 19.7 0.5 21.9 0.6 29.3 1.1 29.1 0.8 Prosthesis Dislocation 9.8 0.4 19.3 0.5 17.7 0.5 3.2 0.1 28.9 0.8 Infection 8.9 0.3 17.8 0.5 18.9 0.6 8.9 0.3 16.6 0.5 Fracture 17.7 0.6 18.2 0.5 22.6 0.7 39.4 1.4 14.5 0.4 Pain 7.3 0.3 14.1 0.4 9.4 0.3 5.3 0.2 2.0 0.1 Other 5.2 0.2 10.8 0.3 9.4 0.3 14.0 0.5 9.0 0.2 N Revision 100.0 3.6 100.0 2.7 100.0 2.9 100.0 3.6 100.0 2.8
PRIMARY PARTIAL HIP REPLACEMENTThe Registry has previously identified that revision rates of primary partial hip replacement are affected by a number of factors. These include the class of partial hip replacement, age at time of surgery, method of fixation and the specific prosthesis used. In recent years there has been a significant decrease in the use of unipolar monoblock procedures in Australia (38% reduction between 2004 and 2008). In addition, monoblock procedures are used in a much older patient population than unipolar modular and bipolar procedures. The use of unipolar modular and bipolar procedures continues to be associated with fewer revision procedures compared to unipolar monoblock prostheses. Bipolar procedures are revised less frequently than unipolar modular procedures when individuals are less than 85 years of age. The use of cement fixation reduces the risk of revision by approximately half regardless of the class of partial hip replacement used.
Primary Partial Hip Replacement by Femoral Fixation (Primary Diagnosis Fractured NOF excluding Infection)
CPR N Total 1 Yr 3 Yrs 5 Yrs 7 Yrs 8 Yrs Unipolar Monoblock
Cementless 12572 3.3 (3.0, 3.7) 5.6 (5.1, 6.1) 6.3 (5.7, 6.9) 7.1 (6.3, 8.0) 8.3 (6.5, 10.5) Cemented 5070 1.1 (0.8, 1.4) 2.4 (1.9, 3.1) 4.6 (3.5, 5.9) 4.6 (3.5, 5.9) 4.6 (3.5, 5.9) Total 17642 2.7 (2.4, 3.0) 4.7 (4.3, 5.1) 5.7 (5.2, 6.3) 6.3 (5.7, 7.1) 7.2 (5.9, 8.9)
Unipolar Modular Cementless 2314 2.7 (2.1, 3.6) 4.8 (3.8, 6.3) 7.0 (5.0, 9.7) Cemented 6796 1.1 (0.8, 1.4) 2.7 (2.2, 3.3) 4.3 (3.4, 5.4) 5.8 (4.4, 7.7) 5.8 (4.4, 7.7) Total 9110 1.5 (1.2, 1.8) 3.3 (2.8, 3.8) 4.9 (4.1, 5.9) 6.3 (5.0, 8.1) 6.3 (5.0, 8.1)
Bipolar Cementless 1478 2.8 (2.0, 3.9) 4.0 (3.0, 5.3) 4.6 (3.4, 6.1) Cemented 6527 1.3 (1.0, 1.6) 2.2 (1.8, 2.7) 2.8 (2.3, 3.3) 3.3 (2.6, 4.1) 3.8 (2.7, 5.2) Total 8005 1.6 (1.3, 1.9) 2.5 (2.2, 3.0) 3.1 (2.6, 3.6) 3.6 (2.9, 4.3) 4.0 (3.0, 5.3)
Most primary partial hip prostheses used in unipolar modular and bipolar partial hip replacement perform equally satisfactorily however there are a small number of prostheses or prosthesis combinations that the Registry has identified as having a higher than anticipated rate of revision. The Registry has previously identified one primary unipolar modular hip prosthesis combination, two bipolar hip prostheses combinations and one individual primary bipolar hip prosthesis (refer to 2009 Annual Report). There were no new prostheses identified in 2009.

- 3 -
PRIMARY TOTAL HIP REPLACEMENTPrimary conventional total hip is undertaken more often than primary total resurfacing hip replacement (92.3% compared to 7.6% of all primary total hip replacements). The use of primary conventional total hip replacement continues to increase, not only in absolute numbers but also as a proportion of all primary total hip procedures.�
PRIMARY DIAGNOSIS
Primary diagnosis influences the outcome of primary total hip replacement. The outcomes of the five most common diagnoses were compared using osteoarthritis (OA) as the comparator diagnosis. Fractured neck of femur, avascular necrosis (AVN) and rheumatoid arthritis all have a significantly higher risk of revision compared to those undertaken for OA. DDH had a significantly higher risk of revision in the first three months following surgery compared to OA but there is no difference after this period. Three different diagnoses were compared for primary total resurfacing hip replacement. DDH had a significantly higher risk of revision compared to resurfacing procedures undertaken for OA. There was no difference in the risk of revision between AVN and OA. The five year cumulative percent revision for DDH is almost three times less when using a conventional total hip compared to a total resurfacing hip replacement (4.2% compared to 12.0%).
Primary Conventional Total Hip Replacement Primary Total Resurfacing Hip Replacement
BEARING SURFACE IN PRIMARY CONVENTIONAL TOTAL HIP REPLACEMENTThere is a complex interaction of factors impacting on the outcome of this analysis so it should be interpreted with caution. One of these factors is head size. Without taking head size into consideration, metal-on-metal bearing surface has a higher revision rate than other bearing surfaces. Metal-on-polyethylene has a significantly lower risk of revision compared to all other bearing surfaces however when compared to ceramic-on-ceramic it is only significant for the first one and a half years following the initial surgery. For each of the bearing surfaces larger head size (with the exception of metal-on-metal) is associated with a lower risk of revision than the smaller head size for that bearing surface in the first eight years. With metal-on-metal larger head size is associated with a higher risk of revision. The reasons for revision vary depending on the type of bearing surface.
Bearing Surface (OA Only excluding Infection) Revision Diagnosis (OA only excluding Infection)
Revision Diagnosis CoC CoP MoM MoP
% % % %Loosening/Lysis 29.0 35.5 47.9 35.6 Prosthesis Dislocation 25.7 35.8 18.2 39.3 Fracture 19.5 17.4 15.7 17.3 Implant Breakage Acetabular 5.2 1.2 0.5 0.3 Metal Sensitivity 0.3 0.2 6.2 0.1 Pain 4.0 2.8 3.5 1.6 Leg Length Discrepancy 2.1 1.6 3.0 1.4 Malposition 3.1 0.5 1.0 1.0 Implant Breakage Head 2.6 0.2 0.0 0.0 Other 8.3 4.7 4.0 3.5
Cumulative�Pe
rcen
t�Rev
ision
���0%
���2%
���4%
���6%
���8%
��10%
��12%
��14%
��16%
Years�Since�Primary�Procedure
0.0 1.0 2.0 3.0 4.0 5.0 6.0 7.0 8.0
Avascular�NecrosisFractured�Neck�Of�FemurOsteoarthritisRheumatoid�Arthritis
Cumulative�Pe
rcen
t�Rev
ision
���0%
���2%
���4%
���6%
���8%
��10%
��12%
��14%
�16%
Years�Since�Primary�Procedure
0.0 1.0 2.0 3.0 4.0 5.0 6.0 7.0 8.0
Avascular�NecrosisDevelopmental�DysplasiaOsteoarthritis
Cumulative�Pe
rcen
t�Rev
ision
���0%
���1%
���2%
���3%
���4%
���5%
���6%
���7%
Years�Since�Primary�Procedure
0.0 1.0 2.0 3.0 4.0 5.0 6.0 7.0 8.0
Ceramic/CeramicCeramic/PolyethyleneMetal/MetalMetal/Polyethylene

- 4 -
FACTORS AFFECTING THE OUTCOME OF PRIMARY RESURFACING TOTAL HIP REPLACEMENTThe use of primary total resurfacing hip replacement has declined for the third year in a row. Analysis to establish factors affecting outcome other than primary diagnosis has identified gender, age and type of prosthesis as having an effect. Females have a significantly higher rate of revision compared to males and the risk of revision increases with age. The difference in outcome related to gender is largely due to the size of the femoral component. There is no significant difference between gender in the risk of revision after adjusting for femoral component head size. Males and females with femoral component head size less than 50mm have a similar cumulative percent revision at seven years (8.4% and 9.5% respectively) and males and females with head sizes 50mm or greater also have a similar five year cumulative percent revision (2.3% and 2.0% respectively). �Femoral Head Size (OA only excluding Infection) Gender & Femoral Head Size (OA only excl. Infection)
PROSTHESES AFFECTING OUTCOME OF PRIMARY TOTAL HIP REPLACEMENT
Most primary total hip prostheses used in conventional total and resurfacing total hip replacement perform equally satisfactorily however there are a small number of prostheses or prosthesis combinations that the Registry has identified as having a higher than anticipated rate of revision. The Registry has previously identified four conventional total hip prosthesis combinations, 12 individual conventional total hip prostheses and three resurfacing total hip systems (refer2009 Annual Report).
In 2009 the Registry newly identified eight conventional total hip prostheses combinations and one conventional total hip prosthesis with significantly higher rates of revision when compared to all other conventional total hip replacements. These were the Alloclassic/Durom, Charnley/Duraloc, CLS/Trilogy, Edinburgh/Icon, Esop/Atlas, ML Taper/Fitmore, Secur-Fit Plus/Secur Fit, Quadra-H/Versafit and ASR acetabular component. There was one new resurfacing total hip prostheses combination with a significantly higher rate of revision when compared to all other resurfacing total hip replacements. This was the Recap/Recap resurfacing total hip system.�
Newly identified prostheses with a higher than anticipated Revision Rate
CPR 1 Yr 3 Yrs 5 Yrs 7 Yrs
CONVENTIONAL TOTAL Alloclassic/Durom 1.4 (0.7, 2.9) 5.4 (3.4, 8.5) Charnley/Duraloc 0.6 (0.1, 3.9) 2.9 (1.2, 6.7) 8.9 (5.4, 14.6) 12.3 (7.6, 19.5) CLS/Trilogy 3.4 (1.4, 8.0) 5.8 (2.9, 11.4) Edinburgh/Icon 9.4 (3.6, 23.2) Esop/Atlas 3.2 (1.3, 7.5) 4.2 (1.9, 9.3) ML Taper/Fitmore 4.5 (1.9, 10.5) Secur-Fit Plus/Secur-Fit 3.1 (1.4, 6.7) 7.3 (4.4, 12.0) 8.0 (4.9, 12.9) Quadra-H/Versafit 4.9 (2.5, 9.4) ASR acetabular Component 1.8 (1.4, 2.3) 5.4 (4.4, 6.6)
TOTAL RESURFACING
Recap/Recap 5.0 (2.3, 10.8)
Cumulative�Pe
rcen
t�Rev
ision
���0%
���2%
���4%
���6%
���8%
��10%
��12%
��14%
Years�Since�Primary�Procedure
0.0 1.0 2.0 3.0 4.0 5.0 6.0 7.0 8.0
�44mm45�49mm50�54mm�55mm
Cumulative�Pe
rcen
t�Rev
ision
���0%
���2%
���4%
���6%
���8%
��10%
��12%
�14%
Years�Since�Primary�Procedure
0.0 1.0 2.0 3.0 4.0 5.0 6.0 7.0 8.0
Male�<50mmMale�50mmFemale�<50mmFemale�50mm

- 5 -
REVISION HIP REPLACEMENTThe Registry defines hip revisions as major or minor revisions. This is a reference to the extent of surgery and not the relative risk. A major revision involves the removal and/or replacement of one or more components used in the primary procedure that are fixed to bone either by cement or bone ingrowth. Minor revisions are all other revision procedures which involve removal and/or exchange of one or more of the components used in the primary procedure. �
REVISION OF KNOWN PRIMARY CONVENTIONAL TOTAL HIP REPLACEMENT (EXCLUDING INFECTION)The first revision of a primary conventional total hip replacement is dependent on the type of the first revision performed. Minor revisions have a greater risk of subsequent revision compared to major partial and major total revisions. At three years the cumulative percent revision of a minor revision is 17.9%, a major partial is 12.8% and a major total revision is 9.2%. Minor revision has a significantly higher rate of re-revision compared to major revision. The difference between major partial and major total is not statistically significant.����
Known Primary Conventional Total Hip Replacement (excluding infection from revision of primary)
REVISION OF KNOWN PRIMARY TOTAL RESURFACING HIP REPLACEMENT (EXCLUDING INFECTION)Most resurfacing prostheses are a combination of a solid metal acetabular component and a one piece femoral component so the only possible type of revision is a major revision. These major revisions may either be partial or total. Major partial revisions may be either a femoral only or an acetabular only revision. Acetabular only revision for primary total resurfacing procedures has a higher rate of re-revision compared to femoral only revision and femoral and acetabular revision (cumulative percentage revision of 20.1%, 7.0% and 5.3% at five years respectively). This difference however is only significantly higher for acetabular only compared to femoral only revision. �Known Primary Total Resurfacing Hip Replacement (excluding infection from revision of primary)
Cumulative�Pe
rcen
t�Rev
ision
���0%
���2%
���4%
���6%
���8%
��10%
��12%
��14%
��16%
��18%
��20%
��22%
��24%
Years�Since�Revision�Procedure
0.0 1.0 2.0 3.0 4.0 5.0 6.0 7.0 8.0
MinorMajor�PartialMajor�Total
Cumulative�Pe
rcen
t�Rev
ision
���0%
���2%
���4%
���6%
���8%
��10%
��12%
��14%
��16%
��18%
��20%
��22%
��24%
Years�Since�Revision�Procedure
0.0 1.0 2.0 3.0 4.0 5.0 6.0 7.0 8.0
Acetabular�OnlyFemoral�OnlyFemoral/Acetabular

- 6 -
KNEE REPLACEMENT
DIAGNOSIS INDICATING KNEE REPLACEMENTThe diagnosis for the majority of primary knee replacement is osteoarthritis (partial resurfacing 89.4%, unispacer 100%, patella/trochlear 98.7%, unicompartmental 98.8%, bicompartmental 98.9% and primary total 97.0%). The principal cause for revision knee replacement is loosening (43.5%). As with hip replacement this varies depending on the class of primary knee replacement.
Revision Diagnosis by Type of Primary Knee Replacement
Revision Diagnosis Patella/Trochlear Unicompartmental Total Knee
% Revision % Primary % Revision % Primary % Revision % Primary Loosening/Lysis 22.0 2.2 50.6 3.6 32.2 0.9 Infection 2.3 0.2 4.6 0.3 22.3 0.6 Patello Femoral Pain 6.1 0.6 0.7 0.0 13.1 0.4 Pain 13.6 1.4 12.4 0.9 9.3 0.3 Progression Of Disease 28.8 2.9 17.3 1.2 0.6 0.0 Instability 0.8 0.1 0.8 0.1 5.3 0.1 Arthrofibrosis . . 0.4 0.0 4.2 0.1 Other 26.5 2.7 13.2 0.9 13.0 0.4 N Revision 100.0 10.2 100.0 7.1 100.0 2.7
PARTIAL KNEE REPLACEMENTThe Registry identifies five classes of partial knee replacement, they are partial resurfacing, unispacer, patella/trochlear, unicompartmental and bicompartmental knee replacement. Two of these (partial resurfacing and bicompartmental knee replacement) are relatively recent technologies introduced to the Australian market and reported for the first time last year. Early outcomes for both of these new single product procedures had a higher rate of revision than other knee replacements with the exception of the unispacer.
Primary Partial Knee Replacement
CPR N Total 1 Yr 3 Yrs 5 Yrs 7 Yrs 8 Yrs
Partial Resurfacing 113 7.0 (3.4, 14.1) 16.8 (10.2, 27.1) Unispacer 39 43.6 (29.8, 60.4) 66.7 (52.0, 80.7) 66.7 (52.0, 80.7) Patella/Trochlear 1292 2.7 (1.9, 3.8) 9.3 (7.5, 11.3) 15.3 (12.7, 18.3) 23.0 (18.4, 28.5) 24.3 (19.2, 30.4) Unicompartmental 28822 2.2 (2.1, 2.4) 6.2 (5.9, 6.5) 8.8 (8.4, 9.2) 11.9 (11.3, 12.5) 13.2 (12.4, 14.1) Bicompartmental 90 7.0 (3.0, 16.3)
The use of unicompartmental knee replacement continues to decline with 18% less unicompartmental knee replacements undertaken in 2008 compared to 2005. Age at the time of surgery is a major factor affecting the outcome, the younger the patient the greater the risk of revision.
Primary Unicompartmental Knee Replacement by Age
CPR 1 Yr 3 Yrs 5 Yrs 7 Yrs 8 Yrs
<55 3.3 (2.8, 4.0) 10.3 (9.3, 11.4) 14.0 (12.7, 15.3) 17.7 (15.9, 19.7) 18.0 (16.1, 20.0) 55-64 2.4 (2.1, 2.8) 6.7 (6.2, 7.3) 9.9 (9.1, 10.6) 13.8 (12.7, 15.1) 15.9 (14.1, 17.9) 65-74 1.8 (1.5, 2.1) 5.2 (4.7, 5.8) 7.6 (7.0, 8.3) 10.3 (9.4, 11.4) 11.6 (10.2, 13.1) �75 1.8 (1.5, 2.2) 4.0 (3.5, 4.6) 5.5 (4.9, 6.3) 7.1 (6.1, 8.2) 8.3 (6.7, 10.2)
As with other classes of joint replacement the outcome of patella/trochlear and unicompartmental knee replacement varies depending on the type of prosthesis used. The Registry has previously identified four unicompartmental knee prostheses with a higher than anticipated rate of revision compared to other unicompartmental prostheses. These included Advance/Advance, AMC/AMC and Balansys/Balansys Uni Mobile and Preservation-Mobile unicompartmental knee prostheses with 29.2%, 11.9%, 14.6% and 15.9% cumulative percentage revision at three years respectively. The Registry has previously identified one patella/trochlear knee prosthesis with a higher than anticipated rate of revision compared to other patella/trochlear prostheses. This was the LCS with a five year cumulative percentage revision of 21.8%. No new prostheses were identified in 2009.

- 7 -
TOTAL KNEE REPLACEMENTThe outcome of primary total knee replacement is related to age as well as a number of other factors including gender, bearing mobility and stability of the prosthesis and patella resurfacing at the primary procedure. The method of fixation does not appear to affect the outcome of primary total knee replacement. Mobile inserts have a significantly higher risk of revision compared to fixed bearing inserts (Adj HR=1.23; 95%CI (1.16, 1.30) p<0.001). Posterior stabilised prostheses have a significantly higher risk of revision compared to minimally stabilised prostheses (Adj HR=1.20; 95%CI (1.13, 1.28) p<0.001). �
Bearing Mobility (OA Only) Stability (OA Only)
Non-resurfaced patella procedures have a significantly higher risk of revision compared to resurfaced patella procedures (Adj HR=1.32; 95%CI (1.25, 1.40) p<0.001). This higher risk is only specific to certain prostheses. There are prostheses that have the same risk of revision regardless of whether a patella prosthesis was used in the primary. For example the Duracon primary total knee has the same 8 year cumulative percentage revision of 4% for a resurfaced and non-resurfaced patella. The Registry refers to these prostheses as patella-friendly. However some prostheses have a better outcome when the patella is resurfaced, and others have a better outcome when the patella is not resurfaced.
Patella Resurfacing (OA Only)
PROSTHESES AFFECTING OUTCOME OF PRIMARY TOTAL KNEE REPLACEMENTThe Registry has previously identified 15 total knee combinations with a higher than anticipated revision rate compared to all other total knee replacements (refer 2009 Annual Report). In 2009 four new total knee prostheses combinations were identified.
Newly identified prostheses with a higher than anticipated Revision Rate
CPR 1 Yr 3 Yrs 5 Yrs 7 Yrs Journey/Journey 2.7 (1.6, 4.4) Columbus/Columbus 3.4 (1.8, 6.3) 5.9 (3.4, 10.2) Eska RP/Eska RP 7.9 (2.6, 22.5) 16.5 (6.6, 37.7) Optetrak-PS/Optetrak-PS 1.8 (0.3, 12.2) 16.2 (8.4, 30.1)
Cumulative�Pe
rcen
t�Rev
ision
���0%
���2%
���4%
���6%
���8%
��10%
��12%
Years�Since�Primary�Procedure
0.0 1.0 2.0 3.0 4.0 5.0 6.0 7.0 8.0
Fixed������������������������������������Mobile�����������������������������������
Cumulative�Pe
rcen
t�Rev
ision
���0%
���2%
���4%
���6%
���8%
��10%
�12%
Years�Since�Primary�Procedure
0.0 1.0 2.0 3.0 4.0 5.0 6.0 7.0 8.0
Minimal����������������������������������Posterior�Stabilised���������������������
Cumulative�Pe
rcen
t�Rev
ision
���0%
���2%
���4%
���6%
���8%
��10%
��12%
Years�Since�Primary�Procedure
0.0 1.0 2.0 3.0 4.0 5.0 6.0 7.0 8.0
No�Patella�������������������������������Patella�Used�����������������������������
- 8 -
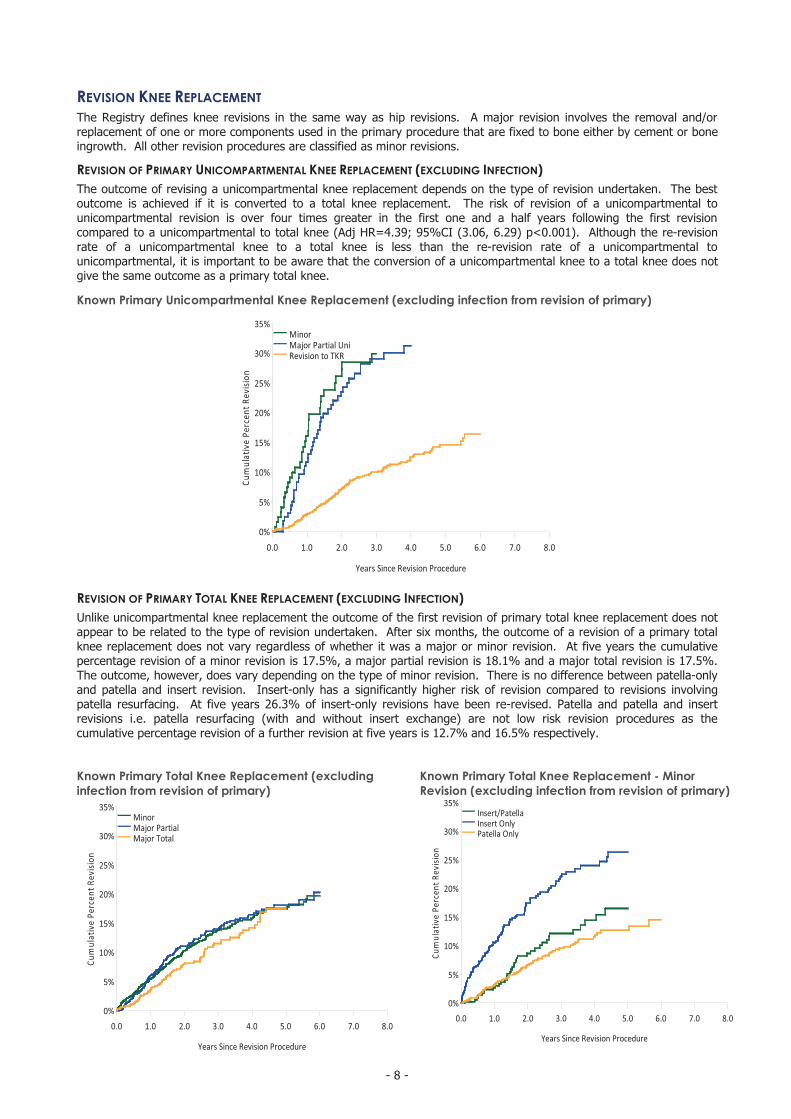
REVISION KNEE REPLACEMENTThe Registry defines knee revisions in the same way as hip revisions. A major revision involves the removal and/or replacement of one or more components used in the primary procedure that are fixed to bone either by cement or bone ingrowth. All other revision procedures are classified as minor revisions.
REVISION OF PRIMARY UNICOMPARTMENTAL KNEE REPLACEMENT (EXCLUDING INFECTION)The outcome of revising a unicompartmental knee replacement depends on the type of revision undertaken. The best outcome is achieved if it is converted to a total knee replacement. The risk of revision of a unicompartmental to unicompartmental revision is over four times greater in the first one and a half years following the first revision compared to a unicompartmental to total knee (Adj HR=4.39; 95%CI (3.06, 6.29) p<0.001). Although the re-revision rate of a unicompartmental knee to a total knee is less than the re-revision rate of a unicompartmental to unicompartmental, it is important to be aware that the conversion of a unicompartmental knee to a total knee does not give the same outcome as a primary total knee. �
Known Primary Unicompartmental Knee Replacement (excluding infection from revision of primary)
REVISION OF PRIMARY TOTAL KNEE REPLACEMENT (EXCLUDING INFECTION)Unlike unicompartmental knee replacement the outcome of the first revision of primary total knee replacement does not appear to be related to the type of revision undertaken. After six months, the outcome of a revision of a primary total knee replacement does not vary regardless of whether it was a major or minor revision. At five years the cumulative percentage revision of a minor revision is 17.5%, a major partial revision is 18.1% and a major total revision is 17.5%. The outcome, however, does vary depending on the type of minor revision. There is no difference between patella-only and patella and insert revision. Insert-only has a significantly higher risk of revision compared to revisions involving patella resurfacing. At five years 26.3% of insert-only revisions have been re-revised. Patella and patella and insert revisions i.e. patella resurfacing (with and without insert exchange) are not low risk revision procedures as the cumulative percentage revision of a further revision at five years is 12.7% and 16.5% respectively.
Known Primary Total Knee Replacement (excludinginfection from revision of primary)
Known Primary Total Knee Replacement - Minor Revision (excluding infection from revision of primary)
Cumulative�Pe
rcen
t�Rev
ision
���0%
���5%
��10%
��15%
��20%
��25%
��30%
��35%
Years�Since�Revision�Procedure
0.0 1.0 2.0 3.0 4.0 5.0 6.0 7.0 8.0
MinorMajor�Partial�UniRevision�to�TKR
Cumulative�Pe
rcen
t�Rev
ision
���0%
���5%
��10%
��15%
��20%
��25%
��30%
��35%
Years�Since�Revision�Procedure
0.0 1.0 2.0 3.0 4.0 5.0 6.0 7.0 8.0
MinorMajor�PartialMajor�Total
Cumulative�Pe
rcen
t�Rev
ision
���0%
���5%
��10%
��15%
��20%
��25%
��30%
�35%
Years�Since�Revision�Procedure
0.0 1.0 2.0 3.0 4.0 5.0 6.0 7.0 8.0
Insert/PatellaInsert�OnlyPatella�Only


![Current Trends in Knee Arthroplasty · Current Trends in Knee Arthroplasty ... Pain is one of the major problem for patients underwent Total Knee Arthroplasty [TKA]; appropriate pain](https://img.dokumen.tips/doc/110x75/5afbb9d07f8b9abd588ff30e/current-trends-in-knee-trends-in-knee-arthroplasty-pain-is-one-of-the-major.jpg)