Embed Size (px)
Citation preview

Hindustan Unilever
“Levers” in place for demand recovery; ‘Accumulate’
July 21, 2015
Prabhudas Lilladher Pvt. Ltd. and/or its associates (the 'Firm') does and/or seeks to do business with companies covered in its research reports. As a result investors should be aware that the Firm may have a conflict of interest that could affect the objectivity of the report. Investors should consider this report as only a single factor in making their investment decision.
Please refer to important disclosures and disclaimers at the end of the report
Q1FY16 Result Update
Amnish Aggarwal [email protected] +91‐22‐66322233
Gaurav Jogani [email protected] +91‐22‐66322238
Rating Accumulate
Price Rs891
Target Price Rs879
Implied Upside ‐1.3%
Sensex 28,182
Nifty 8,529
(Prices as on July 21, 2015)
Trading data
Market Cap. (Rs bn) 1,927.4
Shares o/s (m) 2,162.5
3M Avg. Daily value (Rs m) 2570
Major shareholders
Promoters 67.22%
Foreign 14.56%
Domestic Inst. 4.18%
Public & Other 14.04%
Stock Performance
(%) 1M 6M 12M
Absolute 3.9 (5.4) 42.0
Relative 0.7 (2.9) 32.4
How we differ from Consensus
EPS (Rs) PL Cons. % Diff.
2016 19.6 21.5 ‐9.1
2017 23.3 24.7 ‐5.7
Price Performance (RIC: HLL.BO, BB: HUVR IN)
Source: Bloomberg
0
200
400
600
800
1,000
1,200
Jul‐14
Sep‐14
Nov‐14
Jan‐15
Mar‐15
May‐15
Jul‐15
(Rs)
HUVR posted 6% volume growth and 17.3% EBITDA growth in a scenario of benign
commodity costs, slowing rural demand and heightened competition from
unorganised players, which shows the success of management strategy to sustain
share and achieve volume‐led growth. After the success of FAL and Axe, HUVR is
looking at reigniting growth in Wheel and Oral care. We believe that HUVR will
gain from uptick in demand in the next cycle, given that it has invested ahead of its
competitors on 1) product innovations 2) marketing and distribution revamp 3)
development of future growth segments and 4) aggressive pricing and marketing
strategy in low demand low input cost scenario. We are reducing our estimates by
~5% to factor in higher price deflation in S&D and 20% decline in financial other
income. We remain positive, given strong growth strategy, high dividend payout of
75%, and ROE and ROCE exceeding 100% and 140%. Retain “Accumulate”.
Concall Takeaways: 1) HUVR had an impact of 170bps on sales, 65bps on EBIT
due to phasing out of tax benefits 2) S&D segment has seen price deflation;
HUVR has done another 2% price reductions to pass on input cost gains 3) Rural
and Urban demand growth has converged; rural recovery depends upon
multiple factors including monsoons 4) After the success of market intervention
success in Axe and FAL, HUVR is undertaking steps to revive growth in oral care
and Wheel detergent 5) Volume growth and sustaining market share is the key
focus of HUVR in the current scenario, given that it had lost share in 2009
commodity price deflation.
Adj.PAT up 3.2% lowers other income and higher tax: Q1 net sales increased by
5% (7% without 170bps excise impact) on 6% volume growth (6% in Q4). Gross
profit grew 12.8% as margins expanded by 360bps on benign input costs;
EBITDA margins expanded by 200bps as 200bps higher adpro neutralised gains.
46.3% decline in financial other income and 380bps higher tax resulted in 3.2%
growth in adjusted PAT at Rs10.5bn.
Key financials (Y/e March) 2014 2015 2016E 2017E
Revenues (Rs m) 280,191 307,341 335,663 386,644
Growth (%) 8.6 9.7 9.2 15.2
EBITDA (Rs m) 44,753 51,043 60,046 70,545
PAT (Rs m) 35,553 37,946 42,315 50,475
EPS (Rs) 16.4 17.5 19.6 23.3
Growth (%) 7.3 6.7 11.5 19.3
Net DPS (Rs) 13.0 15.0 15.5 17.5
Profitability & Valuation 2014 2015 2016E 2017E
EBITDA margin (%) 16.0 16.6 17.9 18.2
RoE (%) 119.5 108.4 110.8 121.4
RoCE (%) 87.1 92.2 95.0 94.9
EV / sales (x) 6.7 6.2 5.6 4.8
EV / EBITDA (x) 42.0 37.3 31.2 26.5
PE (x) 54.2 50.8 45.6 38.2
P / BV (x) 58.8 51.8 49.3 43.8
Net dividend yield (%) 1.5 1.7 1.7 2.0
Source: Company Data; PL Research

July 21, 2015 2
Hindustan Unilever
Exhibit 1: Q1FY16 Results (Rs m): EBITDA up 17.3%, Adj. PAT up 3.2% impacted by lower other income and higher tax rate
Y/e March Q1FY16 Q1FY15 YoY gr. (%) Q4FY15 FY16 FY15 YoY gr. (%)
Net Sales* 81,051 77,163 5.0 76,041 342,649 308,056 11.2
Gross Profit 42,031 37,267 12.8 37,772 173,318 151,821 14.2
% of NS 51.9 48.3 49.67 50.6 49.3
Advertising & Prom Exp. 11,534 9,449 22.1 10,279 43,859 38,749 13.2
% of NS 14.2 12.2 13.5 12.8 12.6
Total Expenses 65,987 64,322 2.6 63,575 280,303 255,974 9.5
EBITDA 15,064 12,841 17.3 12,467 62,347 52,082 19.7
Margins (%) 18.6 16.6 1.9 16.4 18.2 16.9
Depreciation 749 667 12.3 705 3,060 2,867 6.7
EBIT 14,315 12,174 17.6 11,762 59,286 49,216 20.5
Interest 1 63 (98.9) ‐ 168 168 ‐
Other Income 1,086 2,021 (46.3) 984 5,784 6,184 (6.5)
PBT 15,400 14,132 9.0 12,746 64,902 55,231 17.5
Tax 4,873 3,936 23.8 4,119 20,379 17,285 17.9
Effective tax rate (%) 31.6 27.8 32.3 31.4 31.3
Adjusted PAT 10,528 10,197 3.2 8,626 44,523 37,946 17.3
Extraordinary (64) 372 117.1 1,555 ‐ 5,207 (100.0)
Reported Profit 10,464 10,569 (1.0) 10,181 44,523 43,153 3.2
Source: Company Data, PL Research* (Net sales for Q4FY15 have been adjusted for excise gains)
HUVR is sustaining innovation and renovation of the portfolio

July 21, 2015 3
Hindustan Unilever
Exhibit 2: FMCG sales grew by 9%
7.1
9.9 10.0 9.0
13.4
10.4
8.0 9.0
5.0
0.0
2.0
4.0
6.0
8.0
10.0
12.0
14.0
16.0
Q1FY14
Q2FY14
Q3FY14
Q4FY14
Q1FY15
Q2FY15
Q3FY15
Q4FY15
Q1FY16
(%)
Source: Company Data, PL Research
Exhibit 3: Volumes up 6% for 2nd consecutive quarter
4.0 3.0
4.0
3.0
6.0
5.0
3.0
6.0 6.0
0.0
1.0
2.0
3.0
4.0
5.0
6.0
7.0
Q1FY14
Q2FY14
Q3FY14
Q4FY14
Q1FY15
Q2FY15
Q3FY15
Q4FY15
Q1FY16
(%)
Source: Company Data, PL Research
Exhibit 4: Ad spend up 22.1%, up 200 bps YoY
13.1
13.8
12.9
11.8 12.2 12.1
12.6
13.5
14.2
10.0 10.5 11.0 11.5 12.0 12.5 13.0 13.5 14.0 14.5
Q1FY14
Q2FY14
Q3FY14
Q4FY14
Q1FY15
Q2FY15
Q3FY15
Q4FY15
Q1FY16
(%)
Source: Company Data, PL Research
Exhibit 5: Gross margin up 360bps; EBITDA margins up 200bps
48.9
48.3
51.9
15.9
16.6
18.6
12.0 13.0 14.0 15.0 16.0 17.0 18.0 19.0
42.0
44.0
46.0
48.0
50.0
52.0
54.0
Q1FY14
Q2FY14
Q3FY14
Q4FY14
Q1FY15
Q2FY15
Q3FY15
Q4FY15
Q1FY16
Gross Margins (%) EBITDA Margins (%) (RHS)
Source: Company Data, PL Research

July 21, 2015 4
Hindustan Unilever
Exhibit 6: Segmental Performance; Personal care continues to outperform EBIT up 19.5%, S&D sales up 0.2% due to price deflation
Quarterly Segmental 2QFY14 3QFY14 4QFY14 1QFY15 2QFY15 3QFY15 4QFY15 1QFY16
Net Sales (Rs m)
Soaps and Detergents 33,808 33,979 34,971 38,476 37,551 36,002 36,737 38,544
Personal Products 19,503 23,039 19,833 21,596 21,427 24,546 22,497 24,056
Beverages 8,354 8,500 8,690 8,366 8,991 9,197 9,762 9,149
Processed Foods 3,980 3,728 4,197 5,438 4,513 4,199 4,768 6,079
Others 3,049 2,766 2,958 3,029 3,618 3,535 2,947 3,125
Sales Growth %
Soaps and Detergents 6.4 7.1 9.6 12.9 11.1 6.0 5.0 0.2
Personal Products 11.8 12.4 8.3 14.7 9.9 6.5 13.4 11.4
Beverages 16.1 7.2 7.5 10.5 7.6 8.2 12.3 9.4
Processed Foods 8.7 12.9 12.7 18.8 13.4 12.6 13.6 11.8
Others 5.7 (4.7) 18.2 8.5 18.7 27.8 (0.4) 3.2
EBIT (Rs m) 10,784 12,205 10,785 13,083 12,207 12,993 13,120 15,043
Soaps and Detergents 4,739 4,509 4,217 5,318 5,112 5,024 4,883 5,980
Personal Products 4,449 6,592 4,958 5,967 5,223 6,809 6,245 7,130
Beverages 1,417 1,373 1,630 1,363 1,557 1,410 1,816 1,435
Processed Foods 133 (134) 230 591 200 (213) 254 544
Others 46 (135) (251) (155) 116 (38) (78) (46)
EBIT Growth %
Soaps and Detergents 4.5 14.5 10.1 21.1 7.9 11.4 15.8 12.4
Personal Products 5.3 13.9 5.1 27.4 17.4 3.3 26.0 19.5
Beverages 37.5 (2.2) 19.7 (1.8) 9.9 2.7 11.4 5.3
Processed Foods 1,378.9 (409.5) 64.4 53.8 50.1 58.7 10.6 (7.9)
Others 125.4 27.6 (38.6) (401.6) 150.4 (72.1) (68.7) 70.5
EBIT Margin %
Soaps and Detergents 14.0 13.3 12.1 13.8 13.6 14.0 13.3 15.5
Personal Products 22.8 28.6 25.0 27.6 24.4 27.7 27.8 29.6
Beverages 17.0 16.2 18.8 16.3 17.3 15.3 18.6 15.7
Processed Foods 3.3 (3.6) 5.5 10.9 4.4 (5.1) 5.3 8.9
Source: Company Data, PL Research

July 21, 2015 5
Hindustan Unilever
Exhibit 7: Brent Crude Oil has seen rebound from lows
112 103
110 109 109 108 108
76
57.0 61.0
0
20
40
60
80
100
120
4QFY13
1QFY14
2QFY14
3QFY14
4QFY14
1QFY15
2QFY15
3QFY15
4QFY15
1QFY16
(US$
/ bbl)
Source: Company Data, PL Research
Exhibit 8: PFAD: prices continue to remain benign
561 612 645
712 790 823
727
618
723.0 652.0
0 100 200 300 400 500 600 700 800 900
4QFY13
1QFY14
2QFY14
3QFY14
4QFY14
1QFY15
2QFY15
3QFY15
4QFY15
1QFY16
(US$ / Tonne)
Source: Company Data, PL Research
Exhibit 9: Rupee has weakened in Q1 to 63.8
54.2 56.0
62.1 62.0 61.8 59.8 60
62 62.2 63.8
48.0 50.0 52.0 54.0 56.0 58.0 60.0 62.0 64.0 66.0
4QFY13
1QFY14
2QFY14
3QFY14
4QFY14
1QFY15
2QFY15
3QFY15
4QFY15
1QFY16
Source: Company Data, PL Research
Exhibit 10: LAB prices have seen rebound with crude prices
82.1
112.1
116.1
119.1
138.1
126.1
89.1
100.1
60.0
70.0
80.0
90.0
100.0
110.0
120.0
130.0
140.0
Jun‐09
Sep‐09
Dec‐09
Mar‐10
Jun‐10
Sep‐10
Dec‐10
Mar‐11
Jun‐11
Sep‐11
Dec‐11
Mar‐12
Jun‐12
Sep‐12
Dec‐12
Mar‐13
Jun‐13
Sep‐13
Dec‐13
Mar‐14
Jun‐14
Sep‐14
Dec‐14
Mar‐15
(Rs/Kg)
Source :PL Research
S&D: Sales growth impacted by price deflation
Soaps and Detergent sales increased by 0.2% driven by volumes, as price deflation
impacted growth. EBIT increased 15% as margins expanded by 170bps YoY to 15.5%.
HUVR has implemented a further price correction in S&D portfolio to pass on input
cost reduction benefits to consumers. Benefits of price reduction have been limited
due to 1) rural growth slowing down and 2) higher competition from unorganised
players in commodity deflation scenario. However, HUVR is well placed unlike FY09‐
10 when it lost share big time to small and regional players.
HUVR is taking steps to resolve brand‐related issues in Wheel even as rest of the
laundry portfolio is doing well. Handwash and Body wash did well, but mass segment
in skin cleansing led by Lifebuoy and Lux showed signs of slowing down.

July 21, 2015 6
Hindustan Unilever
Exhibit 11: Soap and Detergent sales up 0.2%; margins 170bps
12.9
14.0 13.3
12.1
13.8 13.6 14.0 13.3
15.5
7.7
6.4 7.1 9.6
12.9 11.1
6.0 5.0
0.2
0.0 2.0 4.0 6.0 8.0 10.0 12.0 14.0
5.0
7.0
9.0
11.0
13.0
15.0
17.0
Q1FY14
Q2FY14
Q3FY14
Q4FY14
Q1FY15
Q2FY15
Q3FY15
Q4FY15
Q1FY16
EBIT Margin (%) (RHS) Sales Growth (%) (RHS)
Source: Company Data, PL Research
Exhibit 12: PFAD prices down 21.9% YoY, down 2.4% QoQ
22.1
‐13.5
‐27.5
‐35.0
‐9.4
19.4
54.3
37.9
4.6
‐18.1
‐18.9
‐21.9
‐16.0
‐16.3
‐18.5
13.3
17.2
10.3
5.3
1.3
‐11.1
‐13.6
4.3 ‐2.4
‐40.0
‐20.0
0.0
20.0
40.0
60.0
Sep‐12
Dec‐12
Mar‐13
Jun‐13
Sep‐13
Dec‐13
Mar‐14
Jun‐14
Sep‐14
Dec‐14
Mar‐15
Jun‐15
(%)
YoY QoQ
Source: Bloomberg, PL Research
Personal care: sales up 11.4%; all segments on track
Personal care sales grew 11.4%, EBIT increased by 19.5% as margins expanded by
200bps to 29.6%. Phasing out of excise benefits impacted sales by 300bps.
Skin care witnessed volume growth across key brands like FAL, Lakme, Ponds and
Vaseline. Newly launched BB cream under FAL has been a success. Lakme continued
to perform well on the back on innovations, Perfect Radiance and CC Cream.
Hair care maintained its strong volume led growth as key brands like Dove, Clinic
Plus, Sunsilk and Tresemme sustained strong growth.
Oral care started showing the impact of measures undertaken to boost growth.
Close up grew in double digits. Clove & Salt variant under Pepsodent brand has been
rolled out nationally after good initial response.
HUVR remains positive on long term growth prospects, given strength of its brands
in skin, hair and colour cosmetics. HUVR has been able to reignite growth in FAL and
Deodorants, while the course correction in Oral care is underway. HUVR expects new
segments like hair conditioners, deo, premium skin and color cosmetics to drive long
term growth. We expect growth rates to pick up once the demand recovery and
discretionary spends pick up from current levels.

July 21, 2015 7
Hindustan Unilever
Exhibit 13: Personal care: Pick up in FAL and Hair care positive
2.0
11.8
12.4
8.3
14.7
9.9
6.5
13.4
11.4
24.9 22.8
28.6 25.0
27.6 24.4
27.7 27.8 29.6
0.0
5.0
10.0
15.0
20.0
25.0
30.0
35.0
0.0
2.0
4.0
6.0
8.0
10.0
12.0
14.0
16.0
Q1FY14
Q2FY14
Q3FY14
Q4FY14
Q1FY15
Q2FY15
Q3FY15
Q4FY15
Q1FY16
Sales Growth (%) EBIT Margin (%) (RHS)
Source: Company Data, PL Research
Processed foods EBIT growth decline 7.9%, Beverages up 5.3%
Beverages reported 9.4% sales growth, while EBIT expanded by 5.3% to Rs1.4bn
even as margins declined by 60bps. Tea delivered volume‐led double digits growth;
Bru Gold grew doubled sales on YoY basis.
Processed foods reported seventh consecutive quarter of double‐digit growth with
sales up 11.8%. Kissan delivered one of its best quarter aided by growth acceleration
in Ketchup and Jams. Instant soup led Knorr growth despite sharp slowdown in the
Instant Noodles category. Knorr Chinese Noodles were withdrawn from the market
and will be introduced only once approval is received from FSSAI.
Kwality Walls activations, Magnum’s distribution expansion helped ice cream’s
register double‐digit growth.
HUVR remains positive on sustained growth in foods and beverages backed by
emerging segments like Green tea, Bru Gold, Knorr Instant Soups, Magnum and new
variants in Kissan.
July 21, 2015 8
Hindustan Unilever
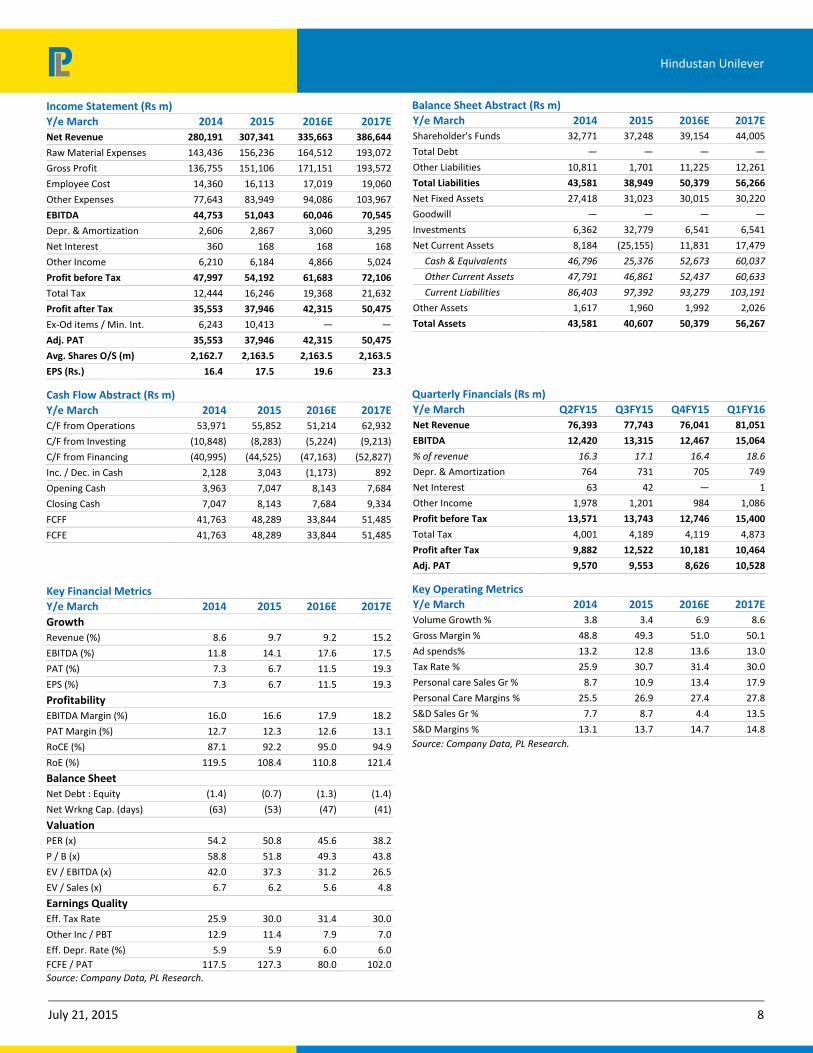
Income Statement (Rs m)
Y/e March 2014 2015 2016E 2017E
Net Revenue 280,191 307,341 335,663 386,644
Raw Material Expenses 143,436 156,236 164,512 193,072
Gross Profit 136,755 151,106 171,151 193,572
Employee Cost 14,360 16,113 17,019 19,060
Other Expenses 77,643 83,949 94,086 103,967
EBITDA 44,753 51,043 60,046 70,545
Depr. & Amortization 2,606 2,867 3,060 3,295
Net Interest 360 168 168 168
Other Income 6,210 6,184 4,866 5,024
Profit before Tax 47,997 54,192 61,683 72,106
Total Tax 12,444 16,246 19,368 21,632
Profit after Tax 35,553 37,946 42,315 50,475
Ex‐Od items / Min. Int. 6,243 10,413 — —
Adj. PAT 35,553 37,946 42,315 50,475
Avg. Shares O/S (m) 2,162.7 2,163.5 2,163.5 2,163.5
EPS (Rs.) 16.4 17.5 19.6 23.3
Cash Flow Abstract (Rs m)
Y/e March 2014 2015 2016E 2017E
C/F from Operations 53,971 55,852 51,214 62,932
C/F from Investing (10,848) (8,283) (5,224) (9,213)
C/F from Financing (40,995) (44,525) (47,163) (52,827)
Inc. / Dec. in Cash 2,128 3,043 (1,173) 892
Opening Cash 3,963 7,047 8,143 7,684
Closing Cash 7,047 8,143 7,684 9,334
FCFF 41,763 48,289 33,844 51,485
FCFE 41,763 48,289 33,844 51,485
Key Financial Metrics
Y/e March 2014 2015 2016E 2017E
Growth
Revenue (%) 8.6 9.7 9.2 15.2
EBITDA (%) 11.8 14.1 17.6 17.5
PAT (%) 7.3 6.7 11.5 19.3
EPS (%) 7.3 6.7 11.5 19.3
Profitability
EBITDA Margin (%) 16.0 16.6 17.9 18.2
PAT Margin (%) 12.7 12.3 12.6 13.1
RoCE (%) 87.1 92.2 95.0 94.9
RoE (%) 119.5 108.4 110.8 121.4
Balance Sheet
Net Debt : Equity (1.4) (0.7) (1.3) (1.4)
Net Wrkng Cap. (days) (63) (53) (47) (41)
Valuation
PER (x) 54.2 50.8 45.6 38.2
P / B (x) 58.8 51.8 49.3 43.8
EV / EBITDA (x) 42.0 37.3 31.2 26.5
EV / Sales (x) 6.7 6.2 5.6 4.8
Earnings Quality
Eff. Tax Rate 25.9 30.0 31.4 30.0
Other Inc / PBT 12.9 11.4 7.9 7.0
Eff. Depr. Rate (%) 5.9 5.9 6.0 6.0
FCFE / PAT 117.5 127.3 80.0 102.0
Source: Company Data, PL Research.
Balance Sheet Abstract (Rs m)
Y/e March 2014 2015 2016E 2017E
Shareholder's Funds 32,771 37,248 39,154 44,005
Total Debt — — — —
Other Liabilities 10,811 1,701 11,225 12,261
Total Liabilities 43,581 38,949 50,379 56,266
Net Fixed Assets 27,418 31,023 30,015 30,220
Goodwill — — — —
Investments 6,362 32,779 6,541 6,541
Net Current Assets 8,184 (25,155) 11,831 17,479
Cash & Equivalents 46,796 25,376 52,673 60,037
Other Current Assets 47,791 46,861 52,437 60,633
Current Liabilities 86,403 97,392 93,279 103,191
Other Assets 1,617 1,960 1,992 2,026
Total Assets 43,581 40,607 50,379 56,267
Quarterly Financials (Rs m)
Y/e March Q2FY15 Q3FY15 Q4FY15 Q1FY16
Net Revenue 76,393 77,743 76,041 81,051
EBITDA 12,420 13,315 12,467 15,064
% of revenue 16.3 17.1 16.4 18.6
Depr. & Amortization 764 731 705 749
Net Interest 63 42 — 1
Other Income 1,978 1,201 984 1,086
Profit before Tax 13,571 13,743 12,746 15,400
Total Tax 4,001 4,189 4,119 4,873
Profit after Tax 9,882 12,522 10,181 10,464
Adj. PAT 9,570 9,553 8,626 10,528
Key Operating Metrics
Y/e March 2014 2015 2016E 2017E
Volume Growth % 3.8 3.4 6.9 8.6
Gross Margin % 48.8 49.3 51.0 50.1
Ad spends% 13.2 12.8 13.6 13.0
Tax Rate % 25.9 30.7 31.4 30.0
Personal care Sales Gr % 8.7 10.9 13.4 17.9
Personal Care Margins % 25.5 26.9 27.4 27.8
S&D Sales Gr % 7.7 8.7 4.4 13.5
S&D Margins % 13.1 13.7 14.7 14.8
Source: Company Data, PL Research.

July 21, 2015 9
Hindustan Unilever
Prabhudas Lilladher Pvt. Ltd.
3rd Floor, Sadhana House, 570, P. B. Marg, Worli, Mumbai‐400 018, India
Tel: (91 22) 6632 2222 Fax: (91 22) 6632 2209
Rating Distribution of Research Coverage PL’s Recommendation Nomenclature
42.9%39.8%
17.3%
0.0%0%
10%
20%
30%
40%
50%
BUY Accumulate Reduce Sell
% of Total Coverage
BUY : Over 15% Outperformance to Sensex over 12‐months
Accumulate : Outperformance to Sensex over 12‐months
Reduce : Underperformance to Sensex over 12‐months
Sell : Over 15% underperformance to Sensex over 12‐months
Trading Buy : Over 10% absolute upside in 1‐month
Trading Sell : Over 10% absolute decline in 1‐month
Not Rated (NR) : No specific call on the stock
Under Review (UR) : Rating likely to change shortly
DISCLAIMER/DISCLOSURES
ANALYST CERTIFICATION
We/I, Mr. Amnish Aggarwal (MBA, CFA), Mr. Gaurav Jogani (MBA, Bcom), Research Analysts, authors and the names subscribed to this report, hereby certify that all of the views expressed in this research report accurately reflect our views about the subject issuer(s) or securities. We also certify that no part of our compensation was, is, or will be directly or indirectly related to the specific recommendation(s) or view(s) in this report.
Terms & conditions and other disclosures:
Prabhudas Lilladher Pvt. Ltd, Mumbai, India (hereinafter referred to as “PL”) is engaged in the business of Stock Broking, Portfolio Manager, Depository Participant and distribution for third party financial products. PL is a subsidiary of Prabhudas Lilladher Advisory Services Pvt Ltd. which has its various subsidiaries engaged in business of commodity broking, investment banking, financial services (margin funding) and distribution of third party financial/other products, details in respect of which are available at www.plindia.com
This document has been prepared by the Research Division of PL and is meant for use by the recipient only as information and is not for circulation. This document is not to be reported or copied or made available to others without prior permission of PL. It should not be considered or taken as an offer to sell or a solicitation to buy or sell any security.
The information contained in this report has been obtained from sources that are considered to be reliable. However, PL has not independently verified the accuracy or completeness of the same. Neither PL nor any of its affiliates, its directors or its employees accepts any responsibility of whatsoever nature for the information, statements and opinion given, made available or expressed herein or for any omission therein.
Recipients of this report should be aware that past performance is not necessarily a guide to future performance and value of investments can go down as well. The suitability or otherwise of any investments will depend upon the recipient's particular circumstances and, in case of doubt, advice should be sought from an independent expert/advisor.
Either PL or its affiliates or its directors or its employees or its representatives or its clients or their relatives may have position(s), make market, act as principal or engage in transactions of securities of companies referred to in this report and they may have used the research material prior to publication.
PL may from time to time solicit or perform investment banking or other services for any company mentioned in this document.
PL is in the process of applying for certificate of registration as Research Analyst under Securities and Exchange Board of India (Research Analysts) Regulations, 2014
PL submits that no material disciplinary action has been taken on us by any Regulatory Authority impacting Equity Research Analysis activities.
PL or its research analysts or its associates or his relatives do not have any financial interest in the subject company.
PL or its research analysts or its associates or his relatives do not have actual/beneficial ownership of one per cent or more securities of the subject company at the end of the month immediately preceding the date of publication of the research report.
PL or its research analysts or its associates or his relatives do not have any material conflict of interest at the time of publication of the research report.
PL or its associates might have received compensation from the subject company in the past twelve months.
PL or its associates might have managed or co‐managed public offering of securities for the subject company in the past twelve months or mandated by the subject company for any other assignment in the past twelve months.
PL or its associates might have received any compensation for investment banking or merchant banking or brokerage services from the subject company in the past twelve months.
PL or its associates might have received any compensation for products or services other than investment banking or merchant banking or brokerage services from the subject company in the past twelve months
PL or its associates might have received any compensation or other benefits from the subject company or third party in connection with the research report.
PL encourages independence in research report preparation and strives to minimize conflict in preparation of research report. PL or its analysts did not receive any compensation or other benefits from the subject Company or third party in connection with the preparation of the research report. PL or its Research Analysts do not have any material conflict of interest at the time of publication of this report.
It is confirmed that Mr. Amnish Aggarwal (MBA, CFA), Mr. Gaurav Jogani (MBA, Bcom), Research Analysts of this report have not received any compensation from the companies mentioned in the report in the preceding twelve months
Compensation of our Research Analysts is not based on any specific merchant banking, investment banking or brokerage service transactions.
The Research analysts for this report certifies that all of the views expressed in this report accurately reflect his or her personal views about the subject company or companies and its or their securities, and no part of his or her compensation was, is or will be, directly or indirectly related to specific recommendations or views expressed in this report.
The research analysts for this report has not served as an officer, director or employee of the subject company PL or its research analysts have not engaged in market making activity for the subject company
Our sales people, traders, and other professionals or affiliates may provide oral or written market commentary or trading strategies to our clients that reflect opinions that are contrary to the opinions expressed herein, and our proprietary trading and investing businesses may make investment decisions that are inconsistent with the recommendations expressed herein. In reviewing these materials, you should be aware that any or all o the foregoing, among other things, may give rise to real or potential conflicts of interest.
PL and its associates, their directors and employees may (a) from time to time, have a long or short position in, and buy or sell the securities of the subject company or (b) be engaged in any other transaction involving such securities and earn brokerage or other compensation or act as a market maker in the financial instruments of the subject company or act as an advisor or lender/borrower to the subject company or may have any other potential conflict of interests with respect to any recommendation and other related information and opinions.
DISCLAIMER/DISCLOSURES (FOR US CLIENTS)
ANALYST CERTIFICATION
The research analysts, with respect to each issuer and its securities covered by them in this research report, certify that: All of the views expressed in this research report accurately reflect his or her or their personal views about all of the issuers and their securities; and No part of his or her or their compensation was, is or will be directly related to the specific recommendation or views expressed in this research report
Terms & conditions and other disclosures:
This research report is a product of Prabhudas Lilladher Pvt. Ltd., which is the employer of the research analyst(s) who has prepared the research report. The research analyst(s) preparing the research report is/are resident outside the United States (U.S.) and are not associated persons of any U.S. regulated broker‐dealer and therefore the analyst(s) is/are not subject to supervision by a U.S. broker‐dealer, and is/are not required to satisfy the regulatory licensing requirements of FINRA or required to otherwise comply with U.S. rules or regulations regarding, among other things, communications with a subject company, public appearances and trading securities held by a research analyst account.
This report is intended for distribution by Prabhudas Lilladher Pvt. Ltd. only to "Major Institutional Investors" as defined by Rule 15a‐6(b)(4) of the U.S. Securities and Exchange Act, 1934 (the Exchange Act) and interpretations thereof by U.S. Securities and Exchange Commission (SEC) in reliance on Rule 15a 6(a)(2). If the recipient of this report is not a Major Institutional Investor as specified above, then it should not act upon this report and return the same to the sender. Further, this report may not be copied, duplicated and/or transmitted onward to any U.S. person, which is not the Major Institutional Investor.
In reliance on the exemption from registration provided by Rule 15a‐6 of the Exchange Act and interpretations thereof by the SEC in order to conduct certain business with Major Institutional Investors, Prabhudas Lilladher Pvt. Ltd. has entered into an agreement with a U.S. registered broker‐dealer, Marco Polo Securities Inc. ("Marco Polo").
Transactions in securities discussed in this research report should be effected through Marco Polo or another U.S. registered broker dealer.