Embed Size (px)
Citation preview

Hillsborough County ITS Master Plan Update
i

Hillsborough County ITS Master Plan Update
i
TABLE OF CONTENTS
SECTION 1.0 | INTRODUCTION .................................................................................................................................................................................................. 1 1.1 BACKGROUND .................................................................................................................................................................................................................. 1 1.2 WHAT IS INTELLIGENT TRANSPORTATION SYSTEMS? ............................................................................................................................................... 1 1.3 STUDY AREA AND PROJECT SCOPE ............................................................................................................................................................................. 2 1.4 EXISTING DOCUMENTATION REVIEWED .................................................................................................................................................................... 3 1.5 STAKEHOLDER IDENTIFICATION ................................................................................................................................................................................. 4 1.6 OPERATIONAL CONCEPT (ROLES AND RESPONSIBILITIES) .................................................................................................................................... 4 1.7 VISION, GOALS AND OBJECTIVES ................................................................................................................................................................................. 6
SECTION 2.0 | EXISTING TRANSPORTATION AND ROADWAY CONDITIONS ............................................................................................................. 8 2.1 ROADWAY/TRAFFIC CONDITIONS AND ANALYSIS ..................................................................................................................................................... 8 2.2 FDOT DISTRICT SEVEN ................................................................................................................................................................................................... 8 2.3 HILLSBOROUGH COUNTY ............................................................................................................................................................................................ 11 2.4 CONGESTION AND SAFETY DATA FROM OTHER COUNTY SOURCES ................................................................................................................... 15 2.5 CITY OF TAMPA/THEA ................................................................................................................................................................................................... 18 2.6 MULTIMODAL ELEMENTS ............................................................................................................................................................................................ 20 2.7 FACILITY TYPE ............................................................................................................................................................................................................... 21 2.8 FREIGHT/TRUCKING ROUTES ..................................................................................................................................................................................... 23 2.9 FREIGHT ACTIVITY AND INTERMODAL CENTERS .................................................................................................................................................... 26 2.10 MAJOR ACTIVITY/EVENT CENTERS ............................................................................................................................................................................. 28 2.11 CRITICAL INFRASTRUCTURE AND KEY RESOURCES ............................................................................................................................................... 29 2.12 EVACUATION ROUTES .................................................................................................................................................................................................. 29
SECTION 3.0 | EXISTING SYSTEMS AND COMMUNICATIONS INVENTORY .............................................................................................................. 30 3.1 FDOT DISTRICT SEVEN ................................................................................................................................................................................................. 30 3.2 HILLSBOROUGH COUNTY ............................................................................................................................................................................................ 32 3.3 CITY OF TAMPA .............................................................................................................................................................................................................. 33 3.4 CITY OF PLANT CITY ..................................................................................................................................................................................................... 34 3.5 CITY OF TEMPLE TERRACE .......................................................................................................................................................................................... 36 3.6 EMERGENCY RESPONDER/LAW ENFORCEMENT ..................................................................................................................................................... 36 3.7 HART AUTHORITY .......................................................................................................................................................................................................... 36 3.8 EXISTING ITS COVERAGE BY KEY CORRIDORS/ ROADWAYS ................................................................................................................................. 37
SECTION 4.0 | STAKEHOLDER NEEDS AND ISSUES ........................................................................................................................................................... 40 4.1 STAKEHOLDER SURVEY PROCESS .............................................................................................................................................................................. 40 4.2 IDENTIFICATION OF STAKEHOLDER NEEDS AND ISSUES ..................................................................................................................................... 40 4.3 ASSESSMENT OF STAKEHOLDER RESPONSES .......................................................................................................................................................... 40

Hillsborough County ITS Master Plan Update
ii
TABLE OF CONTENTS (CONTINUED)
SECTION 5.0 | IMPLEMENTATION PLAN .............................................................................................................................................................................. 43 5.1 POTENTIAL ITS STRATEGIES/FUNCTIONAL REQUIREMENTS ................................................................................................................................ 43 5.2 ITS PROJECT IDENTIFICATION ................................................................................................................................................................................... 54 5.3 PROJECT EVALUATION PROCESS ............................................................................................................................................................................... 78 5.4 ITS PROJECT PRIORITIZATION AND SEQUENCING ................................................................................................................................................. 80
SECTION 6.0 | IMPLEMENTATION SUPPORT ...................................................................................................................................................................... 84 6.1 SYSTEM DEVELOPMENT ............................................................................................................................................................................................... 84 6.2 O&M CONSIDERATIONS ............................................................................................................................................................................................... 84 6.3 STAKEHOLDER AGREEMENTS ..................................................................................................................................................................................... 85 6.4 POSSIBLE FUNDING SOURCE CONSIDERATIONS .................................................................................................................................................... 87 6.5 PROCUREMENT OPTIONS ............................................................................................................................................................................................ 88 6.6 SYSTEM TESTING CONSIDERATIONS .......................................................................................................................................................................... 89 6.7 OTHER IMPLEMENTATION CONSIDERATIONS ......................................................................................................................................................... 91 6.8 ITS ARCHITECTURE CONSISTENCY AND COMPLIANCE ......................................................................................................................................... 92
LIST OF APPENDICES
Appendix A Stakeholder Interview Responses Appendix B ITS Project Scoring and Evaluation Appendix C ITS Standards and Interfaces Appendix D Recommended ITS Service (Market) Packages

Hillsborough County ITS Master Plan Update
iii
LIST OF TABLES
Table 1 Key Stakeholder List .............................................................................................................................................................................................................................. 4 Table 2 Goals and Objectives .............................................................................................................................................................................................................................. 7 Table 3 Congestion and Reliability Performance Measures for ITS Managed Facilities in FDOT D7 ............................................................................................................. 10 Table 4 Hillsborough County Most Congested Roadways ................................................................................................................................................................................ 12 Table 5 Top 25 Congested Roadway Segments (unincorporated Hillsborough County) .................................................................................................................................. 13 Table 6 Top 50 Congested Intersections (unincorporated Hillsborough County) ............................................................................................................................................. 14 Table 7 Delay in 2035; Assuming Committed Improvements are Built ............................................................................................................................................................ 16 Table 8 Top 50 Intersection Crash Locations .................................................................................................................................................................................................... 17 Table 9 50 Most Congested Roads in Tampa .................................................................................................................................................................................................... 18 Table 10 Top 40 Tampa Crash Locations – 2009 ................................................................................................................................................................................................ 19 Table 11 Top Ten Bicycle Crash Locations (2005-2007) .................................................................................................................................................................................... 21 Table 12 Top Ten Pedestrian Crash Locations (2005-2007) ............................................................................................................................................................................... 21 Table 13 Roadway Segments with AADT Greater Than 100,000 VPD .............................................................................................................................................................. 23 Table 14 Goods Movement Roadway Corridors ................................................................................................................................................................................................. 24 Table 15 HART Park and Ride Facilities ............................................................................................................................................................................................................ 27 Table 16 City of Tampa Parking Garages and Lots ............................................................................................................................................................................................. 27 Table 17 Hillsborough County Major Activity/Event Centers ............................................................................................................................................................................ 28 Table 18 Critical Infrastructure/Key Resources .................................................................................................................................................................................................. 29 Table 19 FDOT ITS Devices (within entire District) .......................................................................................................................................................................................... 31 Table 20 Hillsborough County ITS/Traffic Signal Devices ................................................................................................................................................................................ 33 Table 21 City of Tampa ITS/Traffic Signal Devices ........................................................................................................................................................................................... 34 Table 22 Plant City ITS/Traffic Signal Devices .................................................................................................................................................................................................. 35 Table 23 City of Temple Terrace Traffic Signalized Intersections – Operated and Maintained by the County .................................................................................................. 36 Table 24 Fire/Rescue and Law Enforcement Systems......................................................................................................................................................................................... 36 Table 25: HART ITS/Systems .............................................................................................................................................................................................................................. 37 Table 26 Existing ITS Devices and Infrastructure – By Key Roadway/Corridor ................................................................................................................................................ 39 Table 27 Stakeholder Overall Ranking of Transportation Issues ........................................................................................................................................................................ 41 Table 28 Summary of Stakeholder Needs Assessment ........................................................................................................................................................................................ 42 Table 29 ITS Project Evaluation Criteria ............................................................................................................................................................................................................ 79 Table 30 Project Priority and General Implementation Timing........................................................................................................................................................................... 80 Table 31 ITS Project Score and Implementation Priority .................................................................................................................................................................................... 81 Table 32 ITS Project Sequencing/Schedule ......................................................................................................................................................................................................... 83 Table 33 Types of Agreements ............................................................................................................................................................................................................................ 86 Table 34 Part 940: Compliance Matrix ................................................................................................................................................................................................................ 93

Hillsborough County ITS Master Plan Update
iv
LIST OF FIGURES
Figure 1 ITS Master Plan Study Area ................................................................................................................................................................................................................... 3 Figure 2 FDOT District Seven Incident and Events (2008/2009) ......................................................................................................................................................................... 9 Figure 3 Hillsborough County Levels of Service (LOS) .................................................................................................................................................................................... 11 Figure 4 2035 Congestion with Existing + Committed Improvements ............................................................................................................................................................... 15 Figure 5 Constrained Roads ................................................................................................................................................................................................................................ 16 Figure 6 Impact of Congestion on HART Service .............................................................................................................................................................................................. 20 Figure 7 Roadway Functional Classifications ..................................................................................................................................................................................................... 22 Figure 8 Florida SIS Facilities within Hillsborough County .............................................................................................................................................................................. 25 Figure 9 Freight Infrastructure in Tampa Bay .................................................................................................................................................................................................... 26 Figure 10 Freight Activity Centers ....................................................................................................................................................................................................................... 26 Figure 11 Hillsborough County Major Activity/Event Centers ............................................................................................................................................................................ 28 Figure 12 Critical Infrastructure/Key Resources .................................................................................................................................................................................................. 29 Figure 13 HART MetroRapid – TSP Systems ...................................................................................................................................................................................................... 38 Figure 14 Combining Strategies into Projects ...................................................................................................................................................................................................... 54 Figure 15 Procurement Options ............................................................................................................................................................................................................................ 89
Hillsborough County ITS Master Plan Update
1
SECTION 1.0 | INTRODUCTION
1.1 BACKGROUND
The Hillsborough County Metropolitan Planning Organization (MPO) is responsible for the continuing, cooperative, comprehensive, and coordinated transportation planning process throughout Hillsborough County and is comprised of Hillsborough County, City of Tampa, City of Temple Terrace, City of Plant City, Tampa/Hillsborough County Expressway Authority (THEA), Hillsborough Area Regional Transit Authority (HART), Tampa Port Authority, Hillsborough County Aviation Authority, and Florida Department of Transportation (FDOT).
Hillsborough County continues to grow at a significant rate. The 2010 total population estimate for Hillsborough County was 1,229,2261. This represents a 23 percent overall increase over the 2000 Census. The population is expected to grow to over 1.7 million by 2035. The estimate for unincorporated Hillsborough County was 834,255 (29 percent increase), the City of Tampa was 335,709 (11 percent increase), City of Plant City was 34,721 (16 percent increase) and City of Temple Terrace was 24,541 (17 percent increase).
The County’s transportation network consisting of roads, sidewalks, and bicycle lanes and trails is approximately 5,000 miles including; 620 lane-miles of limited access highways, 184 lane-miles of toll roads, 3,236 lane-miles of arterials and collector roads, 359 miles of on-road bicycle lanes, 12 miles of multi-use trails and 400 miles of sidewalks. Sustained growth in the region continues to put a great burden on the existing transportation network and resources with high levels of congestion along with safety risks. Hillsborough County clearly faces a transportation challenge to sustain its economic vitality, safety, security, and public health. Building additional roadways to address the traffic congestion challenges is not feasible due to: increasing travel demands, significant number of constrained roadways (e.g., lack of available lands, rights-of-way), high costs of building new and/or expanded facilities, and environmental impacts and requirements.
1 U.S. Census Bureau 2010 County Population Estimates (Hillsborough County 2010 Census Data).
1.2 WHAT IS INTELLIGENT TRANSPORTATION SYSTEMS?
Intelligent Transportation Systems (ITS) is the application of a combination of advanced technologies, robust planning, improved preparedness, and extensive interagency and intra-agency coordination to improve the mobility and reliability of the surface transportation network.
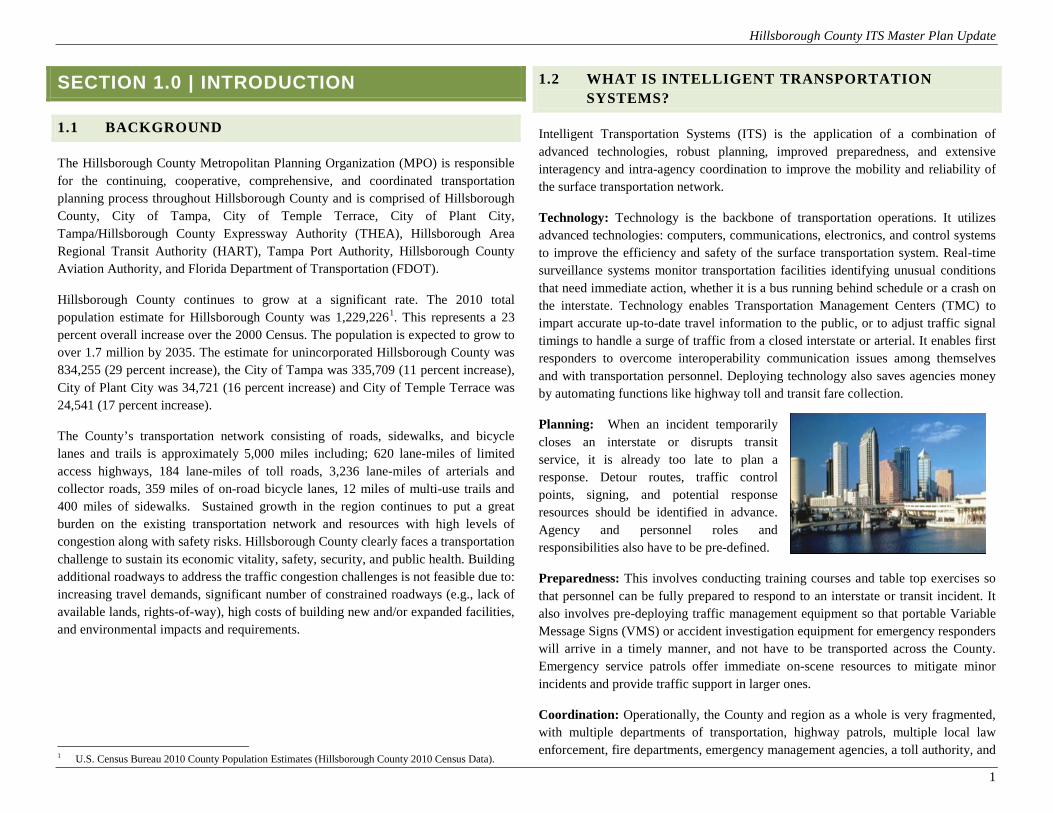
Technology: Technology is the backbone of transportation operations. It utilizes advanced technologies: computers, communications, electronics, and control systems to improve the efficiency and safety of the surface transportation system. Real-time surveillance systems monitor transportation facilities identifying unusual conditions that need immediate action, whether it is a bus running behind schedule or a crash on the interstate. Technology enables Transportation Management Centers (TMC) to impart accurate up-to-date travel information to the public, or to adjust traffic signal timings to handle a surge of traffic from a closed interstate or arterial. It enables first responders to overcome interoperability communication issues among themselves and with transportation personnel. Deploying technology also saves agencies money by automating functions like highway toll and transit fare collection.
Planning: When an incident temporarily closes an interstate or disrupts transit service, it is already too late to plan a response. Detour routes, traffic control points, signing, and potential response resources should be identified in advance. Agency and personnel roles and responsibilities also have to be pre-defined.
Preparedness: This involves conducting training courses and table top exercises so that personnel can be fully prepared to respond to an interstate or transit incident. It also involves pre-deploying traffic management equipment so that portable Variable Message Signs (VMS) or accident investigation equipment for emergency responders will arrive in a timely manner, and not have to be transported across the County. Emergency service patrols offer immediate on-scene resources to mitigate minor incidents and provide traffic support in larger ones.
Coordination: Operationally, the County and region as a whole is very fragmented, with multiple departments of transportation, highway patrols, multiple local law enforcement, fire departments, emergency management agencies, a toll authority, and

Hillsborough County ITS Master Plan Update
2
transit agencies. Institutional coordination, whether at the scene of an incident, between the various TMCs, or across jurisdictions or modes, is a major undertaking. Incident command structures must be established and maintained and situational information disseminated. On-going coordination is required to make sure everything runs smoothly and to correct problems that periodically occur.
The United States Department of Transportation (USDOT) Research and Innovative Technology Administration (RITA) maintains a database (online at http://www.itsbenefits.its.dot.gov/) of reported benefits of ITS programs around the nation. For example, deploying emergency service patrols on interstates has been demonstrated to reduce average duration of incidents by 33 to 60 percent, resulting in fewer secondary accidents and saving millions of gallons of fuel. Improving traffic signal timings by synchronization allowing for optimal traffic progression has also been demonstrated to reduce travel times and total delays (congestion) by greater than 5 percent, translating into a 10 percent or more reduction in fuel consumption, as well as improving intersection safety. Using Automatic Vehicle Location (AVL) systems on buses have been shown to improve on-time bus performance by 12 to 23 percent, reducing passenger waits at bus stops.
ITS programs have unique funding and implementation requirements and challenges. While ITS projects are like other major transportation capital investments, in that they can be funded through the region’s Transportation Improvement Program (TIP), they are unlike highway projects in that there are substantial operations and maintenance (O&M) costs associated with them. Hardware, software, and communication devices have to be continually maintained and updated to remain consistent with the latest technology standards. Ultimately, O&M costs can exceed the initial capital investment.
Many ITS initiatives are programmatic, for example, funding service contracts, vehicles and equipment, and training programs. In many instances, non-traditional transportation stakeholders, like police or fire departments, will be the primary beneficiary of these programs. How to fund these types of programs (i.e., whether to use federal transportation monies, state funds, toll monies, or even Department of Homeland Security funding) has been typically unclear at best. As transportation agencies evolve from a design-build culture to an operations culture, decisions on how to fund, operate, and maintain these types of programs need to be resolved.
ITS DEPLOYMENT IN THE COUNTY
The County has augmented traditional investments for increasing roadway capacity with these advanced ITS technologies and solutions. Although, ITS solutions have been deployed in the County and throughout the District and continue to be deployed with measured successes in mitigating some of the area’s transportation issues, it has been difficult to keep pace with growing demand for travel and services along with operating at less than full potential due to disparate and non-integrated control systems and technologies crossing jurisdictional boundaries.
To optimize the use and performance of existing systems and infrastructure, capacity will require the County and region to view the expansion and enhancement of ITS solutions, operations, strategies, and technologies as an overall coordinated and integrated system crossing jurisdictional boundaries and transportation modes.
Coordination of existing and future ITS technology implementation has been and continues to be critical to the effectiveness of the transportation network, as well as the commerce and prosperity of the area in general.
1.3 STUDY AREA AND PROJECT SCOPE
Located midway along the west coast of Florida, Hillsborough County has 1,048 square miles of land and 24 square miles of inland water for a total of 1,072 square miles. Incorporated cities include Tampa, Temple Terrace, and Plant City. The unincorporated area encompasses 909 square miles, greater than 84 percent of the total County area. Municipalities account for 163 square miles. Figure 1 illustrates the study area for this ITS Master Plan.
The MPO ITS Master Plan (Plan) was first published and adopted in 2005 and has not been updated to reflect changes in the ITS program, technology, inventory of systems and infrastructure, ITS architecture, and current transportation, mobility, and safety challenges and issues along existing and planned ITS deployments within the County and region.
To ensure that the Plan better reflects and addresses current transportation issues and concerns in Hillsborough County and to ensure that it conforms to the latest federal and regional requirements, the MPO decided to update the Plan using a two (2) phase process.

Hillsborough County ITS Master Plan Update
3
Phase 1 conducted a survey of key ITS stakeholders to determine and document local high-level needs, critical issues and concerns from each stakeholder’s perspective relative to transportation, safety, and mobility within the County/region.
FIGURE 1 ITS MASTER PLAN STUDY AREA
Phase 2 builds upon the groundwork laid during Phase 1 providing the basis of an updated ITS Master Plan. The MPO will soon start to update its Long Range Transportation Plan (LRTP). Based on current federal requirements, the LRTP update must be completed by the end of 2014. Because funding for transportation is expected to be constrained, the MPO wants to be in a position to consider ITS-type projects that will improve mobility and safety without the high cost of adding new physical capacity.
The updated ITS Master Plan will serve this purpose and as a guide for the development of regional ITS projects. In its development, the ITS Master Plan will
be consistent with other previous planning documents and initiatives, including the MPO’s 2035 LRTP and Congestion Management Process. Every effort has been made to ensure that this is the case and to coordinate with the key stakeholders.
The development of the updated ITS Master Plan document has been subdivided into six sections and appendices. These sections are:
1. Introduction – this section includes overall background information, description of the project, existing documentation reviewed, goals and objectives and stakeholder identification and roles.
2. Existing Transportation and Roadway Conditions – this section includes documentation of roadway/traffic conditions along with an analysis of the data.
3. Existing Systems and Communications Inventory – this section includes documentation of existing ITS/traffic infrastructure and systems.
4. Stakeholder Needs and Issues – this section includes a discussion of the stakeholder survey process and identification and ranking of stakeholder needs and issues.
5. Implementation Plan – this section includes identification of potential ITS concepts, strategies and projects, benefits, estimated costs, and regional ITS architectural components.
6. Implementation Support – this section includes evaluation criteria and process, prioritization of ITS strategies and projects, procurement methods and potential funding sources, O&M and institutional consideration, inter-agency agreement considerations, deployment schedule, and ITS architecture consistency.
7. Appendices – providing supporting information and data.
1.4 EXISTING DOCUMENTATION REVIEWED
ITS technologies and strategies have been applied throughout the County and region for many years to promote the safe and efficient travel of motorists, transit riders, and cargo. A number of key documents previously prepared by various transportation agencies in the area have guided the planning, deployment, and operation of these ITSs.
These documents were reviewed for information regarding existing conditions, stakeholder information, ITS technologies, strategies, goals, objectives, needs, and regional transportation and mobility issues and concerns.

Hillsborough County ITS Master Plan Update
4
The key documentation sources reviewed and/or referenced in the development of this ITS Master Plan includes:
1. ITS Master Plan (Hillsborough County MPO, 2004)
2. 2035 LRTP (Hillsborough County MPO, 2009)
3. Congestion Management Process (CMP) Report (Hillsborough County MPO, 2011)
4. Transportation Improvements Program (TIP) (Hillsborough County MPO, 2011)
5. Local Capital Improvements Programs (CIP) (City of Tampa, Plant City, Temple Terrace, 2009)
6. City of Tampa Comprehensive Plan (City of Tampa, 2011)
7. City of Tampa Mobility Plan (City of Tampa, 2012)
8. FDOT Five-Year Work Program
9. Tampa Bay Regional ITS Architecture, (FDOT, Ver. 1.0, March 2006 – last updated)
10. HART Traffic Signal Priority (TSP) Project (ConOps, 2011)
11. SunGuide Documentation (web accessed, latest on-line)
12. 2011 Urban Mobility Report (Texas Transportation Institute, 2011)
13. Florida Statewide Regional Evacuation Study (Tampa Bay Region, 2010)
1.5 STAKEHOLDER IDENTIFICATION
Within Hillsborough County there are multiple jurisdictions in regards to the implementation and O&M of ITS and infrastructure. Key stakeholders identified for the update of the ITS Master Plan are shown in Table 1.
1.6 OPERATIONAL CONCEPT (ROLES AND RESPONSIBILITIES)
High-level tasks/activities (a.k.a. responsibilities) that are, or should be, performed by stakeholders (a.k.a. roles), with respect to the operation of their ITS project/system. Detailed roles and responsibilities would be developed as each ITS project is developed and designed.
TABLE 1 KEY STAKEHOLDER LIST
Stakeholders
1 FDOT District Seven Regional Traffic Management Center (RTMC)
2 Hillsborough County Traffic/Public Works Department 3 City of Tampa Transportation Division 4 Plant City Streets and Traffic Division 5 Temple Terrace Public Works Department 6 THEA 7 HART
8 Environmental Protection Commission (EPC) of Hillsborough County
9 Aviation Authority 10 Port Authority 11 Florida Highway Patrol (FHP) – Troop C 12 Hillsborough County Sheriff’s Office 13 Tampa Police Department 14 Plant City Police Department 15 Temple Terrace Police Department 16 Tampa Fire Rescue 17 Hillsborough County Fire Rescue 18 Plant City Fire Rescue 19 Temple Terrace Fire Department 20 Hillsborough County Hazard Mitigation
TRAFFIC AND TRANSPORTATION MANAGEMENT AGENCIES AND CENTERS
Regional traffic and transportation management agencies are responsible for monitoring and controlling the public transportation network. TMCs and Traffic Control Centers (TCCs) are responsible for collecting transportation data, operating and controlling highway field devices, and (in the case of a TMC) disseminating traveler information. Additionally, TMCs frequently coordinate with emergency, law enforcement, and maintenance management agencies to quickly identify incidents and request/provide the necessary resources to clear incidents quickly and effectively.

Hillsborough County ITS Master Plan Update
5
The interstate system and its ITS components are controlled and maintained by FDOT. Hillsborough County is responsible for the traffic signals and ITS and communications infrastructure within unincorporated Hillsborough County, as well as Temple Terrace. The City of Tampa and Plant City are responsible for the signals and other ITS infrastructure along roadways within their respective cities. Finally, THEA coordinates with FDOT to implement and maintain ITS infrastructure on toll roads within Hillsborough County.
EMERGENCY MANAGEMENT AGENCIES/CENTERS
Emergency Management Agencies/Centers are generally responsible for protecting lives and property of residents within Hillsborough County. They are responsible for responding to natural and man-made disasters, as well as implementing procedures to mitigate and recover from these events. Disasters include all major incidents (e.g., weather, large fires, acts of terror, and serious HAZMAT spills).
EMERGENCY RESPONSE AGENCIES
Emergency response agencies provide timely response and treatment of individuals involved in incidents, as well as control at the scene of the incident so emergency personnel can provide treatment without public interference. These agencies are typically among the first to respond to incidents and emergencies affecting the regional highway network. Thus, emergency response personnel are usually the first to verify conditions in the field and report the information needed to initiate an appropriate response and clear roadways in a timely manner.
FLORIDA HIGHWAY PATROL (FHP)
The FHP Troop C is the County’s/region’s highway patrol and is responsible for traffic enforcement and crash investigations on all state highways in the region. FHP takes its mission from its parent Department of Highway Safety and Motor Vehicles (DHSMV), which states, "Making highways safe through service, education, and enforcement.” The troop’s primary communications links are through the Regional Dispatch Center (RDC).
SHERIFF OFFICES AND LOCAL POLICE DEPARTMENTS
Sheriff offices and local police departments provide enforcement services for the Tampa-region, including the various transportation elements within the region.
Sheriff offices and local police departments are primarily responsible for providing local emergency response services to the region, as well as being an active participant in incident detection and monitoring.
EMERGENCY MEDICAL SERVICES AND FIRE RESCUE DEPARTMENTS
Generally speaking, emergency medical services, fire rescue departments provide on-site medical treatment to persons involved in crashes. Since time is of the essence whenever responding to injury crashes, these agencies must respond quickly. Any hesitation can be the difference between life and death. Therefore, these agencies must communicate frequently with traffic management agencies, Sheriff offices, and local police departments to initiate a timely and appropriate response. Information obtained by personnel at the crash scene and images obtained from cameras provide valuable information for determining the nature and extent of crashes and other incidents.
PUBLIC TRANSPORTATION MANAGEMENT/TRANSIT AGENCIES
The HART Authority provides regional transportation services/mass transit needs for the region. Currently, HART operates 177 buses, 48 vans, over 29 local routes, 11 express routes, 22 park-n-ride lots, and five flex routes. HART is also responsible for alerting traffic and emergency response agencies of transit-related incidents so traffic management and emergency response can be implemented. HART is also responsible for disseminating incident and major evacuation information, as well as basic transit information (fares, routes, schedules, etc.) to information service providers so the public can make/adjust their travel plans based on real-time information.
CITY PUBLIC WORKS DEPARTMENTS
City Public Works Departments are responsible for maintaining city infrastructure and inventorying ITS/traffic signal assets. These departments often hold information that might benefit other agency operations. For instance, real-time or scheduled construction information may be communicated to public transportation agencies so that transit vehicles can be routed around areas impacted by construction activities. This information is also applicable for emergency response agencies in routing their vehicles.
Hillsborough County ITS Master Plan Update
6
1.7 VISION, GOALS AND OBJECTIVES
The MPO’s 2035 LRTP is a collective effort to address the development of a community-wide transportation system. The LRTP proposes a balanced transportation system, taking into account considerations such as personal mobility, growth management, regional economic development, neighborhood preservation, environmental concerns, and citizen participation.
The goals and objectives provided are consistent with the policies established by local agencies and jurisdictions.
Vision: In keeping with the transportation vision, goals, and objectives defined in the 2035 LRTP, the updated ITS Master Plan has identified an overarching theme or vision that encapsulates the overall intent of ITS as part of the 2035 LRTP as follows:
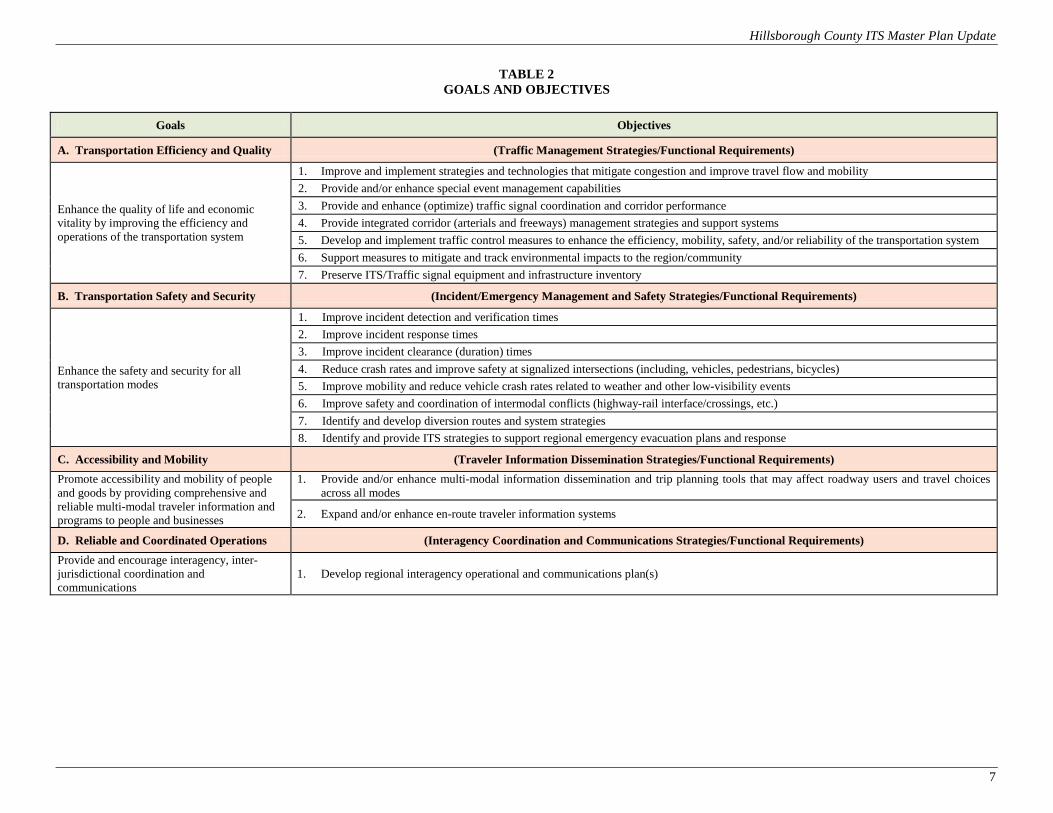
Goals and Objectives: The development of the ITS Master Plan is further guided by a set of clear Goals and Objectives. The identification of each of the Goal and Objective statements is provided in Table 2.
“To operate our transportation system at the highest-level of cost effective performance resulting in 1) reduced excess delay on arterials AND freeways, 2) increased safety for all operating, managing and using our transportation
network, 3) increased mobility options for all Tampa-Bay residents, 4) real-time traveler information for all travel modes and 5) seamless coordination with ALL operating agencies.”
Hillsborough County ITS Master Plan Update
7
TABLE 2 GOALS AND OBJECTIVES
Goals Objectives
A. Transportation Efficiency and Quality (Traffic Management Strategies/Functional Requirements)
Enhance the quality of life and economic vitality by improving the efficiency and operations of the transportation system
1. Improve and implement strategies and technologies that mitigate congestion and improve travel flow and mobility 2. Provide and/or enhance special event management capabilities 3. Provide and enhance (optimize) traffic signal coordination and corridor performance 4. Provide integrated corridor (arterials and freeways) management strategies and support systems 5. Develop and implement traffic control measures to enhance the efficiency, mobility, safety, and/or reliability of the transportation system 6. Support measures to mitigate and track environmental impacts to the region/community 7. Preserve ITS/Traffic signal equipment and infrastructure inventory
B. Transportation Safety and Security (Incident/Emergency Management and Safety Strategies/Functional Requirements)
Enhance the safety and security for all transportation modes
1. Improve incident detection and verification times 2. Improve incident response times 3. Improve incident clearance (duration) times 4. Reduce crash rates and improve safety at signalized intersections (including, vehicles, pedestrians, bicycles) 5. Improve mobility and reduce vehicle crash rates related to weather and other low-visibility events 6. Improve safety and coordination of intermodal conflicts (highway-rail interface/crossings, etc.) 7. Identify and develop diversion routes and system strategies 8. Identify and provide ITS strategies to support regional emergency evacuation plans and response
C. Accessibility and Mobility (Traveler Information Dissemination Strategies/Functional Requirements) Promote accessibility and mobility of people and goods by providing comprehensive and reliable multi-modal traveler information and programs to people and businesses
1. Provide and/or enhance multi-modal information dissemination and trip planning tools that may affect roadway users and travel choices across all modes
2. Expand and/or enhance en-route traveler information systems
D. Reliable and Coordinated Operations (Interagency Coordination and Communications Strategies/Functional Requirements) Provide and encourage interagency, inter-jurisdictional coordination and communications
1. Develop regional interagency operational and communications plan(s)

Hillsborough County ITS Master Plan Update
8
SECTION 2.0 | EXISTING TRANSPORTATION AND ROADWAY CONDITIONS
2.1 ROADWAY/TRAFFIC CONDITIONS AND ANALYSIS
The transportation network within Hillsborough County contains approximately 4,100 miles of roadway including 184 lane-miles of toll road, 620 lane-miles of limited access highway, and 3,236 lane-miles of arterials and collectors. The varied physical and operational characteristics present on the network contribute to the need, type, and location of ITS improvements.
Multiple agencies including the FDOT, Hillsborough County MPO, Hillsborough County, and City of Tampa regularly collect and analyze localized traffic data to assess system performance and identify opportunity for improvement.
This section documents existing roadway characteristics to be considered in the development and application of potential ITS solutions and concepts.
SYSTEM PERFORMANCE
A major factor affecting the performance of the existing roadway network is roadway congestion. Typically, congestion is identified as either non-recurrent or recurrent. Non-recurrent congestion is caused by events short in duration such as crashes, maintenance, construction activities, or more generally any instance that normal capacity is temporarily reduced. Recurrent congestion generally occurs consistently along the same segments of roadway during peak periods when the capacity of the roadway is exceeded by traffic demand. Several facilities located within Hillsborough County actively monitor and manage traffic congestion and system performance.
2.2 FDOT DISTRICT SEVEN
FDOT operates a RTMC called the Tampa Bay SunGuide (TBSG) Center that covers facilities in District Seven. It operates a freeway management system that relies on video cameras, traffic detectors, and other sources to monitor conditions on I‐4, I‐75, and I‐275 and other state highways and coordinates with various transportation, law enforcement, and emergency agencies during emergencies and incidents as it impacts the region as a whole. Traveler information is provided by Dynamic Message Signs (DMSs) as well as to the 511 system and the local news media outlets.
Video is not recorded, however, the RTMC compiles and archives operational and performance data as described below.
NON‐RECURRENT CONGESTION
The RTMC plays an active role in identifying and limiting the impact of non-recurrent congestion. The RTMC reacts to incidents by alerting law enforcement, emergency services, Road Rangers, private towing, and spill response companies. The FDOT collaborates with these partners to expedite the removal of vehicles, cargo, and debris from state highways and to restore, in an urgent manner, the safe and orderly flow of traffic.
The FDOT reports on “incident duration” in their ITS Performance Measures Annual Report. In District Seven, for example, for Fiscal Year (FY) 2009, the average duration per lane blocking incident was just under 45 minutes, compared to 48 minutes in FY 2008.
Figure 2 shows the number and type of incidents or events for FY 2008/2009. There were over 67,000 incidents or events recorded on interstates covered by this RTMC, with disabled vehicles accounting for two‐thirds of the total. Abandoned vehicles, debris, and crashes were the next most prevalent, followed by numerous other types of incidents or events. Scheduled or emergency road work makes up only two percent of the total. Congestion per se accounted for less than five (5) percent of the total, although it is likely that any of the reported incidents or events could contribute to the non-recurrent slow-downs. Statistics reported by Road Rangers for 2007 and 2008 are consistent with this distribution of incident types, with disabled vehicles accounting for approximately 60 percent of the total.
RECURRENT FREEWAY CONGESTION AND TRAVEL TIME RELIABILITY
The RTMC also manages day‐to‐day traffic conditions through a system of roadside transportation sensors. “Miles managed by ITS” is defined as contiguous, continuously operated and maintained centerline mileage that has:
• Traffic probes and/or sensors • Real‐time traffic information reporting coverage • Real‐time incident response capabilities • Availability of real‐time traffic data to FDOT

Hillsborough County ITS Master Plan Update
9
FIGURE 2 FDOT DISTRICT SEVEN INCIDENT AND EVENTS (2008/2009)
Source: Congestion Management and Crash Mitigation Process, State of the System, 2012.
Currently, only a portion (over 60 percent) of the Florida Intrastate Highway System (FIHS) in District Seven is instrumented and managed by ITS, although the goal is to expand the coverage as ITS deployment and interstate reconstruction occurs. FDOT intends to have full coverage on interstate facilities within Hillsborough in the next 5 years. As of FY 08/09, the following segments are managed in District Seven:
ITS Miles Managed by FDOT Road Limits
(Mile Post) 13 I-275 25.5 – 38.5 11 I-275 43 – 54
12.5 I-75 253.2 – 265.7 22.5 I-4 0 – 22.5
The traffic data collected by the RTMC is detailed including the capture of real-time traffic volume, speed, and lane occupancy information by facility, segment, and station. The information collected by the RTMC allows FDOT to develop roadway performance measures.
Two measures use by FDOT to evaluate congestion and travel time include, Travel Time Index (TTI) and Buffer Index (BFI).
• TTI functions as a measure of congestion and represents the ratio of travel time in the peak period to travel time at free-flow conditions. For example, a TTI of 1.5 on a facility indicates that a 20-minute free flow trip would take 30 minutes during a peak period.
• BFI is a measure of the reliability of travel on a facility. BFI is calculated as the ratio of the 95th percentile travel time to the average travel time. BFI represents the extra time that travelers must add their trip to ensure on-time arrival. For example, a BFI of 40 percent means that for a trip that usually takes 20 minutes the traveler must allot an additional 8 minutes to ensure and on-time arrival.
Table 3 includes data taken from the FDOT ITS Annual Performance Measure Reports for 2008 and 2009 which shows the TTI and BFI figures for the roadway segments within District Seven monitored by the RTMC. The blocks highlighted in the table identify the poorest performing roadway segments of the monitored network. Notably, multiple southbound segments of I-275 during AM peak period and multiple northbound segments of I-275 during PM peak period were shown to be congested and unreliable in terms of travel time. Additionally, eastbound segments of I-4 were shown to be congested during the PM peak period. In some circumstances, conditions on the roadways that travelers were required to allot more than twice the standard travel time during free-flow conditions to ensure an on-time arrival.
CONGESTION DATA FROM OTHER FDOT SOURCES
Additionally, District Seven, in collaboration with the FDOT Statistics Office, collects traffic count and weight-in motion data annually at more than 500 locations within Hillsborough County. The traffic information collected identifies traffic volume at these locations is fundamental to determining the performance of the existing highway system.
The data collected at the count locations serves as the basis for much of the subsequent traffic analysis performed by the FDOT. The FDOT publishes the results of a portion of its annual analysis of roadway performance as part of the annual District Level of Service (LOS) Reports.

Hillsborough County ITS Master Plan Update
10
TABLE 3 CONGESTION AND RELIABILITY PERFORMANCE MEASURES FOR ITS MANAGED FACILITIES IN FDOT D7
Section ID Road Dir. From/To Length
AM PEAK PM PEAK
TTI 08/09
TTI 07/08
BFI 08/09
BFI 07/08
TTI 08/09
TTI 07/08
BFI 08/09
BFI 07/08
1 I-275 NB 38th Ave to Howard Frankland Bridge 6.50 1.00 N/A 0.00 N/A 1.02 N/A 0.12 N/A 2 I-275 NB Howard Frankland Bridge 6.40 1.03 N/A 0.15 0.36 1.35 1.27 0.83 0.68 3 I-275 NB Hillsborough River in Downtown to Busch Blvd 6.90 1.00 N/A 0.01 N/A 1.23 1.19 0.38 N/A 4 I-275 NB Busch Blvd to Livingston Ave 3.80 1.09 N/A 0.06 N/A 1.16 N/A 0.10 N/A 5 I-275 SB Howard Frankland Bridge to 38th Ave 6.50 1.00 N/A 0.00 N/A 1.06 N/A 0.26 N/A 6 I-275 SB Howard Frankland Bridge 6.35 1.00 N/A 0.00 N/A 1.01 N/A 0.00 N/A 7 I-275 SB Busch Blvd to Hillsborough River in Downtown 7.15 1.38 1.49 0.42 0.48 1.18 1.2 0.29 N/A 8 I-275 SB Livingston Ave to Busch Blvd 3.90 1.31 1.46 0.81 1.06 1.00 N/A 0.00 N/A 9 I-4 EB I-275 to MLK Blvd 4.95 1.00 N/A 0.00 N/A 1.02 N/A 0.09 N/A
10 I-4 EB MLK Blvd to CR 579 5.10 1.00 N/A 0.00 N/A 1.15 N/A 0.64 0.61 11 I-4 WB MLK Blvd to I-275 5.15 1.12 N/A 0.49 N/A 1.08 N/A 0.38 N/A 12 I-4 WB CR 579 to MLK Blvd 5.25 1.01 N/A 0.00 N/A 1.01 N/A 0.00 N/A 13 I-4 EB CR 579 to CR 601 12.05 1.01 N/A 0.01 N/A 1.04 N/A 0.18 N/A 14 I-4 WB CR 601 to CR 579 12.10 1.02 N/A 0.07 N/A 1.01 N/A 0.04 N/A
Indicates one of the five most congested or least reliable segments in that year. TTI – Travel Time Index BFI – Buffer Index
Source of TTI and BFI analysis: 2010 Hillsborough County Metropolitan Planning Organization Update of the Congestion Management Process, 2010. Data Source FDOT ITS Annual Performance Measure Reports for 2008 and 2009.

Hillsborough County ITS Master Plan Update
11
Figure 3 depicts the Level of Service (LOS) present on the state maintained roadway network within Hillsborough County. The roadway LOS shown below was calculated by comparing 2011 traffic volume data with FDOT LOS standards for SIS facilities and local LOS standards for non-SIS roads. Roadway LOS is a performance measure that describes a motorist’s perception of operating conditions present on a roadway.. LOS considers key measures such as vehicle speed, travel time, traffic density, and delay. Letter grades ranging from A to F, with ‘A’ representing the best and ‘F’ the worst conditions are assigned as classifications.
FIGURE 3 HILLSBOROUGH COUNTY LOS
Source: 2011 Traffic Count Data, 2009 Quality Level of Service Handbook
Table 4 lists the most congested roadway segments based on a comparison of existing roadway volume to the standard service volume of the facility. Thirty-one (31) roadway segments within the County operate at a level that is 1.25 times the standard roadway service volume.
2.3 HILLSBOROUGH COUNTY
Similar to the FDOT TMC, the County’s TMC, operated by the Traffic Services Division of the County Public Works Department, serves as the hub for the County’s ITS. Cameras provide real‐time images of intersections on county‐maintained collectors and arterials. The TMC uses the information from video cameras and sensors in the ground to change the timing of traffic signals when necessary, as for example, in clearing traffic after an accident has occurred.
The TMC does not have readily available performance and operational data or reports. However, the County is currently in the process of developing and implementing an Advanced Traffic Management System (ATMS) system in which recurring and non‐recurring sources of congestion will be monitored and captured as data and compiled as reports.
CONGESTION AND SAFETY DATA FROM OTHER COUNTY SOURCES
Hillsborough County routinely collects 24- and 72‐hour traffic counts and the Planning and Growth Management Department produces an annual Level of Service Report for concurrency purposes. Traffic volume data comes from permanent or portable counting devices at designated stations on roads maintained by the County in the unincorporated area. Based on information contained in the 2008 Hillsborough County Level of Service Report, Table 5 identifies the 25 most congested roadway segments in unincorporated Hillsborough County based on their LOS and volume-to-capacity (v/c) ratio.
Table 6 identifies the 50 most congested intersections in unincorporated Hillsborough County for both county and state roads, based on their LOS and v/c ratio.

Hillsborough County ITS Master Plan Update
12
TABLE 4 HILLSBOROUGH COUNTY MOST CONGESTED ROADWAYS
Road Name From To AADT LOS V/SV
US 92/SR 600 (Hillsborough Ave) Tampa St/Highland Avenue US 41/SR 45 (Nebraska Ave) 63,500 F 2.08
I-275/SR 93 CR 587 (Westshore Blvd) Lois Ave 183,000 F 2.01 SR 600 (Dale Mabry Hwy) Himes Ave 175,000 F 1.92 Lois Ave SR 600 (Dale Mabry Hwy) 170,500 F 1.87
SR 60 (Memorial Hwy) I-275/SR 93 N Ward St 55,500 F 1.81 I-275/SR 93 Howard Ave Ashley St 190,500 F 1.77 SR 582 (Fowler Ave) US Bus 41/SR 685 (Florida Ave) US 41/SR 45 (Nebraska Ave) 54,000 F 1.77 SR 60 (Kennedy Blvd) SR 685 (Henderson Blvd) Kennedy Blvd at Ashley St 47,000 F 1.70 SR 678 (Bearss Ave) US Bus 41/SR 685 (Florida Ave) SR 45 (Nebraska Ave) 51,500 F 1.68
I-275/SR 93
Sligh Ave Bird St 159,000 F 1.65 Himes Ave Howard Ave 176,500 F 1.64 SR 600 (Hillsborough Ave) Sligh Ave 158,000 F 1.64 SR 574 (Dr MLK Blvd) SR 600 (Hillsborough Ave) 155,500 F 1.61
SR 579 (Fletcher Ave) US Bus 41/SR 685 (Florida Ave) US 41/SR 45 (Nebraska Ave) 46,500 F 1.60
I-275/SR 93
Bird St SR 580 (Busch Blvd) 150,000 F 1.56 SR 60 (Memorial Hwy) CR 587 (Westshore Blvd) 141,000 F 1.55 SR 580 (Busch Blvd) SR 582 (Fowler Ave) 141,500 F 1.47 Jefferson St I-4/SR 400 175,000 F 1.45 Ashley St Jefferson St 172,500 F 1.42
US 301/SR 41 Stacy Rd Pasco County Line 11,400 D 1.37 SR 60 (Courtney Campbell Cswy) Pinellas County Line Rocky Point Dr 55,000 F 1.36 I-275/SR 93 Kennedy Blvd SR 60 (Memorial Hwy) 81,500 F 1.34 SR 574 (Dr. MLK Blvd) US 41/SR 599 (N 40th St) I-4/SR 400 23,500 F 1.31 SR 60 (Brandon Blvd) Kings Ave Kingsway Rd/Bryan Rd 71,500 F 1.31 SR 580 (Busch Blvd) SR 597 (Dale Mabry Hwy) N Armenia Ave 47,000 F 1.30
US 92/SR 600 (Hillsborough Ave) Lincoln Ave Habana Ave 66,500 F 1.28 Habana Ave Armenia Ave 66,500 F 1.28 Armenia Ave Beacon Ave/McKay Ave 66,500 F 1.28
SR 580 (Hillsborough Ave) SR 589 (Veterans Expwy) SR 580 (Dale Mabry SB Exit) 73,500 F 1.27 US 92/SR 600 (Dale Mabry Hwy) I-275/SR 93 Columbus Dr 60,500 F 1.27 SR 597 (N Dale Mabry Hwy) Bearss Ave/Ehrlich Rd Lakeview Dr/Northgreen Ave 69,000 F 1.26
V/SV = Volume-to-service volume Source: District Seven, 2012 Level of Service Report.

Hillsborough County ITS Master Plan Update
13
TABLE 5 TOP 25 CONGESTED ROADWAY SEGMENTS (UNINCORPORATED HILLSBOROUGH COUNTY)
Roadway From To LOS Std. AADT
Peak Hour Directional
Volume
Peak Hour Directional Capacity
V/C Ratio LOS
Bell Shoals Road Bloomingdale Avenue Boyette Road D 29,233 1,450 817 1.78 F Bruce B. Downs Boulevard Bearss Avenue Tampa Palms Boulevard D 69,962 3,747 2,180 1.72 F Progress Boulevard 78th Street US 301 E 20,324 1,397 846 1.65 F Memorial Highway Veterans Expressway Hillsborough Avenue D 50,328 2,580 1,625 1.59 F Mt. Carmel/Front Street Seffner Valrico SR 60 D 12,106 813 515 1.58 F Gunn Highway Dale Mabry Highway Linebaugh Avenue E 42,177 2,630 1,710 1.54 F Boyette Road McMullen Drive Bell Shoals Road D 22,506 1,176 817 1.44 F Benjamin Road Sligh Avenue Waters Avenue D 15,321 1,112 817 1.36 F Forbes Road M.L. King Boulevard Interstate 4 C 15,253 891 656 1.36 F Henderson Road Waters Avenue Linebaugh Avenue D 12,422 1,090 800 1.36 F Gunn Highway Linebaugh Avenue Anderson Road E 36,445 2,272 1,710 1.33 F Hoover Boulevard Hillsborough Avenue Anderson Road D 18,487 1,243 950 1.31 F Lakewood Drive M.L. King Boulevard Broadway Avenue E 20,232 1,001 770 1.30 F Lakewood Drive Broadway Avenue SR 60 D 20,232 1,001 770 1.30 F Broadway Avenue Falkenburg Road Williams Road D 10,190 984 770 1.28 F Linebaugh Avenue Country Way Boulevard Race Track Road D 18,844 1,048 817 1.28 F Wheeler Road Parsons Road Valrico Road D 9,864 625 490 1.28 F Hanley Road Hillsborough Avenue Wilsky Boulevard E 38,826 2,131 1,710 1.25 F Broadway Avenue Williams Road Lakewood Drive E 10,190 984 808 1.22 F Gibsonton Drive Interstate 75 US 301 D 33,920 1,806 1,490 1.21 F Fletcher Avenue 56th Street Interstate 75 D 37,329 1,926 1,625 1.19 F 46th Street Fletcher Avenue Skipper Road D 18,124 965 817 1.18 F Cross Creek Boulevard Kinnan Street Morris Bridge Road D 12,652 960 817 1.16 F Lithia Pinecrest Road Lumsden Road Bloomingdale Avenue D 19,605 1,217 1,050 1.16 F Bloomingdale Avenue Kings Avenue Bell Shoals Road D 47,162 2,720 2,360 1.15 F
Source: 2008 Hillsborough County Level of Service Report.

Hillsborough County ITS Master Plan Update
14
TABLE 6 TOP 50 CONGESTED INTERSECTIONS (UNINCORPORATED HILLSBOROUGH COUNTY)
Street Name Intersecting Street Street Name Intersecting Street
Bearss Ave Livingston Ave Hillsborough Ave (US 92) Orient Rd Bearss Ave Nebraska Ave (US 41) Humphrey St Dale Mabry Hwy (SR 597) Bearss Ave Bruce B Downs Blvd IDS Ped Crossing Orange Grove Dr Bearss Ave Florida Ave (US 41 Bus) Lambright St Himes Ave Bearss Ave Lake Emerald Blvd Linebaugh Ave Gunn Hwy Bearss Ave Lake Magdalene Blvd Linebaugh Ave Henderson Rd Bearss Ave North Blvd Linebaugh Ave Sheldon Rd Big Bend Rd (SR 672) East Bay HS Lithia Pinecrest Rd Bryan Rd Bloomingdale Ave Kings Ave Lumsden Rd Bryan Rd Bloomingdale Ave Lithia Pinecrest Rd Lumsden Rd Kings Ave Bloomingdale Ave US 301 Lumsden Rd Lithia Pinecrest Rd Brandon Pkwy Town Center Blvd Lumsden Rd Parsons Ave Broadway Ave (CR 574) Falkenburg Rd Memorial Hwy Bray Rd Bruce B Downs Skipper Rd M.L. King Blvd (SR 574) Falkenburg Rd Busch Blvd 56th St (SR 583) M.L. King Blvd (SR 574) Parsons Ave Causeway Blvd US 301 Palm River Rd 78th St Crestwood Elementary Ped Crossing Manhattan Ave Pine Crest Manor Blvd Dale Mabry Hwy (SR 597) Ehrlich Rd Hutchinson Rd Sligh Ave Harney Rd Ehrlich Rd Turner Rd SR 60 (Brandon Blvd) Kings Ave Fletcher Ave Bruce B. Downs Blvd Van Dyke Rd Gunn Hwy Fletcher Ave Dale Mabry Hwy (SR 597) Victoria St Kings Ave Fletcher Ave Florida Ave (US 41 Bus) Waters Ave Anderson Rd Fletcher Ave Nebraska Ave (US 41) Waters Ave Dale Mabry Hwy (SR 597) Fowler Ave (SR 582) 56th St Waters Ave Hanley Rd Fowler Ave (SR 582) Morris Bridge Rd Waters Ave Sheldon Rd Gunn Hwy Lynn Rd Woodberry Rd Falkenburg Rd Hillsborough Ave (SR 580) Veterans Expwy NB On-ramp
Source: 2008 Hillsborough County Level of Service Report.

Hillsborough County ITS Master Plan Update
15
2.4 CONGESTION AND SAFETY DATA FROM OTHER COUNTY SOURCES
CONGESTION AND SAFETY ANALYSIS IN THE 2035 LRTP
The MPO maintains the LRTP for Hillsborough County. It has a time horizon of at least 20 years and was recently updated to 2035. Congestion is considered both in terms of current and future conditions. For example, the LRTP illustrates deficient roads as they existed in 2006, as well as congestion in 2035. The forecast of future congestion shown in Figure 4 is based on traffic volumes taken from the regional travel demand model that predicts travel generated by future population and growth. This scenario assumes no improvements will be made to the transportation system other than those that are funded over the next several years. As might be expected under this scenario, most of the limited access roads such as I‐275, I‐4, I‐75, Veteran’s Expressway, and a substantial number of major surface arterials such as Hillsborough Avenue, US 92, SR 60, and Bruce B. Downs Boulevard would exceed their capacity by 50 percent or more.
The 2035 LRTP further quantifies future congestion by projecting daily vehicle hours of delay for major roads in 2035. Table 7 ranks these roads in terms of the most vehicle hours of delay per mile in 2035, again assuming no improvements beyond the existing plus committed system. Segments of I‐75 and I‐4 in northern and eastern Hillsborough County, as well as a portion of Bruce B. Downs Boulevard are forecast to be among the top five roads with the most delay.
The LRTP also takes into account “constrained roads,” meaning those that cannot be widened with more lanes due to impacts on the environment, surrounding communities, excessive right‐of‐way (ROW) costs, or policies established by the adopted comprehensive plans. Figure 5 shows these roads. Some of these, such as Fowler Avenue, Hillsborough Avenue, North Dale Mabry Highway, and Bearss Avenue are also congested, which further reinforces the need to shift trips to alternative modes, off‐peak periods, or parallel routes.
FIGURE 4 2035 CONGESTION WITH EXISTING + COMMITTED IMPROVEMENTS
Source: Hillsborough County MPO’s 2035 LRTP.

Hillsborough County ITS Master Plan Update
16
TABLE 7 DELAY IN 2035; ASSUMING COMMITTED IMPROVEMENTS ARE BUILT
Highly Congested Major Roads in 2035 Length (Miles)
Daily Vehicle Hours of
Delay I-75 from I-4 to I-275 9 7,211 I-4 from I-75 to Hillsborough/Polk County Line 18 5,351 I-75 from Big Bend Rd to Crosstown Expressway (SR 618) 10 5,281
Bearss Ave/Bruce B. Downs Blvd. from 30th St to Cross Creek Blvd 6.5 5,232
I-75 from Crosstown Expressway (SR 618) to I-4 5 4,392 I-4 from I-275 to I-75 8 4,215 US 41 from Bearss Ave to Hillsborough/Pasco County Line 6 4,192
Gunn Hwy from Veterans Expressway to Hillsborough/Pasco County Line 5 4,161
Boy Scout Blvd/Spruce St from Memorial Hwy to Dale Mabry Hwy 1 3,686
Selmon Crosstown Expressway (SR 718) from Willow Ave to I-75 10 3,479
US 301 from Fowler Ave to Hillsborough/Pasco County Line 11 3,294
I-275 from I-4 to Bearss Ave 8.5 3,286 I-75 from Manatee/Hillsborough County Line to Big Bend Rd 12 3,169
I-275 from Pinellas/Hillsborough County Line to I-4 13 3,137 Kennedy Blvd from I-275 to Dale Mabry Hwy South 1.7 3,068 Veterans Expressway from Hillsborough Ave to Dale Mabry Hwy 9.5 2,724
SR 60/Adamo Dr from 50th St to US 301 3 2,721 Dale Mabry Hwy from Hillsborough Ave to US 41 13 2,703 SR 60/Adamo Dr from US 301 to I-75 1.5 2,656 Bearss Ave/Bruce B Downs Blvd from Florida Ave to 30th St 2 2,634
Source: Hillsborough County MPO’s 2035 LRTP.
FIGURE 5 CONSTRAINED ROADS
Source: Hillsborough County MPO’s 2035 LRTP.
The Hillsborough County Public Works Department and FDOT maintain a Crash Data Management System that compiles data from crash reports filed by all law enforcement agencies. Historical crash data is available but must be requested through FDOT in order to meet privacy concerns. The Hillsborough County Sheriff’s Office also tracks traffic crashes by location and posts them to its website. The website features interactive mapping of the top 25, 50, 100, or 200 crash locations (i.e., intersections with the highest number of crashes) in the unincorporated county for any given month. Table 8 shows the top 50 intersection crash locations.

Hillsborough County ITS Master Plan Update
17
TABLE 8 TOP 50 INTERSECTION CRASH LOCATIONS
Street Name Intersecting Street Crash Rate
No. of Crashes
SR 60 Brandon Town Center Dr 1.82 195 US 301 Causeway Blvd 1.61 143 US 92 56th St 1.6 139 US 41 40th St 1.68 137 US 301 Gibsonton Dr 2.31 135 SR 582 (Fowler Ave) Morris Bridge Rd 2.39 123 US 41 Fletcher Ave 1.54 119 CR 676 Falkenburg Rd 1.65 112 SR 580 56th St 1.37 109 US 41 Busch Blvd 1.33 107 US 41 Bearss Ave 1.35 100 US 92 Orient Rd 1.48 84 US 301 Big Bend Rd 4.23 82 SR 39 James L Redman Pkwy 1.91 72 US 41 Causeway Blvd 1.57 72 SR 45 Columbus Dr 2.01 64 US 301 Sun City Center Blvd 2.17 53 Armenia Ave Sligh Ave 1.42 53 US 41 Symmes Rd 2.32 51 US 301 Symmes Rd 2.17 51 US 41 Business Kennedy Blvd 1.5 50 SR 676 78th St 1.31 47 US 92 County Road 579 1.76 46 SR 60 Turkey Creek Rd 1.42 45 SR 585 (N 22nd) Palm Ave 3.83 43 SR 585 (N 22nd) 7th Ave 1.33 43 US 92 Branch Forbes Rd 1.83 41 SR 45 21st Ave 1.48 41 SR 45 Lake Ave 1.49 37
TABLE 8 (CONTINUED) TOP 50 INTERSECTION CRASH LOCATIONS
Street Name Intersecting Street Crash Rate
No. of Crashes
SR 574 Forbes Rd 1.8 34 Sligh Ave Anderson Rd 1.37 34 US 41 Shell Point Rd 1.73 33 CR 579A Bell Shoals Rd 1.38 33 SR 39 Sam Allen Rd 1.56 32 US 41 Business 17th Ave 2.58 30 CR 573 Palm River Rd 1.5 30 US 41 Business Jefferson St 1.56 29 Big Bend Rd Summerfield Blvd 1.36 26 Jefferson St Whiting St 1.57 25 Providence Rd Providence Lakes Blvd 2.77 24 CR 640 Miller Rd 1.66 24 15th St 131st Ave 2.09 23 SR 585 (N 22nd) Columbus Dr 2.04 23 SR 585 (N 22nd) 21st St 1.97 18 US 92 Williams Rd 1.6 15 SR 585 (N 22nd) 17th Ave 1.43 15 US 301 19th Ave Ne 1.38 14 Jefferson St Cass St 1.9 8 Durant Rd Saint Cloud Ave 1.38 8 Riverview Dr Krycul Ave 1.47 6
Sources: Hillsborough County MPO’s 2035 LRTP; Safety Technical Report, 2009.
Analysis of the 50 high-crash intersections revealed that there were a total of 19 fatal crashes and 1,786 injury crashes. The general types of crashes at the intersection nodes included: rear end (46 percent), angle (25 percent), left-turn (10 percent), head-on (3 percent), pedestrian (3 percent), truck (4 percent), right-turn (2 percent), and bicycle (less than 1 percent). ‘Other’ includes crash types not reported in the crash database.

Hillsborough County ITS Master Plan Update
18
The most common crash causes involved aggressive driving (50 percent), driving at night (35 percent), followed by red light running (9 percent), driving under the influence (DUI) (4 percent) and speeding (1 percent). A total of 3,159 crashes occurred during the day and 1,465 occurred at night. As noted in the previous section, crashes are a major contributor to non-recurrent roadway congestion.
2.5 CITY OF TAMPA/THEA
The City of Tampa operates the THEA TMC and the THEA’s Reversible Express Lanes (REL) on the Selmon Crosstown Expressway. Live video is available for the Expressway but it is not continuously monitored nor is it recorded.
Video cameras are used mainly for traffic management (e.g., to determine the presence of a malfunctioning traffic light or a stalled vehicle). If TMC staff happens to observe a crash, then a Road Ranger and/or other emergency service may be dispatched. The TMC does not have readily available performance or operational reports or data.
CONGESTION AND SAFETY DATA FROM OTHER CITY OF TAMPA SOURCES
The City’s Transportation Division periodically collects 24‐hour traffic count data and compiles an inventory of roadway conditions within the City. It is also responsible for the traffic signals on city‐maintained roads and; therefore, collects intersection turning movement counts, as well as signal timing records. The City also maintains crash records for roads within the City limits. Table 9 shows the 50 most congested roads in the City’s inventory, based on automobile LOS and v/c ratio.
The City also maintains crash records for roads within the city limits. This information was used to identify the top 40 crash locations in the City, shown in Table 10.
TABLE 9 50 MOST CONGESTED ROADS IN TAMPA
On From – To (S to N or W to E)
Date of Count
Existing Daily Vol.
Existing LOS D
Capacity
Existing v/c (vol/ LOS D
Capacity)
Existing LOS
Existing PM Peak
Vol.
Cross Creek Blvd
Kinnan St to Morris Bridge Rd 01/20/08 29,715 10,300 2.75 F 2,995
I-275 City limits to Kennedy Blvd 06/01/07 155,500 68,900 2.03 F 10,514
I-275 City limits to Kennedy Blvd 06/01/07 147,000 68,900 2.03 F 9,981
I-275 Armenia Ave/Howard Ave to Ashley Dr 06/01/07 204,000 103,400 1.85 F 12,100
I-275 Ashley/Scott Ex to Ashley NB On-Ramp 06/01/07 201,000 103,400 1.85 F 12,100
I-4 22nd St to 40th St 06/01/07 131,500 68,900 1.82 F 9,950
CR 581 I-75 to (Dona Michelle) Hunter’s Green Dr 01/20/08 64,827 34,200 1.81 F 5,196
Westshore Blvd
Gandy Blvd (El Parado) to Bay to Bay Blvd 02/10/08 22,039 11,680 1.80 F 1,671
I-275 Himes Ave to Armenia/Howard 06/01/07 191,500 103,400 1.76 F 11,887
I-275 Kennedy Blvd to Memorial Hwy 06/01/06 125,399 68,900 1.73 F 10,543
I-275 Dale Mabry Hwy to Himes Ave 06/01/07 187,000 103,400 1.72 F 10,480
I-275 Lois Ave to Dale Mabry Hwy 06/01/07 175,500 103,400 1.62 F 9,772
I-4 40th St to 50th St 06/01/07 116,500 68,900 1.61 F 10,800 I-275 Sligh Ave to Bird St 06/01/07 172,500 103,400 1.59 F 11,600
I-275 Westshore Blvd to Lois Ave 06/01/07 169,500 103,400 1.56 F 9,261
Himes Ave Hillsborough Ave to Henry (City Limits) 12/11/07 16,623 10,300 1.54 F 1,431
Kennedy Blvd
Henderson Blvd to MacDill Ave 08/17/08 46,912 29,400 1.52 F 3,962
I-275 I-4 to MLK Jr Blvd 06/01/07 164,500 103,400 1.52 F 11,100
Florida Ave Bougainvillea Ave to Country Club Dr 07/06/08 25,480 16,100 1.51 F 2,166
I-275 Hillsborough Ave to Sligh Ave 06/01/07 163,000 103,400 1.50 F 11,000
I-275 MLK Jr Blvd to Hillsborough Ave 06/01/07 162,500 103,400 1.50 F 10,900
CR 581 City limits to Amberly Dr 01/20/08 53,666 34,200 1.49 F 4,237 I-4 50th St to City limits 06/01/06 107,000 68,900 1.48 F 8,239 I-275 Bird St to Busch Blvd 06/01/07 156,500 103,400 1.44 F 10,553 Howard Ave
Bayshore Blvd (Morrison Ave) to Swann Ave 06/10/08 15,332 10,300 1.42 F 1,239
Memorial Hwy Kennedy Blvd to I-275 08/05/07 72,520 49,214 1.40 F 5,329
NW X-Way FRT E
Courtney Campbell to Hillsborough Ave 04/08/02 33,500 22,800 1.37 F 512

Hillsborough County ITS Master Plan Update
19
TABLE 9 (CONTINUED) 50 MOST CONGESTED ROADS IN TAMPA
On From – To (S to N or W to E)
Date of Count
Existing Daily Vol.
Existing LOS D
Capacity
Existing v/c (vol/ LOS D
Capacity)
Existing LOS
Existing PM Peak
Vol.
Maritime Blvd Hookers Point to 22nd St 02/17/08 14,787 10,300 1.37 F 1,224
I-275 Memorial Hwy to Westshore Blvd 06/01/07 147,000 103,400 1.35 F 9,018
CR 581 Amberly Dr to Tampa Palms 01/20/08 53,626 37,800 1.35 F 4,483
Franklin St Garrison Channel to Ice Palace Dr (E) 01/07/08 14,610 10,300 1.35 F 1,323
Westshore Blvd
Bay to Bay Blvd (Swann) to Azeele St 02/10/08 16,480 11,680 1.34 F 1,424
Swann Ave MacDill Ave to Howard Ave 06/19/08 14,185 10,300 1.31 F 1,240
MLK Jr Blvd
Central Ave to Marguerite St 07/27/08 34,644 25,500 1.29 F 3,102
Lois Ave Azeele St to Kennedy Blvd 06/24/08 13,893 10,300 1.28 F 1,506
CR 581 Hunter’s Green Dr to New Tampa Blvd/Cross Creek 01/20/08 46,034 34,200 1.28 F 3,777
7th Ave 21st St to 22nd St 07/15/08 13,858 10,300 1.28 F 1,155 Westshore Blvd
MLK Jr Blvd to Hillsborough Ave 02/10/08 15,675 11,680 1.28 F 1,560
Dale Mabry Hwy Swann Ave to Azeele St 06/01/08 45,293 34,200 1.26 F 3,483
Westshore Blvd I-275 to Cypress St 02/10/08 40,605 31,100 1.24 F 3,452
I-4 I-275 to 22nd St 06/01/07 134,500 103,400 1.24 F 9,100 Dale Mabry Hwy
Bay to Bay Blvd (Neptune St) to Henderson Blvd 06/08/08 38,196 29,400 1.24 F 3,031
Columbus Dr 50th St to Broadway Ave 05/04/08 13,375 10,300 1.24 F 1,048
NW X-Way (Toll Rd)
Courtney Campbell to Memorial Hwy 01/01/96 136,000 103,400 1.23 F 8,370
Kennedy Blvd
Lois Ave to Dale Mabry Hwy 08/03/08 37,556 29,400 1.22 F 3,102
I-275 Orange/Jefferson Ramp to I-4 04/08/02 134,500 103,400 1.22 F 9,278
MLK Jr Blvd
Himes Ave to MacDill Ave 07/27/08 32,452 25,500 1.21 F 2,803
I-275 Kennedy Blvd to Memorial Hwy 06/01/07 86,500 68,900 1.20 E 6,633
Lois Ave MLK Jr Blvd to Hillsborough Ave 06/24/08 12,827 10,300 1.19 E 1,197
Howard Ave Swann Ave to Azeele St 06/10/08 12,811 10,300 1.18 E 940
Source: City of Tampa Inventory of Roadway Conditions (August 2010).
TABLE 10 TOP 40 TAMPA CRASH LOCATIONS – 2009
Rank Intersection Location Total Crashes
1 40th St & Hillsborough Ave 37 2 Armenia Ave & Hillsborough Ave 23 3 22nd St & Hillsborough Ave 21 4 Hillsborough Ave & Himes Ave 21 5 Florida Ave & Waters Ave 20 6 Columbus Dr & Dale Mabry Hwy 20 7 Florida Ave & Hillsborough Ave 19 8 34th St & Hillsborough Ave 19 9 Busch Blvd & Nebraska Ave 18
10 Habana Ave & Hillsborough Ave 18 11 Ashley Dr & Kennedy Blvd 18 12 Hillsborough Ave & Lois Ave 17 13 Gandy Blvd & Manhattan Ave 17 14 50th St & Adamo Dr 16 15 Hillsborough Ave & Nebraska Ave 15 16 Cypress St & Dale Mabry Hwy 15 17 Rome Ave & Waters Ave 15 18 Fowler Ave & Nebraska Ave 15 19 Dr MLK Jr Blvd & Marguerite St 15 20 Dale Mabry Hwy & Hillsborough Ave 15 21 Armenia Ave & Waters Ave 15 22 30th St & Busch Blvd 15 23 Busch Blvd & Florida Ave 14 24 15th St & Fowler Ave 14 25 Busch Blvd & I-275 13 26 Kennedy Blvd & West Shore Blvd 13 27 Dale Mabry Hwy & Kennedy Blvd 13 28 Dale Mabry Hwy & Gandy Blvd 13 29 Dr MLK Jr Blvd & Nebraska Ave 12 30 Armenia Ave & Sligh Ave 12 31 50th St & Broadway Ave 12 32 Hillsborough Ave & I-275 11 33 I-275 & Sligh Ave 11 34 Dr MLK Jr Blvd & Habana Ave 11 35 Cherokee Ave & Hillsborough Ave 11 36 Boulevard & Dr MLK Jr Blvd 11 37 Boulevard & Cleveland St 10 38 Hillsborough Ave & MacDill Ave 10 39 Nebraska Ave & Sligh Ave 10 40 Dale Mabry Hwy & Euclid Ave 10
Source: City of Tampa Inventory of Crash Locations (2009).

Hillsborough County ITS Master Plan Update
20
2.6 MULTIMODAL ELEMENTS
In addition to the assessment of the performance of the roadway network in support of automobile traffic, assessment of the conditions present affecting multimodal portions of the transportation system are important as ITS solutions may be directed to enhance the function of the multimodal system elements. Multimodal options are important particularly in areas where existing automobile facilities are constrained as the multimodal elements provide opportunity for increased overall efficiency of the corridor.
TRANSIT –HART
HART currently operates 29 local bus routes, eleven commuter express routes, a 3-mile street car system, and a paratransit service within Hillsborough County. In 2010, HART supported approximately 12.2 million bus passengers. By 2016, the transit system is anticipated to support 14.7 million riders.
Currently, the vast majority of transit trips are carried by busses that operate in mixed traffic on existing roadways. This makes the transit trips susceptible to many of the same types of traffic delay that impact automobile traffic. In 2011, 9.8 percent of HART’s daily transit runs were delayed by congestion. Figure 6 depicts the percentage of transit run delays caused by congestion.
BICYCLE AND PEDESTRIAN MOBILITY
Currently, many assessments of the pedestrian and bicycle network in Hillsborough County describe a system that is fragmented and unsafe. A report published in 2011 by Transportation for America indicates that between the years 2000 and 2009, 905 pedestrians were killed in the Tampa/St. Petersburg/Clearwater region. The report also developed a pedestrian danger index which ranked Tampa as the 2nd most dangerous major metropolitan city for pedestrians in the U.S. ITS solutions may be used to mitigate many of the conditions that lead to bicycle and pedestrian crashes. The following identifies the high-crash location within the Hillsborough County and potential focus of ITS investment.
FIGURE 6 IMPACT OF CONGESTION ON HART SERVICE
Source: Congestion Management and Crash Mitigation Process, 2012.
Table 11 displays the top 10 bicycle crash locations on the MPO’s major road network by intersection and segment. As indicated in the 2005-2007 bicycle crash data, a total of 13 fatality crashes involving bicyclists occurred on the MPO Major Road Network during the 3-year time period. Additionally, four other fatal crashes occurred off the MPO network.

Hillsborough County ITS Master Plan Update
21
TABLE 11 TOP TEN BICYCLE CRASH LOCATIONS (2005-2007)
Facility Location Total
Bicycle Crashes
CR 584 (Waters Ave) at Sheldon Rd Intersection 7 SR 582 (Fowler Ave at 22nd St/University Square Mall Intersection 6 CR 584 (Waters Ave) at Hanley Rd Intersection 5 US 41 Business at Fletcher Ave Intersection 5 SR 580 (Hillsborough Ave) at Lois Ave Intersection 5 US 92 (Hillsborough Ave) at Armenia Ave Intersection 4 US 92 (Hillsborough Ave) at 30th St Intersection 4 CR 582A (Fletcher Ave) at 15th St Intersection 4 CR 589 (Sheldon Rd) from Mohr Rd to Waters Ave Segment 4 US 41 at Fowler Ave Intersection 4
Sources: Hillsborough County MPO’s 2035 LRTP; Safety Technical Report, April 2009.
The largest number of bicycle crashes occurred at the CR 584 (Waters Avenue)/Sheldon Road intersection as shown in Table 11. Overall, the total number of bicycle crashes over the 3-year period was 534.
Bicycle crashes are concentrated in the City of Tampa, where auto ownership/usage is lower and people are generally more bicycle dependent. Crashes on major roads point to the use of bicycles for commuting and utilitarian trips on arterials such as:
• Nebraska Avenue, Florida Avenue, and Kennedy Boulevard in the City of Tampa;
• Waters Avenue and Hillsborough Avenue in the unincorporated County; and • Roads in the University of South Florida area, East Tampa.
CRASHES INVOLVING PEDESTRIANS
Table 12 displays the total number of pedestrian crashes by intersection and segment. A total of 100 fatal crashes involving pedestrians occurred during the three-year time period. The largest number of pedestrian crashes occurred at the CR 582A (Fletcher Avenue)/22nd Street intersection. Three of the top 10 pedestrian crash locations occurred at intersections on Fletcher Avenue. Overall, the total number of pedestrian crashes over the 3-year period was 941.
TABLE 12 TOP TEN PEDESTRIAN CRASH LOCATIONS (2005-2007)
Facility Location Total
Pedestrian Crashes
CR 582A (Fletcher Ave) at 22nd St Intersection 11 SR 580 (Hillsborough Ave) from Sawyer Rd to George Rd Segment 7
CR 582A (Fletcher Ave) at 15th St Intersection 7 22nd St at Bearss Ave Intersection 7 CR 581/Bruce B Downs Blvd at Fletcher Ave Intersection 7 22nd St at 131st Ave Intersection 6 SR 583 (56th St) at Sligh Ave Intersection 6 CR 584 (Waters Ave) at Hanley Rd Intersection 5 SR 580 (Busch Blvd) at 56th St Intersection 5 SR 580 (Hillsborough Ave) at Lois Ave Intersection 5
Sources: Hillsborough County MPO’s 2035 LRTP; Safety Technical Report, April 2009.
2.7 FACILITY TYPE
In addition to the many roadway performance measures used to identify potential areas for the application of ITS solutions, additional factors related to roadway function help to focus the location of planned improvements. The application of ITS improvements is often focused on roadways holding special importance to the transportation system where improved performance of the facility may have a major effect on safety or the economy. Examples of this type of roadway are discussed below and include those roadways that carry a large share of the daily traffic volume, support high levels of freight traffic, function as linkages to intermodal and activity centers, serve as regional connectors, support major transit routes, serve as emergency evacuation routes, or function as critical infrastructure components.
ROADWAY FUNCTIONAL CLASSIFICATION
Federal functional classification divides roads into groups based on the character of service they are intended to provide. The functional classification defines the role that any particular road plays in serving the flow of trips through a network. The higher the classification of the facility, the greater role the facility serves in the support of travel movements between activity centers. The classifications of roadways in urbanized areas such as Tampa include arterial, collector, and local roads. However, Figure 7 depicts only arterial and collector facilities.
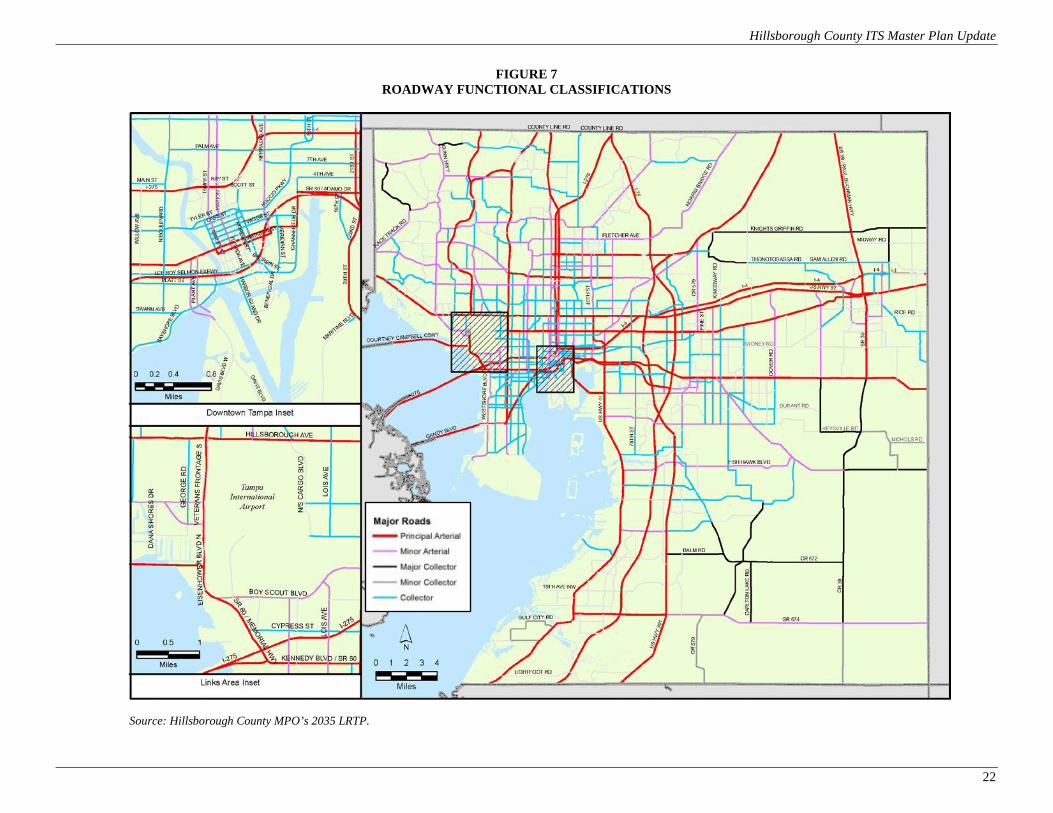
Hillsborough County ITS Master Plan Update
22
FIGURE 7 ROADWAY FUNCTIONAL CLASSIFICATIONS
Source: Hillsborough County MPO’s 2035 LRTP.

Hillsborough County ITS Master Plan Update
23
In addition to functional classification, Average Annual Daily Traffic (AADT) volume provides an indication of the facilities that serve as primary thoroughfares within the roadway network. Table 13 provides a listing of those facilities within Hillsborough County that carry an average greater than 100,000 vehicles per day (vpd).
2.8 FREIGHT/TRUCKING ROUTES
Among the most important economic elements of the roadway system are those facilities that support goods movement. Based on figures cited in the ongoing Tampa Bay Goods Movement Study, regionally, goods movement supports 9,800 business, 164,000 jobs and nearly $7 billion in payroll. Truck movements are time-sensitive and dependent upon just-in-time delivery, delays and disruptions to the supply chain ultimately lead to negative impacts on the economy.
The goods movement roadway system in Hillsborough County consists of three overlapping and interconnected layers:
• Florida State Intermodal System (SIS), • Regional Goods Movement Corridors, and • Designate Local Truck Routes.
Table 14 identifies the major goods movement corridors within Hillsborough County including SIS, regional, and local routes.
Figure 8 identifies the Florida SIS Facilities, while Figure 9 identifies both the regional freight corridors and local truck routes.
TABLE 13 ROADWAY SEGMENTS WITH AADT GREATER THAN 100,000 VPD
On Street From To AADT I-275 Armenia Ave Ashley St 192,000 I-275 Ashley St Jefferson St NB 169,000 I-275 Bird St Busch Blvd 151,500 I-275 Busch Blvd Fowler Ave 140,000 I-275 City Limits Fletcher Ave 115,000 I-275 Dale Mabry Hwy Himes Ave 170,500 I-275 Floribraska Ave MLK Blvd 147,000 I-275 Fowler Ave City Limits 115,000 I-275 Hillsborough Ave Sligh Ave 156,500 I-275 Himes Ave Armenia Ave 179,500 I-275 I-4 Interchange Floribraska Ave 1,690,500 I-275 Jefferson St NB I-4 Interchange 100,000 I-275 Lois Ave Dale Mabry Hwy 163,000 I-275 MLK Blvd Hillsborough Ave 153,500 I-275 Memorial Hwy Westshore Blvd 135,500 I-275 Pinellas County Kennedy Blvd 148,000 I-275 Sligh Ave Bird St 167,000 I-275 Westshore Blvd Lois Ave 176,500 I-4 22nd St I-4 Connector 116,500 I-4 40th St 50th St 151,000 I-4 50th St City Limits 121,000 I-4 Alexander St SR 39 103,000 I-4 Branch Forbes Rd Thonotosassa Rd 110,000 I-4 Bypass Canal I-75 136,500 I-4 City Limits MLK Blvd 121,000 I-4 CR 579 McIntosh Rd 127,000 I-4 I-275 22nd St 164,000 I-4 I-4 Connector 40th St 116,500 I-4 I-75 CR 579 136,500 I-4 MLK Blvd Orient Rd 122,000 I-4 McIntosh Rd Branch Forbes Rd 117,932 I-4 Orient Rd US 301 113,000 I-4 Park Rd Polk County 105,000 I-4 SR 39 Park Rd 103,000 I-4 US 301 Bypass Canal 136,500 I-75 Fowler Ave Fletcher Ave 108,500 I-75 Gibsonton Dr US 301 111,500 I-75 I-4 Fowler Ave 125,000 I-75 MLK Blvd I-4 146,000 I-75 SR 60 MLK Blvd 132,226 SR 60/Memorial Hwy Boy Scout Blvd Courtney Campbell Cswy 158,000 SR 60/Memorial Hwy I-275 Boy Scout Blvd 158,000
Source: FDOT Counts.

Hillsborough County ITS Master Plan Update
24
TABLE 14 GOODS MOVEMENT ROADWAY CORRIDORS
Corridor From To SIS FAC
I-75 Manatee County Line
Pasco County Line Yes • Port of Tampa
• I-75/Sabal Park
I-275 Pinellas County Line
Pasco County Line Yes • Anderson Rd/TIA Industrial
• Port of Tampa
I-4 I-275 Polk County Line Yes
• Port of Tampa • East Central Tampa
Industrial • Southeast Tampa Industrial • I-75/Sabal Park Industrial • East Plant City Industrial
US 41 Bearss Ave/ Nebraska Ave
Pasco County Line No • None
US 41 I-4 Manatee County Line No
• Rockport, Port Sutton, Pendola Point
• Alafia River • Big Bend/Port Redwing • I-75/Sabal Park • East Central Tampa
Industrial
US 92 Pinellas County Line
Lee Roy Selmon Crosstown Expwy No • Port of Tampa
US 301 Manatee County Line
Pasco County Line No
• I-75/Sabal Park Industrial • Southeast Tampa Industrial • East Central Industrial
Memorial Hwy/Veterans Expwy
I-275 Pasco County Line Yes • Anderson Rd/TIA Industrial
Gandy Blvd/ Lee Roy Selmon Crosstown Expwy
Gandy Bridge I-75 Yes
• Port Tampa • Port of Tampa • Southeast Tampa Industrial • I-75/Sabal Park Industrial
I-4/Lee Roy Selmon Crosstown Expwy Connector
22nd St I-4 Yes • Port of Tampa
SR 60 20th St Polk County Line Yes
• Port of Tampa • Southeast Tampa Industrial
and CSX Intermodal • I-75/Sabal Park Industrial
SR 39 via Park Rd SR 60 Pasco County
Line No • East Plant City Industrial • Mining Activity north of
Plant City
TABLE 14 (CONTINUED) GOODS MOVEMENT ROADWAY CORRIDORS
Corridor From To SIS FAC
SR 674 US 41 SR 39 No • Big Bend/Port Redwing • Hillsborough/Polk County
mines Causeway Blvd SR 60 US 301 Yes • Port of Tampa
CR 672 US 41 US 301 No • Big Bend/Port Redwing
Hillsborough Ave
Pinellas County Line I-4/US 301 No
• Anderson Rd/TIA Industrial • East Central Tampa
Industrial Branch Forbes Rd/US 92/ Turkey Creek Rd
SR 574 I-4 No • Plant City Airport Industrial
Orient Rd SR 60 I-4 No • Southeast Tampa Industrial and CSX Intermodal
Source: Hillsborough County MPO’s 2035 LRTP.

Hillsborough County ITS Master Plan Update
25
FIGURE 8 FLORIDA SIS FACILITIES WITHIN HILLSBOROUGH COUNTY
Source: Florida’s Strategic Intermodal System Maps and Lists of Designated Facilities for District 7- Map A.

Hillsborough County ITS Master Plan Update
26
FIGURE 9 FREIGHT INFRASTRUCTURE IN TAMPA BAY
Source: Tampa Regional Goods Movement Study.
2.9 FREIGHT ACTIVITY AND INTERMODAL CENTERS
Closely related to the SIS and goods movement corridors are those facilities that they are designated to service. The following figures depict the County’s freight activity and intermodal centers. The roadway network connecting to these facilities provides opportunity for the inclusion of ITS systems.
Those facilities depicted in Figure 10 are the primary freight activity centers (FACs) within Hillsborough County and the major intermodal centers within those centers. FACs are areas of the county within which multiple freight generators are located.
FIGURE 10 FREIGHT ACTIVITY CENTERS
Source: Tampa Regional Goods Movement Study.
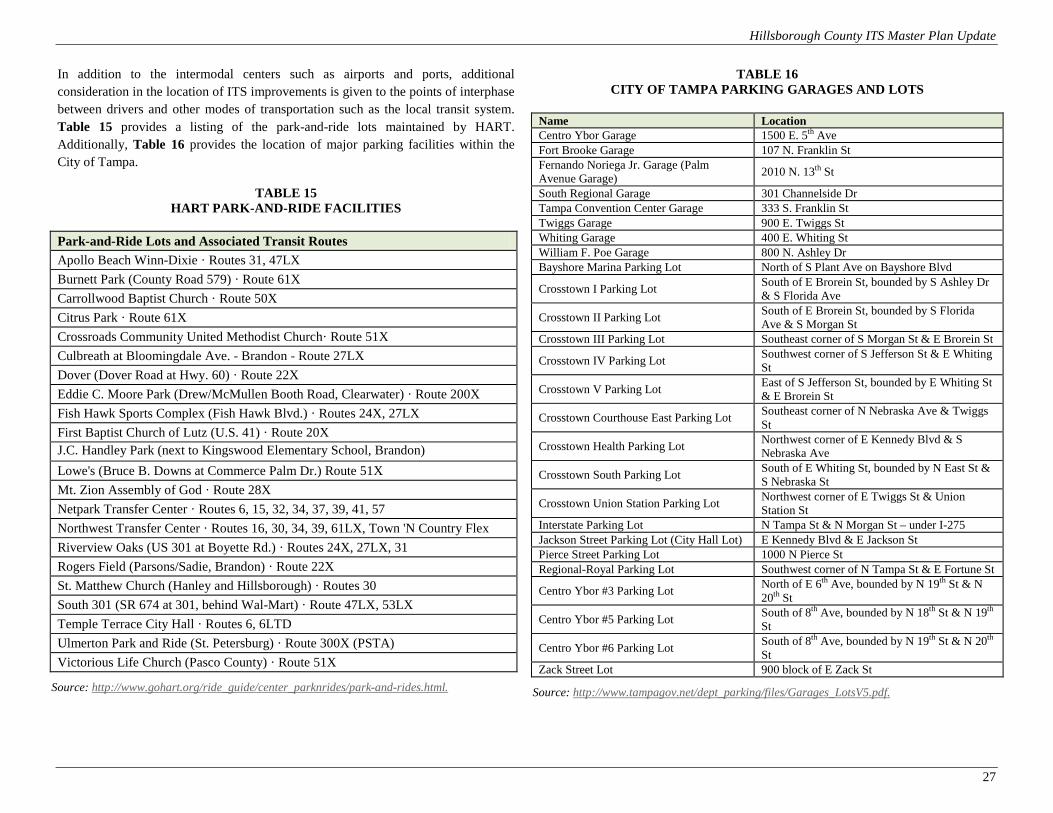
Hillsborough County ITS Master Plan Update
27
In addition to the intermodal centers such as airports and ports, additional consideration in the location of ITS improvements is given to the points of interphase between drivers and other modes of transportation such as the local transit system. Table 15 provides a listing of the park-and-ride lots maintained by HART. Additionally, Table 16 provides the location of major parking facilities within the City of Tampa.
TABLE 15 HART PARK-AND-RIDE FACILITIES
Park-and-Ride Lots and Associated Transit Routes Apollo Beach Winn-Dixie · Routes 31, 47LX Burnett Park (County Road 579) · Route 61X Carrollwood Baptist Church · Route 50X Citrus Park · Route 61X Crossroads Community United Methodist Church· Route 51X Culbreath at Bloomingdale Ave. - Brandon - Route 27LX Dover (Dover Road at Hwy. 60) · Route 22X Eddie C. Moore Park (Drew/McMullen Booth Road, Clearwater) · Route 200X Fish Hawk Sports Complex (Fish Hawk Blvd.) · Routes 24X, 27LX First Baptist Church of Lutz (U.S. 41) · Route 20X J.C. Handley Park (next to Kingswood Elementary School, Brandon)
2 2 Lowe's (Bruce B. Downs at Commerce Palm Dr.) Route 51X Mt. Zion Assembly of God · Route 28X Netpark Transfer Center · Routes 6, 15, 32, 34, 37, 39, 41, 57 Northwest Transfer Center · Routes 16, 30, 34, 39, 61LX, Town 'N Country Flex Riverview Oaks (US 301 at Boyette Rd.) · Routes 24X, 27LX, 31 Rogers Field (Parsons/Sadie, Brandon) · Route 22X St. Matthew Church (Hanley and Hillsborough) · Routes 30 South 301 (SR 674 at 301, behind Wal-Mart) · Route 47LX, 53LX Temple Terrace City Hall · Routes 6, 6LTD Ulmerton Park and Ride (St. Petersburg) · Route 300X (PSTA) Victorious Life Church (Pasco County) · Route 51X
Source: http://www.gohart.org/ride_guide/center_parknrides/park-and-rides.html.
TABLE 16 CITY OF TAMPA PARKING GARAGES AND LOTS
Name Location Centro Ybor Garage 1500 E. 5th Ave Fort Brooke Garage 107 N. Franklin St Fernando Noriega Jr. Garage (Palm Avenue Garage) 2010 N. 13th St
South Regional Garage 301 Channelside Dr Tampa Convention Center Garage 333 S. Franklin St Twiggs Garage 900 E. Twiggs St Whiting Garage 400 E. Whiting St William F. Poe Garage 800 N. Ashley Dr Bayshore Marina Parking Lot North of S Plant Ave on Bayshore Blvd
Crosstown I Parking Lot South of E Brorein St, bounded by S Ashley Dr & S Florida Ave
Crosstown II Parking Lot South of E Brorein St, bounded by S Florida Ave & S Morgan St
Crosstown III Parking Lot Southeast corner of S Morgan St & E Brorein St
Crosstown IV Parking Lot Southwest corner of S Jefferson St & E Whiting St
Crosstown V Parking Lot East of S Jefferson St, bounded by E Whiting St & E Brorein St
Crosstown Courthouse East Parking Lot Southeast corner of N Nebraska Ave & Twiggs St
Crosstown Health Parking Lot Northwest corner of E Kennedy Blvd & S Nebraska Ave
Crosstown South Parking Lot South of E Whiting St, bounded by N East St & S Nebraska St
Crosstown Union Station Parking Lot Northwest corner of E Twiggs St & Union Station St
Interstate Parking Lot N Tampa St & N Morgan St – under I-275 Jackson Street Parking Lot (City Hall Lot) E Kennedy Blvd & E Jackson St Pierce Street Parking Lot 1000 N Pierce St Regional-Royal Parking Lot Southwest corner of N Tampa St & E Fortune St
Centro Ybor #3 Parking Lot North of E 6th Ave, bounded by N 19th St & N 20th St
Centro Ybor #5 Parking Lot South of 8th Ave, bounded by N 18th St & N 19th St
Centro Ybor #6 Parking Lot South of 8th Ave, bounded by N 19th St & N 20th St
Zack Street Lot 900 block of E Zack St
Source: http://www.tampagov.net/dept_parking/files/Garages_LotsV5.pdf.
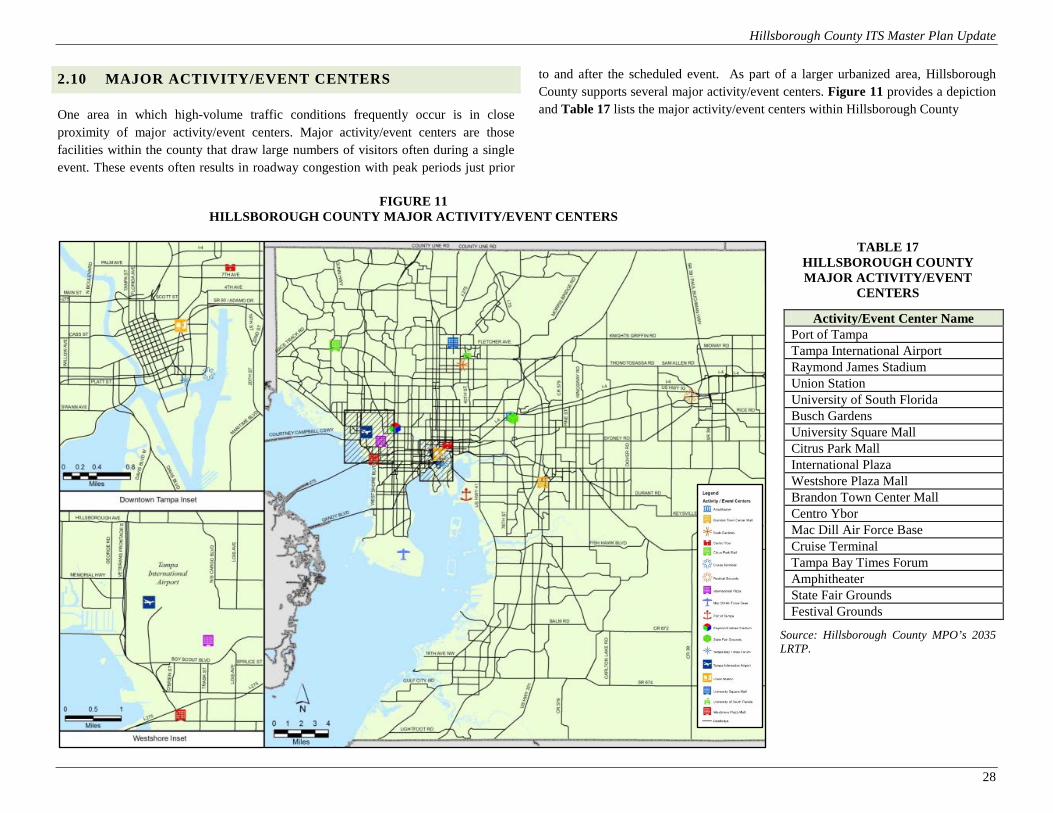
Hillsborough County ITS Master Plan Update
28
2.10 MAJOR ACTIVITY/EVENT CENTERS
One area in which high-volume traffic conditions frequently occur is in close proximity of major activity/event centers. Major activity/event centers are those facilities within the county that draw large numbers of visitors often during a single event. These events often results in roadway congestion with peak periods just prior
to and after the scheduled event. As part of a larger urbanized area, Hillsborough County supports several major activity/event centers. Figure 11 provides a depiction and Table 17 lists the major activity/event centers within Hillsborough County
FIGURE 11
HILLSBOROUGH COUNTY MAJOR ACTIVITY/EVENT CENTERS
TABLE 17 HILLSBOROUGH COUNTY MAJOR ACTIVITY/EVENT
CENTERS
Source: Hillsborough County MPO’s 2035 LRTP.
Activity/Event Center Name Port of Tampa Tampa International Airport Raymond James Stadium Union Station University of South Florida Busch Gardens University Square Mall Citrus Park Mall International Plaza Westshore Plaza Mall Brandon Town Center Mall Centro Ybor Mac Dill Air Force Base Cruise Terminal Tampa Bay Times Forum Amphitheater State Fair Grounds Festival Grounds

Hillsborough County ITS Master Plan Update
29
2.11 CRITICAL INFRASTRUCTURE AND KEY RESOURCES
Critical Infrastructure/Key Resources (CI/KRs) are essential to the quality of life of the County’s citizens and to its economic vitality. Many of these facilities are included as part of the listings of major activity centers, FACs, and intermodal center. However, CI/KR infrastructure also includes key connectors within the transportation network such as the major bridges connecting Hillsborough and Pinellas Counties, as well as additional goods transmission/transportation elements such as pipelines and railroads. The key CI/KR elements identified as part of the 2035 LRTP update process include the assets listed in Table 18.
TABLE 18 CRITICAL INFRASTRUCTURE/KEY RESOURCES
Critical Infrastructure/Key Resource (CI/KR)
1. Interstate Systems (I‐4, I‐75, I‐275) 2. U.S. Highways (e.g., U.S. 92, U.S. 301) 3. State Roads (e.g., S.R. 60) 4. Selmon Crosstown and Veterans Expressways 5. Tampa International Airport 6. MacDill Air Force Base 7. Peter O Knight Airport 8. Plant City Airport 9. Tampa Executive Airport 10. Port of Tampa 11. Howard Frankland Bridge 12. Freight Activity Centers 13. Rail Networks 14. Pipeline Network 15. HART Transit System
Source: Hillsborough County MPO’s 2035 LRTP.
2.12 EVACUATION ROUTES
A major safety component of the transportation system centers on the network of emergency evacuation routes. Often, these facilities serve host to exceptional volumes of traffic when supporting an evacuation event. Often, normal function of the roadway will be suspended to allow for additional capacity in a single direction. Additionally, travelers utilizing these routes may be unfamiliar with area of the state to which they are directed. The potential of ITS to support the function roadways as evacuation routes is high. The role these roadways play is critical in the health and safety of the public. Figure 12 shows the current evacuation routes for the County and region.
FIGURE 12 CRITICAL INFRASTRUCTURE/KEY RESOURCES
Source: Hillsborough County MPO’s 2035 LRTP.

Hillsborough County ITS Master Plan Update
30
SECTION 3.0 | EXISTING SYSTEMS AND COMMUNICATIONS INVENTORY
Key ITS stakeholders were interviewed, to provide an update to their existing system and infrastructure inventory and gain a better understanding of their current systems and operations.
Inventories of ITS and communications systems and infrastructure are documented and maintained in different ways and at different levels of detail between agencies. The agencies with ITS jurisdiction within Hillsborough County include the FDOT, Hillsborough County, City of Tampa, City of Plant City, and City of Temple Terrace. Existing systems and infrastructure information were obtained through stakeholder meetings and correspondence, as well as through review of existing documentation as described in Section 1.4 of this document.
3.1 FDOT DISTRICT SEVEN
TAMPA SUNGUIDE® CENTER (REGIONAL TMC)
The TBSG Center which became operational in 2007 is a state-of-the-art command facility for managing mobility and promoting safety on major roadways throughout the Tampa Bay area. Using intelligent devices and communications, information on roadway conditions and incidents is efficiently relayed to the control center where appropriate action can be initiated immediately. The facility features a 20-screen video wall, where operators monitor and control ITS devices along the interstates throughout Hillsborough, Pasco, Hernando, Pinellas, Polk, and Manatee Counties (includes US 301, SR 60 at Tampa International Airport, Gandy Boulevard, and the Sunshine Skyway corridor), with the use of closed-circuit TV (CCTV) cameras, DMS signage, vehicle traffic detectors, 511 services, and the Road Rangers.
The TBSG Center is also home to the FDOT District Seven Emergency Operations Center (EOC), which coordinates and responds to emergencies and catastrophic events and serves as a central communications hub for the State Emergency Response Team during crises events. The center also includes FHP dispatch, Florida Fish and Wildlife Service (FWS), FDOT Motor Carrier Compliance Office, and the Florida Department of Law Enforcement collocated within this facility complex.
The TBSG Center is located at the FDOT District Seven Headquarters on McKinley Drive in north Tampa and provides freeway management on sections of I-275, I-75, and I-4. This two-story building has 19,000 square feet of floor area and is a hardened facility, allowing operations to continue before, during, and after hurricanes or other severe storms.
The center is operational 24/7/365 and currently has 14 operations staff members (includes nine operators, three shift supervisors, one RTMC manager, and one assistant RTMC manager), which are responsible for utilizing the RTMC as an effective tool for transportation management. Current staffing levels are considered adequate and would grow as workload dictates. The facility was also designed for growth in mind and has space for up to 20 operators and additional equipment, as needed.
ITS DEVICES
FDOT District Seven currently operates and manages multiple ITS devices and subsystems, as shown in Table 19. Approximately 65 percent of the interstates within the District are currently instrumented with ITS to some level and on-going and planned deployment initiatives and various maintenance activities will be filling in the gaps. Up to this point, the focus for FDOT has been on the interstates; however, they are currently evaluating deployment (of arterial DMSs) along arterials providing a better integrated and operational system.

Hillsborough County ITS Master Plan Update
31
TABLE 19 FDOT ITS DEVICES (WITHIN ENTIRE DISTRICT)
Ref ITS Device/Component Quantity Comments
1 CCTV Camera 152
4 of these locations are off interstates (1 x Fowler @ 30th Street, 1 x MLK @ Armenia, 1 x Gandy @ West Shore, 1 x Gandy @ Manhattan MM 10.9), mix camera vendor products, with MPEG-2, MPEG-4, H.264 encoding
2 DMS (Freeway) 71 Plans to replace with full-color capable signs as funding permits
3 DMS (Arterial) 0 24 to 36 potential locations currently are under study (within ½-mile of interstate interchanges)
4 Vehicle Detectors 442 Majority are radar (RTMS, Wavetronix) type, with a few being toll tag readers (using SunPass)
5 HART Stations 0 Planned for current and future Interstate projects
6 Ramp Metering 0
There are 74 freeway entrance ramps operated by FDOT. Currently under study (5 locations including; I-75 @ MLK, I-75 @ SR 60, I-75 @ Roosevelt (SB only), I-275 @ 118th Ave (SB only) and I-275 @ Gandy Blvd (SB only))
7 RWIS Stations 1 Unknown location (providing wind speed)
8 Other (list) Yes
Currently private data services (INRIX) along north I-75; Traffic.com (NAVTEQ) services with approx. 100 vehicle sensor locations (through FHWA ITIP grant) along interstates
Yes There are approximately 83 Call Boxes within the District
9 ITS Management Software Yes SunGuide Version 5.1 is currently utilized at the
RTMC
10 Traffic Signals N/A Currently do not manage Signals from the RTMC. FDOT does coordinate and work with local jurisdictions on re-timing and upgrades of traffic signals along state highways/roadways
EXISTING FDOT DISTRICT SEVEN ITS PROGRAM SERVICES
FL511 Traveler Information System/Program: The FDOT 511 Traveler Information System is a free phone and internet resource that provides English and Spanish real-time traffic information on all Florida interstate highways, Florida’s Turnpike, and major metropolitan roadways in the state. The statewide system provides information on commuter travel times, construction, lane closures, crashes, congestion, and severe weather affecting traffic. Callers can also access public transit, airport, and seaport information. In the event of an emergency, 511 provide
information on road closures and evacuation information. FDOT traffic information is available by calling 511 or on the web at FL511.com or on a web-enabled mobile device at mobile.FL511.com. Selected area CCTV camera video is available either as still or streaming roadway camera images.
Road Ranger Service Patrol Program: Established in 2000: this program provides “free” highway assistance to motorists and assist in clearing freeway incidents covering I-4, I-75, I-275, and SR 60. The services run 24/7/365 and averages over 6,000 assists per month. Road Rangers duties include traffic control during incidents, assisting law enforcement personnel in the quick clearance of traffic incidents/accidents to restore smooth and efficient operation of our roadway system, and roadway debris removal. They also provide essential assistance during storm events and other emergencies.
Roadway Incident Scene Clearance (RISC) Program: This program is an innovative and aggressive step in incident management providing specific performance objectives for heavy recovery operators and provides both incentives for quick clearance and disincentives for delayed clearance of incidents. This program supports the State’s Open Roads Policy which has set a goal of 90 minutes to safely clear an incident scene. FDOT District Seven began the RISC program in 2009 and currently there are two contractors in operation within the District covering I-4, I-75, and I-275. The RISC contractors are specially qualified with very heavy duty recovery equipment and highly trained operators that know how to safely and quickly clear the roadway.
Traffic Incident Management (TIM) Program: The FDOT TIM Program brings together all agencies involved in clearing an accident from the roadway. Together, they strive to make incident management safer for the responders and motorists and work to reduce the time needed to reopen travel lanes and get traffic moving again. The TIM teams consist of representatives from responding agencies and towing and other contract service providers. In particular, by getting the various entities together, many

Hillsborough County ITS Master Plan Update
32
misunderstandings can be cleared up beforehand. Responding effectively to incidents on the highway requires a planned and coordinated effort by many different individuals - from law enforcement and fire departments to emergency medical personnel, towing companies, spill response firms, and FDOT maintenance crews. The TIM team reviews past response actions and explore ways that incident management can be improved on the highways they serve. These teams also conduct training for incident responders and are active in traffic management planning for special events. The teams are open to all responders and there is no cost to attend meetings.
Travel Demand Management (TDM) Services: The Tampa Bay Area Regional Transportation Authority (TBARTA) was created by the Florida State Legislature in 2007 to develop and implement a Regional Transportation Master Plan for the seven-county West Central Florida region. TBARTA’s purpose is to improve mobility and expand multimodal transportation options for passengers and freight throughout the seven-county region. To assist local communities, employers and other businesses in the development of public/private partnerships to address local traffic congestion concerns, the FDOT has contracted with CUTR to establish a TDM Clearinghouse. TDM comprises an array of strategies to address peak-hour congestion through reducing demand for road-space. In general, TDM strategies encourage travelers, especially commuters, to make their trip via some method other than driving alone (e.g., bus, carpool, vanpool, bike, walk); not to make the trip at all (telecommute); or to shift their travel time to off-peak hours (compressed work week and flex time programs). Several agencies in the Tampa Bay area that encourage and facilitate these travel choices include HART, TBARTA Commuter Assistance Program (formally known as Bay Area Commuter Services), Westshore Alliance TMO, Tampa Downtown Partnership TMO, New North Transportation Alliance, and others.
COMMUNICATIONS SYSTEMS AND INFRASTRUCTURE
FDOT District Seven currently operates and maintains over 194 miles of roadways throughout Hillsborough, Pinellas, Polk and Manatee Counties (including US 301, SR 60 at Tampa International Airport, Gandy Boulevard, and the Sunshine Skyway corridor). Approximately 65 percent (or 125 miles) of these roadways are managed utilizing fiber optics as its primary method for communications transport, while 35 percent (or 69 miles) of the interstates are not yet instrumented with ITS. Some
of the locations currently without fiber optics are in the process of implementing wireless links to provide connectivity to the nearest fiber-based network access point.
As mentioned earlier, the majority of the interstate system within the County is currently instrumented with ITS along with corresponding communications infrastructure with the exception of a few missing segments as follows:
• I-75 between Bloomingdale Avenue south to the Manatee County line • I-275 from SR 60 to Himes Avenue • I-275 from Himes Avenue to the Hillsborough River
The FDOT has planned projects that will close these gaps/missing segments along the interstate system within the County within the next 5 years.
3.2 HILLSBOROUGH COUNTY
HILLSBOROUGH COUNTY TMC
Hillsborough County currently operates a TMC located on the 23rd floor of Downtown County Center building with backup capabilities/facilities located in the Sabal Park Traffic Signals office. No upgrades to these facilities or systems in anticipated in the near- to mid-term. The County has future plans to move into a new Public Safety Operations Center (PSOC) to be located on Columbus Drive between Falkenburg Road and US 301.
The County currently provides one full-time operations staff member at the TMC primarily responsible for overall operations of cameras and keeping the signal system functional. One additional part-time employee provides database management/grooming and the County supplements other services, as required, with consultant staff. The County does not consider itself a fully functional TMC at these current staffing levels.

Hillsborough County ITS Master Plan Update
33
HILLSBOROUGH COUNTY ITS/TRAFFIC SIGNAL DEVICES
The County’s ITS deployments have primarily been focused at key/designated intersections and other locations. Deployment has primarily included CCTV cameras and supporting TMC components. A TSP system is being planned for Fletcher Avenue in support of HART BRT bus services. Traffic signal preemption systems have been deployed at 83 County intersections. The County operates and maintains Traffic Signals and ITS devices within the County limits as shown in Table 20.
3.3 CITY OF TAMPA
CITY OF TAMPA TMC
The City of Tampa operates the THEA TMC located at 1104 E. Twiggs Street and the Authority’s REL on the Selmon Crosstown Expressway. The City provides management and operations of the Authority’s REL by using CCTV cameras to verify that messages have been changed on the DMS displays accordingly. The REL is reversed twice a day except on weekends. The City also manages and operates the arterial roadways within the City including the City’s traffic signal system.
Support and coordination is provided for evacuations (as required), traffic control during emergency events (as required), management of construction work zones and traffic control, and coordination during planned special events (averages about 160 per year). The City TMC also has a workstation placed/located at the Emergency Operations Center (EOC) for coordination.
The City currently provides nine operations staff members for the TMC which are responsible for monitoring and operating the THEA REL using REL workstations, as well as City ITS/traffic signal systems. Current staffing levels are considered adequate and would grow as workload dictates. The City is only responsible for providing operations support of this facility and any future upgrades to the TMC systems that may be required or needed is the responsibility of the THEA. The TMC currently has no formal Operations Manual.
TABLE 20 HILLSBOROUGH COUNTY ITS/TRAFFIC SIGNAL DEVICES
Ref ITS Device/Component Quantity Comments
1 CCTV Camera 59 MPEG-4 (CorTec) encoders are currently utilized. All video comes back to the TMC
2 DMS (Freeway) N/A 3 DMS (Arterial) 0 None currently planned
4 Vehicle Detectors N/A System detectors in support of Traffic Signal system
5 HAR Stations 0 None planned 6 Ramp Metering N/A 7 RWIS Stations 0 None planned
8 ITS Management Software Yes 360 Surveillance Camera Cameleon
9 Traffic Signals 507
1) Currently the controllers consist of 261 x Naztec TS2 Type I and 246 x Naztec TS2 Type II controllers/cabinets.
2) The County also operates and maintains 10 Traffic Signals for the City of Temple Terrace. The numbers may change/grow depending on status of FDOT/CIP/Developer projects
10 Traffic Signal System Software Yes Naztec ATMS.now
11 Traffic Signal Priority Yes
TSP system is planned by others in support of HART BRT bus services (MetroRapid) along Fletcher Avenue (from Nebraska to Telcom) as shown in Figure 13. Traffic Signal controllers will be replaced as needed to support deployment
12 Traffic Pre-emption Yes Currently at 83 locations using Opticom equipment
13 Adaptive Signal Control No Do not envision needing now or in the future
14 Timing Plans Yes County re-times/maintains for the most part (FDOT does some): TOD plans as needed. The County has no special timing plans
15 Red-Light Cameras Yes Currently at 6 intersections
CITY OF TAMPA ITS/TRAFFIC SIGNAL DEVICES
The City’s initial ITS deployments have primarily focused around special event venues such as; the Stadium, Forum, Convention Center, Busch Gardens and USF along with downtown streets and different corridors (i.e., Fowler Avenue, Dale Mabry Highway, Hillsborough Avenue, Busch Boulevard, others). ITS deployment has primarily included CCTV cameras and supporting TMC components. TSP

Hillsborough County ITS Master Plan Update
34
systems have been deployed along selected corridors as part of the HART North-South project in support of their express bus services and other locations are currently being evaluated. Traffic signal controllers are being replaced, as needed, in order to support TSP system integration and deployment.
Currently, the City has an ATMS project underway (to be completed in 2013) that will be evaluating and recommending upgrades to the traffic signal system including controllers, expansion of ITS capabilities, management software, as well as looking at phased deployment approaches for installing fiber optics throughout the system.
The City operates and maintains traffic signals and ITS devices within the City limits as shown in Table 21.
COMMUNICATIONS SYSTEMS AND INFRASTRUCTURE
The City currently has 59 miles of roadways with approximately 34 miles with fiber optic cable infrastructure (ranging from 24- to 72-strand, single-mode) and 125 miles with copper infrastructure in support of their traffic signal system and ITS devices. The City also utilizes temporary wireless communications on BBD to support traffic signals during construction. CCTV wireless is used in the Westshore area and Downtown and utilizes 4.9 GHz point-to-point systems.
Brocade (Foundry) routers are utilized at the TMC for connectivity to the FDOT RTMC. RuggedCom RS-900 series switches are utilized in City Field Cabinets.
3.4 CITY OF PLANT CITY
CITY OF PLANT CITY TMC
Plant City operates a TMC located at 1302 W. Spencer Street in Plant City which opened in late 2009. This TMC operates a citywide state-of-the-art ATMS, which provides the city’s traffic operations staff the ability to adjust the traffic pattern for any anomaly that may happen on any of its signalized intersection redirecting traffic thru the city.
TABLE 21 CITY OF TAMPA ITS/TRAFFIC SIGNAL DEVICES
Ref ITS Device/ Component Quantity Comments
1 CCTV Camera 48
The ATMS project will provide expansion capabilities up to 150. MPEG-2 encoders are currently utilized. All video comes back to the TMC
2 DMS (Freeway) N/A
3 DMS (Arterial) 0 ATMS project will looking at possible deployment coordinated with FDOT
4 Vehicle Detectors N/A System detectors in support of Traffic Signal
system 5 HAR Stations 0 None planned 6 Ramp Metering N/A 7 RWIS Stations 0 None planned
8 ITS Management Software
Yes
Transdyn Dynac ATMS - subject to change based on outcome of the ATMS project. THCEA is using vendor specific software for their ITS – upgrade to SunGuide is possible in the future
9 Traffic Signals 527
ATMS project is evaluating the system (for replacement and to provide expansion capabilities up to 650) – currently the controllers are a mix of Econolite and Peek TS 2 signal controllers
10 Traffic Signal System Software Yes Computran MTCS/UTCS Control Software
11 Traffic Signal Priority Yes
TSP systems installed by others in support of HART BRT bus services (MetroRapid) along Nebraska as shown in Figure 13 with additional corridors currently being evaluated. Signal controllers are replaced as needed to support TSP deployment
12 Traffic Pre-emption No
None planned – reason: no continuous funding source to install, operate and maintain these facilities is provided
13 Adaptive Signal Control No
Have investigated in past, but City does not support maintenance of detection needed for these systems so have not moved forward to date
14 Timing Plans Yes City re-times/maintains: 7 x TOD plans, 2 evacuation plans and 7 special event plans for all corridors within the City
15 Red-Light Cameras Yes Currently at 24 intersections – see Appendix C

Hillsborough County ITS Master Plan Update
35
The TMC consists of two workstations with 21-inch monitors equipped with NVIDA Quadro FX-3700 video/graphics cards, a dual redundant server system, a rear-projection video wall system using a Barco Transform-A wall controller, and four 50-inch video monitors to monitor the traffic patterns.
PLANT CITY ITS/TRAFFIC SIGNAL DEVICES
Plant City’s ATMS is comprised of the TMC, field devices, communications network, and intelligent operational strategies. The vision of the City’s ATMS master plan called for an investment plan that would be implemented in incremental stages as funding becomes available.
Forty-three (43) intersections controller cabinets were recently replaced using the new Naztec 981 TS2 controller with Type 6 controller cabinets. The cabinets include an Alpha UPS/battery back-up system which enables the signal system to continue functioning for 8 hours after a power outage. It also houses the RuggedCom RS-900 series Ethernet switches and Teleste video encoders.
These switches are compatible with the fiber optic system installed connecting all 43 signalized intersections within the City. The fiber optic connections enable the TMC to communicate with the intersections in real-time.
In addition, 18 CCTV cameras were installed, which enhances the TMC’s ability to monitor the traffic for incident management and manually adjust the system pattern so the flow of traffic is always optimized. There is a Plant City ATMS workstation located at the FDOT RTMC to allow the RTMC to control cameras, etc., as required or needed.
Plant City operates and maintains traffic signals and ITS devices within the City limits as shown in Table 22 below.
COMMUNICATIONS SYSTEMS AND INFRASTRUCTURE
The City currently has 20+ miles of city roadways with fiber optic cable infrastructure (ranging from 6- to 12-strands – with the majority of the fiber installed consists of a hybrid type with 6-strands of multimode + 6-strands of single-mode fiber) in support of their traffic signal system and ITS devices.
TABLE 22 PLANT CITY ITS/TRAFFIC SIGNAL DEVICES
Ref ITS Device/ Component
Quantity Comments
1 CCTV Camera 18 Vicon SVFT-PRS23 cameras mounted on signal mast arms using Teleste MPEG-4 encoders
2 DMS (Freeway) N/A 3 DMS (Arterial) 0 None currently – but desired
4 Vehicle Detectors N/A System detectors in support of Traffic Signal system
5 HAR Stations 0 None planned 6 Ramp Metering N/A 7 RWIS Stations 0 None planned
8 ITS Management Software Yes 360 Surveillance Cameleon ITS – expect to use
this software for future arterial DMSs
9 Traffic Signals 43 Naztec TS2 Type I controllers/cabinets at all locations
10 Traffic Signal System Software Yes Naztec ATMS.now (traffic responsive system)
11 Traffic Signal Priority
No None planned
12 Traffic Pre-emption Yes
Limited deployment : along US 92 (from Park Rd to Baker) and Reynolds (from Park Rd to Daniels) – but desire is corridor-wide deployment including SR 39/Alexander (from James Redmond to I-4)
13 Adaptive Signal Control No No need anticipated
14 Timing Plans Yes City re-times/maintains: TOD plans. City has no special event plans
15 Red-Light Cameras Yes Approximately 12 locations
Fiber optic connectivity is provided with the FDOT RTMC via FDOT Communications HUB on I-4 near Park Road. There is also fiber optics between the TMC and Emergency Dispatch building.
Foundry Fast Iron routers are utilized at the TMC and Foundry Edge routers are used at Field Comm Hubs providing connectivity to the FDOT RTMC. RuggedCom RS-900 series switches are utilized in City Field Cabinets.

Hillsborough County ITS Master Plan Update
36
3.5 CITY OF TEMPLE TERRACE
The City of Temple Terrance has no current or planned TMC or ITS deployment. Hillsborough County provides operations, maintenance, and re-timing/optimization of their traffic signal system. ITS devices and systems within the City limits are being operated and managed by the FDOT as applicable. The City sees no need of their own TMC for ITS projects within this Plan.
There are 10 signalized intersections within the City limits as indicated in Table 23 that are operated and maintained by the County.
TABLE 23 CITY OF TEMPLE TERRACE
TRAFFIC SIGNALIZED INTERSECTIONS
Temple Terrace Intersections 1. 56th @ Riverhills 6. Fowler @ Raintree 2. 56th @ Mission Hill 7. 56th @ Temple Heights 3. Fowler @ Gillette 8. Bullard @ Glen Arvin 4. Fowler @ Riverhills 9. 56th @ Busch 5. 56th @ Whiteway 10. Fowler @ 56th
3.6 EMERGENCY RESPONDER/LAW ENFORCEMENT
There is one intersection with a preemption system for Fire Station # 1 where the Fire Dept. maintains the system. Temple Terrace also has five intersections equipped with Red-Light cameras at: 1) 56th Street at Riverhills Drive, 2) 56th Street at Bullard Parkway, 3) 56th Street at Fowler Avenue, 4) Bullard Parkway at 56th Street, and 5) 56th Street at Fowler Avenue. Fire and rescue operates vehicles equipped with CAD and AVL as shown in Table 24.
3.7 HART AUTHORITY
HART encourages the deployment of ITS and related technology including: transit signal prioritization at traffic signals, queue lanes for buses, by-pass lanes for buses, arterial DMS as a way to dispatch route changes, geometric improvement to roadways, and the designation of High Occupancy Vehicle (HOV) lanes. HART supports the effort to coordinate ITS implementation into a unified strategy between agencies and encourages the development of light rail. Multi-modal transit connection announcements could be inter-linked in the future, as a way to coordinate modes.
TABLE 24 FIRE/RESCUE AND LAW ENFORCEMENT SYSTEMS
Ref Police/Sheriff Hillsborough County
City of Tampa Plant City
1 No. Emergency Vehicles 2200 850 47
2 with/CAD 2200 850 47 3 with/AVL 2200 0 0 4 Participate in TIM Yes (Regional) Yes (State) Yes (State) 5 Interface with TMC Yes Yes No
6 Share data/video No
Real-time w/ (Fire and
Rescue, Law Enforcement)
After the fact (w/ FDOT)
Ref Fire and Rescue Temple Terrace
City of Tampa
Plant City
1 No. Emergency Vehicles 15 78 14
2 with/CAD 15 50 9 3 with/AVL 15 77 0 4 Participate in TIM No Yes (State) Yes (Regional) 5 Interface with TMC Yes Yes Yes 6 Share data/video No After the fact No
Responses obtained from RITA ITS website: www.itsdeployment.its.dot.gov (2010 survey.)
A paramount issue of concern is congestion along bus routes and interoperability in real-time of all transportation systems.
HART, for the most part, has GPS/AVL systems installed on all of their fixed route buses, paratransit vehicles, as well as the light-rail streetcars as shown in Table 25. Information in regards to routes, schedules, and other information is currently disseminated through the internet, as well as selected kiosk locations. HART utilizes an analog-based 450MHz (UHF) radio system with no current plans to upgrade and/or migrate to a digital system at this time. HART is in process of procuring narrow-band capable equipment in order to meet the FCC narrow-banding requirement mandate which goes into effect January 2013.

Hillsborough County ITS Master Plan Update
37
TABLE 25 HART ITS/SYSTEMS
Ref Systems (ITS) Device/
Component Quantity Comments
HART Fleet
1 Fixed Route Buses
177 All equipped with AVL/GPS capabilities, automatic passenger counter (APC) systems, and mobile data terminals (MDT)
The majority of these vehicles also have some sort of audio or video surveillance on-board to enhance security
The majority of these vehicles also have the capability to monitor in real-time on-board vehicle components and systems
2 Paratransit Vehicles 46
Includes 38 HARTPlus vans (for disabled/handicapped) + 8 HARTFlex vans (door-to-door service within service area)
All vans are equipped with AVL/GPS capabilities and mobile data terminals (MDT)
3 Light Rail Cars 11 TECO Line Streetcar System (2.7 mile line) – cars equipped with AVL/GPS capabilities and MDTs
HART Routes and Lots
4
Local Fixed-Routes 29 On weekdays, limited on weekends Commuter (Express) Routes 11 Limited stops, connections to Park-n-Ride lots
Flex Routes/Zones 5 Demand-based door-to-door van service
5 Software Yes Trapeze for Trip management (route scheduling, etc.) and Ontira IVR at Call Center
6 Park-n-Ride Lots 22
7 Stops ~3200 Approx. number (bus stops + rail stops) – also include 2 bus depots
Dynamic Traveler Info 3
Security system 2 Limited deployment (to date) – although more stops planned
HART is also currently constructing the HART MetroRapid bus line that will include TSP on Fletcher Avenue and Nebraska Avenue as shown in Figure 13. There is also a pilot TSP project that is testing some locations at this time. In addition to the North-South Corridor, HART is currently studying a second alignment that is the East-West Corridor. This corridor consists of a service that would be from the NetPark Transfer Center on 56th Street, West on Hillsborough Avenue, south on Nebraska Avenue (where stops would be shared with the North-South corridor), west on Dr. Martin Luther King Jr. Boulevard, south on Himes Avenue, and then west to the Tampa International Airport on Columbus Drive/Boy Scout Boulevard.
3.8 EXISTING ITS COVERAGE BY KEY CORRIDORS/ ROADWAYS
As part of the overall analysis, the project team utilized existing database/documentation of ITS device locations and infrastructure within Hillsborough County as finalized in 2004 as part of the previous ITS Master Plan along with other more recent sources (see Section 1.0) to provide as accurate and comprehensive information as possible on the location of ITS devices and infrastructure along the key roadways/corridors within the County.
Table 26 notes these key roadway/corridor segments and the types of ITS devices/infrastructure that currently exist. Hillsborough County is currently under contract with a consultant that is tasked to update the overall ITS and communications database and documentation, but at this time, this is the latest information available.

Hillsborough County ITS Master Plan Update
38
FIGURE 13 HART METRORAPID – TSP SYSTEMS

Hillsborough County ITS Master Plan Update
39
TABLE 26 EXISTING ITS DEVICES AND INFRASTRUCTURE –
BY KEY ROADWAY/CORRIDOR
Roadway From - To Closed Circuit Camera
Dynamic Message
Sign
Arterial Dynamic
Message Sign
Fiber - Network
Copper - Network
Computerized Traffic Signals
I-4 I-275 to I-75 E E X E X X I-75 to Polk County Line E E X E X X
I-75 Manatee County Line to Bloomingdale Ave P X P P X X Bloomingdale Ave to I-4 E E P E X X I-4 to I-275 E P X E X X
I-275
Pinellas County Line to SR 60 E X X E X X SR 60 to Hillsborough River P P X P X X Hillsborough River to I-4 E E X E X X I-4 to Livingston Rd E E X E X X Livingston Rd to Pasco County Line P P P P X X
SR 60
Pinellas County Line to I-275 E E X E X E I-275 to Nebraska Ave (Kennedy Blvd) E X X E X E Nebraska Ave to I-75 E X X E X E I-75 to Valrico Rd (Brandon Blvd) E X X E E E
Dale Mabry Hwy Mac Dill AFB to Hillsborough Ave E X X E E E Hillsborough Ave to Van Dyke Rd P X X E E E
US 41 Manatee County Line to Big Bend Rd P X X X E E Big Bend Rd to Selmon Expwy P X X X X E
US 41/Florida Ave Selmon Expwy to I-275 X X X X E E I-275 to Country Club Dr X X X X E E
Selmon Expwy Ashley Dr to I-75 E E X E X X
Hillsborough Ave Pinellas County Line to Veterans Expwy E X X P E E Veterans Expwy to I-275 E X X X E E I-275 to I-75 E X X X E E
Veterans Expwy SR 60 to Pasco County Line E X X E X E CR 39 Charlie Griffin Rd to Bakers St E X X E X E
Bruce B Downs Blvd Busch Blvd to Cross Creek Blvd E X X E X E Cross Creek Blvd to Pasco County Line X X X X X E
US 92 I-4 to Jay Tucker Rd. (?) E X X E X E US 301 SR 674 to SR 60 E X X E E E Gunn Hwy Sheldon Rd to Dale Mabry Hwy X X X X E E Busch Blvd Dale Mabry Hwy to I-275 X X X X E E Busch Blvd Temple Terrace Hwy I-275 to I-75 E X X E E E Fletcher Ave Dale Mabry Hwy to Bruce B Downs Blvd X X X E E E Fowler Ave I-275 to I-75 X X X E E E Nebraska Ave Kennedy Blvd to Fletcher Ave X X X E E E
E=Existing Infrastructure; P=Planned Infrastructure; X=Absent

Hillsborough County ITS Master Plan Update
40
SECTION 4.0 | STAKEHOLDER NEEDS AND ISSUES
4.1 STAKEHOLDER SURVEY PROCESS
Key stakeholders identified through the MPO to be included as part of this project are indicated previously in Table 1 in Section 1.5.
Comprehensive survey questions were developed and sent out to each of these key stakeholders. Subsequent meetings were scheduled with the stakeholders to discuss the surveys and obtain further details and information. Once the meetings were completed and responses reviewed, follow-up questions were prepared and sent out to selected stakeholder representatives to clarify their responses and to discuss potential ITS solutions and applications.
The results from this process were used in refining the goals and objectives (see Table 2 in Section 1.7) of this ITS Master Plan, and to facilitate the development of potential ITS projects and strategies.
4.2 IDENTIFICATION OF STAKEHOLDER NEEDS AND ISSUES
Levels of response to the surveys and participation in interview sessions (meetings) varied from detailed, to limited, to no response. However, overall there was a good participation and response as indicated by the number of interviews conducted, surveys completed, and answers to follow-up questions provided.
The responses to the two primary questions are summarized in Tables A-1 and A-2 in Appendix A. The two questions are as follows:
Question 1: Given the following common transportation issues, how would you rank the severity of each issue within your community, region or area of responsibility using the scale provided (1-not a problem, 2-occasional problems, 3-general problem, 4-significant project, 5-very significant problem)?
Question 2: From your perspective what are the biggest challenges, problems, obstacles and/or areas affecting the operations, efficiency and/or safety of the transportation system in your area and/or performing and carrying out your duties?
4.3 ASSESSMENT OF STAKEHOLDER RESPONSES
Based on the responses to stakeholder questions, Tables 27 (moved to Appendix A, the following figures demonstrate the results of stakeholder questions) and 28, document the number of similar responses to each of these primary questions. This subsequent relative ranking (prioritization) of responses is simply to provide an initial assessment of stakeholder needs and their perspective on potential local transportation, safety, and mobility issues within the region.
Though more objective approaches may be utilized to identify and prioritize needs, this approach was deemed most efficient for this project. One benefit to this approach is that it allows for added flexibility and a “best engineering judgment” approach to the identification of potential ITS strategies and projects and ensures that a collective consensus of stakeholders was obtained in the process.
This stakeholder ranking (prioritization) of issues serve as the basis for the refinement of ITS goals and objectives for the region, as needed, as well as the identification of ITS services/strategies.

Hillsborough County ITS Master Plan Update
41
STAKEHOLDER OVERALL RANKING OF TRANSPORTATION ISSUES 1=not a problem 2=occasional problem 3=general problem 4=significant problem 5=very significant problem
0
1
2
3
4
Travel Conditions for Highways
0
1
2
3
4Travel Conditions for Major Street
0
1
2
3
Information for Travelers
0
1
2
3
Incident Response & Security
0
1
2
3
Transit & Other

Hillsborough County ITS Master Plan Update
42
TABLE 28 SUMMARY OF STAKEHOLDER NEEDS ASSESSMENT
ID Ranking Key ITS Stakeholder Need # Agencies Responding N-1 1 Improve Interagency Communications and/or Coordination 10 N-2 2 Manage/Mitigate Traffic Congestion (recurring and non-recurring) 9 N-3 3, tie Facilitate Cross Jurisdictional Signal Control and Timing 6
N-4 3, tie Enhance and Expand Information Dissemination to Travelers (include provide travel time data) 6
N-5 4, tie Provide/Expand Video and Data Sharing and Coordination 4 N-6 4, tie Improve Incident Management (Incident Response, Clearance) 4 N-7 4, tie Mitigate/Improve High Crash and Safety 4 N-8 5 Route Diversion and Coordination 3 N-9 6, tie Facilitate Emergency Evacuation Routes and Restoration 2
N-10 6, tie Improve Pedestrian/Bicycle/Related Incidents and Safety 2 N-11 6, tie Expand Optimization of Traffic Signal System 2 N-12 7, tie Provide/Facilitate Mobility Options 1 N-13 7, tie Mitigate/Improve Traffic Queuing/Back-ups 1 N-14 7, tie Improve Unfamiliar Users/Tourist Impact 1 N-15 7, tie Improve Maintenance and Construction Management 1

Hillsborough County ITS Master Plan Update
43
SECTION 5.0 | IMPLEMENTATION PLAN
5.1 POTENTIAL ITS STRATEGIES/FUNCTIONAL REQUIREMENTS
DEVELOPMENT FRAMEWORK
To best achieve the overall vision, goals, and objectives identified for this ITS Master Plan while meeting the ITS stakeholder needs, the Transportation System Management and Operations (TSM&O) strategy has been adopted as the framework for identifying and developing potential ITS strategies and functional requirements for Hillsborough County and the region as whole. As congestion continues to increase disproportionately to funding resources, the current practice of roadway expansion is becoming obsolete or not possible. In response to this challenge, the FDOT in 2010 endorsed the creation of the TSM&O Program. TSM&O is defined by the FHWA as:
“An integrated program to optimize the performance of existing multimodal infrastructure through implementation of systems, services, and projects to preserve capacity and improve the security, safety and reliability of our transportation system”
In other words, TSM&O is a systematic and integrated project approach combining ITS measures, strategies, and technologies with operational and institutional considerations to optimize the performance of the existing systems and infrastructure through implementation and operations of multi-modal, cross-jurisdictional systems, services, and projects. With fewer funds available to build our way out of congestion, improving our current roadways has become critical.
TSM&O emphasizes real-time active management and operation of the existing transportation system to improve mobility for all roadway users. To accomplish the goals and objectives established by the TSM&O, the program requires that all public and private agencies involved with transportation management and emergency/incident response to be partnered together as one cohesive entity to make operational and cost-effective deployment and investment decisions that impact the County/region as a whole.
Historically, ITS deployment has primarily focused on interstates; however, another TSM&O objective is to focus on arterials/corridors and the use of real-time traveler information dissemination to influence travel patterns to cover multiple roadways, travel modes, and avoid traffic bottlenecks.
In addition to TSM&O/ITS strategies, another key congestion management strategy that will be critical to addressing County transportation concerns and issues is Transportation Demand Management (TDM). TDM is not focused on facilities, but rather on programs or strategies designed to manage demand for vehicle travel to achieve system performance, environmental, and growth objectives. TDM strategies are designed to help reduce the demand for drive-alone travel on roadways by offering alternatives (i.e., carpools, vanpools, walking, etc.) to single-occupant vehicle driving, shift trips out of peak travel periods, and eliminate the need for certain trips.
The MPO is continuing to coordinate with TBARTA and FDOT on expansion of these strategies, as they are a key element in reaching the transportation goals and objectives established in the 2035 LRTP. Although this ITS Master Plan is primarily focused on TSM&O/ITS strategies and technologies, the strategies and technologies discussed and recommended in the ITS Master Plan will support and promote the further development and expansion of TDM initiatives within Hillsborough County.
ITS STRATEGIES AND FUNCTIONAL REQUIREMENTS
By working within a TSM&O development framework, the following list of potential ITS strategies and functional requirements capable of addressing key stakeholder needs and issues, goals and objectives, and local transportation mobility and safety issues were identified for possible inclusion as part of ITS project(s) and/or institutional and operational recommendations. The functional requirements and strategies are only high-level in nature, where detailed concepts and requirements would be determined as each ITS project is further developed and designed.
Several of the strategies and/or functional requirements listed below are either already implemented or are in process of being implemented by FDOT and/or other stakeholders, and as such are not necessarily included as part of a potential new ITS project identified in this Plan, but are included in the list for the sake of completeness and coordination.

Hillsborough County ITS Master Plan Update
44
A. TRAFFIC MANAGEMENT
Improved traffic management targets both recurring and non-recurring congestion. The primary objective is to move away from a static transportation system to a more dynamic and integrated transportation system. Examples include periodically re-timing traffic signals, installing more closed loop signal systems that can be centrally controlled to reflect current conditions, expanding and/or utilizing CCTV cameras, travel-time/vehicle detection, arterial DMSs, and signal priority/preemption systems. Another example includes other devices along the arterials and state roads to facilitate management and response to traffic incidents and other events that impact the arterial roadway network, utilizing ramp metering and variable speed limit signs to manage traffic flow on interstates, and implementing active traffic management and advanced traffic control measures.
1. Improve and implement strategies and technologies to mitigate congestion, improve travel flow and mobility:
a. Provide and/or expand arterial traffic management/traffic surveillance systems. Provide and/or expand the use of CCTV cameras, travel-time/vehicle detection, arterial DMSs and other devices and systems along the arterials and state roads. This will facilitate management of traffic along state highways and arterials including access to/from Intermodal facilities and economic activity centers.
This strategy would be to provide and/or fill in missing gaps in the ITS coverage along the interstates and arterials, as required. Although ITS/advanced traffic devices and communications network infrastructure have been installed and are currently operational on a large percentage of the District’s interstates and along many of major arterials, there are noticeable gaps (i.e., critical intersections, roadway segments) that should be provided with ITS and communications field devices and/or infrastructure (i.e., CCTV cameras, arterial DMSs, video image detection, fiber optic communications interconnect, network equipment, etc.), TMC upgrades (hardware, software, operational procedures), and/or upgrades to existing field equipment to bring these gaps up to current standards to support the various ITS concepts and projects mentioned in this Plan.
b. Enhance and/or expand real-time traveler information. Enhance and/or expand “decision-quality” information that travelers can access, understand, and act on to choose the most efficient mode and route to their final
destination. Timely and detailed information about traffic incidents, parking availability, the weather, construction activities, transit and special events, all aid in improving travel time predictability, better choices, and reduced congestion.
This strategy would enhance and/or expand coverage and dissemination techniques to include major arterials and state roads and to provide enhancements include additional information services and apps providing travelers expanded choices to gain access to traveler information through the use of iPhones, Droids, etc. in conjunction with FL511.
c. Continued a proactive traffic signal timing optimization program. Optimal signal timing occurs when the system corresponds to the current traffic patterns and flow to the extent possible. Often, signals are initially timed or sufficient amount of time has elapsed since the last re-timing resulting in system inefficiency and unnecessary traffic delays and queuing.
This strategy would emphasize the need to maintain optimal corridor performance through a program of regular/periodic traffic signal re-timing and traffic signal system upgrades/improvements as a result of changed traffic patterns and conditions along a corridor. Maintaining and being proactive in providing corridor signal re-timing is critical to the County/region to keep the traffic flow progressions running optimally. See Strategy A.3 for further details on possible concepts.
d. Provide active traffic management (ATM). ATM enhancements involve some sort of “smart highway” feature that uses real-time speed, vehicle-count, or even vehicle occupancy data to open or close certain lanes, adjust the speeds on the mainlines, or vary the candidacy to even be in certain lanes (e.g., HOV, HOT, truck-only, etc.) in the first place.
This strategy would build on existing ITS deployment along the interstates and provide the capability to “actively managing the traffic” to make real-time adjustments to the facility to manage the speed, density, or safety conditions. See Strategy A.5.(c) and (d) for further details on possible concepts.

Hillsborough County ITS Master Plan Update
45
2. Provide and/or enhance special event management capabilities:
a. Expand and provide ATMS capabilities along major event routes. During major special events, there is a need to facilitate traffic management capabilities, provide the capability to disseminate important event, and route information including parking information. This would be managed from a local TMC with appropriate coordination with other agencies involved in the event
This strategy would build upon the previous successes (i.e., RNA, Super Bowls, etc.) by FDOT and other key stakeholders by identifying major special event routes and facilities and implement and/or fill in the gaps in regards to ITS technologies/systems, communications, and/or operational coordination in order to effectively manage traffic and incident response during events.
b. Provide portable Intelligent Traffic Management System. In cases where permanent deployment of ITS devices is not feasible and/or cost effective, providing portable systems may be advisable.
This strategy would provide trailer-mounted ITS devices including; variable message signs (VMSs), CCTV cameras, etc. with wireless communications capabilities to support overall traffic management capabilities including special event traffic management and construction work zone traffic management.
3. Provide and enhance (optimize) traffic signal coordination and corridor system performance: Construct and/or upgrade arterial management systems at selected locations. Closed loop traffic signal systems allow traffic engineers to dynamically change the underlying signal timing patterns to mirror changing travel demand. With multiple signal timing patterns available, a centralized computer system can provide the capability to select (manually or automatically) the most appropriate signal pattern for a single roadway or an entire corridor or for a specific event (i.e., route diversion, etc.).
This strategy would include one or more of the following:
a. Systematically re-time traffic signals on priority network. Traffic signals on the priority network should be periodically re-timed to ensure the traffic signal timing plan is optimized for current traffic conditions and that the signal timings adhere to the official signal plan. Over time, synchronization
between signals may drift and unofficial tweaks to signal timings occasionally occur. Periodically checking signal timings will minimize these issues. FDOT regularly puts out re-timing contracts throughout the region and Hillsborough County Signalized Intersection Timing Update Program (SITUP) is a program to re-time traffic signals on prioritized corridors every 3‐5 years.
b. Upgrade and interconnect signals on priority network. Many older traffic signal systems utilize time based coordination to interconnect traffic signals. There is no central processor to dynamically manage the system, nor is there a communication network to transmit commands to individual signals or between signals. Closed loop traffic signal systems permit a central processor, though a communications network, to monitor a large group of traffic signals and implement dynamic signal timing patterns.
c. Provide active monitoring of traffic signal systems. Advanced traffic control equipment generates a number of measures of effectiveness to measure system performance. These performance measures should be periodically reviewed to determine how signals are operating and to identify signals that may need to be re-timed.
d. Provide upgrades to signal hardware equipment. Providing upgrades to signal hardware, while not necessarily an ITS technology, can produce improvements to the operation of individual signals, as well as allow the implementation of other technology applications (i.e., TSP, etc.). This strategy includes upgrades to signal heads, mast arms, cabinets, and controllers among other components, as required or needed.
4. Provide integrated corridor management (ICM) strategies and support systems:
a. Provide a regional ICM deployment plan. In general, major arterials and state highways do not operate in isolation; they are usually part of larger travel corridors with one or more parallel arterials, passenger rail lines, and bus routes.
This strategy would develop a comprehensive ICM plan, concept of operations and an overall vision for the County. The Plan would prioritize corridors, identify, evaluate, and promote an integrated multi-modal transportation system. Technical, operational, and institutional integration issues and considerations would be included in the Plan along with

Hillsborough County ITS Master Plan Update
46
identifying closed loop traffic signal systems, CCTV and DMS locations on arterials, priority bus treatment needs, smart bus stops, and communication links to local police and municipal TMCs and the FDOT TMC.
With the Plan in place, potential ICM projects can be further identified and developed and proceed either on a corridor-wide basis or on an individual project-by-project basis.
b. Develop an inter-agency traffic control/ITS concept. For the most part, the individual traffic signal systems (i.e., County/Temple Terrace, City of Tampa, Plant City, FDOT) within the County/region operate independently and not much consideration has been given in regard to timing and corridor flow performance when crossing jurisdictional boundaries. During emergencies that cross jurisdictional boundaries that require traffic diversions or emergency evacuations, it is currently very difficult for municipalities to implement optimal and coordinated emergency corridor signal timing plans.
This strategy would evaluate and recommend potential solutions to provide an independent/centralized entity, such as FDOT, who has 24/7 TMC staffing, technical expertise, and who sees the bigger “regional” picture, with the capability of assuming primary control of traffic signals and existing ITS devices that span across municipal boundaries during an emergency and major event/situation. For FDOT to assume this responsibility would require developing policy, technical, and communication protocols with the local municipalities.
5. Develop and implement traffic control measures to enhance the efficiency, mobility, safety, and/or reliability of the transportation system: To improve overall efficiency, mobility, safety and reliability of the transportation network various ITS strategies could be implemented including the following:
a. Evaluate a ramp metering program for interstate on-ramps. Interstates can only carry a certain number of vehicles per hour per lane. When this density is exceeded, traffic flow starts to break down, causing stop and go conditions. Ramp metering, installing traffic signals on on-ramps to meter the number of merging vehicles, will ensure mainline traffic does not exceed capacity.
FDOT is currently conducting a study at selected interstate ramps. Depending on the results of the study findings and recommendations will determine the feasibility of whether to expand the evaluation and possible implementation to other interstate ramps throughout the County/region.
b. Implement congestion pricing programs, including high occupancy toll (HOT)/managed lanes. Strategy would allow single occupancy vehicles (SOV) to pay a toll to use underutilized HOV lane capacity. These systems most often utilize an in-vehicle transponder to determine lane usage and assess tolls. The tolls charged may vary according to time-of-day schedules, or may be dynamically assessed in response to traffic conditions and available HOV lane capacity.
FDOT is currently evaluating these types of strategies through various planning studies. The findings and recommendations from these studies will determine the feasibility of implementation.
c. Evaluate the feasibility of implementing ATM systems along the interstates including the following techniques:
i. Speed harmonization measures – This strategy would dynamically and automatically reduce speed limits approaching areas of congestion, accidents, or special events. The speed limits would be modified using variable speed limit signs according to congestion levels to lessen stop-and-go conditions and lower the speed of vehicles as they approach downstream bottlenecks.
ii. Queue warning systems – This strategy would warn motorists of downstream queues and direct through traffic to alternate lanes.
iii. Hard shoulder running measures along the interstates – This strategy would involve allowing vehicles to travel on the shoulder facilities of roadways often for isolated sections of roadway or limited times of operation. The availability of the shoulder for use is often communicated through the use of overhead gantries or roadside DMS.
d. Develop and implement advance parking management systems at major parking facilities. Downtown special events are frequently inundated with motorists looking for available/open parking.

Hillsborough County ITS Master Plan Update
47
Advanced parking management systems would guide residents and visitors to garages with available parking and the shortest queues, reducing the number of motorists cruising the City/County streets looking for parking. Implementation of this strategy would be coordinated with FL511 upgrades providing motorists with iPhone, Droids, and other mobiles devices the capability to pull up area map(s) of garages with real-time information on available parking spaces and directions to these lots/garages.
e. Develop and expand TSP program. HART (transit) ridership is very sensitive to the relative travel time of transit to autos. Signal priority treatment enables HART buses to slightly extend the green time at signalized intersections so they can pass through without stopping. When signal priority treatment is installed on multiple intersections along a bus route it will shorten bus travel times, making them more competitive (maintaining schedules).
Currently, HART is working with FDOT and the local municipalities to implement BRT routes with TSP systems. Along with TSP, other improvements could be included, as required or needed, such as re-timing of signals, signal modernization including new signal heads and controllers, and installing closed loop signal systems.
This strategy would expand the evaluation and deployment through current initiatives to include possible additional transit routes and corridors.
f. Provide and/or expand emergency vehicle preemption (EVP) systems. When properly equipped emergency vehicles approach traffic signals where this technology is in use, the signal adjusts to assist in safe and expedient passage of the emergency vehicle by setting approaches to red to allow emergency vehicle to pass through the intersection. These systems detect on-coming emergency vehicles through a variety of communications technologies and can be used to bring up any phase programmed into the controller, providing safer and more efficient movement of both the emergency vehicle and the other motorists.
This strategy would investigate additional intersections along selected corridors throughout the County/region and recommend deployment of EVP systems.
6. Support measures to mitigate and track regional environmental impacts and Environmental Protection Agency (EPA) compliance: Exhaust from moving vehicles under relatively controlled conditions can be monitored and analyzed for emissions quality. These systems must be located to capture data in a zone where vehicles are under normal operating conditions (i.e., not accelerating, decelerating, climbing, etc.). They must also be located such that the ambient air quality does not affect emission measurement.
Hillsborough County EPC is responsible for the operations of eight air monitoring stations around the County. The EPA is also reducing the ozone standards, which requires close monitoring to ensure air quality compliance.
Posting of hazardous and/or dangerous air quality conditions could be posted on area DMSs to alert travelers of the dangerous conditions. This could serve to encourage transit and/or rideshare/telecommute programs (especially during summer months and air quality advisories).
DMSs would also help keep travelers up to date on areas that may need to be re-routed to avoid congestion-related delays and thus reduce idling emissions.
Video could also be added that would be helpful to correlate areas of poor air quality with areas experiencing high traffic volume.
7. Preserve ITS/Traffic signal equipment and infrastructure investments: Maintaining the equipment and infrastructure installed is critical to maximizing the investment, maintaining maximum performance level and availability, and to extending the overall life of the system. To do this requires accurate inventory tracking and as-built information to provide efficiency in providing maintenance of equipment.
FDOT is currently using ITS Facility Management (ITSFM), a GIS-based web application hosted by Byers Engineering Company and managed by the FDOT Central Office. It is a centralized, collaborative asset system designed to help manage ITS/communications outside plant assets. FDOT District Seven has been active in implementing the ITSFM and is in the process of using this tool to document their existing system.
This strategy would provide this tool to each municipality to document their existing ITS/Traffic system assets and maintain as-built records that would provide efficiency and cost savings in their overall operations and maintenance

Hillsborough County ITS Master Plan Update
48
of their systems. The ITSFM database would need to be populated with data and information from their individual ITS/traffic signal networks.
B. INCIDENT/EMERGENCY MANAGEMENT AND SAFETY
A significant reason for traffic congestion in large urban areas is due to traffic incidents ranging from flat tires to overturned tractor-trailers. These unforeseen events cause havoc, making commuters late, affecting truck deliveries, and ultimately making the region less competitive economically. Hazmat spills or crashes involving fatalities can turn what might have been a minor incident into a long-term road closure lasting hours. Primary incidents can cause secondary accidents, where drivers may slam into the rear of an unanticipated queue; the secondary crash can occasionally be worse than the original incident. More effective incident/emergency management will increase safety and survival rates for crash victims and emergency responders.
Incident management is a multi-step process involving incident detection and verification, emergency responder response, management of on-site emergency personnel, traffic management, clearance of vehicles and debris, and recovery to normal traffic flow. It involves diverse technical skills and an assortment of different organizational entities. Incident management programs have to be sensitive to all phases of incident management and the institutional relationships, many of which are outside the purview of the traditional transportation planning and funding processes.
1. Improve Incident Detection and Verification Times: It is critical to identify incidents as rapidly as possible. The faster emergency responders are notified, the sooner they can react and save lives. Timely detection will also aid first responders to avoid ensuing traffic delays. The quicker incident information is posted on DMSs, 511 services, and/or traffic reports the quicker motorists will take alternative routes, and not get stuck in traffic.
To improve overall detection and verification times various ITS strategies could be implemented including the following:
a. Develop, implement and/or upgrade TMCs. As technology evolves, TMCs routinely need to upgrade their software, equipment, and communications to accommodate expansion of their existing systems, stay current with the latest standards, technologies, tools and/or operational procedures to effectively and efficiently respond to traffic and incident
events within their jurisdiction and across jurisdictions depending on the scope of the event.
b. Expand and Upgrade ATMS/traffic surveillance systems. Although ITS/advanced traffic devices and communications network infrastructure have been installed and currently operational on a large percentage of the District’s interstates and along major arterials, there are noticeable gaps (i.e., critical intersections, roadway segments) that need be in-filled with ITS devices and/or communications infrastructure and/or the equipment needs to provide full/needed system coverage and/or be brought up to current standards to support the various ITS strategies mentioned in this Plan.
c. Provide the capability to share 911 and highway patrol computer aided dispatch (CAD) information with City/County TMCs. Instrumenting 100 percent of the arterial state roads and highways, as well as local streets with traffic video surveillance is a very expensive proposition due to the magnitude of mileage involved. Obtaining incident information from 911 and State Police CAD systems can be a more cost efficient approach to supplement complement video surveillance systems for obtaining traffic conditions on many of these local routes.
FDOT already has this capability provided through SunGuide (e.g., FHP CAD Data Viewer) that interfaces with the FHP CAD system.
A couple possible options are available to potentially implement this strategy. The first could be provided by setting up local agencies/municipalities as a SunGuide client allowing them access to the FHP CAD Data Viewer app allowing them the ability to better monitor incidents within their jurisdictions that impact traffic flow along their local roadways/corridors. The second option would be to provide incident information as an active data feed from the existing FHP Live Traffic Crash and Road Condition website (www.flhsmv.gov/fhp) and display incident information and locations on local agency video monitor(s)/video wall within the respective TMCs. Incident information from this website is updated every 2 minutes.
2. Improve Incident Response Times: Improving response times involves getting situational information out to pertinent organizations that need it. Emergency responders want accurate incident location information. When a traveler is involved in an incident and calls 911, precise location descriptions save responders valuable seconds and minutes of response times. Visual information

Hillsborough County ITS Master Plan Update
49
about the types of vehicles involved and the severity can assist 911 centers in determining the appropriate types of equipment to dispatch. Real-time traffic information will aid in routing emergency response vehicles to the scene.
To improve overall response times various ITS strategies could be implemented including the following:
a. Provide and/or expand enhanced reference location signs. Reference location signs, such as ramp designation signs and highway mile marker signs allow travelers to accurately pinpoint communicate an incident location to 911 dispatchers.
This strategy would look to provide closer spacing (i.e., approximately every 0.2 miles) along sections where current spacing is greater. The closer spacing would permit most potential travelers the ability to visibly see a reference location sign. These reference signs are typically spaced at 0.2 miles or less.
Although these reference location signs have been installed within the District along the interstates; coverage, spacing, and consistency should be reviewed and expanded (as needed) to provide system-wide deployment.
b. Provide AVL and identification for emergency vehicles/responders. Using AVL technology will ensure that the closet appropriate unit is responding to each incident/call and reduce overall response time. Combined with a mobile CAD system would allow the responding units to record en-route and arrival times more accurately. If real-time traffic/roadway conditions information is available to the dispatcher, this would also provide the capability to re-route the emergency responder to avoid unnecessary delays (e.g., congested areas, construction zones, etc.) en-route.
This strategy would involve equipping emergency response vehicles with GPS-based transponders and communication capabilities to allow for the real-time tracking of the vehicles by the emergency response dispatcher.
c. Provide the capability to share traffic information with emergency responders. County 911 centers/CAD dispatchers and other emergency vehicle dispatchers require accurate information about the incident location (with GPS coordinates), types of vehicles involved, crash severity, and traffic conditions to dispatch the proper equipment and information to the
emergency responder vehicle’s mobile data terminal (MDT), while expeditiously routing them to the scene.
The more situational information first responders have prior to arriving at the scene, the better prepared they will be to handle the situation. This information will assist emergency responders to navigate around traffic congestion generated by the incident.
This strategy would develop a capability that provides inter-agency communications for transportation agencies, emergency agencies and responders and other agencies to provide the capability to share real-time streaming video, as well as relevant traffic conditions and incident data.
d. Evaluate and provide additional interstate median crossover points. Emergency responders have experienced additional response times as a result of having to drive farther than necessary to locate a median crossover point to turn around to gain direct access to the incident/crash site when it is located on the opposite side of the interstate. This ultimately impacts congestion build-up, safety, and the potential of secondary incidents. Crossovers on limited access facilities are to follow American Association of State Highway Transportation Officials’ (AASHTO’s) crossover requirements (per FDOT Design Bulletin 06-09).
This strategy would investigate current efforts/studies in median crossovers and recommend possible solutions to mitigate/improve the emergency responder arrival times to the accident scenes.
3. Improve Incident Clearance (Duration) Times: Improving incident clearance times is critical in that it reduces the potential of secondary incidents as a result of the increased congestion/queuing of traffic by permitting the travel lanes to be more quickly re-open. The following strategies have two objectives; 1) ensuring minor incidents do not escalate into major incidents and 2) managing traffic when more significant incidents happen. Minor fender benders or stalled vehicles do not necessarily have to cause major bottlenecks if vehicles are moved out of the travel lanes onto the shoulder in a timely manner.
Because local police and fire personnel do not typically carry control devices to manage traffic and few entities have real-time capability to reprogram traffic signals on detour routes to handle the surge in traffic, the following strategies would potentially help improve incident clearance times.
Hillsborough County ITS Master Plan Update
50
a. Provide freeway service patrol (Road Ranger) expansion and upgrades. The Road Ranger Program has been highly successful and effective in mitigating minor incidents like disabled vehicles and providing on-scene incident assistance to emergency responders. They are capable of providing minor repair services, such as supplying gas or charging a battery and carry arrow boards, cones, and other warning devices for traffic control.
In a recent (2011-2012) TIM Statewide Road Ranger Survey for Incident Responders, several areas were identified for further improvement including 1) expansion of the coverage area to include major arterials/state roads, 2) provide 24-hour service availability, 3) ability to communicate with appropriate emergency/law enforcement personnel, and 4) need for additional equipment and other capabilities to further enhance their performance. Institutional considerations will first need to be addressed in regards to potentially expanding the Road Ranger program onto local arterials to foster cooperation and/or agreements with local/private towing companies.
b. Develop policy and procedures to modify signal timings on detour routes and upgrade traffic controllers/field-to-center communication systems. The ability to handle traffic surges from road closures or special events is an institutional and communications problem, not necessarily a technical issue. Newer signal systems have the functionality to implement multiple emergency timings plans, and should be used.
This strategy would need to be coordinated with the development of the Route/Alternative Route Response Plan. See Strategy A.3 for further details on possible concepts.
c. Identify and implement dynamic routing application for route diversions and evacuations. There is a need to develop a capability to provide meaningful alternative routes for use during major incidents and/or evacuations. Diversion of traffic from incident/accident sites helps to mitigate building congestion and increasing possibility of secondary accidents.
This strategy would provide a dynamic routing capability with a mobile app providing the traveler with dynamic routing alternatives. This concept would require travel time/traffic data along the arterials and other roadways in order to implement. Static/fixed diversion routes are good, but are limited in
that if a secondary incident occurs, these routes it tends to defeat the primary purpose of using the route.
4. Reduce crash rates and improve safety at signalized intersections (including vehicles, pedestrians, bicycles):
a. Provide and expand red light running programs at intersections with high crash rates. While nominally a safety initiative, red light running programs use video technology to identify vehicles running red lights. The programs have successfully demonstrated to discourage aggressive driving and excessive speeding, consequently, reducing crash rates. Resistance by the public typically results from these programs and would need to be addressed politically to successfully implement these programs.
This strategy would provide an expansion of existing systems in the County, City of Tampa, Temple Terrace, and Plant City.
b. Provide, coordinate, and/or improve pedestrian/bicycle safety solutions. Pedestrian and bicycle safety continues to be an issue at certain intersections and corridors. Besides traditional treatments including improved lighting, there are a variety of ITS technologies for consideration that could be used to improve pedestrian mobility and access and enhance safety.
This strategy would investigate the possibility of implementation of various technologies and solutions to help improve safety. Some of these are already implemented by the County and/or City. They include:
i. Infrared Detectors: Pedestrians entering the curbside infrared detection zone will activate the pedestrian call feature, while those detected in the crosswalk will extend the clearance interval.
ii. Microwave Detectors: Pedestrians entering the curbside microwave detection zone will activate the pedestrian call feature. At the same time, slower pedestrians detected within the on-street detection zones will receive more time to cross the street.
iii. Count-down signals are used in conjunction with conventional pedestrian signals to provide information to the pedestrian regarding the amount of time remaining to safely cross the street. Depending on user preference, the count-down timer starts either when the WALK or Walking Person indication appears or when the

Hillsborough County ITS Master Plan Update
51
flashing DON’T WALK or Hand indication appears. The timer continues counting down through the flashing DON’T WALK (Hand) clearance interval. When the steady DON’T WALK or Hand appears, the countdown signal will be at zero.
iv. In-pavement lights are being used at crosswalks to alert motorists to the presence of a pedestrian crossing or preparing to cross the street. The amber lights are embedded in the pavement on both sides of the crosswalk and oriented to face oncoming traffic. When the pedestrian activates the system, either by using a push-button or through detection from an automated device, the lights begin to flash at a constant rate, warning the motorist that a pedestrian is in the vicinity of the crosswalk ahead.
v. The illuminated pushbutton is a simple technology designed to provide immediate feedback to the pedestrian that the button is working and that the signal will change. Use of the illuminated button may reduce the number of pedestrians who cross against the signal because they have no indication that a standard push button is working.
5. Improve mobility and reduce vehicle crash rates related to weather and other low visibility events: Adverse weather conditions (rain, fog, wind, etc.), along with low visibility conditions as a result from smoke from a nearby brush fire, have a detrimental impact on traffic flow and create unsafe travel conditions. Weather management programs have three objectives: 1) identify hazardous roadway conditions through remote surveillance techniques, 2) inform motorists about unsafe conditions, and 3) provide situational information to manage field resources.
The strategy that follows would supplement/complement the Road Weather Information Station (RWIS) system currently in design by FDOT to provide increased coverage throughout the County and region as a whole.
a. Develop and deploy a RWIS. RWIS stations generate information about local conditions, whether it is foggy, rainy, smoky, or whether the road is dry. Personnel use this information to determine the appropriate response plan. Traffic operations centers use RWIS-generated information to trigger warnings to motorists about adverse weather or other local conditions (i.e., smoke) via DMS and/or Highway Advisory Radio (HAR).
FDOT is currently in the design phase for RWIS sites. Further expansion of the system is recommended to provide region-wide coverage. RWIS would be used at additional selected locations that regularly have weather-related issues (i.e., fog) or other event causing a travel hazard (i.e., smoke from brush fire). This strategy would need to be coordinated with FL511 for providing weather related alerts to the traveler. This critical information would also need to be given to FHP and other emergency operators.
6. Improve safety and coordination of intermodal conflicts (highway-rail interface/crossings): At grade highway-rail intersections continue to be safety concerns as a result of vehicle-/train-related incidents. Some of the technology-related solutions that are typically implemented include; automatic gates, warning horns/bells, and flashing lights with measured success.
This strategy would investigate and demonstrate the possible use of additional advanced technologies including the following:
a. Provide crossing gate video enforcement. Enforcement of closed gates at rail crossings can discourage motorists from driving around the gates. This enforcement could be made more effective through the use of video monitoring of crossings. Video operation can be activated automatically by approaching rail traffic.
b. Upgrade signal interconnect with traffic signals. This strategy is composed of two levels. The first incorporates basic integration to allow signals adjacent to rail crossings to account for passing trains. This prevents green phases from sending vehicles toward a crossing where a train is present. The second level utilizes more advanced algorithms to work rail-crossing activities into the larger system of signals.
c. Provide an active advanced warning system (AAWS). Provide motorists with warning that a train is approaching. Beacons are connected to the railroad track circuitry. This method is usually combined with signs, lights and a message.
d. Evaluate and implement in-vehicle warning systems. These systems can determine whether a train is present on nearby railroad tracks via interconnect with the train’s GPS information and warn drivers via an alarm that resides in the vehicle. Some of these driver warning type systems have been deployed on school buses. This is a promising application from a

Hillsborough County ITS Master Plan Update
52
technology standpoint, but is dependent on the degree to which automobile manufacturers market the products.
7. Identify and develop diversion routes and system strategies: As mentioned earlier there is a need to develop a capability to provide meaningful alternative routes for use during major incidents and/or evacuations. Diversion of traffic from incident/accident sites helps to mitigate building congestion and increasing possibility of secondary accidents.
This strategy would investigate and further develop a real-time, dynamic route diversion management system methodology. The dynamic route system that would be investigated is called Real-Time Route Diversion System (RTRDS) which is a software system that would leverage real-time traffic data from SunGuide to help the RTMC to more effectively manage traffic incidents.
The system could be used for four different scenarios: 1) it could provide a computer-aided environment to help the RTMC to co-develop better diversion plans with the local authority; 2) when a pre-planned alternate route cannot be used due to some unforeseen event, this system could automatically generate alternative plans and rank them to assist the RTMC in the decision making; 3) similarly, the system could be used if a pre-planned alternate route is not available for a given incident; and 4) if an initially effective alternate route becomes inadequate due to a secondary incident, the system could search for a better alternate route within seconds.
The system would provide a browser-based user interface and include a built-in database for the RTMC to manage information on past, current, and future incidents.
8. Identify and provide ITS strategies to support regional emergency evacuation plans and response: There is a potential to further improve evacuation and emergency/incident response plans looking at the County/region as a whole in an effort to provide greater operational efficiency, cooperation, coordination, and safety during major emergency events. This strategy would potentially provide the following:
a. Review regional evacuation plan and disaster response and recovery plan. Review existing regional evacuation and disaster response plans to develop a comprehensive technology plan(s) to support operations and management during a wide-scale emergency evacuation event.
b. Expand and/or enhance the capability to provide regional emergency/traffic text alerts. There is the potential need to expand and/or enhance the current reverse 911-based alert system used in the County/region to provide wider and faster dissemination of critical emergency-related information to travelers and the general public.
This strategy would investigate and potentially implement an enhanced regional alert broadcast system. FDOT TMC and/or County 911 Centers could function as communication hubs in major emergencies, passing critical web-based, redundant, and secure alert information to participating agencies and the public at large.
Two variations of regional alert broadcasts could be provided: 1) emergency agencies, first responders, public safety personnel and 2) entire County/region by leveraging various communications (i.e., text messaging, emails, voice calls, etc.).
Alerts could be launched from anywhere – web browser or mobile device, including mobile applications. Alerts could also be targeted to specific geographic areas using GIS and Virtual Earth maps and, with Location Based Services (LBS), could be used to notify individuals located within and around disaster areas within seconds.
C. TRAVELER INFORMATION DISSEMINATION
Provide travelers with real-time travel-times, incident information, weather/roadway conditions, roadway construction activities, transit delay information, travel mode options and locations, parking availability, and other travel-related information that gives travelers an opportunity to optimize their trips. With information about travel conditions, travelers can make intelligent decisions about alternative routes or modes, and take mid-trip corrective actions to avoid delays.
1. Provide and/or enhance multi-modal information dissemination and trip planning tools that may affect roadway users and travel choices across all modes: An updated FL511 system is scheduled to be available in 2013. From an operations perspective, the Tampa Bay region consists of multiple transportation-related agencies providing and/or depending on reliable and accurate traffic information and conditions data.

Hillsborough County ITS Master Plan Update
53
This strategy would provide further enhancement and/or expansion of the FL511 program supporting the Tampa Bay region. In addition to the existing capabilities and planned FL511 features (currently scheduled for 2013), the following additions could further enhance the capabilities and overall support for transportation management in the County/region:
a. Provide real-time parking garage/lot space availability with map of Downtown Tampa as part of the 511 mobile app. This strategy would provide travelers in Downtown Tampa, real-time information on travel time and the availability of City/public parking spaces utilizing a 511 mobile app allowing travelers to use their iPhone, Droid, or other mobile phone to access real-time information.
b. Provide commercial truck parking lot space availability as part of the 511 mobile app. This strategy would provide commercial truckers coming in and out of the Tampa region real-time information in regards to availability of parking spaces for commercial vehicles utilizing a 511 mobile app.
c. Provide and/or expand real-time travel-time data along arterials. To provide travel-time information, vehicle speed/travel-time data is collected utilizing vehicle probe and/or Bluetooth travel-time detection technology. Either one of these could be used to produce travel times for motorists on state roads/highways and/or other major arterials. FDOT currently provides travel-times along the interstates using existing devices.
This strategy would investigate and implement travel-time data collection along County/region state roads/highways and other major arterials. Vehicle probes (i.e., in-vehicle GPS devices) do not require roadside infrastructure and are typically provided by a third-party data service provider (i.e., INRIX, Tom-Tom, Nazteq, etc.) and are, therefore, applicable for multiple highways in a travel corridor as long as there are vehicles equipped with GPS-based devices. Bluetooth travel-time systems require Bluetooth reader sites along the corridors to read MAC addresses from Bluetooth-enabled devices in vehicles, as well as a data server located at the TMC and software to be installed at the TMC.
This strategy would provide real-time speed and travel-time data feeds with appropriate format (i.e., XML) to FL511. Web-based speed maps and real-time travel-time and speed data feeds should be coordinated with the FL511 contractor.
2. Expand and/or enhance en-route traveler information systems: Conditions will frequently change while the traveler is en-route to their destination. En-route traveler information gives travelers a dynamic opportunity to change routes based on the latest travel conditions. FDOT has made a sizeable investment in DMS systems on the interstates to warn motorists about anticipated delays and other events. Unfortunately, there has been no mechanism (to date) to warn motorists about the current conditions before they enter an interstate or other major roadway and are subsequently trapped or caught in heavy traffic congestion. Arterial DMSs (ADMS) should be placed at decision points along the arterial system just prior to interstate on-ramps and other selected key locations. FDOT is currently studying the placement of arterial DMSs at selected locations.
This strategy would look to complement existing ADMS initiatives by expanding ADMS coverage along major arterial/state roads as part of ATMS project deployments designed to fill in the gaps. This will facilitate guiding motorists through pre-defined diversion routes and support of traffic management during major special event venues/facilities (i.e., Strawberry Festival in Plant City, Downtown Tampa events, etc.).
D. INTER-AGENCY COORDINATION AND COMMUNICATIONS
Wide varieties of personnel and agencies are involved in managing an incident or other event, with each having their own set of priorities. Fire personnel tend to focus on rescuing people and/or dealing with Hazmat situations. Police maintain traffic flow and obtain crash report information. Tow truck operators may want to close lanes to upright a vehicle, and TMCs want traffic lanes open as soon as possible. Consequently, under intense pressure at crash sites, conflicts occasionally occur among emergency responders.
The strategies listed below will assist in improving interdisciplinary coordination and communications.
1. Develop regional interagency operational and communications plan(s):
a. Identify and enhance regional concept of operations, policies, and procedures involving transportation, emergency, and law enforcement stakeholders. The updated plan(s) would address various operational scenarios/events including large-scale evacuation to further identify and/or improve interagency interfaces and video and data sharing requirements to

Hillsborough County ITS Master Plan Update
54
support the upgrade/expansion of an interoperable, available and reliable communications network.
To accomplish this will require active participation by existing regional TIM task force members, as well as others. Emergency responders, law enforcement, traffic operations personnel, and others would need to continue to meet on an on-going basis to pre-plan incident responses, continue improvement and updates to operational and response procedures, and improve interagency coordination.
5.2 ITS PROJECT IDENTIFICATION
ITS Projects were identified by matching the ITS strategies/functional requirements with potential ITS and communications technologies addressing specific transportation-, mobility-, and safety-related issues within the County. This process is illustrated in Figure 14.
FIGURE 14 COMBINING STRATEGIES INTO PROJECTS
One or several strategies may be included or addressed in one ITS project. Twenty-eight (28) potential ITS projects were identified as described below. Each project also indicates the compatibility with the Regional ITS Architecture by indicating the
recommended market packages. A description of each market package is included in Appendix D. The potential ITS projects are divided into four primary sections by jurisdiction, which are:
• Region-wide (RW) • Plant City (PC) • Tampa (TP) • Hillsborough County (HC)
RW-1: TAMPA VIDEO AND EVENT EXCHANGE NETWORK (TVEEN)
Project Description:
Provide integrated real-time CCTV camera streaming video feeds and an event exchange system that would enhance the coordination of multi-agency incident/emergency response (first and secondary) and traffic management services.
The deployment of TVEEN would provide a low cost means of providing live video streams from CCTV cameras (as available) located throughout the Tampa roadway network, to remote users via the internet using a standard web-browser.
Potential Location(s): FDOT District Seven, TBSC Center
Project Justification/Potential Impacts (Benefits):
1. Provide real-time CCTV camera steaming video feeds using the existing Internet. Emergency response agencies such as FHP, local police, fire, and ambulance stations, TMCs, and airport and transit authorities would benefit from the live images before or during an incident along the freeways and other major arterials and roadways depending on the availability of CCTV camera video feeds (FDOT and other camera video feeds) at the FDOT RTMC.
Emergency responders would be able to remotely access video from an incident site before and/or during the incident along the interstates using their Mobile Data Terminals and/or other web-enabled broadband communications device. All designated agencies would also be able to cost-effectively monitor live motion CCTV camera video feeds from any available CCTV camera on the network using the existing internet.

Hillsborough County ITS Master Plan Update
55
2. Provide incident/event data which would allow emergency first responders, public agencies, and public works maintenance personnel to view real-time, detailed information about traffic incidents including GIS map and GPS-based incident location data, disabled vehicles, and/or crashes.
The event data would provide a full list of traffic events within the District. Events would be hyperlinked to detail screens, providing time stamps, chronology, emergency responders, and other incident clearance information.
The event data would run off the SunGuide traffic incident management database, which powers real-time updates.
Capital Costs: $175,000
O&M Costs: $10,000
ITS Architecture Compatibility: ATIS01, ATIS02
Agencies/Stakeholders Involved: FDOT District Seven, Emergency/Incident Responders (FHP, County Sheriff and Fire, City of Tampa Police and Fire, Plant City Police and Fire, Temple Terrace Police and Fire), HART, Hillsborough County Public Works
Project Dependencies: A TVEEN/Video Request Form would need to be developed to allow for agencies to sign up for access to the video and event data sharing system. Each agency would be responsible for their broadband wireless internet service and connections.
Cost Estimate and Assumptions: It should be noted that this project concept is currently in operations in FDOT District Four (iVEDDS – Interagency Video and Event Data Distribution System) and the pricing provided was obtained from the Vendor/Consultant who is providing this system for FDOT District Four and other districts.
Magnitude of costs include: approximately $175K (capital) which includes: 1 x application server (at $12K/each) + 3 x Video Servers (at $15K/each) + configuration, integration and testing (at $25K) + Engineering (10%) + Other/Contingency/$10K (O&M, vendor provided estimate)
Design Concept Assumptions: Availability of CCTV camera video feeds, video would only for monitoring (not control) purposes, rack space at FDOT RTMC, network connections and available broadband internet services.
Potential Project Scope (typical):
1. Develop a Request for Proposal (RFP) and other contract documentation including system requirements, specifications and details to provide the following:
a. F&I: 1 x Application Server
b. F&I: 3 x Video Servers – handle up to 45 simultaneous video streams (approx. 15 video streams/server). Encoded video streams to the Internet would be set to provide optimal performance for the application and given available bandwidth
c. Provide system deployment, configuration, integration, and testing
d. Software: F&I various third-party video CODEC software/hardware and backend CODEC management and video distribution software components and interface with SunGuide
RW-2: LOW-VISIBILITY AND EXTREME CONDITIONS WARNING SYSTEM
Project Description:
This project will supplement/complement the RWIS system currently in design by FDOT to provide increased coverage throughout the County and region as a whole.
Potential Location(s): County/region-wide (TBD, final locations by FDOT)
Project Justification/Potential Impacts (Benefits):
1. Provide detection and dissemination of dangerous travel conditions as a result of extreme and hazardous weather conditions including; fog, high-wind, flooding, etc.
2. Provide detection and dissemination of dangerous travel conditions as a result of extreme and hazardous smoke conditions as a result of brush fires near the interstates.
Hillsborough County ITS Master Plan Update
56
Capital Costs: $425,000
O&M Costs: $22,000
ITS Architecture Compatibility: MC03, MC04, ATMS19, ATMS24
Agencies/Stakeholders Involved: FDOT District Seven, FHP Troop C
Project Dependencies: Availability of broadband wireless internet services at the locations in which these portable TMSs would be utilized or existing fiber optic communications interface point and transport back to the RTMC
Cost Estimate and Assumptions: $42K (capital) which includes: 2 x RWIS stations (at $100K/each) + 2 x CCTV cameras with pole and cabinet (at $35K/each, F&I) + integration of RWISs, CCTV camera with existing FDOT RWIS system (at $20K) + Engineering (10%) + Other/contingency/$22K (O&M, 7%)
Design Concept Assumptions: Communications would be IP-based using existing FDOT fiber network HUB/Node or wireless hop to nearest fiber node.
Potential Project Scope (typical):
1. Develop a RFP and other contract documentation including system requirements, specifications and details to provide the following:
a. F&I: 2 x RWIS Stations – locations are TBD
i. Assumptions: freeway DMSs are already in place, 2 x CCTV camera would be needed. Wireless and/or fiber connectivity would be provided
ii. Availability and locations of CCTV cameras, static signing with flashing beacons, and/or freeway DMSs for dissemination of warning messages (i.e., dangerous conditions, etc.), as required or needed, would be determined by FDOT during design
b. Integrate with existing SunGuide Ver. 5.x/RWIS system
c. Provide, integrate and test a feed to FL511 and coordinate alert messages to FHP and other agencies, as needed
RW-3: INTERSTATE DMS REPLACEMENT PROJECT
Project Description:
Project concept would include the replacement of existing freeway DMSs with new full matrix, full color and high resolution DMSs.
Potential Location(s): County/region-wide (interstates) – existing DMS locations
Project Justification/Potential Impacts (Benefits):
1. This will greatly enhance the visible impact with motorist readability resulting in faster and more effective response to messages.
2. Reduce maintenance costs due to these being new signs – older DMSs have increasing maintenance costs due to age.
Capital Costs: Phase 1 ($6M)/Phase 2 ($3.5M)
O&M Costs: Phase 1 ($0)/Phase 2 ($0) – assume same as existing O&M
ITS Architecture Compatibility: ATMS06
Agencies/Stakeholders Involved: FDOT District Seven
Project Dependencies: Existing DMS structures would need to be evaluated – to determine if they can be retrofitted. SunGuide software version is capable of supporting color DMS operations.
Cost Estimate and Assumptions:
Phase 1 (<5 year timeframe): 45 sites x $134K/sign (include 7% engineering) = $6.0M (capital)/$0 additional (O&M)
Phase 2 (5 to 9 year timeframe): 26 sites x $134K/sign (include 7% engineering) = $3.M (capital)/$0 additional (O&M)
Design Concept Assumptions: Able to re-use (retrofit) existing DMS structures, electrical service and communications interconnect. Signs would comply with familiar MUCTD standards for shapes and colors. Currently, there is a need for approximately 45 existing DMSs that need to be replaced in the next 2 to 5 years. Retrofit may be an option as existing older DMSs need to be replaced/re-tired.

Hillsborough County ITS Master Plan Update
57
Potential Project Scope (typical):
1. Develop a RFP and other contract documentation including system requirements, specifications and details to provide the following:
a. Replace 71 x Freeway DMS (full matrix, full color, high resolution)
b. Survey and review of existing DMS structures and electrical services
c. Integrate with SunGuide Ver. 6.0 (which will be released soon – that supports color DMS operations)
RW-4: REGIONAL OPERATIONAL PLANNING IMPROVEMENTS
Project Description:
Project would build upon previous successes (i.e., Republican National Convention (RNC), Super Bowls, etc.) to provide further operational improvements and better coordination among agencies and emergency responders responding to incidents, evacuations, and other major events in the County/region.
Project would specifically review existing agency operational plans and procedures to identify and coordinate potential improvements from a regional/integrated response perspective to more effectively respond to incidents and major events in the County and region as a whole. The focus would be to effectively balance emergency service response with restoration of traffic. Technology and communications requirements would also be identified that would better support the execution of operations and response plans.
Elements that would be considered include:
1. Incident Detection, Response and Clearance: Review existing and make recommendations to improve methods for faster detection, verification, and clearance of roadway obstructions.
2. Information Dissemination during Evacuations: Review existing methods and make recommendations for improved techniques for providing County/region-wide dissemination of information during major emergencies or events that require a large-scale and timely dissemination of critical information to residents and travelers within the Tampa area. Coordinate with existing Tampa Bay Catastrophic Plan and State of Florida and County/City Comprehensive Emergency Management Plans, as required or needed.
3. Interstate Closures: Review current issues and make recommendations on operations and system improvements related to response to major incidents resulting in a closure of the interstate. Discuss concerns/issues related to extended lane blockages as a result of incident investigations – explore how it may be possible move emergency and other vehicles to re-open travel lanes as soon as possible after investigation has been completed.
4. Planned Special Events: Building on the previous successes (i.e., RNC, Super Bowls, etc.) review current needs and issues related to major events and make recommendations for improved coordination and execution of services during special events that impact the transportation system. Several of the larger regional planned special events within the County would be evaluated.
5. Interagency Communications: Review existing interagency/interoperability communications issues and limitations that impact effective and coordinated operations and response plans.
6. Training: Additional or modified staff training and schedule that may be needed or required based on the findings and recommendations from this project.
Potential Location(s): County/region-wide
Project Justification/Potential Impacts (Benefits):
1. Provide expanded and optimized response plans for all agencies involved in response to County/region incidents, evacuations and other major events.
Capital Costs: $350,000
O&M Costs: $0
ITS Architecture Compatibility: All proposed ATMS Service Packages, ATIS01, ATIS02, EM06-10
Agencies/Stakeholders Involved: TIM task team(s) for this region, Transportation Agencies (FDOT District Seven, County/Cities), Emergency/Incident response agencies and Emergency Management agencies (FHP, local law enforcement, and fire and rescue agencies, etc.)
Project Dependencies: None
Cost Estimate and Assumptions: $350K (capital)/$0 (O&M)

Hillsborough County ITS Master Plan Update
58
Design Concept Assumptions: Active participation in TIM team meetings.
Potential Project Scope (typical):
1. Develop schedule, goals and objectives, and requirements for a County/region-wide operational and response plan and come to an agreement on how each agency’s individual operational plan(s) will contribute to meeting the overall operational requirements as determined by this project and agreed upon by all impacted stakeholder.
2. Conduct a series of stakeholder/TIM Task Force meetings to fully discuss the topics above along with the overall requirements with the goal of each stakeholder providing updates and improvements to their existing operational plans and guidelines.
a. Each key stakeholder agency (i.e., FDOT, FHP, local law enforcement, and fire and rescue, etc.) would update their existing operational procedures and guidelines to provide an optimal and better coordinated response plan to incidents, emergencies and other events that impact the County/region as a whole.
RW-5: ARTERIAL REAL-TIME SPEED AND TRAVEL-TIME SYSTEM
Project Description:
Project would provide real-time speed and travel-time data using GPS-equipped devices in vehicles through a private data service provider along state roads and other major arterials within the County.
Potential Location(s): County/region-wide (arterial/state roads)
Project Justification/Potential Impacts (Benefits):
1. Allow for transportation planners to monitor real-time and study historical speed and travel-time data along arterials as well as the performance of traffic mitigation solutions along area roadways.
2. Permit en-route dissemination of travel-time information to be displayed on arterial DMSs (as available) and PDAs (iPhones, Droids, etc.) to allow
travelers (including commercial truckers) to potentially take alternative routes.
3. Provide real-time arterial speed and travel-time data to FL511 to expand its coverage including state roads/major arterials within the County. Upgrades to FL511 would provide expanded color-coded, web-based Speed Map(s) of selected corridors/state roads, or other.
Capital Costs: $175K (RFP Development), $150K (Phase 1 Deployment Start-up)
O&M Costs: Phase 1 at $6,700/month (for approx. 100 miles of roadway)
ITS Architecture Compatibility: ATMS02, ATIS01
Agencies/Stakeholders Involved: FDOT District Seven, FDOT Central Office and their FL511 contractor, Hillsborough County, Pinellas County, Hernando County, Pasco County, Citrus County
Project Dependencies: coordination with FL511 contractor
Cost Estimate and Assumptions: It should be noted that pricing for this project concept assumes previous cost numbers from Inrix on other similar systems. Magnitude of costs includes:
1. Development of RFP: Prepare RFP to solicit a vendor/data service provider to provide real-time speed and travel-time data and services. Assumes $175K for engineering services to prepare RFP.
2. Deployment of Data Services: $150K (start-up services, data server, XML data feeds and interface with FL511, etc.) + on-going data services of $6,700/month or $80K/year (which assumes 100 miles (Phase 1) of major arterial/state roads within the County x $800/year/mile or $67/month/mile).
Design Concept Assumptions: Real-time speed and travel-time GPS-based data is available for major arterials and other roadways within the county/region through data service providers (e.g., Inrix, Tom-Tom, etc.). Other data sources that may be available may be made available to data service providers for fusion processing to further enhance coverage and performance on arterials and other roadways.

Hillsborough County ITS Master Plan Update
59
Potential Project Scope (typical):
1. Develop a RFP to solicit proposals from qualified data service providers to provide area-wide real-time speed and travel-time data.
2. Review technical proposals and support the selection of data service provider.
3. Coordinate with the FL511 contractor and SunGuide.
RW-6: REGIONAL COMMUNICATIONS NETWORK STUDY
Project Description:
Project would provide a detailed and comprehensive assessment and survey of the current communications infrastructure and networks utilized by transportation operation agencies (FDOT District Seven, County/Cities) and emergency/incident response agencies, emergency operations centers/911 call centers, and others.
Potential Location(s): County/region-wide
Project Justification/Potential Impacts (Benefits):
1. Will provide a comprehensive communications plan and requirements supporting existing and future operational needs and requirements for integrated response and traffic management.
2. Would potentially reduce deployment costs by identifying upgrades and incorporating these improvements and upgrades under existing or planned.
Capital Costs: $400,000
O&M Costs: $0
ITS Architecture Compatibility: All proposed ATMS Service Packages, ATIS01, ATIS02, EM06-10
Agencies/Stakeholders Involved: FDOT District Seven, TIM task team(s), emergency/incident response agencies, Hillsborough County, Pinellas County, Hernando County, Pasco County, Citrus County
Project Dependencies: RW-4 (regional operational requirements) completion
Cost Estimate and Assumptions: $400K (capital)/$0 (O&M) (for Communications Study, requirements definition, coordination with multiple stakeholders)
Design Concept Assumptions: Current FDOT project to document existing fiber optic communications infrastructure is completed
Potential Project Scope (typical):
1. Develop and document existing regional communications maps of infrastructure and networks – obtain and leverage recently completed FDOT and County maps documenting existing and/or planned communications information.
2. Develop requirements and recommendations for providing the necessary communications interfaces and links (if not already existing) among the various agencies to support regional and local traffic management and emergency/incident operations.
Focus will be on center-to-center (C2C) communications as required (data, surveillance video, voice, video conferencing, internet, WiFi, radio, etc.), existing fiber including existing allocation/utilization, missing segments/gaps, shared resource opportunities, SLERS participation, network capacity, loading, redundancy, availability, interagency network security provisions, network cyber-attack safeguards/provisions, etc. would be considered as part of this comprehensive plan.
3. Perform gap analysis and make recommendations on potential communications projects to implement the recommendations and requirements developed as part of this project including costs and deployment schedule.
RW-7: DYNAMIC ALTERNATIVE ROUTE SYSTEM (DARS) STUDY
Project Description:
Project would evaluate the feasibility of implementing a real-time, dynamic route diversion management system versus a fixed route diversion methodology. The dynamic route system is called RTRDS. This would include a software system that would leverage real-time traffic data from SunGuide and the Real-Time Arterial Speed and Travel-Time System (see RW-5).
Hillsborough County ITS Master Plan Update
60
The system could be used for four different scenarios: 1) it could provide a computer-aided environment to help the RTMC to co-develop better diversion plans with the local authority; 2) when a pre-planned alternate route cannot be used due to some unforeseen event, this system could automatically generate alternative plans and rank them to assist the RTMC in the decision making; 3) similarly, the system could be used if a pre-planned alternate route is not available for a given incident; and 4) if an initially effective alternate route becomes inadequate due to a secondary incident, the system could search for a better alternate route within seconds.
The project concept would provide a web browser-based user interface and include, a built-in database for the RTMC to manage information on past, current, and future incidents. System would interface with FL511 allowing the FL511 mobile phone user to obtain real-time alternative route instructions/directions on a GIS-based map during a route diversion or other emergency scenario.
Mobile phones could retrieve the alternate route information at each affected intersection/corridor.
A mobile user interface could also be used to communicate the diversion plan to FHP and police officers to coordinate with them in directing traffic and other workers in setting up route diversion equipment in a multiple-incident scenario.
Potential Location(s): County/region-wide
Project Justification/Potential Impacts (Benefits):
1. Quality of alternative routes would be optimal with respect to current traffic conditions.
2. Alternative routes would be systematically compared and ranked to provide informative data to help the user in decision making.
3. System has potential to save time and costs in the investigation and development of route diversion plans.
4. System helps manage unforeseen incidents more efficiently using optimal alternate routes, which are systematically generated to minimize the impact on the surrounding area.
5. Mobile phones can retrieve the alternate route information at each affected intersection/route.
6. Mobile user interface can be used to communicate the diversion plan to FHP and local law enforcement to coordinate them in directing traffic and other workers in setting up route diversion equipment in a multiple-incident scenario.
Capital Costs: $300,000
O&M Costs: $0
ITS Architecture Compatibility: ATIS01-06, ATMS06
Agencies/Stakeholders Involved: FDOT District Seven, Hillsborough County, Pinellas County, Hernando County, Pasco County, Citrus County
Project Dependencies: RW-5 (Real-time arterial speed and travel-time system) is completed
Cost Estimate and Assumptions: $300K (capital)/$0 (O&M) (for Implementation Plan/Study, coordination with stakeholders including FL511 and demonstration)
Design Concept Assumptions: Real-time speed and travel-time data is available along major arterials and state roads
Potential Project Scope (typical):
1. Develop an Implementation Plan/Study with final recommendations on the feasibility of implementing the approach presented under FDOT Research Contract No. BD548-20, Real-time Route Diversion.
2. Provide recommendations and requirements for County-wide implementation, any modifications and changes to the concept, schedule and cost for deployment, coordination with FL511 contractor and SunGuide to provide optimal configuration for providing dynamic alternative route selection and management, and coordination with FHP and local law enforcement agencies with how this concept would interface their current operations.
3. Demonstrate the concept working with the FL511 contractor and SunGuide.

Hillsborough County ITS Master Plan Update
61
RW-8: HIGHWAY-RAIL CROSSING TRAFFIC AND SAFETY SYSTEM STUDY AND PILOT
Project Description:
Project would document and evaluate all at-grade highway-rail crossings that have high volumes of traffic where rail crossings are routinely blocked (car/bus on rails), vehicles going around gate arms, and/or vehicles not stopping/yielding warning signals to determine the most cost effective approach using technology to mitigate these safety issues.
Study would document the findings with recommended technologies/solutions along with prioritized at-grade crossings to potentially implement the recommended solutions.
Possible active solutions/technologies (if not already installed) that would be considered include:
1. Upgrade of signal interconnect with traffic signals.
2. Preemption and pre-signals at road intersections near rail crossings with programmable visibility or louvered traffic signal heads for far-side intersection control.
3. Arterial DMSs at crossing approaches – warning motorist of on-coming train, possibly flash message.
4. Automatic gates – timed to ensure no cars/buses trapped on the rails. Provide necessary interface and advanced warning indicator of approaching train to provide sufficient time to clear signal phases.
5. Crossing cantilevers (2 lanes) – to prevent going around (passive solutions: raised median islands or channelization devices).
6. Warning horn or bell – an audible bell or horn that emulates a coming train to want motorists.
7. Crossing gate video monitoring/enforcement – integrated with TMC with communications with train dispatch.
8. AAWS – provide warning that train is approaching. Beacons connected to rail track circuitry.
9. In-vehicle warning systems.
Potential Location(s): County/region-wide (Falkenburg Avenue and Broadway Avenue) or as recommended in the Study
Project Justification/Potential Impacts (Benefits):
1. Increase the safety/decrease the number of crashes/near-crashes at highway-rail (at-grade) intersections.
Capital Costs: $225,000 (Study), $600,000 (Demo)
O&M Costs: $42,000
ITS Architecture Compatibility: ATMS03, ATMS8, ATMS13-15
Agencies/Stakeholders Involved: FDOT District Seven, Hillsborough County, CSX Railroad
Project Dependencies: None
Cost Estimate and Assumptions: Magnitude of costs includes:
1. Development of Study: $225K (capital, Feasibility/Implementation Plan) including preliminary design plans and requirements for demonstration crossing system, coordination with key stakeholders and CSX railroad
2. Demonstration: $600K (capital per crossing)/$42K (O&M, 7%) for a typical crossing including integration with Hillsborough County and FDOT
Design Concept Assumptions: Fiber communications is nearby to provide interconnect back to the TMC. All equipment/device that are located on railroad property must be approved by the railroad. Any gates and/or flashers that are activated by trains would be installed, owned and maintained by the railroad.
Potential Project Scope (typical):
1. Develop a Study to investigate specific issues and concerns at different at-grade highway to railroad crossings, prioritize a list of crossing locations based on safety concerns, recommend technologies and solutions to mitigate these safety concerns, and make recommendations on which crossing to perform a demonstration of the recommended solution.

Hillsborough County ITS Master Plan Update
62
2. Demonstrate the recommended ITS technologies and strategies at the following location: Falkenburg Avenue and Broadway Avenue highway-rail at-grade crossing and/or as recommended in the Study.
RW-9 : MEDIAN CROSSOVER UPDATE STUDY
Project Description:
There are a number of existing median crossovers along the interstates within the County; however, often their location and/or spacing does not facilitate adequate response times for emergency vehicles needing to reverse direction to gain access to an accident scene on the opposite side of the interstate. In other cases, the existing crossover design does not permit some types of response vehicles to access it and/or use it safely.
This project would review existing median crossovers and previous studies and plans conducted and determine the feasibility of providing additional openings and/or improve crossover design.
Potential Location(s): County/region-wide
Project Justification/Potential Impacts (Benefits):
1. The Plan would be a benefit to FDOT, FHWA and response agencies to document the individual median crossover improvements needed.
2. Improve overall response times for incident/emergency responders to the scene by providing additional and/or improved crossover access points.
3. Increase the safety as a result from accidents by providing faster response times.
4. Decrease the number of secondary accidents as a result of decreased congestion resulting from faster response times.
Capital Costs: $200,000 (Master Plan)
O&M Costs: $0
ITS Architecture Compatibility: EM02
Agencies/Stakeholders Involved: FDOT District Seven, FHWA, FHP, Fire and Rescue agencies
Project Dependencies: None
Cost Estimate and Assumptions: $200K (Master Plan)/$0 (O&M) including coordination with stakeholders
Design Concept Assumptions: None
Potential Project Scope (typical):
1. Document current median crossovers conditions, locations, and their accessibility when responding to major incidents on I-4, I-275, and I-75.
2. Review previous crossover studies and plans and investigate the reasons that permission has not been granted to create additional crossovers (to date) and/or make improvements to existing crossovers.
3. Based on this review, develop and make recommendations on median crossover improvements needed along with an implementation plan and estimated costs to make the improvements. Plan should consider and attempt to provide improvements as part of existing and/or planned roadway projects. Plan should also take into consideration increasing traffic volumes with fewer gaps in the traffic flow, as well as interstate widening plans and possible rail services that could be deployed along the medians causing the medians to narrow and/or disappear.
The Plan would take into account FDOT’s Roadway Design Bulletin 06-09 and be sensitive to the needs of the emergency responders while recognizing that the function of the interstates is to move high volumes of traffic at high speeds in an environment where traffic movement is carefully controlled.
RW-10: TAMPA-BAY COMMERCIAL TRUCKING SMART ROUTE AND PARKING STUDY AND PILOT
Project Description:
Project would conduct a study to evaluate and recommend smart route navigational and parking application tools for commercial carriers/truckers along the Tampa Bay regional and local truck routes. This study would also evaluate both existing and any new commercial truck parking facilities to provide real-time availability/occupancy information to commercial carriers so they can find an alternative location to park rather than on the shoulder at these locations. Also, truckers driving around looking for a place to park their truck increase congestion on area roadways.
Hillsborough County ITS Master Plan Update
63
Project would evaluate and recommend an overall parking management system that provides the equipment needed to track parking availability at each of the truck parking facilities and make this information available through an upgraded/revised FL511 traveler information system.
Truckers would be able to pull up, using an iPhone mobile type app, a parking facilities list in the Tampa Bay area along with an active open space status with directions to open lots.
Potential Location(s): County/region-wide (Parking Lot – Trucking)
Project Justification/Potential Impacts (Benefits):
1. Provide a tool to the commercial truckers within the County/region to give them the capability to in real-time find available parking lot/facilities that have available (open) spaces for parking their trucks over-night. This will mitigate potential congestion and safety concerns as a result of excessive truck traffic on the roads and provide real-time mapping and directions to these available spaces.
2. Provide real-time traffic congestion/travel-time and other information (i.e., construction activities, etc.) along designated commercial truck routes that will provide the trucker information to facilitate making alternative routing decisions. This will improve overall trucking delivery schedules and productivity.
Capital Costs: $225,000 (Feasibility/Implementation Plan), $180,000 (Demo, parking)
O&M Costs: $14,000
ITS Architecture Compatibility: ATMS02, ATIS01-06
Agencies/Stakeholders Involved: FDOT District Seven, FDOT (DHSMV, FMCSA), Florida Truckers Association (FTA), local parking lots/businesses that accept large commercial vehicles
Project Dependencies: None
Cost Estimate and Assumptions: Magnitude of costs includes:
1. Development of Study: $225K (capital, Feasibility/Implementation Plan) including preliminary design plans and requirements for demonstration lot system and coordination with key stakeholders and trucking association
2. Demonstration: $180K (capital per lot)/$14K (O&M, 8%) for a typical lot including interfaces and coordination with FL511 contractor and SunGuide
Design Concept Assumptions: Available FDOT or County/City communications network/fiber optic access point is nearby to parking facility
Potential Project Scope (typical):
1. Develop a comprehensive feasibility study researching and recommending a web-based application/tool for potential use by commercial trucking within the Tampa Bay region including the following:
a. Provide collaboration to publish a single local truck route map that is accessible through the County, City, and MPO websites. Updates would be posted that coincide with updates to the functional classification network and comprehensive plan land use changes. The static map could be provided to truckers via an informational pamphlet conveniently distributed at larger fueling sites, weigh stations, driver schools, and DHSMV licensing centers.
b. Coordinate with and provide FL511 in regards to a new Truck Route Mapping and Information application including the development of a Google/ESRI GIS online route mapping application through FL511 including the mobile app.
c. Interact with private vendors to determine a common platform that could be accessed by the companies that provide truck routing applications. This would include an interface with SunGuide to obtain congestion/delay information, road closure, construction activity, and special event activity updates on a “real-time” basis. Truckers could then know to avoid affected segments and the software would re-route appropriately based on the truck route network. Additional data could be incorporated to better guide truck deliveries including load size, type, and time of delivery.
d. Develop and post online a Truck Route database for access by private routing companies such as PC*Miller, Tom-Tom, and

Hillsborough County ITS Master Plan Update
64
others providing national trucking databases to commercial carriers.
2. Coordinate with SunGuide and FL511 in regards to integration with and inclusion of travel-time information and any on-going and planned construction information along designated trucking routes into the potential trucking navigational application/tool.
3. Identify and document existing parking facilities available for commercial trucking and any existing systems and/or infrastructure that is at the lot or nearby to it. Study the following parking technologies:
a. Identify and evaluate entry/exit count detection systems. Parking monitoring component including vehicle detection devices at each of the lots’ entrance and exit points to detect/count trucks entering and leaving the lot. Consideration would be given to the sensor’s detection zone relative to the width of the entry and exit driveways to avoid miss-counting. Depending on the findings, flexible delineators may be needed to channel traffic into lanes to ensure accurate counting.
b. Identify and evaluate over-height detection systems. Over-height detectors would likely be placed at the entry and exit points of the commercial parking facility corresponding with the vehicle detection devices mentioned above to ensure that entry and exit counts are related to semi-trailer/commercial trucks as opposed to passenger vehicles.
c. Identify and evaluate variable message boards. Signs consisting of a static element and dynamic message inlay(s) at the approach to the lot to provide current information whether there is available spaces in lot.
d. Make a final recommendation of smart truck parking system technology and configuration would be provided along with an implementation plan and cost for each commercial parking facility.
4. Provide and conduct a demonstration at one commercial parking facility implementing the recommended technology and configuration and would also establish the central management system and interfaces to FL511 and FDOT SunGuide.
a. Demonstration would be provided at a facility to be determined.
RW-11: ACTIVE TRAFFIC MANAGEMENT (ATM) FEASIBILITY STUDY
Project Description:
Project would evaluate the feasibility of development of ATM initiatives to facilitate the management of recurrent and non-recurrent congestion by monitoring and controlling traffic in real-time.
Possible ITS technologies and strategies that could be deployed:
1. Speed Harmonization – would use overhead gantries that display changing speed limits and real-time traffic information for drivers over each lane.
2. Queue Warning – would alert drivers of downstream backups and direct drivers passing through to use alternate lanes.
3. Hard Shoulder Running – would increase traffic flow by allowing drivers to use the shoulder as a traffic lane during the most congested periods or to move around a collision or stalled vehicle.
4. HOT/Managed Lanes – is already being studied for possible deployment within the District. This project would coordinate closely with existing FDOT studies underway in regards to Managed/HOT Lanes deployment plans.
Initial ATM study corridor would include I-4 or other interstates, as determined by FDOT.
Potential Location(s): County/region-wide (I-4 or other interstates, as determined by FDOT)
Project Justification/Potential Impacts (Benefits):
1. Provide additional effective throughput through integration and additional traffic control methods.
2. Increase safety through the use of active/smart queue warning systems.
Capital Costs: $275,000 (Study)
O&M Costs: $0

Hillsborough County ITS Master Plan Update
65
ITS Architecture Compatibility: ATMS01, ATMS04, ATMS06-08, ATMS19, ATMS21-24
Agencies/Stakeholders Involved: FDOT District Seven
Project Dependencies: Coordination will be required, as required, with existing and planned interstate construction projects, potential HOT/Managed Lanes projects, as well as rail projects.
Cost Estimate and Assumptions: $275K (capital, Study) including coordination with FDOT and stakeholders + Other/contingency/$0 (O&M) (Note: it is estimated that a representative construction project would be $9.5M assuming $1M/mile for construction with ½-mile spacing for 8 miles)
Design Concept Assumptions: None
Potential Project Scope (typical):
1. Investigate existing traffic and roadway conditions, geometry, ITS performance metrics, and selection of candidate interstate sections for potential deployment.
2. Provide justification and selection of traffic control techniques, develop interface and integration requirements, design specifications, details, plans, cost estimates and other items required to provide a complete plans package.
3. Provide coordination with FDOT SunGuide operations.
4. Recommend top two candidate interstate sections for possible implementation.
RW-12: EMERGENCY ALERT SYSTEM ENHANCEMENTS
Project Description:
Project would include an enhancement to the existing Reverse 911 system by providing a web-based, single platform emergency communications system that provides both one-way and two-way communications capabilities.
System would be capable of notifying one to many through multiple one-way communications methods including; Reverse 911 (phone), SMS/text, email, fax, a website or multiple connected websites, and to unconnected websites or social media sites like Facebook, Twitter through RSS (Really Simple Syndication) feeds.
System would also be capable of providing two-way communications to facilitate communications between emergency communications staff, affected people, and first responders in the field with details of the unfolding event.
System would provide direct connectivity with major wireless carriers to improve SMS delivery, white listing with major ISPs to prevent alerts from being blocked as spam, and provide high volume delivery to carriers, networks, and devices.
System would be hosted in top tier (e.g., Tier IV) national carrier facility providing high-availability, fully redundant, multi-tiered, multi-server fault tolerant and highly secure architecture.
Potential Location(s): County/region-wide
Project Justification/Potential Impacts (Benefits):
1. Provide greater coverage (i.e., reach more people) in a more timely manner (quicker notification – due to larger number of dissemination options).
2. Increased safety due to faster and more comprehensive notification.
3. Greater system reliability.
Capital Costs: $150,000 (RFP development), $180,000 (Deployment)
O&M Costs: $5,000
ITS Architecture Compatibility: EM06-08, EM10
Agencies/Stakeholders Involved: FDOT District Seven, Hillsborough County Sheriff’s Office, Emergency Management Agencies
Project Dependencies: Coordination with existing Reverse 911 system, region Emergency Alert System and TIM Task Force
Cost Estimate and Assumptions: $150K (capital, RFP development) and $180K (capital, Deployment) including new hardware, software, 3 year contract, integration and testing, assume $5K/year (O&M, 3 %)
Design Concept Assumptions: Upgrade to the existing Reverse 911 using the same location.

Hillsborough County ITS Master Plan Update
66
Potential Project Scope (typical):
1. Research and evaluate available emergency/broadcast wide-area alert systems and determine final system requirements and integration requirements.
2. Prepare RFP/Bid documents for the purchase, deployment and testing of a new broadcast/emergency broadcast alert system.
3. Port over existing database information to the new system.
4. Prepare an advertisement/marketing plan to notify Tampa Bay/area residents of the new system and determine how they would like to be notified in the event of a major emergency event. Develop the tools to permit residents to sign up/send in the necessary information to be loaded in a database for the new system.
RW-13: HILLSBOROUGH COUNTY AIR QUALITY MONITORING (AQM) SYSTEM
Project Description:
Project provides network communications capabilities to the existing Air Quality Monitoring (AQM) stations within the County operated by Hillsborough County EPC. Since ozone is the pollutant of concern in Florida, close monitoring for air quality compliance and the performance of different mitigation strategies is important.
This Project provides web-based communications to each of the existing eight air monitoring stations that collect continuous data through a data acquisition system. This system works via a direct connection to the instrument’s Ethernet port and data is transmitted through wireless broadband communications.
Potential Location(s): County/region-wide (modification to existing AQM stations)
Project Justification/Potential Impacts (Benefits):
1. As a result, remote access to the instrumentation and the ability to obtain real-time data is now possible.
2. The data retrieval system is now totally automated.
3. Broader dissemination of critical health warnings to the traveling and public in general through possible use of FDOT DMSs and through websites.
Capital Costs: $55,000
O&M Costs: $0
ITS Architecture Compatibility: ATIS01, ATMS11
Agencies/Stakeholders Involved: Hillsborough County EPC, FDOT District Seven, FDEP
Project Dependencies: None
Cost Estimate and Assumptions: $55,000 for web-enabled data acquisition equipment, wireless broadband modems and implementation.
Design Concept Assumptions: Continued operation and future expansion based on the availability of funding, acquisition of compatible equipment, and on-going maintenance of system hardware.
Potential Project Scope (typical):
1. F&I wireless broadband network device (Modem/Router) at each existing AQM stations.
2. F&I web-enabled data acquisition software at County EPC office.
3. F&I broadband wireless service contracts.
4. Integration and testing of all monitoring stations and the County EPC office.
RW-14: INTERSECTION SAFETY IMPROVEMENTS PLAN AND PILOT
Project Description:
Project would evaluate potential causes of vehicle and pedestrian/bicycle safety issues at high crash intersections and make recommendations in regards to potential strategies that should provide improved safety. Some of the technologies and safety

Hillsborough County ITS Master Plan Update
67
improvement strategies that should be evaluated and considered for possible deployment include the following:
1. Red-light Running. This strategy would be an expansion of existing red light running systems in the area and would use video technology to identify vehicles running red lights. Red light running programs discourage aggressive driving and excessive speeding, consequently reducing crash rates.
2. Install Programmable Lens Signals/Visors or Louvers. This strategy would evaluate the potential use of optically programmed or visibility-limited signals limit the field of view of a signal. They allow greater definition and accuracy of the field of view.
3. Install Activated Advance Warning Flashers. This strategy would evaluate the possibility of providing a capability to forewarn the driver when a traffic signal on approach is about to change to the yellow and then the red phase.
4. Infrared Detectors. This strategy would evaluate the possibility of providing the capability where pedestrians entering the curbside infrared detection zone would activate the pedestrian call feature, while those detected in the crosswalk would extend the clearance interval.
5. Microwave Detectors. This strategy would evaluate the possibility of providing the capability where pedestrians entering the curbside microwave detection zone would activate the pedestrian call feature. At the same time, slower pedestrians detected within the on-street detection zones would receive more time to cross the street.
Project would also design and implement the selected/recommended strategies to supplement already existing and/or planned safety features (i.e., optimal signal timing, placement of signal heads, 12-inch signal lenses, LED signal lenses, count-down signals, and in-pavement lights) at selected high crash intersections within the area.
Coordination with the County will be required for technology selection and possible implementation at individual intersections.
Potential Location(s): County/region-wide (Demo at three selected intersections as follows)
Preliminary potential locations for this Study and Demonstration include the following intersections:
1. CR 584 (Waters Avenue) @ Sheldon Road – County high crash site
2. CR 676 @ Falkenburg Road – County high crash site
3. 40th Street @ Hillsborough Avenue – City high crash site
Project Justification/Potential Impacts (Benefits):
1. Mitigate congestion and safety through various technology solutions at selected high-crash intersections and corridors for vehicles, pedestrians, and bicycles.
Capital Costs: $275,000 (Study), $550,000 (Demo, for three selected intersections)
O&M Costs: $22,000
ITS Architecture Compatibility: ATMS26
Agencies/Stakeholders Involved: FDOT District Seven, City of Tampa, Hillsborough County, Temple Terrace
Project Dependencies: None
Cost Estimate and Assumptions: $275K (capital, Study)/$550K (total capital, Demo) including; $150K per intersection, 10% design engineering + contingency, $22K (O&M, 5%)
Design Concept Assumptions: None
Potential Project Scope (typical):
1. Identify, evaluate, and document safety and congestion concerns and issues at intersections within the County including vehicles, pedestrians, and bicycles.
2. Identify and evaluate various technologies and safety improvement strategies and rank them on potential effectiveness.
3. Develop design requirements, details, Plans and cost estimates for the three selected intersections for demonstration.

Hillsborough County ITS Master Plan Update
68
4. Provide all coordination, integration and testing with existing traffic signal systems and TMCs.
5. Develop and collect before/after crash data collection and evaluation plan that would be provided as part of the demo to measure performance improvements.
PC-1: PLANT CITY ATMS EXPANSION PHASE 1 DEPLOYMENT
Project Description:
Project would provide Phase 1 ATMS improvements, as well as fill-in gaps in the existing communications coverage within Plant City.
Potential Location(s): Plant City locations include:
1. Thonotosassa Road @ I-4 to Strawberry Terrace – fiber interconnect
2. Park Road @ Cherry Street to I-4 – fiber interconnect
3. CCTV at US 92/Whitehurst Road; CCTV at E. Baker Street/Palmer Street; CCTV at Wheeler Street/I-4 ramp
Project Justification/Potential Impacts (Benefits):
1. Will provide system redundancy to mitigate overall system impact during a fiber break.
2. Will provide valuable video surveillance at key intersection/segment to complement existing video coverage along the corridor.
Capital Costs: $175,000
O&M Costs: $7,500
ITS Architecture Compatibility: ATMS01, ATMS03, ATMS06, ATMS08
Agencies/Stakeholders Involved: Plant City Traffic, FDOT District Seven
Project Dependencies: None
Cost Estimate and Assumptions: $175K (capital) including; engineering for selection of materials/equipment, fiber optic cable and components, 3 x CCTV cameras, and intersection upgrades + Engineering (10%)/$7,500 (O&M, 5%)
Design Concept Assumptions: City staff is expected to provide the installation and fiber splicing work as required
Potential Project Scope (typical):
1. F&I: 5,000 ft. x Fiber optic cable (12/12) – to close gaps and create network redundancy – include fiber splicing, conduit, pull boxes
2. F&I: 3 x CCTV cameras to provide complete coverage of critical corridors
3. F&I: 1 intersection x Traffic responsive upgrades – needed improvements
PC-2: PLANT CITY ATMS EXPANSION PHASE 2 DEPLOYMENT
Project Description:
Project would provide Phase 2 ATMS improvements and expansion to support Route Diversion along US 92 during major I-4 closures as well as support traffic/event management activities during the Strawberry Festival and other events within Plant City.
Potential Location(s): Plant City locations include:
1. US 92 at Branch Forbes Road, Woodrow Wilson Street, Alexander, Wheeler Street, Garden Street, Park Road, Whitehurst Road
2. Park Road at US 92 (SB)
3. Alexander Road at US 92 (SB)
4. Wheeler Street at US 92 (SB)
5. Reynolds Street at Woodrow Wilson Street (EB), Alexander Street (EB) and Wheeler Street (EB)
Project Justification/Potential Impacts (Benefits):
1. Will provide advanced traffic/incident management capabilities for use during major route diversion events as a result of I-4 closures, as well as

Hillsborough County ITS Master Plan Update
69
during major special events (i.e., Strawberry Festival, etc.). This will help monitor congestion and incident response activities to improve traffic flow and travel times, as well as improve overall safety along these corridors/roadways.
Capital Costs: $1.27 million
O&M Costs: $58,000
ITS Architecture Compatibility: ATMS01, ATMS03, ATMS06, ATMS08
Agencies/Stakeholders Involved: Plant City Traffic, FDOT District Seven
Project Dependencies: None
Cost Estimate and Assumptions: $1.27M (capital) including; 12 x ADMS ($75K/each for sign + $15K/each for structure) + 1 x CCTV ($3,200/each + $5K/pole) + 10 x Type 336S cabinets ($3,500/each) + (Wireless system ($6K) + Other (approx. $25K – incl. TMC S/W upgrades, integration, fiber drop cables w/ splicing, training) + Engineering (10%)/$58K (O&M, 5%)
Design Concept Assumptions: Existing traffic signal mast arms cannot be used for mounting small ADMS panels – separate mounting structures are expected.
Potential Project Scope (typical):
1. Furnish and install the following ITS devices:
a. 6 x Arterial DMS (full matrix, full color, high resolution) US 92 locations: @ Branch Forbes Road (WB), Woodrow Wilson Street (EB), N. Alexander Street (EB), SR 39 (Wheeler Street) (EB), N. Garden Street (WB), N. Park Road (WB), Whitehurst Road
b. 1 x Arterial DMS Park Road location: @ US 92 (SB)
c. 1 x Arterial DMS Alexander Street Location: @ US 92 (SB)
d. 1 x Arterial DMS Wheeler Street location: @ US 92 (SB)
e. 3 x Arterial DMS Reynolds Street locations: @ Woodrow Wilson Street (EB), N. Alexander Street (EB), Wheeler Street (EB)
f. 12 x cantilever type structures for the ADMS – with foundations
g. 1 x CCTV at Branch Forbes Road @ US 92 – with camera pole and foundation
h. Wireless communications from Branch Forbes Road/US 92 to Lemon Street (possible repeater location needed due to possible LOS constraints
i. 10 x Type 336S field cabinets to support ITS devices above – share existing Traffic Cabinets to the maximum extent possible
j. Fiber optic interconnect to field cabinets except for Branch Forbes Road/US 92 (wireless site)
2. Provide City TMC Upgrade – existing ITS Software (Cameleon ITS) to control/monitor ADMSs will require additional licenses.
3. Integrate and test the system – including all installed field devices, cabinets and Plant City TMC equipment, interfaces, and software control of all devices.
PC-3: PLANT CITY EMERGENCY VEHICLE PREEMPTION (EVP) EXPANSION
Project Description:
Provide and/or expand emergency preemption systems at Plant City along selected corridors/intersections as described below. Provide emergency vehicle signal preemption for fire and emergency medical service vehicles to improve response times and emergency responder safety.
Project would provide 3-M Opticom (or approved equivalent) Priority Control Pre-emption detection including detectors, cabling, discriminator, discriminator rack (if required), green sensing harness (if required), and other equipment as necessary to provide a complete operational 3-M Opticom system.
All interfacing and integration with the existing City Naztec ATMS system would be provided.
Potential Location(s): Project would include the following Plant City locations for EVP deployment:
1. 12 intersections on Alexander Street from J. Redman Parkway to I-4
Hillsborough County ITS Master Plan Update
70
2. 6 other intersections – on US 92 (to complete corridor coverage) and other possible locations (TBD)
Project Justification/Potential Impacts (Benefits):
1. Will improve safety as a result of faster response times by Plant City Fire and Rescue/emergency response vehicles to the incident scene.
Capital Costs: $158,000
O&M Costs: $7,200
ITS Architecture Compatibility: EM02
Agencies/Stakeholders Involved: Plant City Traffic, Plant City Fire and Rescue department
Project Dependencies: None
Cost Estimate and Assumptions: $158K (capital)/$7,200 (O&M, 5%) including $6K/intersection + 14 vehicles x $1,500/emergency vehicle (installed by others) + Other/contingency ($15K) + Engineering (10%).
The cost per intersection is a one-time cost per intersection regardless of the number of vehicles with preemption installed.
Design Concept Assumptions: Naztec ATMS/controller is compatible with Opticom EVP system
Potential Project Scope (typical):
1. Develop Procurement/Bid documentation – including system and equipment specifications and details, coordination with Plant City Fire & Rescue department.
2. Furnish and install the following EVP equipment/subsystems:
a. Twelve intersections on Alexander Street from J. Redman Parkway to I-4
b. Six other intersections – on US 92 (to complete corridor coverage) and other possible locations (TBD)
3. Integrate and test the system – coordination with Plant City Fire and Rescue.
PC-4: PLANT CITY ITS-FACILITY MANAGEMENT SYSTEM (ITSFM)
Project Description:
Project would provide a centralized collaborative asset system designed to help Plant City Traffic manage and track their overall ITS and Traffic Signal System inventory, infrastructure, device and equipment locations, system configuration, and components (assets).
System would be a GIS-based web application designed to manage outside plant facilities based on LAT/LONG coordinates which would be entered into ITSFM import templates produced in Excel.
Field technicians and engineers would have the ability to use mobile apps to access system as-built records.
To use the ITSFM application, a database needs to be populated with data and information from the ITS/traffic signal network. These services could be provided by in-house City staff, contracted out with a City consultant, or a combination of City in-house staff and consultant staff.
Data field services would involve collecting GPS points of all field equipment, communications infrastructure and electrical components, survey of installed ITS field devices and associated support structures, communications hubs, communications equipment, and ITS wireless sites to document the locations and attribute information necessary to populate the system database.
Potential Location(s): Plant City – system-wide
Project Justification/Potential Impacts (Benefits):
1. Will improve overall ITS/traffic signal system maintenance efficiency and reduce cost to maintain as well as provide system design upgrades as a result of maintaining an accurate as-built database/record of the system.
Capital Costs: $24,000 (initial 20 miles)
O&M Costs: $0
ITS Architecture Compatibility: MC07

Hillsborough County ITS Master Plan Update
71
Agencies/Stakeholders Involved: Plant City Traffic, FDOT District Seven
Project Dependencies: None
Cost Estimate Costs & Assumptions: $24K (capital) (assume 20 miles) including ITSFM application (free); Training (free), Data Field Services (approx. $1,200/route mile for fiber + devices – designating + data encoding)
Design Concept Assumptions: ITSFM software (free from FDOT), Training (free from FDOT)
Potential Project Scope (typical):
1. Coordinate with FDOT D7 to obtain ITSFM software
2. Install ITSFM (Ver. 3.0 or later) application
3. Set-up training session for Plant City Traffic staff
PC-5: PLANT CITY POLICE AUTOMATIC VEHICLE LOCATION (AVL) SYSTEM
Project Description:
Project would implement an AVL system on Plant City Police vehicles to allow real-time vehicle tracking.
This enhancement in technology would improve communication between dispatch and the responders and would ensure that the closet appropriate unit is responding to an incident or other emergency call. Mobile CAD system would allow responding units to record en-route and arrival times more accurately as well.
Potential Location(s): Plant City
Project Justification/Potential Impacts (Benefits):
1. Will provide the capability to real-time track police vehicles permitting faster response times to emergency calls coming into Dispatch which will increase safety and efficiency.
2. Will provide greater accuracy in recording of en-route and arrival times.
Capital Costs: $48,500
O&M Costs: $2,400
ITS Architecture Compatibility: EM01, EM02
Agencies/Stakeholders Involved: Plant City Police
Project Dependencies: None
Cost Estimate & Assumptions: $48,500 (capital)/$2,400 (O&M, 5%) including (47 x $545/unit) (47 x $150/vehicle install) + Other ($10K) + Engineering (10%)/O&M ($200/month web tracking + wireless service fee) + $1,500 (1 day training, S/W configuration, testing)
Design Concept Assumptions: None
Project would include: (typical):
1. Develop Procurement/Bid documentation – including system and equipment specifications and details, coordination with Plant City Police department
2. F&I 47 x Mobile AVL units
3. F&I 1 x Web-based application including server
4. F&I wireless service: GPRS or equivalent
5. Provide configuration, testing, and training
PC-6: PLANT CITY FIRE AND RESCUE AUTOMATIC VEHICLE LOCATION (AVL) SYSTEM
Project Description:
Project would implement an AVL system on Plant City Fire and Rescue vehicles to allow real-time vehicle tracking.
This enhancement in technology would improve communication between dispatch and the responders and would ensure that the closet appropriate unit is responding to an incident or other emergency call. Mobile CAD system would allow responding units to record en-route and arrival times more accurately as well.
Potential Location(s): Plant City

Hillsborough County ITS Master Plan Update
72
Project Justification/Potential Impacts (Benefits):
1. Will improve overall ITS/traffic signal system maintenance efficiency and reduce cost to maintain, as well as provide system design upgrades as a result of maintaining an accurate as-built database/record of the system.
Capital Costs: $23,500
O&M Costs: $1,100
ITS Architecture Compatibility: EM02, EM02
Agencies/Stakeholders Involved: Plant City Fire and Rescue
Project Dependencies: None
Cost Estimate & Assumptions: $23,500 (capital)/$1,100 (O&M, 5%) including (14 x $545/unit) (14 x $150/vehicle install) + Other ($10K) + Engineering (10%)/O&M ($200/month web tracking + wireless service fee) + $1,500 (1 day training, S/W configuration, testing)
Design Concept Assumptions: None
Potential Project Scope (typical):
1. Develop Procurement/Bid documentation – including system and equipment specifications and details, coordination with Plant City Police department
2. F&I 14 x Mobile AVL units
3. F&I 1 x Web-based application including server
4. F&I wireless service: GPRS or equivalent
5. Provide configuration, testing and training
PC-7: INTELLIGENT PORTABLE TRAFFIC MANAGEMENT STATIONS
Project Description:
Project would provide trailer-based, intelligent portable traffic management stations (including CCTV, vehicle detector, and/or electronic dynamic message board) to provide traffic management capabilities within construction work zones, as well as to
facilitate traffic management during special events. System would utilize WiFi/wireless services for communications. Data and video from these stations is then transmitted to a TMC via radio, wireless access points, analog/IP-based cellular, or hard-wire cable (optical fiber, etc.) communication for processing.
Traffic/delay information would then be disseminated/provided to the traveling public via the DMSs, highway advisory radios, on-board vehicle/hand-held devices (broadcast e-mails, etc.), a 511 system, and through the internet in a real-time manner.
Systems could be stand-alone or integrated into an existing ATMS/ITS and TMC. They can also be manual controlled or fully automated or variations between.
Potential Location(s): Plant City – system-wide (locations as needed)
Project Justification/Potential Impacts (Benefits):
1. Will provide additional traffic management services and capabilities to help provide overall traffic management and incident response support services during major I-4 route diversion and special events within Plant City.
Capital Costs: $390,000
O&M Costs: $10,000
ITS Architecture Compatibility: MC08
Agencies/Stakeholders Involved: Plant City Traffic
Project Dependencies: None
Cost Estimate & Assumptions: $390K (total capital)/$10K (O&M, 3%) which include: 2 x $170K/each (trailer-based system) + Engineering (10% for specs, etc.), + Other/contingency ($15K, integration and testing into Plant City TMC)
Design Concept Assumptions: WiFi/wireless services are readily available within the Plant City area
Potential Project Scope (typical):
1. Develop Procurement/Bid documentation – including system and equipment specifications and details, coordination with Plant City Traffic

Hillsborough County ITS Master Plan Update
73
2. F&I 2 x trailer-mounted, Intelligent Traffic Management Station including CCTV, small DMS, RTMS-type vehicle detector, with solar-battery back power system and wireless/WiFi communications capabilities
3. Provide integration and testing – including field and Plant City TMC
TP-1: DOWNTOWN ADVANCED PARKING MANAGEMENT SYSTEM IMPLEMENTATION PLAN AND DEMONSTRATION
Project Description:
Project would develop an implementation plan evaluating and recommending an overall advanced parking management system (APMS) that would provide the equipment (i.e., remote sensors, dynamic message boards, static signs with variable message inlays, central computer system for overall control of garage systems, web interface, etc.) needed to track parking availability at each of the Downtown public garages/lots and make this information available through dynamic message sign/electronic boards and through an upgraded/revised FL511 traveler information system.
Project would also include a demonstration at one garage incorporating the recommended technology and configuration, as well as establish the central management system and interfaces to FL511 and FDOT SunGuide.
Potential Location(s):
1. Downtown Tampa – Public Parking Garages (Study)
2. Jackson Street (City Hall) Parking Facility (for Demonstration)
Project Justification/Potential Impacts (Benefits):
1. City traveler would be capable of pulling up parking garage/lot list and open space status along with directions to open lots using a mobile type app, etc. during planned special or other events. This will mitigate congestion in Downtown Tampa by allowing motorists to find available parking faster and more efficiently – especially during major events in downtown.
Capital Costs: $200,000 (Implementation Plan), $180,000 (Demo)
O&M Costs: $16,000
ITS Architecture Compatibility: ATIS01-06, ATIS09, ATMS02, ATMS06, ATMS16-17
Agencies/Stakeholders Involved: City of Tampa Public Works (Parking), City TMC, FDOT District Seven
Project Dependencies: None
Cost Estimate and Assumptions: $200K (capital, Implementation Plan); Demo Lot (capital, $700/parking space x Jackson Street lot at 133 spaces = $93K + $50K (for FL511 interface) + Other ($20K) + Engineering (10%) = $180K total capital/$16K (O&M, 10%)
Design Concept Assumptions: Available nearby City communications (i.e., fiber) to the City TMC and FDOT TMC
Potential Project Scope (typical):
1. Evaluate and document the following possible technologies and systems:
a. En-route information system (e.g., arterial DMSs) that communicates parking availability information to drivers near the garage.
b. Parking monitoring component including vehicle detection devices at each of the garages’ entrance and exit points to detect/count vehicles entering and leaving the garage.
c. Variable message boards consisting of static element and a dynamic message inlay to direct the driver entering the garage to the floor with available spaces. This would be updated at a user defined interval.
d. Ultrasonic sensors positioned over each parking space to monitor the availability of the space. Information would be collected for each aisle, floor, and facility. The information would be processed in a central computer.
2. Recommendations on advanced parking management solution and system configuration that should be provided along with an Implementation Plan and cost for each City public accessed parking facility.
3. Provide FL511 with Real-Time Parking Garage Space Availability with GIS-based encoded map of Downtown Tampa. This capability would
Hillsborough County ITS Master Plan Update
74
include the ability for motorist to pull-up this information on their iPhone or Droid mobile phone.
4. F&I all necessary equipment, communications, and interfaces to demonstrate the recommend advanced parking solution at the Jackson Street (City Hall) parking facility in Downtown Tampa.
5. Provide integration and testing of the Jackson Street (City Hall) parking facility to the City’s TMC.
TP-2: CITY OF TAMPA ITS-FACILITY MANAGEMENT SYSTEM (ITSFM)
Project Description:
Project would provide a centralized collaborative asset system designed to help City of Tampa Traffic manage and track their overall ITS and Traffic Signal System inventory, infrastructure, device and equipment locations, and system configuration and components (assets).
System would be a GIS-based web application designed to manage outside plant facilities based on LAT/LONG coordinates which would be entered into ITSFM import templates produced in Excel.
Field technicians and engineers would have the ability to use mobile apps to access system as-built records.
To use the ITSFM application, a database needs to be populated with data and information from the ITS/traffic signal network. These services could be provided by in-house City staff, contracted out with a City consultant, or a combination of City in-house staff and consultant staff.
Data field services would involve collecting GPS points of all field equipment, communications infrastructure and electrical components, survey of installed ITS field devices and associated support structures, communications hubs, communications equipment, and ITS wireless sites to document the locations and attribute information necessary to populate the system database.
Potential Location(s): City of Tampa – system-wide
Project Justification/Potential Impacts (Benefits):
1. Will improve overall ITS/traffic signal system maintenance efficiency and reduce cost to maintain as well as provide system design upgrades as a result of maintaining an accurate as-built database/record of the system.
Capital Costs: $48,000 (initial 40 miles)
O&M Costs: $0
ITS Architecture Compatibility: MC07
Agencies/Stakeholders Involved: City of Tampa Traffic, FDOT District Seven
Project Dependencies: None
Cost Estimate Costs & Assumptions: $48K (capital) (assume 40 miles) including ITSFM application (free); Training (free), Data Field Services (approx. $1,200/route mile for fiber + devices – designating + data encoding)
Design Concept Assumptions: ITSFM software (free from FDOT), Training (free from FDOT)
Potential Project Scope (typical):
1. Coordinate with FDOT District Seven to obtain ITSFM software
2. Install ITSFM (Ver. 3.0 or later) application
3. Set-up training session for City of Tampa Traffic staff
TP-3: TAMPA POLICE AUTOMATIC VEHICLE LOCATION (AVL) SYSTEM
Project Description:
Project would implement an AVL system on City of Tampa Police vehicles to allow real-time vehicle tracking.
This enhancement in technology would improve communication between dispatch and the responders and would ensure that the closet appropriate unit is responding to an incident or other emergency call. Mobile CAD system would allow responding units to record en-route and arrival times more accurately as well.

Hillsborough County ITS Master Plan Update
75
Potential Location(s): City of Tampa – system-wide
Project Justification/Potential Impacts (Benefits):
1. Will provide the capability to real-time track police vehicles permitting faster response times to emergency calls coming into Dispatch, which will increase safety and efficiency.
2. Will provide greater accuracy in recording of en-route and arrival times.
Capital Costs: $600,000
O&M Costs: $30,500
ITS Architecture Compatibility: EM01, EM02
Agencies/Stakeholders Involved: City of Tampa Police
Project Dependencies: None
Cost Estimate & Assumptions: $600K (capital)/$30K (O&M, 5%) including (850 x $545/unit) (850 x $150/vehicle install) + Other ($10K) + $1,500 (1 day training, S/W configuration, testing) + Engineering (10%)/O&M ($400/month web tracking + wireless service fee)
Design Concept Assumptions: None
Project would include: (typical):
1. Develop Procurement/Bid documentation – including system and equipment specifications and details, coordination with City of Tampa Police department
2. F&I 850 x Mobile AVL units
3. F&I 1 x Web-based application including server
4. F&I wireless service: GPRS or equivalent
5. Provide Configuration, testing and training
TP-4: CITY OF TAMPA ATMS UPGRADES
Project Description:
Project would continue the upgrades and expansion of the City of Tampa’s ATMS including traffic signal system replacement and upgrades, ITS enhancements, and communications expansion and upgrades.
Potential Location(s): City of Tampa – TBD locations (directed by City)
Project Justification/Potential Impacts (Benefits):
1. Will provide advanced traffic/incident management capabilities for use during day-to-day traffic congestion, incident management and response, as well as during major special events in the Downtown area. This will help monitor congestion and incident response activities to improve traffic flow and travel times, as well as improve overall safety along these corridors/roadways.
Capital Costs: $10 million
O&M Costs: $150,000
ITS Architecture Compatibility: ATMS01, ATMS03, ATMS06
Agencies/Stakeholders Involved: City of Tampa Traffic, FDOT District Seven
Project Dependencies: City ATMS Phases 1 and 2 are completed and operational
Cost Estimate & Assumptions: $10M (capital)/$150K (O&M, 5%) as defined in the existing City ATMS project
Design Concept Assumptions: City ATMS Phases 1 and 2 are operational
Potential Project Scope (typical):
1. Develop detailed design, plans and specifications and contract documentation for the advertisement to build ATMS expansions as directed by the City (per their ATMS City Plan to be completed in 2013)

Hillsborough County ITS Master Plan Update
76
HC-1: HILLSBOROUGH COUNTY TMC EXPANSION AND UPGRADES
Project Description:
Project would include and expansion and upgrades to the Hillsborough County TMC to upgrade and provide new and additional TMC capabilities and features.
Potential Location(s): Hillsborough County –PSOC located on Columbus Drive - once completed (future)
Project Justification/Potential Impacts (Benefits):
1. Will provide expanded and upgraded TMC facilities, systems and capabilities to support over 500 traffic signals throughout the County, approximately 60 CCTV cameras; and other systems and devices. This will also provide and allow for additional system operator workstations to monitor the entire County system.
Capital Costs: $12,750,000
O&M Costs: $75,000
ITS Architecture Compatibility: ATMS08
Agencies/Stakeholders Involved: Hillsborough County Traffic
Project Dependencies: Move to new PSOC once it is completed (TBD schedule)
Cost Estimate & Assumptions: $750K (capital) including; console furniture, workstations, servers, termination and testing of communications, video wall and controller (multiple wall mounted displays, etc.) + Engineering (10%)/$75K (O&M, 10%) And additional $11 million (capital) is recognized as needed to complete 38 corridors from the county’s ATMS program.
Design Concept Assumptions: County TMC operations has moved to the new PSOC with fiber/network connection to FDOT RTMC and other centers as required
Project would include: (typical):
1. Develop a RFP and other contract documentation including system requirements, specifications, and details to provide the following:
a. Provide expansion and upgrades of the County ATMS and TMC coverage and capabilities including providing additional workstations with console furniture, servers, video wall (displays), racks, and other equipment as required.
b. Develop plans and specifications and other contract documentation for advertisement to bid out for build.
c. Add additional licenses (needed or required) for 360 Surveillance Cameleon V4-ITS or other to provide for expansion and support for additional ITS devices.
d. Provide additional, dedicated Traffic/ITS Operations staff.
e. Provide training of all the new features and capabilities.
HC-2: TAMPA-BAY INTEGRATED CORRIDOR (TBIC) MANAGEMENT SYSTEM STUDY
Project Description:
Project would conduct a feasibility study to evaluate technologies, strategies and concepts for providing and implementing an ICM capability within the County.
Potential Location(s): County-wide – locations/corridors TBD by this study
Project Justification/Potential Impacts (Benefits):
1. Would provide the capability to share real-time data, information, monitoring, and control through the corridor and region to improve coordination between member/participating Agency ITS and traffic control systems – will promote an integrated agency response to events along the selected corridor.
2. Would improve incident response and management activities.
Capital Costs: $250,000 (Feasibility Study)
O&M Costs: $0
ITS Architecture Compatibility: ATMS01, ATMS03-04, ATMS06-08

Hillsborough County ITS Master Plan Update
77
Agencies/Stakeholders Involved: Hillsborough County, FDOT District Seven, HART, Temple Terrance, City of Tampa, and potentially other stakeholders as determined by the study
Project Dependencies: None
Cost Estimate & Assumptions: $250K (capital, Feasibility Study)/$0 (O&M)
Design Concept Assumptions: None
Project would include: (typical):
1. Develop a Feasibility Study for an ICM concept including identification of candidate corridors, ranking of these candidate corridors using an evaluation criteria, document existing agency systems and communications network infrastructure, existing inter-agency agreements, and existing interfaces.
2. Document and discuss lessons-learned from recent ICM Demonstrations in Dallas and San Diego as part of the USDOT Research Initiative as it pertains to possible implementation in the Tampa Bay area.
3. Recommend possible solutions taking into account operational and security considerations, communications requirements, shared video and data requirements, cross-jurisdictional concerns, joint response scenarios, and others to be determined.
4. Make recommendations on top two candidate corridors to potentially develop into a demonstration project and provide what it would take to implement and develop performance metrics to measure success of demonstration project.
HC-3: HILLSBOROUGH COUNTY ITS-FACILITY MANAGEMENT SYSTEM (ITSFM)
Project Description:
Project would provide a centralized collaborative asset system designed to help Hillsborough County Traffic manage and track their overall ITS and Traffic Signal System inventory, infrastructure, device and equipment locations, and system configuration and components (assets).
System would be a GIS-based web application designed to manage outside plant facilities based on LAT/LONG coordinates, which would be entered into ITSFM import templates produced in Excel.
Field technicians and engineers would have the ability to use mobile apps to access system as-built records.
To use the ITSFM application, a database needs to be populated with data and information from the ITS/Traffic signal network. These services could be provided by in-house County staff, contracted out with a County consultant, or a combination of County in-house staff and consultant staff.
Data field services would involve collecting GPS points of all field equipment, communications infrastructure and electrical components, survey of installed ITS field devices and associated support structures, communications hubs, communications equipment, and ITS wireless sites to document the locations and attribute information necessary to populate the system database.
Potential Location(s): Hillsborough County – System-wide
Project Justification/Potential Impacts (Benefits):
1. Will improve overall ITS/traffic signal system maintenance efficiency and reduce cost to maintain, as well as provide system design upgrades as a result of maintaining an accurate as-built database/record of the system.
Capital Costs: $48,000 (initial 40 miles)
O&M Costs: $0
ITS Architecture Compatibility: MC07
Agencies/Stakeholders Involved: Hillsborough County Traffic, FDOT District Seven
Project Dependencies: None
Cost Estimate Costs & Assumptions: $48K (capital) (assume 40 miles) including ITSFM application (free); Training (free), Data Field Services (approx. $1,200/route mile for fiber + devices – designating + data encoding)
Design Concept Assumptions: ITSFM software (free from FDOT), Training (free from FDOT)

Hillsborough County ITS Master Plan Update
78
Potential Project Scope (typical):
1. Coordinate with FDOT District Seven to obtain ITSFM software
2. Install ITSFM (Ver. 3.0 or later) application
3. Set-up training session for County Traffic staff
EXISTING ITS PROJECTS AND INITIATIVES
The potential ITS projects identified and described above took into consideration existing or on-going ITS projects and initiatives. The intent was to build upon these on-going initiatives.
The following are existing, on-going, and planned ITS studies/projects. This does not represent a comprehensive list, but are the primary activities. Please refer to Chapter 3 for a more complete description of current initiatives:
E-1 Intersection Queue Jump (Managed Arterials) – FDOT
E-2 Traffic Signal Optimization (Re-Timing) Program – FDOT, HC, COT, PC
E-3 City ATMS Project – looking at traffic signal controller, software, fiber, ITS, etc. Scheduled for completion in 2013.
E-4 County-wide emergency preemption and transit signal priority studies – HC, HART
E-5 ITS Fiber Facilities Asset Management – currently surveying and encoding ITS devices, etc. – FDOT
E-6 Smart Card and Other Transit ITS/Technology – region-wide/HART
E-7 Arterial DMS implementation plan at entrance ramps to interstates – FDOT
E-8 Ramp metering study at 5 ramps – FDOT
E-9 BRT/TSP and other transit system improvements – HART, HC, COT
E-10 Interstate ITS/ATMS – planned/programmed – to fill in missing gaps along interstates – FDOT – HAR stations are also part of existing and/or planned roadway contracts.
E-11 HOT/Managed lane studies/Light Rail/High Speed Rail studies, etc. – FDOT
E-12 TDM/BACS/TBARTA initiatives – MPO
E-13 Deployment of arterial DMSs to providing a better integrated and operational system, 24 to 36 potential locations currently are under study
E-14 Four Traffic Management Centers exist (FDOT, COT/THEA, HC, PC), HC has plans to move into a new Public Safety Operations Center.
5.3 PROJECT EVALUATION PROCESS
All potential ITS projects identified in Section 5.2 were scored and ranked (prioritized) through the application of the methodology described in this section.
System operational impact scores were developed for each candidate ITS project representing a qualitative measure (based on ITS America database of documented performance benefits from similar ITS solutions) based on how well the candidate ITS project is expected to meet the eight evaluation criteria and associated performance metrics selected for this project, as shown in Table 29. Performance metrics were identified to aid in the overall scoring process.
The evaluation criteria were derived from the ITS goals and objectives provided in Section 1.7 and are also consistent, where appropriate, with the priorities (rankings) identified in the ITS Stakeholder Survey and Hillsborough County MPO’s 2035 LRTP. The weights assigned to the criteria were established by MPO staff and confirmed by the ITS committee.
An individual criteria score ranging from “0” to “10” is assigned to each candidate ITS project. A score of “0” represents having the least overall anticipated benefit or impact (i.e., not expected to meet the evaluation criteria), “5” represents having an average overall anticipated benefit, and “10” represents having the most overall anticipated benefit (i.e., fully expected to meet the evaluation criteria). Intermediate scores of “3” and “7” may also be awarded depending on the anticipated benefit or impact.
The raw score assigned to each of the evaluation criteria is then multiplied by the associated criteria weight. The weighted scores for each of the eight evaluation factors are then summed to create a total (cumulative) ITS project score. The equation below describes the score assignment process.

Hillsborough County ITS Master Plan Update
79
TABLE 29 ITS PROJECT EVALUATION CRITERIA
No. Evaluation Criteria Performance Metric Score (0-10)
Weight1 (WT)
1 Increase Efficiency and Capacity of the Transportation System
• Increase the interstate and arterial throughout or effective capacity • Establish and/or improve traffic diversion (alternative routes) capability for special events/evacuations/incidents (0-10) 11%
2 Improve Safety of the Transportation System
• Reduces the total number of vehicle-related crashes • Reduces the total number of pedestrians-related crashes • Reduces the total number of bicycles-related crashes • Reduce # secondary incidents – as result of primary incident • Increase/improve safety of emergency responders to an accident site
(0-10) 17%
3 Improve Incident/Emergency Response Capabilities
• Reduce incident detection time – to impacted transportation agencies, law enforcement and emergency/first responders – as required • Reduce incident verification time • Reduce incident response time • Reduce incident clearance time • Improve evacuation coordination, security and emergency management
(0-10) 16%
4
Improve Interagency Coordination, Cooperation & Communications
• Improve interagency communications and coordination including information (data, video) sharing during incidents, emergencies, and/or special events
• Increase TIM participation • Provide/increase participation in event planning meeting • Enhance or improve overall system (communications) performance (interoperable, reliability, availability, etc.) to reduce missed
calls or situations where not able to make connection (technical/system issue, operational issue – lack of clear protocols, etc.)
(0-10) 12%
5 Increase the Use of Transit/Multimodal Travel Options
• Increase usage of alternative modes of travel • Reduce transit delay and increase on-time bus arrivals • Increase ridership/participation • Increase awareness and level of participation/usage – in TDM programs, alternative modes of travel, FL511 program • Improve safety and security of passengers and drivers • Enhance route connectivity between routes and other travel modes
(0-10) 15%
6 Expand & Improve Traveler Information Dissemination
• Expand and enhance pre-trip and en-route traveler information coverage and content and/or tools • Provide current and reliable multi-modal information and trip planning tools • Increase total # 511 Calls • Increase total # 511 website visits (website hits) • Increase accuracy of travel time data • Increase speed and travel-time data collection sites
(0-10) 8%
7 Improve O&M
• Decrease the Mean-time to repair/replacement – maintenance • Increase operational field equipment percentage - increase system availability – percent of time system is working…all devices • Increase TMC system uptime percentage – indicate TMC equip and systems availability and efficiency of TMC maintenance
program
(0-10) 6%
8 Reduce Impact on the Environment
• Decrease in emissions (% emissions, CO2 emissions) • Improve monitoring and reporting capability (0-10) 15%
Maximum Total Possible 80 pts 100% 1 The weights applied to the project scores were derived based on stake holder input to be consistent with the Hillsborough County MPO’s 2035 LRTP.
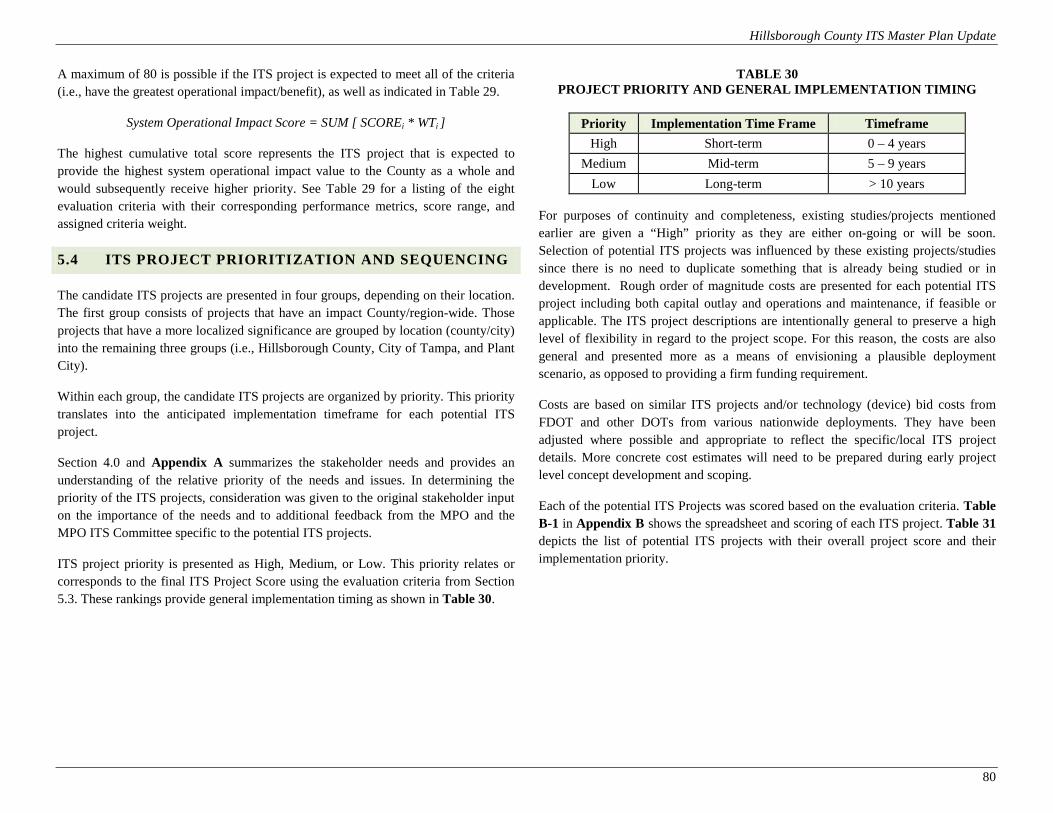
Hillsborough County ITS Master Plan Update
80
A maximum of 80 is possible if the ITS project is expected to meet all of the criteria (i.e., have the greatest operational impact/benefit), as well as indicated in Table 29.
System Operational Impact Score = SUM [ SCOREi * WTi ]
The highest cumulative total score represents the ITS project that is expected to provide the highest system operational impact value to the County as a whole and would subsequently receive higher priority. See Table 29 for a listing of the eight evaluation criteria with their corresponding performance metrics, score range, and assigned criteria weight.
5.4 ITS PROJECT PRIORITIZATION AND SEQUENCING
The candidate ITS projects are presented in four groups, depending on their location. The first group consists of projects that have an impact County/region-wide. Those projects that have a more localized significance are grouped by location (county/city) into the remaining three groups (i.e., Hillsborough County, City of Tampa, and Plant City).
Within each group, the candidate ITS projects are organized by priority. This priority translates into the anticipated implementation timeframe for each potential ITS project.
Section 4.0 and Appendix A summarizes the stakeholder needs and provides an understanding of the relative priority of the needs and issues. In determining the priority of the ITS projects, consideration was given to the original stakeholder input on the importance of the needs and to additional feedback from the MPO and the MPO ITS Committee specific to the potential ITS projects.
ITS project priority is presented as High, Medium, or Low. This priority relates or corresponds to the final ITS Project Score using the evaluation criteria from Section 5.3. These rankings provide general implementation timing as shown in Table 30.
TABLE 30 PROJECT PRIORITY AND GENERAL IMPLEMENTATION TIMING
Priority Implementation Time Frame Timeframe High Short-term 0 – 4 years
Medium Mid-term 5 – 9 years Low Long-term > 10 years
For purposes of continuity and completeness, existing studies/projects mentioned earlier are given a “High” priority as they are either on-going or will be soon. Selection of potential ITS projects was influenced by these existing projects/studies since there is no need to duplicate something that is already being studied or in development. Rough order of magnitude costs are presented for each potential ITS project including both capital outlay and operations and maintenance, if feasible or applicable. The ITS project descriptions are intentionally general to preserve a high level of flexibility in regard to the project scope. For this reason, the costs are also general and presented more as a means of envisioning a plausible deployment scenario, as opposed to providing a firm funding requirement.
Costs are based on similar ITS projects and/or technology (device) bid costs from FDOT and other DOTs from various nationwide deployments. They have been adjusted where possible and appropriate to reflect the specific/local ITS project details. More concrete cost estimates will need to be prepared during early project level concept development and scoping.
Each of the potential ITS Projects was scored based on the evaluation criteria. Table B-1 in Appendix B shows the spreadsheet and scoring of each ITS project. Table 31 depicts the list of potential ITS projects with their overall project score and their implementation priority.

Hillsborough County ITS Master Plan Update
81
TABLE 31 ITS PROJECT SCORE AND IMPLEMENTATION PRIORITY
Project ID Project Name ITS Project
Score Implementation
Priority Project ID Project Name ITS Project
Score Implementation
Priority
HC-2 Tampa-Bay Integrated Corridor (TBIC) Management System Study 56.72 High HC-1 Hillsborough County TMC
Expansion and Upgrades 37.76 Medium
PC-2 Plant City ATMS Expansion Phase 2 51.04 High PC-1 Plant City ATMS Expansion Phase 1 34.64 Medium
RW-2 Low Visibility & Extreme Conditions Warning System 48.48 High PC-3 Plant City Emergency Vehicle
Preemption (EVP) Expansion 34.24 Medium
RW-6 Regional Communications Network Study 47.68 High PC-7 Intelligent Portable Traffic
Management Stations 33.28 Medium
RW-9 Median Crossover Update Study 47.44 High RW-3 Interstate DMS Replacement Project 32.80 Medium
RW-1 Tampa Video & Event Exchange Network 46.64 High
RW-10
Tampa-Bay Commercial Trucking Smart Route & Parking Study & Pilot
32.64 Medium
RW-4 Regional Operational Planning Improvements 46.40 High RW-13 Hillsborough County Air Quality
Monitoring System 30.96 Medium
RW-11 Active Traffic Management (ATM) Feasibility Study 44.80 High RW-12 Emergency Alert System
Enhancements 29.60 Low
RW-14 Intersection Safety Improvements Plan & Pilot 44.24 High PC-5 Plant City Police AVL System 29.36 Low
RW-8 Highway-Rail Crossing Traffic & Safety System Study & Pilot 43.76 High PC-6 Plant City Fire & Rescue AVL
System 29.36 Low
RW-5 Arterial Real-Time Speed & Travel-Time System 40.16 High TP-3 Tampa Police AVL System 29.36 Low
TP-4 City of Tampa ATMS Upgrades 39.36 Medium HC-3 Hillsborough County ITS-Facility Management System 4.8 Low
TP-1 Downtown Advanced Parking System Implementation Plan & Demo 38.72 Medium PC-4 Plant City ITS-Facility Management
System 4.8 Low
RW-7 Dynamic Alternative Route System Study 38.72 Medium TP-2 City of Tampa ITS-Facility
Management System 4.8 Low

Hillsborough County ITS Master Plan Update
82
ITS PROJECT IMPLEMENTATION CONSIDERATIONS
For each group of ITS projects identified, region-wide and county/city specific, proposed interim schedules are provided. The general implementation timing (sequencing) of ITS projects into the three implementation priority timeframes (i.e., short-, mid-, long-term) was primarily dependent on the associated ITS project score as discussed; however, final deployment scheduling depends on the following implementation factors and/or considerations:
1. Project Prerequisites/Dependence on Other ITS Projects: Project is dependent on other ITS and communications deployments (existing, programmed, planned) to provide full or partial operations and/or benefit (i.e., logical sequencing) – i.e., project depends on another project to be deployed first.
2. Corridor/Roadway Specific: Each of the regional roadways was scored based on both significance and operational characteristics of the roadway (see Table B-2 in Appendix B for discussion and scoring of roadways). Implementation of ITS projects along roadways should take this into consideration when determining implementation sequencing/priority.
3. Proximity to Planned/Programmed Roadway/ITS Project: Project may be able to leverage (through revision of an existing project scope) deployment of support infrastructure (i.e., conduit, etc.) – i.e., move up schedule and/or reduce ITS project implementation costs.
4. Proximity of Candidate ITS Project to Existing ITS Project: Project may be able to take advantage of an existing ITS project for communications network connectivity and/or infrastructure to reduce ITS project implementation costs.
5. Funding Opportunities/Availability: Need to balance (spread-out) costs (construction/capital, O&M) over time (from year to year) – availability of funding will impact implementation timeframe and actual deployment. Depending on funding levels, a proposed ITS project could be broken up into phases to allow deployment in stages dependent on level of funding.
SUGGESTED ITS PROJECT DEPLOYMENT SEQUENCING
Based on the above implementation considerations, Table 32 shows a suggested deployment final sequencing of the proposed ITS projects along with estimated costs for further development.

Hillsborough County ITS Master Plan Update
83
TABLE 32 ITS PROJECT SEQUENCING/SCHEDULE
SHORT-TERM and On-Going (YEAR 1 TO 4) Project ID ITS Studies Capital Cost O&M Cost
HC-2 Tampa-Bay Integrated Corridor (TBIC) Management System Study $250,000 $0 RW-4 Regional Operational Planning Improvements $350,000 $0 RW-6 Regional Communications Network Study $400,000 $0 RW-9 Median Crossover Upgrade Study $200,000 $0
RW-11 Active Traffic Management (ATM) Feasibility Study $275,000 $0
RW-14 Intersection Safety Improvements Plan & Pilot $275,000 (Study) $550,000 (Demo) $22,000
RW-8 Highway-Rail Crossing Traffic & Safety System Study & Pilot $225,000 (Study) $600,000 (Demo) $42,000
Project ID ITS Projects Capital Cost O&M Cost PC-2 Plant City ATMS Expansion Phase 2 $1.27 Mill $58,000 RW-2 Low Visibility & Extreme Conditions Warning System $425,000 $22,000 RW-1 Tampa Video & Event Exchange Network $175,000 $10,000
RW-5 Arterial Real-Time Speed & Travel-Time System $175,000 (RFP) $150,000 (Phase 1) $6,700 (Phase 1)
RW-13 Hillsborough County Air Quality Monitoring System $55,000 $5,500 MID-TERM (YEAR 5 TO 9)
Project ID ITS Studies Capital Cost O&M Cost
TP-1 Downtown Advanced Parking Management System Plan & Demo $200,000 (Plan) $180,000 (Demo) $16,000
RW-7 Dynamic Alternative Route System Study $300,000 $0 RW-10 Tampa-Bay Commercial Trucking Smart Route & Parking Study & Pilot $225,000 $14,000
Project ID ITS Projects Capital Cost O&M Cost TP-4 City of Tampa ATMS Upgrades $10 Mill $150,000 PC-7 Intelligent Portable Traffic Management Stations $390,000 $10,000 PC-1 Plant City ATMS Expansion Phase 1 $175,000 $7,500 HC-1 Hillsborough County TMC Expansion & Upgrades $12,750,000 $75,000 PC-3 Plant City Emergency Vehicle Preemption Expansion $158,000 $7,200 RW-3 Interstate DMS Replacement Project – Phase 1 $6 mill $0
LONG-TERM (YEAR >10 Project ID ITS Projects Capital Cost O&M Cost
RW-12 Emergency Alert System Enhancements $150,000 (RFP) $180,000 (Depl) $5,000
TP-3 Tampa Police AVL System $600,000 $30,500 PC-5 Plant City Police AVL System $48,500 $2,400 PC-6 Plant City Fire & Rescue AVL System $23,500 $1,100 HC-3 Hillsborough County ITS-Facility Management System $48,000 (40 miles) $0 PC-4 Plant City ITS-Facility Management System $24,000 (20 miles) $0 TP-2 City of Tampa ITS-Facility Management System $48,000 (40 miles) $0

Hillsborough County ITS Master Plan Update
84
SECTION 6.0 | IMPLEMENTATION SUPPORT
6.1 SYSTEM DEVELOPMENT
As the stakeholder agencies move forward with ITS deployments with the ITS projects identified in this Plan, the concepts of integration and coordination will need to remain in the forefront.
An overall systems engineering approach will need to be maintained. This means that early project development activities will need to include assessments of existing and planned systems, both within the region and in adjacent regions. This observation will be focused on systems that may ultimately need to provide an avenue of data or video exchange. This is important for two primary reasons. First, the information gained will support the development of new systems that will accommodate integration requirements. This may take the form of adoption of appropriate protocols (i.e., NTCIP, TCIP, TCP/IP, etc.) or simultaneous development of interfaces that anticipate the integration needs. The second reason, that an initial assessment of existing and planned systems is important is to enhance efficiency of project development activities. Agencies that are implementing similar technologies can often work together or build on the efforts of each other to develop systems that meet both the functional requirements and the integration needs, thereby, avoiding inefficient duplication of effort.
Integration of systems provides communications links, establishes data exchange protocols, and ensures functional compatibility between network elements. In the context of ITS deployments, integration is critical in order to realize the fundamental benefits of these systems. To optimize these benefits often requires compatibility with legacy systems that were not developed with integration in mind. Due to the rapid rate of technological advancement, integration can be challenging even where more recently deployed systems were developed anticipating these requirements.
Project development activities aimed at implementing systems identified in this Plan will best serve future deployments by ensuring that systems are deployed without proprietary protocols and based upon an open architecture environment. This is often necessary even where the future technology applications are not yet fully understood. In addition, this approach will need to account for replacement of components as they age, fail, or become obsolete.
Where specific types of systems have not yet been deployed, preliminary project development activities need to begin with a systems engineering approach. The scope of this activity is to engineer existing technologies and hardware into designs that are ready for deployment. This includes development of concepts of operations compliant with the network into which the system will be deployed and modifications to meet the integration requirements such as communications standards and data exchange protocols. The result is a design for the specific technology application that is packaged as plans, specifications, and cost estimates that can readily be advertised by different agencies wishing to deploy the systems within the boundaries of the regional architecture.
6.2 O&M CONSIDERATIONS
As with other transportation and infrastructure projects, ITS deployments require resources to facilitate operations and provide normal maintenance. Operations can consist of activities ranging from deployment of portable devices to supervision of a traffic management center. These activities are often labor-intensive, raising staffing issues that will need to be addressed during implementation. Maintenance of ITS infrastructure typically entails systems calibration, software and hardware updates, reestablishing lost communications, and repair of damaged equipment. Costs associated with these tasks can be as varied as the operations themselves and the technologies in question. In some cases, O&M costs associated with ITS can be high in comparison with more traditional transportation infrastructure, however, when viewed in light of the benefit provided, they can actually represent on going savings in other areas.
An often overlooked or underestimated item in planning for technology-based projects is the cost to operate and maintain the system after it is installed. Many DOTs have in-house IT, communications, and maintenance staff with the capability to maintain the new components installed as part of the ITS; however, resources need to be allocated appropriately so that existing staff can accommodate the new systems in addition to their existing workload. If it is determined that the existing staff mix and technical skills represented is not adequate to handle the additional components installed, then a plan needs to be developed to acquire the necessary resources using equipment vendors and/or identify adequate budget for contract support and maintenance services. The following should be considered when planning for the O&M of ITS:

Hillsborough County ITS Master Plan Update
85
• Identify funding and policies supporting ongoing O&M; • Identify the aspects of the system needing operations or maintenance support; • Identify the manuals (user, administrator, and maintenance), configuration
records, and procedures that are to be used in O&M; • Identify the personnel who will be responsible for O&M; • Identify initial and on-going personnel training procedures, special skills, tools,
and other resources; • Identify O&M-related data to be collected and how it is to be processed and
reported; and • Identify methods to be used to monitor the effectiveness of operations and
maintenance.
The level of O&M support that is needed will vary based on the maintenance method selected and the size and/or complexity of the system. Compared to more traditional infrastructure improvement such as roadway projects, ITS improvements typically incur a greater proportion of their costs as continuing management, maintenance, and operations costs rather than up-front capital costs. ITS equipment also typically has a shorter anticipated useful life than many traditional infrastructure improvements and it must be replaced as it reaches obsolescence. Further complicating the O&M of ITS, is the sharing of ITS equipment and resources across different departments and possibly multiple agencies.
Each transportation agency (FDOT, County, City) should assess its capabilities and current staffing to arrive at a maintenance and operations concept that fits its situation and size and complexity of their system. Complexity of the system may require specialty skill sets and/or require more frequent training to stay current with technology advancements. This assessment should be initiated during the project development process and finalized during system validation. Personnel resources needed for the operation of the system will depend on the design and level of automation included in the system versus requiring active participation by the agency maintenance personnel. Following are some examples of how other state and municipal transportation agencies have handled O&M responsibilities for their ITS:
• The Tennessee Department of Transportation (TDOT) uses contract maintenance for its systems with a separate contracted consultant hired to monitor the maintenance contractor. The workload to administer the two contracts utilized existing staff.
• The Mississippi Department of Transportation (MDOT) established an in-house maintenance capability with some positions filled by contract labor and others by
MDOT staff. This method required the purchase and maintenance of additional resources such as vehicles, test equipment, tools, safety gear, etc.
• Some municipalities have added the ITS maintenance duties to existing traffic signal maintenance groups. Typically, traffic signal maintenance shops have some of the equipment needed to support the O&M effort of ITS, such as bucket trucks and basic communications test equipment. FDOT, the County, and the City will also need to have support and test equipment in established maintenance functions.
The ITS components that require routine and on-going maintenance fall into one of three categories: 1) central control, 2) field elements, and 3) communications. The FHWA maintains a database with the projected average life expectancy for many types of ITS devices, which can be referred to for more information.
6.3 STAKEHOLDER AGREEMENTS
Although there are existing agreements in place between various stakeholder agencies in the Tampa Bay region, new agreements may be required to realize some of the new ITS projects and operations recommended in this ITS Master Plan.
Each connection between systems in the regional ITS architecture represents cooperation and a potential requirement for an agreement. There can be considerable variation between regions and among stakeholders regarding the types of agreements that are created to support ITS deployment and operations.
With its focus on inter-jurisdictional coordination, a regional operational concept points directly to the types of agreements that may potentially be required between individual agencies and organizations. The following are some areas where formal or informal agreements have been established (or may be needed) as the integrated ITS concepts and strategies identified in this Plan are implemented.
• Inter-agency/Regional ITS/Traffic System Control: Joint sharing and potential control of traffic signals, detectors, CCTV cameras, and/or DMSs is already occurring (at different levels) or being discussed between some of agencies.
Although information sharing is frequently implemented with little formality, agreements that detail the limits of authority, operational discretion, hours of operation, and time of day/time of week where shared control would take effect, under what scenarios (i.e., major emergency/incident, etc.) would joint/shared control take place, and liability are required before “joint or shared control” can be implemented.

Hillsborough County ITS Master Plan Update
86
• Coordination with Emergency/Incident Management: Many of the ITS devices put in place to monitor traffic conditions also provide information that is desirable to public safety and security agencies for Homeland Security and other law-enforcement activities.
Local emergency operations centers have expressed interest in accessing traffic CCTV camera video feeds. However, granting access to these systems for purposes other than transportation and congestion monitoring requires agreements specifying the conditions of access and other terms of use.
• Inter-agency/Regional Traffic Data and Video Sharing: The region is currently considering projects that would require the sharing of traffic volume and signal data.
Once a decision is made and a solution is identified, agreements regarding the terms and conditions, types of data and information to be shared, how the information will be used, parameters for data format, quality and security, and access of the data and video will be needed.
There is typically considerable variation among stakeholders regarding the types of agreements that are created to support ITS deployment and integration. Table 33 presents some common types of agreements.
Rather than focus on technology in early cooperative agreements, the focus should be on the scope-of-service and specific agency responsibilities for various components of the service. Describe the high-level information that each agency needs to exchange in order to meet the goals and expectations of the other rather than defining how the delivery of that information will occur.
The process may begin with something as simple as a handshake agreement. But, once interconnections and integration of systems begin, agencies may want to have something more substantial in place. A documented agreement will aid agencies in planning their operational costs, understanding their respective roles and responsibilities, and build trust for future projects. Formal agreements are necessary where funding or financial arrangements are defined or participation in large regionally significant projects is required.
TABLE 33 TYPES OF AGREEMENTS
Type of Agreement Description
Handshake Agreement
• Early agreement between one or more partners. • Not recommended for long-term operations.
Memorandum of Understanding
(MOU)
• Initial agreement used to provide minimal detail and usually demonstrating a general consensus.
• Used to expand a more detailed agreement like a Interagency Agreement which may be broad in scope but contains all of the standard contract clauses required by a specific agency.
• May serve as a means to modify a much broader Master Funding Agreement, allowing the master agreement to cover various ITS projects though-out the region and the MOUs to specify the scope and differences between the projects.
Interagency Agreement
• Between public agencies (e.g., transit authorities, cities, counties, etc.) for operations, services, or funding.
• Documents responsibility, functions, and liability, at a minimum. Intergovernmental
Agreement • Between governmental agencies (e.g., Agreements between
universities and State DOT, MPOs and State DOT, etc.).
Operational Agreement
• Development of operations procedures that cross multiple jurisdictions.
• Between any agency involved in funding, operating, maintaining or using the ROW of another public or private agency.
• Identifies respective responsibilities for all activities associated with shared elements being operated and/or maintained.
Funding Agreement
• Documents the funding arrangements for ITS projects (and other projects).
• Includes at a minimum standard funding clauses, detailed scope, services to be performed, detailed project budgets, etc.
Master Agreements
• Standard contract and/or legal verbiage for a specific agency and serving as a master agreement by which all business is done. These agreements can be found in the legal department of many public agencies.
• Allows states, cities, transit agencies, and other public agencies that do business with the same agencies over and over (e.g., cities and counties) to have one Master Agreement that uses smaller agreements (e.g., MOUs, Scope-of-Work and Budget Modifications, Funding Agreements, Project Agreements, etc.) to modify or expand the boundaries of the larger agreement to include more specific language.
Source: FHWA Regional ITS Architecture Guidance Document.
Hillsborough County ITS Master Plan Update
87
6.4 POSSIBLE FUNDING SOURCE CONSIDERATIONS
Funding is a critical aspect to ITS and traffic signal control improvements. Just as planning the ITS and advanced traffic systems has been a collaborative process, so is the development of financing strategies. Locally and across the U.S., major transportation projects often include a package of funding sources, including federal and state grants, locally-generated funds to match those grants, and private-sector participation where possible.
This section provides possible funding sources that should be considered when further developing each of the ITS projects to eventual deployment.
A phased, incremental approach, which is already being used by FDOT, should be followed as part of this Plan for the implementation of future ITS elements. Each ITS project consists of stand-alone subsystem(s) capable of delivering benefits and each will be constructed under separate contracts over a period of time. Each subsystem would be integrated (as appropriate) with those implementations that have preceded it, evolving into the comprehensive system developed with the guidance of this and successive implementation plans.
The greatest risks of the phased implementation approach are associated with the integration of new systems with those that are already on-line and with the assignment of accountability of that function. When two subsystems cannot be integrated and one or both subsystems have to be modified, the costs may increase substantially. However, there are advantages. Since projects are spread out over time, the impacts to agency budgets are minimized. There is also the opportunity to select projects for which there is a high probability of success and that has highly visible benefits as early projects.
Potential federal, state, and local sources that should be considered when identifying a funding source(s) for the ITS projects including:
1. Regional/State Funds • Ad-Valorem • Impact Fee • State Transportation Program (STP) • State New Starts • Transportation Regional Incentive Program (TRIP) • Transportation Disadvantaged Program • SIS funds • FDOT 3R Program
2. Federal/DHS/FEMA • TEA-21 • Highways (federal gas tax – distributed to states) • Transportation Management Area (TMA) funds • Transportation Enhancement (TE) funds • Federal Formula-Based (FFB) • Federal New Starts • Federal STP (TMA) • Congestion Mitigation and Air Quality Improvement Program (CMAQ) • National Highway System Program (NHS) • Federal Urban Partnership Agreement (UPA) grants • National Highway Transportation Safety Administration (NHTSA) grants • DHS – Interoperable Emergency Communications Grant Program (IECGP) • State Homeland Security Program (SHSP) • Regional Catastrophic Preparedness Grant Program (RCPGP) • FTA (funds distributed to transit providers)
3. Other Funds • Tolls/user-based toll fees • Fuel tax – statewide and local • Vehicle sales tax • Vehicle-miles traveled fee • Vehicle registration fee – statewide and local • FL511 Program – sponsorship or advertisement revenue generation • Bonds
In addition to the sources listed in this section, others may exist that should be evaluated, such as federal grants, private funding, and public-private partnerships (PPP).
On-going O&M Funding Considerations – To ensure that the deployed ITS projects will continue to operate as intended and meet the needs of travelers on a continual basis, the state/region must identify funding sources for day-to-day O&M of systems. Although most agencies would like to reduce O&M expenditures with the implementation of new systems, ITS and other technology-based systems often have high on-going costs associated with them.
The benefits of ITS deployments are only achieved through efficient operation of the systems, which must be identified when justifying funding for the O&M costs. The first year of operation of the ITS will not be a good indicator for what annual O&M costs will be due to product warranties. Over time, the O&M costs will tend to increase as equipment ages and becomes outdated or obsolete, software needs

Hillsborough County ITS Master Plan Update
88
constant updating with new devices drivers to be developed, and/or more devices are added to an existing system.
FDOT typically requires or acquires equipment warranties ranging from 2 to 5 years, depending on the item. This helps to mitigate some of the maintenance costs for the several years upon ITS deployment. Purchasing extended warranties (if available) as part of the Bid proposal may be a way to help off-set some of the maintenance costs. Tracking equipment warranties and typical equipment/device life should be included as part of the agencies O&M planning process. It may be easier and cheaper to replace equipment/devices before they get to a point of requiring more frequent maintenance/repairs to keep them working at a certain performance level.
CCTVs, DMSs, and other ITS equipment have a relatively short life span when compared to a highway or bridge; they require periodic replacement. Communications costs are integral to operating ITS equipment. Whether leasing bandwidth from commercial communication providers or engaging service contracts to maintain agency-owned communications assets, it requires funding. Agencies cannot financially bear the full cost of O&M with their own resources. Therefore, they frequently seek federal funds if they are eligible. Agencies are obviously responsible for personnel and other minor costs. On the other hand, big ticket items such as replacing DMS or major software upgrades are more problematic. In funding ITS with federal monies, there is an implied commitment to operate and maintain the investment in these deployments with federal funds.
This is a major concern with the various transportation agencies within the region. During the stakeholder interviews and subsequent follow-up meetings they expressed funding (especially O&M) as a major constraint on further development/expansion of ITS since they have so little money to maintain what they already have. Some possible considerations to mitigate this concern include:
• Consider using federal funding sources such as; CMAQ, NHS, and STP funds for traffic management O&M.
• Raise awareness of significance of ITS O&M with senior management and elected officials who have an influence over funding allocations.
• Collaborate on projects with other agencies to provide greater leverage in pursuit of funding.
• If not already, consider contracting out maintenance (privatization of O&M) in an effort to save maintenance dollars and utilize contracting dollars, which appear to be more abundant and perform necessary maintenance in the midst of hiring freezes and restrictions to adding positions.
• Procure spare parts as part of construction or maintenance contracts to avoid complications with procurement, compatibility, and funding after the system becomes operational.
• Identify ITS O&M as a distinct budget category (which is vitally important), even if it competes for funds with other maintenance functions. Acknowledge ITS/traffic management O&M as an on-going expense and provide a means of tracking costs. However, the use of multiple detailed ITS budget categories has proven to be inflexible and cumbersome.
• Purchase extended warranties (if available from manufacturer) and track equipment/device warranties and expected device life. Potentially replace an ITS device/equipment before on-going emergency maintenance activities becomes excessive to keep the device or subsystem performing.
It is essential, from the inception of an ITS program or project, to seek every opportunity to secure funding from a variety of sources. This commitment of funding can be from traditional sources, private enterprise, PPPs, or other arrangements, such as special congressional ITS earmarks.
It is also important to keep in mind that traffic management projects carry with them the obligation to operate and maintain the systems. Thus, it is critical to not only obtain capital outlay funding, but also to secure the commitment for covering on-going O&M costs.
6.5 PROCUREMENT OPTIONS
NCHRP Report 560: Guide to Contracting ITS Projects provides guidance on the selection of appropriate contracting options for the design and implementation of an ITS project. Selecting the appropriate option depends on many variables, including the following:
• Type and complexity of the required products, systems, and services; • Interdependence of project components and subsystems; • Inclusion of ITS components with roadway construction projects; • Use of varied and rapidly changing advanced technologies; • Need to pre-qualify consultants and/or contractors; • Constrained deployment schedule; • Magnitude of construction impacts on road users; and • Risk management factors associated with capital investments.

Hillsborough County ITS Master Plan Update
89
ITS procurements often entail sophisticated combinations of hardware and software that are challenging to specify because they are tailored to the unique requirements of the procuring agency and use components embodying technology that may have advanced substantially in the time between the development of the project concept and the project implementation.
Because of these complexities and uncertainties, the low-bid contracting process that transportation agencies traditionally use to purchase capital improvements often is not the best approach for ITS procurements. If low-bid is required due to the use of federal funds, consideration should be given to prequalifying the contractors prior to the low-bid process.
The complexity of a project can have a significant impact on the selection of a procurement strategy. ITS projects can range in complexity from those that are relatively straightforward—as in adding field devices (e.g., CCTV, DMS, etc.) to an existing traffic management system—to those that are complex, such as the implementation of a new transportation management system including custom software applications. The procurement strategy for these two undertakings would be significantly different. Additionally, O&M planning needs to be considered in many ITS projects prior to executing the final procurement plan. The four components of the procurement process (work distribution, method of award, contract form, and the contract type) are illustrated in Figure 15.
FIGURE 15 PROCUREMENT OPTIONS
Source: NCHRP Report 560: Guide to Contracting ITS Projects.
Experience has shown that the ITS procurement method can have substantial influence on the ultimate success of the ITS installation. The procurement method determines how responsibilities are distributed and decisions are made, the qualifications of the contractor, the systems engineering process, and the controls available to the contracting agency. The procurement method, ideally selected to suit the characteristics of the procuring agency as well as those of the project, can make or break a project.
Decision on what type of procurement package to utilize will depend on the project characteristics, complexity of the project, as well as agency/department policies or preference. For example, FDOT typically uses Design-Build as their primary means to deploy ITS projects; however, this is not necessarily the best approach depending on the project and other variables (e.g., significant development of software, etc.).
To provide for consistency in design and minimize integration risks, FDOT requires that all proposed ITS equipment on their projects to be listed on FDOT’s “Approved Product List” (APL) and to be compatible with existing FDOT equipment.
6.6 SYSTEM TESTING CONSIDERATIONS
TESTING PROGRAM
A testing program for ITS consists of two primary phases: 1) verification of system and 2) validation of the system as described below:
Verification of System – The system verification process is used to accept the system from the development/deployment team. This process may be performed by FDOT, municipalities, or by a consultant hired to monitor and manage the installation under a Construction Engineering and Inspection contract. Having an engineering team experienced with ITS deployments and integration will free FDOT staff from this requirement and ensure the process is executed appropriately.
Verification ensures that the system meets its functional/technical requirements and matches the design and technical specifications. In this step, the system components are assembled into a working system to ensure that it fulfills all of its requirements.

Hillsborough County ITS Master Plan Update
90
Verification would typically be conducted over multiple sequential testing phases including; 1) bench level/factory level testing, 2) stand-alone testing, 3) system and subsystem acceptance testing, and 4) burn-in test period to ensure that all requirements and any potential issues resulting from the design, installation, or integration has been rectified and made fully operational. A detailed Test Plan with testing procedures would be developed and used to systematically test, verify, and confirm that each project requirement has been met by the deployed ITS project.
The challenge with ITS project deployment is that not all of the pieces are available at the same time; some will not fit together particularly well at first; and there will be pressure to change some of the pieces after they have already been assembled. The systems engineering approach provides a systematic process for integration and verification that addresses the challenges and complexity of assembling ITS.
Integration and verification are iterative processes in which the software and hardware components that make up the system are progressively combined into subsystems and verified against the requirements. This process continues until the entire system is integrated and verified against all of its requirements.
Validation of System – The system validation process ensures that the operational system meets the users’ needs and its intended purpose. For example, in the validation step, the FDOT/County/City may collect data for the purpose of a “before and after” study (if this is the case, data would also need to be collected prior to deployment).
Performance metrics would need to be identified and an Evaluation Plan developed for each ITS project. This Plan would define the metrics, how the data is to be collected (before and after), agency responsibilities, and analysis of the data. In an ITS deployment, the validation process tends to be more complex than a typical roadway system. This is the natural result of having multiple agencies relying on the effective performance of any system.
In systems engineering, a distinction is made between verification and validation. Verification confirms that a product meets its specified requirements. Validation confirms that the product or system fulfills its intended use or purpose. The majority of system verification can be performed before the system is deployed. Validation really cannot be completed until the system is in its operational environment and is being used by the real users.
This is why the systems engineering approach seeks to validate the products/subsystems that lead up to the final operational system to maximize the chances of a successful system validation at the end of the project. Since validation activities are performed throughout the project development process, there should be few surprises during the final system validation.
Comprehensive Testing Program – To implement a testing program, several levels of testing are necessary to verify the compliance of all of the detailed ITS design requirements associated with ITS and communications project deployments. A “building block” approach to testing allows verification of compliance to contract/project requirements at the lowest level, building up to the next higher level, and finally full compliance with minimal re-testing of lower level requirements once the higher level testing is performed.
After components are tested and accepted at a lower level, they are combined and integrated with other items at the next higher level, where interface compatibility (and the added performance and operational functionality at that level) are verified. At the highest level, system integration and verification testing is conducted on the fully integrated system to verify compliance with those requirements that could not be tested at lower levels and to demonstrate the overall operational readiness of the system.
Testing starts with well-written requirements. From the testing perspective, the Project Specifications must be written with “testable” requirements containing clear and unambiguous pass/fail criteria (e.g., selection of a camera for PTZ control shall automatically select that camera input for display on the operator workstation monitor). Without testable requirements, it is difficult to ensure that the system performs according to its intended design and meets the expectations of the stakeholder. The requirements and verification testing process verifies that each requirement has been met; if it is not “testable,” there are no grounds for acceptance of the work.
Requirements should be written with simple, understandable, concise terms; be short and to the point. All technical terms and acronyms should be defined so there are no misunderstandings. For each (individual) requirement, there should be one “shall” or “must” statement. If the requirements are complex, then they should be subdivided into a several individual statements to the greatest extent possible. The goal is that each requirement statement should be able to be clearly demonstrated and/or tested. A test case should be generated to verify each “shall.”

Hillsborough County ITS Master Plan Update
91
Requirement statements should not mix dissimilar or unrelated requirements in the same statement. This will complicate requirements, traceability, and verification testing.
All requirements are also to be “traceable” to previous stages (e.g., the System shall provide CCTV cameras with PTZ capabilities) in the design process (i.e., concept stages to high-level requirements to detailed design requirements) to ensure that all stakeholder requirements and expectations are met once the system is deployed and operational. It is important to be able to trace all of the requirements to an element of the detailed design and that all requirements are reflected in the final detailed design.
6.7 OTHER IMPLEMENTATION CONSIDERATIONS
DEVELOP PROJECT PHASING PLAN
ITS projects by their very nature are meant to be integrated because of their complex mix of technology components; therefore, a phased implementation approach is typical.
Project phasing should be guided by the criticality of the needs that will be met, the level of benefits to be achieved through project implementation, available resources and funding, as well as necessary institutional and jurisdictional support. Furthermore, the scope of deployment of any phase of a project may be limited based on a lack of any one of these criteria.
To develop a phased implementation approach, a planning horizon consisting of a range of time is used. The planning horizon can consist of any range of time but is likely to be 10 to 20 years, which is then segmented into multiple implementation phases.
The controlling factor when determining project phasing is typically funding. For example, projects that are implemented in the first phase are those that have the least risk, will provide tangible benefits, and already have funding secured.
A project phasing plan should answer the following questions for each phase:
• What will be deployed? • Where will it be deployed? • What operational capabilities will result?
• What is the estimated deployment cost and schedule? • What agreements are needed? • Is funding available for design, construction, and O&M?
COORDINATION WITH ADJACENT REGIONS/DISTRICTS
Coordination with adjacent districts, counties, and/or jurisdictions is imperative to the realization of the benefits of ITS integration.
At the program level, contact with neighboring cities’, counties’, and/or districts' management (e.g., FDOT District Seven, Pinellas County, etc.) can facilitate congruent and coordinated implementation approaches, while at the project level activities can coordinate compatible communications technologies, data formats, and physical connectivity and network accessibility.
During detailed project development and design activities, coordination must take place, as relevant and/or needed, with other FDOT districts and/or adjacent counties and/or cities.
MAINSTREAMING ITS DEPLOYMENTS
Mainstreaming ITS deployments is the key to initiating an ITS Master Plan.
ITS solutions to transportation issues should be treated similarly to other transportation solutions, incorporating them into the flow of planning and programming of projects. This means considering ITS projects alongside more traditional transportation solutions during the process of updating transportation programs both at the local level and at the state level.
The goal of mainstreaming is to ensure that ITS strategies and technologies are an integral component of the MPO planning and programming process and are incorporated into the MPO’s LRTP and CMP.
POTENTIAL ITS STANDARDS AND INTERFACES
ITS standards define how ITS systems, products, and components are interconnected, exchange information, and interact within a transportation network. They are not design standards.

Hillsborough County ITS Master Plan Update
92
Using ITS standards provides the following benefits to the County/region:
• Supports interoperability, • Supports 940 compliance, • Minimizes future integration costs, • Facilitates regional integration, • Supports incremental measurable development, • Prevents technological obstacles, • Minimizes operations and maintenance costs, • Prepares for emerging technologies, • Makes procurements easier, and • Makes testing easier.
This will ultimately allow transportation and other agencies to implement systems that cost effectively exchange pertinent data, video, and accommodate equipment replacement, system upgrades, and system expansion. Standards also benefit the traveling public by providing products that will function consistently and reliably throughout the region. ITS standards contribute to a safer and more efficient County transportation system and would facilitate regional compatibility and interoperability.
Making the best choices for standards to include in a project design depends on multiple factors, including throughput (how much data must be transmitted or received on the interface), network topology (how the ITS elements are connected together), and infrastructure (fiber optic lines, wireless, leased lines, etc.), among others. Appendix B lists ITS standards and interfaces that are potentially applicable to the ITS projects recommended in this Plan. Standards provided in Appendix B may represent a superset of options, and in some cases, provide redundant capabilities. In addition, ITS standards may be a different maturity levels. Care should be taken to select the standards that best meet the needs of the County/region or project.
6.8 ITS ARCHITECTURE CONSISTENCY AND COMPLIANCE
All ITS projects that intend to receive federal highway trust funds (whole or in part) are to be compliance with Part 940 of Title 23 of the Code of Federal Regulations (23 CFR Part 940) regarding systems engineering and ITS architectures. Title 23 CFR Part 940.11, Project Implementation, addresses project level requirements for the planning and designing of ITS deployments. Part 940 stipulates that any project that
moves into the design phase is required to follow a systems engineering process that is proportionate or appropriate with the project scope.
A project is defined as an ITS project or program that receives federal-aid. Title 23 CFR Part 940.11(c) states2: “The systems engineering approach shall include at a minimum:
1. Identification of portions of the regional architecture being implemented,
2. Identification of participating agencies roles and responsibilities,
3. Requirements definition,
4. Analysis of alternate system configurations and technology to meet
requirements,
5. Procurement options,
6. Identification of applicable standards and testing procedures,
7. Procedures and resources necessary for operations and management of the
system.”
Prior to authorization of highway trust funds for construction or implementation of ITS projects, compliance with Part 940.13, Project Administration, must be demonstrated as stated above. Table 34 provides a matrix to demonstrate compliance with Part 940 requirements in regards to ITS project implementation.
ITS ARCHITECTURE MAINTENANCE
The ITS Master Plan update has recommended several ITS projects with ITS Service (Market) Packages that are currently not in the Tampa Bay Regional ITS Architecture (RITSA). Besides this project, there has been significant ITS development and deployment within the Tampa Bay region since the Tampa Bay RITSA was generated in 2006. Version 1.00.01 in March 6, 2006 was the last version to be generated and/or updated as indicated on the Florida Statewide and Regional ITS Architectures Update website located at: http://www.consystec.com/florida/log.txt.
2 Source: http://ops.fhwa.dot.gov/its_arch_imp/docs/20010108.pdf.

Hillsborough County ITS Master Plan Update
93
TABLE 34 PART 940: COMPLIANCE MATRIX
Part 940 Compliance Project Implementation Requirement MPO ITS Master Plan Reference
Identification of portions of Tampa Bay RITSA being implemented
This is provided in Section 5.2, ITS Project Identification, with ITS Architecture compatibility. Also see Table D-1 in Appendix D for a list of ITS Service (Market) Packages recommended in this Plan
Identification of participating agencies roles and responsibilities
This is provided in Section 1.6, Operational Concept (Roles and Responsibilities)
Requirements definition This is provided in Section 5.1, Potential ITS Strategies/Functional Requirements
Analysis of alternate system configurations and technology options to meet requirements
This is provided in Section 5.0, Implementation Plan
Procurement options This is provided in Section 6.5, Procurement Options
Identification of standards and testing procedures
This is provided in Section 6.7, Other Implementation Considerations, and Section 6.6, System Testing Considerations, as well as in Appendix C of this Plan
Procedures and resources necessary for O&M of the system
This is provided in Section 6.2, O&M Considerations
As indicated in the FDOT Guidelines for Implementation of Part 940 in Florida, scheduled updates are recommended to the RITSA to ensure that they consistently reflect the ITS needs and requirements of the local agencies/stakeholders. Significant changes that may trigger the need for an architecture update include:
1. New stakeholders that were not part of the previous architecture development,
2. A region has been redefined,
3. Identification of new statewide or regional needs,
4. Design of deployment of ITS projects that are not included as part of the regional architecture,
5. ITS project designs that require modifications to the architecture,
6. New market packages and user services included in the National ITS Architecture (NITSA) update, and
7. Issuance of new federal rules or policies.
Any one of these changes may not require the need to update the RITSA; however, a combination of these changes may necessitate an update.
The FDOT Traffic Engineering and Operations Office, ITS Section, is the primary agency responsible for conducting and coordinating all updates and routine maintenance of the Statewide ITS Architecture (SITSA) to ensure consistency with Part 940 and the NITSA. Each FDOT District is responsible for reviewing regional architectures and recommending changes to the Change Management Board (CMB), which is responsible for reviewing such recommendations for consistency with the NITSA, SITSA, and Part 940; updating the regional architectures; and incorporating such updates in the SITSA.
Table D-1 in Appendix D shows a list of ITS Service (Market) Packages resulting from the ITS projects recommended as a result of this ITS Master Plan update. New ITS Service Packages are indicated to facilitate the process of providing needed changes to the RITSA.