Embed Size (px)
Citation preview

Highly Linear and Compact MMW PhasedArray Transmitters
November 11, 2003
R. Lai, M. Siddiqui, B. Pitman, M. Nishimoto, K. Johnson, S. Din, O.Fordham, G. Schreyer, R. Grundbacher, L. Callejo and D. Streit,Northrop Grumman Space Technology, Redondo Beach, CA 90278

1
Critical Technology that will Enable Next Generation Satcom Phased Arrays• Next generation phased array designs will be
driven by desire for increased capacity
• Evolution to smaller beam widths and moresimultaneous beams favors phased arrays� ~100 simultaneous beams from one aperture� Today’s typical communication links use complex
modulation requiring greater than 26 to 30 dB C/N forBER of 10-6 to 10-9
• Critical phased array technologies will be:
• High efficiency and linearity SSPA’s� Maintain high C/I with many beams� P1dB is not a good measure of linearity for multi-carrier
modulation� Two tone OIM3 /OIP3 is an approximation for multi-
carrier schemes� Noise to Power Ratio (NPR) for intra channel signal
distortion� Adjacent Channel Power Ratio (ACPR) for adjacent
channel interference
• Compact multiple-beam beam formers� Earth coverage, ~1000 beams� Need to reduce die size and cost
SA
TS
OF
T
-0.060 -0.040 -0.020 0.000 0.020 0.040 0.060U
0.080
0.100
0.120
V
0.7 deg beams
SA
TS
OF
T
-0.060 -0.040 -0.020 0.000 0.020 0.040 0.060U
0.080
0.100
0.120
V
0.4 deg beams
Phased Array

2
BackgroundNoise Power Ratio Explained
Adjacent Channel Power Ratio Explained

3
Outline
� Selected linearity tests were performed at different frequenciesdependent on test equipment availability.
� A sampling of measurements at frequencies from 20 GHz to 46GHz are presented.
� All 1 watt amplifiers have similar topologies:
� Show similar P1dB, Psat and OIP3 behavior.
� ACPR and NPR behavior should be similar.
� Behavior over temperature is similar.

4
NGST 0.15µm GaAs PHEMT
� Flight qualified profile (die thickness: 100 µm; 50 µm.)
� FT ~ 75 to 80 GHz @ VDS = 5V
� Imax > 600 mA/mm
� VBD > 9 V @ 0.1 mA/mm, > 11V @ 1 mA/mm
� Gm > 550 to 600 mS/mm
� OIP3 > P1dB+ 9dB or better @ 10dB OBO
� OIP3 > P1dB+ 9dB holds at 5dB OBO
� P1dB ~ 400 to 500 mW/mm; Psat ~ 500 to 650 mW/mm

5
20 GHz Driver Amplifier� Freq: 20 GHz
� Gain: 20 dB
� P1dB: 25 dBm (329 mW/mm, 30% PAE)
� Psat: 26 dBm (414 mW/mm, > 42% PAE)
� OIP3: 35 dBm (IM3 = -46dBc @10dB OBO)
� AM/PM < 5 degrees under drive
� NPR calculated > 18dBc @ 4.5 OBO
• Using single tone AM/PM,Pin/Pout and current vs. drivecharacteristics.
� PAE at NPR > 18dBc ~ 21%
� Size: 2.5 mm2
15 16 17 18 19 20 21 22 23 24 25 26 27Noise Pout (dBm)
APH505 NPR vs Pout
5
10
15
20
25
30
35
40
NP
R(d
B)
and
PA
E(%
)
140
155
170
185
200
215
230
245
Id(m
A)
22.4820.22
22.4818
NPR_ng10 (L)
PAEn_ng10 (L)
Idn_ng10 (R)
APH505(2-1-1) AM-PM at Fc=20.7GHz
-160-155-150-145-140-135-130-125-120-115-110-105-100-95-90
5 6 7 8 9 10 11 12 13 14 15
Pin (dBm)
Ph
ase
S21
(°)
Vd=3.5
Vd=4
Vd=4.5
Vd=5
Vd=5.5State-of-the-art NPR formulti beam operation

6
24-26 GHz Power Amplifier� Freq: 24 to 26 GHz
� Gain: 18 dB
� P1dB: 31 dBm (525 mW/mm, 22% PAE)
� Psat: 32 dBm (660 mW/mm, 29% PAE)
� OIP3: 40.5 dBm (IM3 = -45dBc @ 10dBOBO)
� Size: 5.88 mm2
� Amplifier topology chosen for maximumlinear performance. PAE was a secondaryconsideration.
Fixtured PIPO Data @ 25 GHz
0
5
10
15
20
25
30
35
0 2 4 6 8 10 12 14 16
Pin (dBm)
Po
ut
/G
ain
0
5
10
15
20
25
30
35
Pout(dBm)
Gain(dB)
PAE(%)
Fixtured OIP3 vs. Pout per Tone
3233343536373839404142
18 20 22 24 26 28
Pout / Tone (dBm)
OIP
3(d
Bm
)
24 GHz
25 GHz
26 GHz
At Pout = (P1dB - 2 dB),
IM3= -25 dBc !

7
ACPR Test Bench
Excellent linearity (ACPR) @Pout=P1dB – 9dB
� Freq: 26 GHz
� WCDMA (25MHz BW) upconverted to pass band.
� ACPR > –44dBc @ 5 MHz offset
� Raw test data (no corrections fortest set)
� Performance is expected to repeatfor power amplifiers up to 45 GHzprocessed in NGST’s 0.15um 4milGaAs .
8
37-40 GHz Power Amplifier� Freq: 37 to 40 GHz
� Gain: 15 dB
� P1dB: 30 dBm (463 mW/mm, 18% PAE)
� Psat: 31 dBm (583 mW/mm, 20% PAE)
� OIP3: 41 dBm (IM3 = -40dBc @ 6dB OBO)
� OIP3 degrades 2 dB at 85 degrees C.
� OIP3 very well behaved overtemperature.
� Size: 4.5 mm2
� Temperature performance typical of allNGST linear power amplifiers.
Fixtured PIPO Data @ 38 GHz
0
5
10
15
20
25
30
35
0 3 6 9 12 15 18 21 24
Pin (dBm)
Po
ut
/G
ain
0.00%
5.00%
10.00%
15.00%
20.00%
25.00%
Pout(dBm)
Gain(dB)
PAE(%)
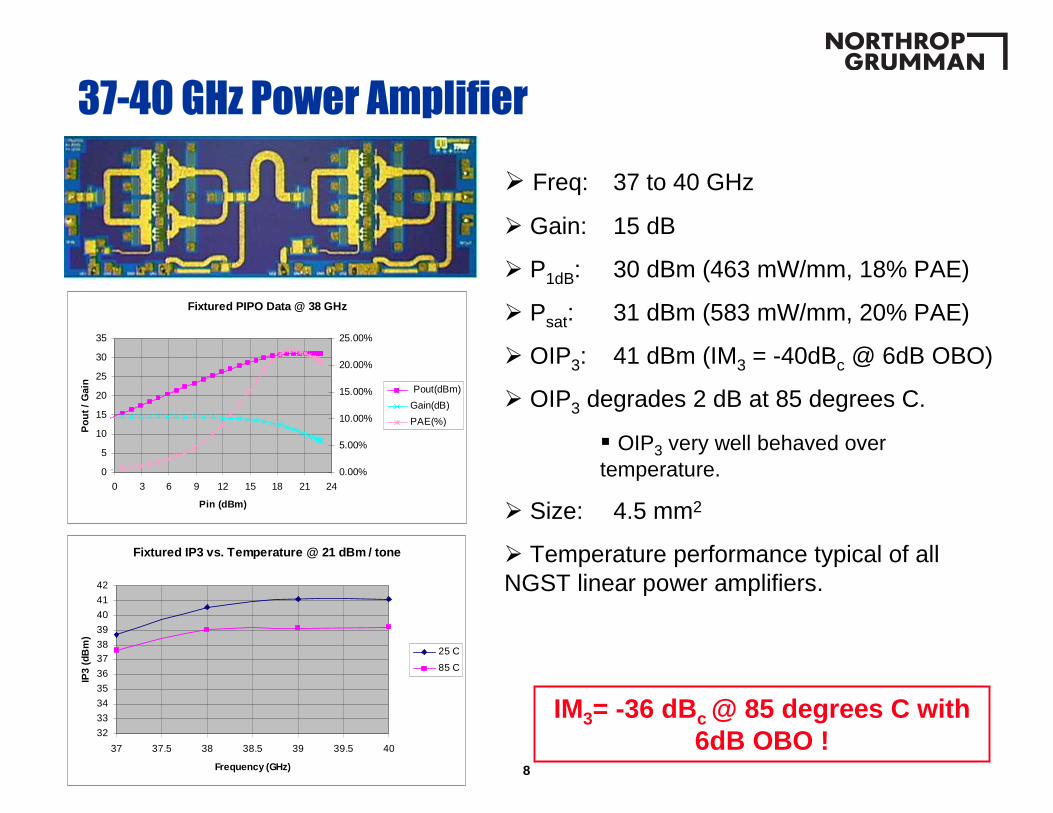
Fixtured IP3 vs. Temperature @ 21 dBm / tone
32
33
34
35
36
3738
39
40
41
42
37 37.5 38 38.5 39 39.5 40
Frequency (GHz)
IP3
(dB
m)
25 C
85 C
IM3= -36 dBc @ 85 degrees C with6dB OBO !

9
40-44 GHz Power Amplifier� Freq: 40 to 44 GHz
� Gain: 12 dB
� P1dB: 29 dBm (368 mW/mm, 14% PAE)
� Psat: 30 dBm (463 mW/mm, 18% PAE)
� OIP3: 39 dBm (IM3 = -42dBc @ 8dB OBO)
� Size: 4.25 mm2
Fixtured PIPO Data @ 42 GHz
0
5
10
15
20
25
30
35
0 2 4 6 8 10 12 14 16 18 20 22
Pin (dBm)
Po
ut
/G
ain
02468101214161820
PA
E(%
) Pout(dBm)
Gain(dB)
PAE(%)
Fixtured Power vs. Frequency
22.0024.0026.0028.0030.0032.0034.0036.0038.0040.0042.00
40 41 42 43 44
Frequency (GHz)
Po
ut
(dB
m)
P1dB (dBm)
P3dB (dBm)
OIP3 (dBm)
OIP3 = P1dB + 10dB with gainof only 6dB per stage!

10
43-47 GHz Phased Array Transmit Amplifier� Freq: 43 to 47 GHz
� Gain: 22 dB
� Biased for power:
� P1dB = 24 dBm (465 mW/mm), PAE>22%
� Psat = 24.7 dBm (546 mW/mm), PAE > 24%
Biased for efficiency:
� P1dB = 23 dBm (370 mW/mm), PAE > 30%
� Psat = 23.8 dBm (450 mW/mm), PAE > 35%
� Size: 3.17 mm2
APH565_A_530 Measured Data @ 45 GHz
0
5
10
15
20
25
-20 -15 -10 -5 0 5 10 15
Pin (dBm)
Po
ut(
dB
m),
Gai
n(d
B)
0
5
10
15
20
25
30
35
40
PA
E(%
)
Pout(dBm)
Gain(dB)
PAE(%)
APH565 Fixtured Test Results@45 GHz (R5C3M0, 1430-156)
0.0
5.0
10.0
15.0
20.0
25.0
30.0
-14 -12 -10 -8 -6 -4 -2 0 2 4 5 7 9
Pin dBm
Po
ut(
dB
m),
Gai
n(d
B)
0
5
10
15
20
25
30
PA
E%
Pout(dBm)
Gain(dB)
PAE(%)
Biased forPower
State-of-the-art P1dB and PAE from0.15um, 4mil GaAs processBiased for
PAE

11
Figure of Merit Comparison TableFoundry Year Freq. Stages Chip Size Output S.S. Gain P1dB PAE Psat Psat density OIP3 OIP3:P1dB P1dB density OIP3 density
(GHz) mm2 mm dB dBm % dBm mW/mm dBm mW/mm W/mm
NGST 2003 19-21 2 2.5 0.8 18.5 24.0 30.0 25.9 486 35 11 314 3.98
Transcom 2002 14-17 4 4.1 3.6 30 30.8 24.5 31.3 375 333
Triquint 2000 18-26 2 3.9 2.4 15 31.0 25.0 32 660 38.5 7.5 525 2.95
NGST 2003 24-27 2 5.9 2.4 19.5 30.9 24.0 31.6 602 40.5 9.6 513 4.70
NGST 2002 21-26 2 5.9 2.4 19.5 30.9 24.0 31 525 40.5 9.6 513 4.70
NGST 2003 30 1 1.9 2.4 10 31.0 25.7 32 660 40.5 10 525 3.30
UMS 2002 29 2 2.3 2.4 18.5 29.5 30.1 426.4 375
Triquint 2002 30 4 12.9 22.5 34.5 219
Triquint 2000 28-31 2 3.7 2.4 16 29.5 20.0 30.2 436.3 37 7.5 525 2.08
BAE 1999 29-33 2 14.9 10.8 18 34.8 20.0 36.5 413.6 280
NGST 2003 37-40 2 4.5 2.16 15 30.0 18.0 31 583 41 11 463 5.73
NGST 2003 40-44 2 4.3 2.16 15 29.0 12.0 30.5 519 39 10 368 3.64
NGST 2003 43-47 3 3.2 0.54 22 24.0 35.0 24.8 559 465

12
CONCLUSIONS
� Demonstrated state of the art P1dB, Psat, Power Density andOIP3 in compact die size.
� Meets high linearity requirements of phased array / radartransmitters.
� High gain per stage enables excellent linearity, PAE andcompact die size through 46 GHz.
� Designs use NGST’s flight qualified 0.15µm GaAs PHEMTtechnology.
� NGST space qualified 0.15um PHEMT with its proven trackrecord of volume production and use in automated assemblywill support high chip counts in large arrays.
� Next phase in design will reduce area by 50% while maintainingperformance.