Embed Size (px)
Citation preview


Table of Contents Economic Highlights
– Growth
– Economic prosperity
– Attractive Investment Climate
– Exports
A Diversified and Resource-
based Economy
– Energy
– Agriculture
– Manufacturing
– Advanced Technology
Broadband Usage
– Financial Services
– Tourism
Doing Business in Alberta
– Competitiveness
– Entrepreneurship
– Research and Development
– Government
– Competitive Corporate Taxes
– Provincial and State Corporate
Taxes
– Educated Work Force

Table of Contents
Working in Alberta
– Strong Labour Market
– Low Personal Taxes
– Family Income
– Standard of Living
Living in Alberta
– People
– Education
– Quality Education
– Health Care
– Arts and Culture
– Donations and Volunteerism
Online Resources

Alberta:
The Best Place to Live, Work and Do Business

Alberta:
The Best Place to Live, Work and Do Business
Alberta’s borders touch the Canadian Rocky Mountains to the west, the
vast prairies to the east, the United States to the south and the Canadian
arctic to the north.
On average, the province’s 4.3 million people are the youngest of all
Canadian provinces, with a median age of 36.7 years.
68.7 per cent of the Alberta’s labour force aged 25 years and older is
holding a post-secondary degree, diploma or certificate.
Even though Alberta’s economy was in recession in 2016, Alberta still led
the nation in economic growth during the past 20 years.
Alberta’s international airports in Edmonton and Calgary provide excellent
air service to both domestic and international destinations.
To promote its presence in key markets, Alberta operates 12 international
trade and investment offices, including nine in Alberta’s second-largest
market, Asia.

In 2016, per capita investment in Alberta was $14,606, more than twice the
national average of $6,579.
Alberta’s oil sands account for about eight per cent of Canada’s overall
Green House Gases emissions and Canada is responsible for 1.6 per cent
of global emissions.
Although the oil and gas sector remains Alberta’s largest industry,
accounting for 17 per cent of its GDP, the province’s GDP shares of other
sectors, such as construction, real estate, finance and insurance, and
business and commercial services grew significantly between 1986 and
2016.
In 2016, Alberta’s population grew by 58,850 or 1.4 per cent - higher than
Canada’s 1.2% rate of increase.
Economic HighlightsDid You Know?

Economic HighlightsGrowth
In 2016, almost 2.3 million Albertans were employed, international
merchandise exports were $79 billion, and investment totaled $62 billion.
Between 2006 and 2016, Alberta accounted for 22 per cent of Canada’s
population growth. In fact, Alberta’s population increase of 24 per cent
over that period was the largest increase of any province or state in North
America.
The Alberta economy contracted by 3.7 per cent in 2016, as a result of the
recent oil and gas price declines which have led to sharply lower capital
investment by oil and gas companies.
Alberta’s economy has started to grow again and all private sector
forecasters are expecting Alberta’s economy to be the top province in
economic growth in 2017.

Economic HighlightsGrowth
Growth In Selected Indicators: 2006 - 2016
Per Cent Change
Source: Statistics Canada and Alberta Economic Development and Trade
20.8
14.0
16.8
10.3
11.3
8.8
1.4
18.0
18.4
23.8
Investment
MerchandiseExports
GDP
Employment
Population
Alberta
Canada

Economic HighlightsEconomic Prosperity
Alberta’s diverse economy provides the broad-based growth that is
crucial to sustaining stable, long-term economic growth.
The oil and gas and mining sector accounts for 17 per cent of the
province’s Gross Domestic Product (GDP), compared with 23.2 per cent in
1986.
Other sectors have shown considerable growth over the past three
decades. From 1986 to 2016 the following non-energy sectors grew
strongly:
• Construction sector from a 7.0 per cent share of GDP in 1986 to 10.7
per cent in 2016;
• The finance and insurance and real estate sectors from 13.5 per cent
to 16.7 per cent; and
• Business and commercial services sector from 6.6 per cent to 11.7 per
cent.

Economic HighlightsEconomic Prosperity
Economic Diversity: 1986
Percentage Distribution of GDP
Total GDP: $59.6 Billion*
* Current dollar GDP at market prices
** No further breakdown of the Finance & Insurance and Real Estate sectors is available for 1986
Sources: Statistics Canada, Alberta Treasury Board and Finance and Alberta Economic Development and Trade
Economic Diversity: 2016
Percentage Distribution of GDP
Total GDP: $314.9 Billion*
Oil & Gas & Mining23.2%
Manufacturing 6.9%
Transportation & Utilities 9.2%
Business & Commercial Services 6.6%
Finance, Insurance & Real Estate** 13.5%
Tourism & Consumer Services 4.6%
Retail & Wholesale 9.7%
Public Administration5.8%
Education 4.5%
Health Care 4.5%
Agriculture & Forestry4.6%
Construction 7.0% Oil & Gas & Mining 17.0%
Manufacturing6.3%
Transportation & Utilities
6.2%
Business & Commercial
Services 11.7%
Real Estate12.0%
Tourism & Consumer
Services 5.0%
Retail & Wholesale
9.0%
Public Administration
5.4%
Finance & Insurance 4.7%
Education 4.1%
Health Care6.2%
Agriculture & Forestry 1.6%
Construction10.7%
Economic HighlightsAttractive Investment Climate
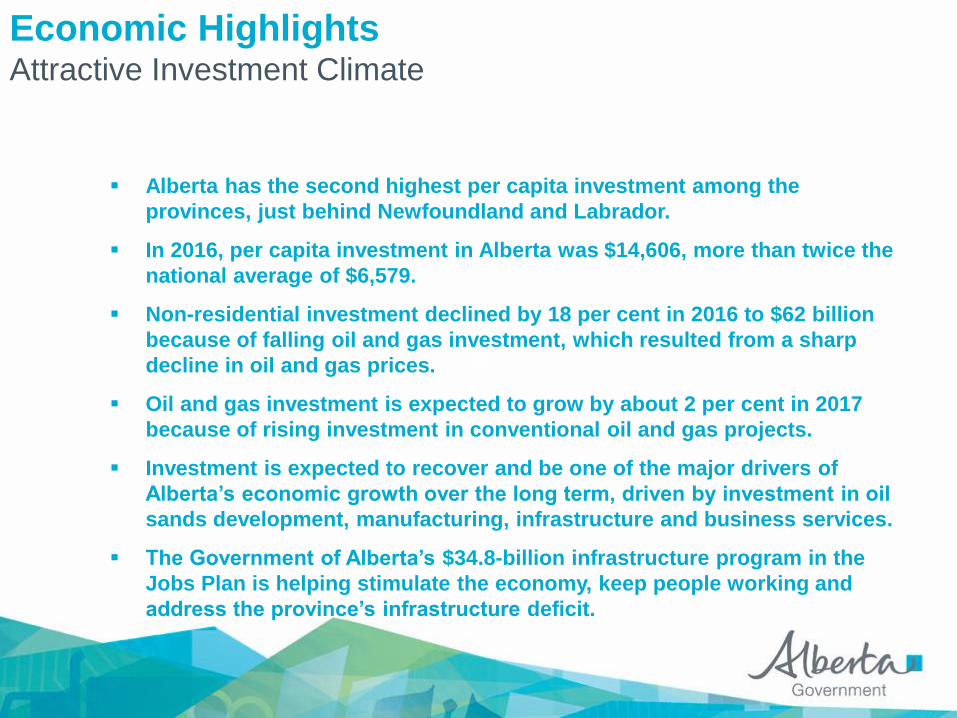
Alberta has the second highest per capita investment among the
provinces, just behind Newfoundland and Labrador.
In 2016, per capita investment in Alberta was $14,606, more than twice the
national average of $6,579.
Non-residential investment declined by 18 per cent in 2016 to $62 billion
because of falling oil and gas investment, which resulted from a sharp
decline in oil and gas prices.
Oil and gas investment is expected to grow by about 2 per cent in 2017
because of rising investment in conventional oil and gas projects.
Investment is expected to recover and be one of the major drivers of
Alberta’s economic growth over the long term, driven by investment in oil
sands development, manufacturing, infrastructure and business services.
The Government of Alberta’s $34.8-billion infrastructure program in the
Jobs Plan is helping stimulate the economy, keep people working and
address the province’s infrastructure deficit.
Economic HighlightsAttractive Investment Climate
Per Capita Investment* (2016)
$3,894
$4,067
$4,353
$4,392
$4,860
$5,812
$6,579
$7,748
$12,216
$14,606
$19,165
Prince Edward Island
Nova Scotia
New Brunswick
Quebec
Ontario
British Columbia
Canada
Manitoba
Saskatchewan
Alberta
Newfoundland & Labrador
* Investment in new housing is not included in these estimates
Sources: Statistics Canada and Alberta Economic Development and Trade

Economic HighlightsExports
In 2016, Alberta exported $78.9 billion worth of goods to 187 countries, a
decrease of 15 per cent from 2015.
Alberta’s drop in exports in 2016 can be attributed mostly to much lower
prices for crude oil and natural gas.
Alberta also exports an increasing amount and variety of manufactured
products such as petrochemicals, food products, and metals and
machinery.
Although manufacturing exports have declined during the recent
recession to $21.6 billion in 2016, they are still 6 per cent higher than they
were in 2006.
Exports of crops and livestock rose 64 per cent between 2006 and 2016,
while processed food exports increased by 80 per cent.

* Exports of services are not included in this estimate
Sources: Statistics Canada and Alberta Economic Development and Trade
Economic HighlightsExports
Alberta’s Major Exports 2016
Total Merchandise Exports - $78.9 Billion*
$ Billions
2.2
0.7
0.7
1.2
2.8
2.9
4.7
5.1
7.4
7.9
43.3
Others
Transportation Equipment
Electronic & Electrical Products
Refined Petroleum Products
Metals & Machinery
Forestry Products
Processed Food & Beverages
Crops & Livestock
Gas and Gas Liquids
Petrochemicals
Crude Petroleum

A Diversified and Resource-based EconomyEnergy
In 2016, Alberta produced 81 per cent of Canada’s crude oil and 67 per cent
of its natural gas.
Alberta has the third largest petroleum reserves in the world, after
Venezuela and Saudi Arabia.
The Alberta Energy Regulator forecasts that production of upgraded and
non-upgraded bitumen from oil sands will increase by 60 per cent to 3.8
million barrels per day by 2025, up from 2.4 million barrels per day in 2015.
In 2016, gross revenues from all hydrocarbons were $56.8 billion, with
revenues of synthetic crude oil and bitumen from the oil sands accounting
for 63.5 per cent of the total.
In 2016, energy resource exports totaled $51 billion, accounting for almost
two-thirds of Alberta’s total commodity exports that year.

A Diversified and Resource-based EconomyEnergy
Alberta’s Energy Revenues 2016
Total: $56.8 Billion
Sources: Statistics Canada, Alberta Energy Regulator, Alberta Economic Development and Trade
Alberta’s Energy Exports 2016
Total: $51.1 Billion
Natural Gas & Gas
Liquids21.8%
Coal and Sulpur
1.4%
Conventional Crude Oil
13.3%
Oil Sands63.5%
Natural Gas & Gas Liquids
14.5%
Coal and Sulphur
0.8%
Crude Oil86.1%
A Diversified and Resource-based EconomyEnvironment
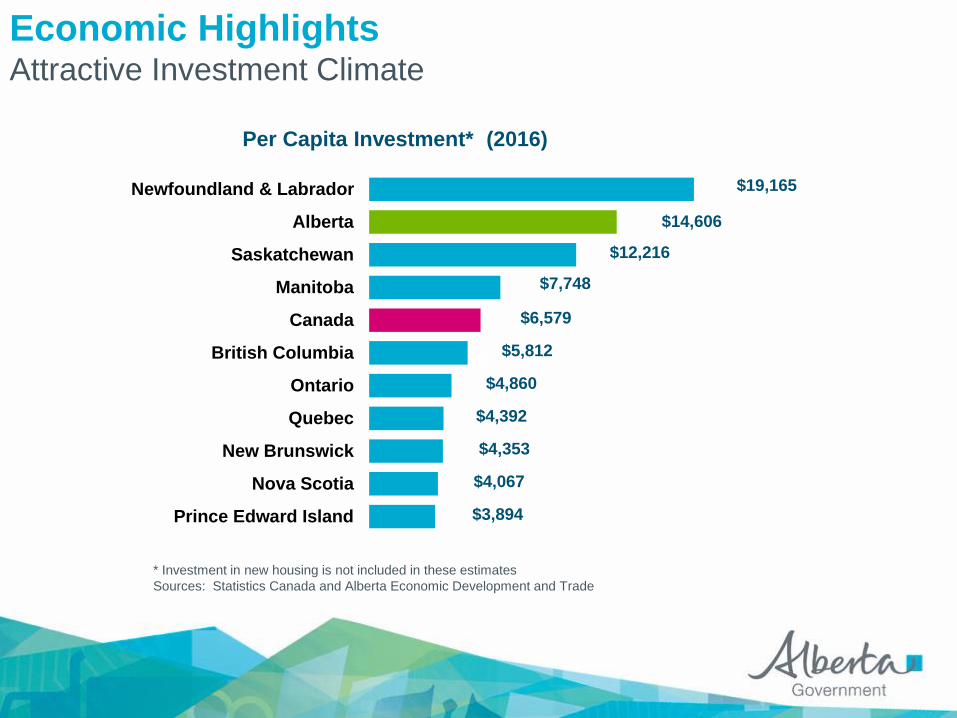
Alberta is implementing a world-class, integrated and science-based
environmental monitoring system to deliver comprehensive and
transparent monitoring for air, land, water and biodiversity across the
province, starting in the oil sands region.
The Alberta government has committed $1.3 billion to commercial scale
carbon capture and storage projects. Our $1.3 billion fund is one of the
largest commitments to this technology in the world…from a province of
just over four million people.
The Government of Alberta has set a firm renewable energy target to
ensure 30 per cent of electricity used in Alberta will come from renewable
sources, such as wind, hydro and solar by 2030 in order to protect the
province’s health, environment and economy.

A Diversified and Resource-based EconomyAgriculture
Alberta has one of the world’s most productive agricultural economies,
with a total farm area of 50.3 million acres or 20.3 million hectares.
In 2016, farm cash receipts for Alberta totaled $13.5 billion, representing
22 per cent of Canada’s primary agricultural production. The province
posted the highest cattle receipts as well as the second highest total crop
receipts in the country.
Alberta has an expanding value-added agricultural products sector. In
2016, sales of Alberta’s processed food and beverage industry were $14.6
billion making it Alberta’s top manufacturing industry on a revenue basis.
Meat product manufacturing accounts for just over one-half of the
sector’s sales.
The addition of 2,350-square-metres of business incubation and
development space makes Alberta’s Food Processing Development
Centre and Agrivalue Processing Business Incubator the largest of its
kind in the world.

*Includes potatoes, honey, hay, floriculture, crop insurance and other program payments, etc.
Source: Statistics Canada
A Diversified and Resource-based EconomyAgriculture
Alberta’s Major Agricultural Products 2016
Farm Cash Receipts ($ Billions)
Total: $13.5 Billion
1.63
0.30
0.37
0.40
0.56
0.90
1.90
2.85
4.58
Other*
Oats, Rye & Barley
Poultry & Eggs
Hogs
Dairy
Peas, Beans & Lentils
Wheat (incl. Durum)
Canola
Cattle & Calves

A Diversified and Resource-based EconomyForestry
In 2016, shipments of forest products reached a record $5.7 billion, and
exports were $2.9 billion. Forest products include pulp, paper and wood
products such as lumber and oriented strand board.
Fifty-eight per cent or 38 million hectares of Alberta is forested. Of the
forested area, about 60 per cent or 22.5 million hectares are considered
suitable for harvest.
Alberta's commercially productive timber land base of 26.1 million
hectares covers 40 per cent of Alberta's total area and includes in excess
of 2.2 billion cubic metres (m3) of growing stock.
Annually, Alberta allows 30.7 million m3 to be harvested, of which 18.7
million m3 is coniferous, and 12 million m3 is deciduous.

A Diversified and Resource-Based EconomyManufacturing
Prior to 2014 Alberta’s manufacturing sector was one of the fastest
growing manufacturing sectors in the country as the value of sales more
than quadrupled between 1992 and 2014.
However, sales in this sector declined in 2015 and 2016 as a result of
slumping oil and gas investment which impacts a number of
manufacturing industries, especially metals and machinery.
Because of the recession real output (GDP) of Alberta’s manufacturing
sector decreased seven per cent between 2011 and 2016.
The largest manufacturing sub-sectors on a GDP basis are processed
foods and beverages, chemicals, fabricated metals, industrial machinery,
refined petroleum products and wood products.
About one-fifth of manufacturing output consists of value-added
industrial products such as fabricated metals, machinery and electronics.

Source: Statistics Canada
$ Billions
A Diversified and Resource-based EconomyManufacturing
Value of Alberta Manufacturing Sales in 2016
Total: $62.7 Billion
2.7
1.1
1.7
2.0
3.7
5.4
5.7
12.5
13.4
14.5
Other Manufacturing
Electronic & Electrical Products
Plastics & Rubber
Non-Metallic Construction Materials
Machinery
Fabricated & Primary Metals
Forest Products
Refined Petroleum
Chemical Products
Food & Beverage
A Diversified and Resource-based EconomyAdvanced Technology Industries
Alberta’s key advanced technology sectors include clean technology,
information and communications technology (ICT), life sciences and
nanotechnology.
The Alberta government, through Alberta Innovates, is committed to
working with industry to support new technology development, increase
commercialization and develop new markets and opportunities.
Alberta’s ICT industry includes about 4,600 companies and 40,000
employees generating about $16 billion in annual revenues in 2016
making ICT one of Alberta’s key sectors.
Alberta is home to more than 200 life sciences companies, employing
about 4,600 workers.
The University of Alberta is home to the National Institute for
Nanotechnology.

Source: speedtest.net
Broadband Speed in 2015
Download speeds for high-speed/
premium internet services (mbps)
49
50
58
59
70
99
Manitoba
Saskatchewan
Quebec
British Columbia
Alberta
Ontario
A Diversified and Resource-based EconomyAdvanced Technology Broadband Speed

A Diversified and Resource-based EconomyFinancial Services
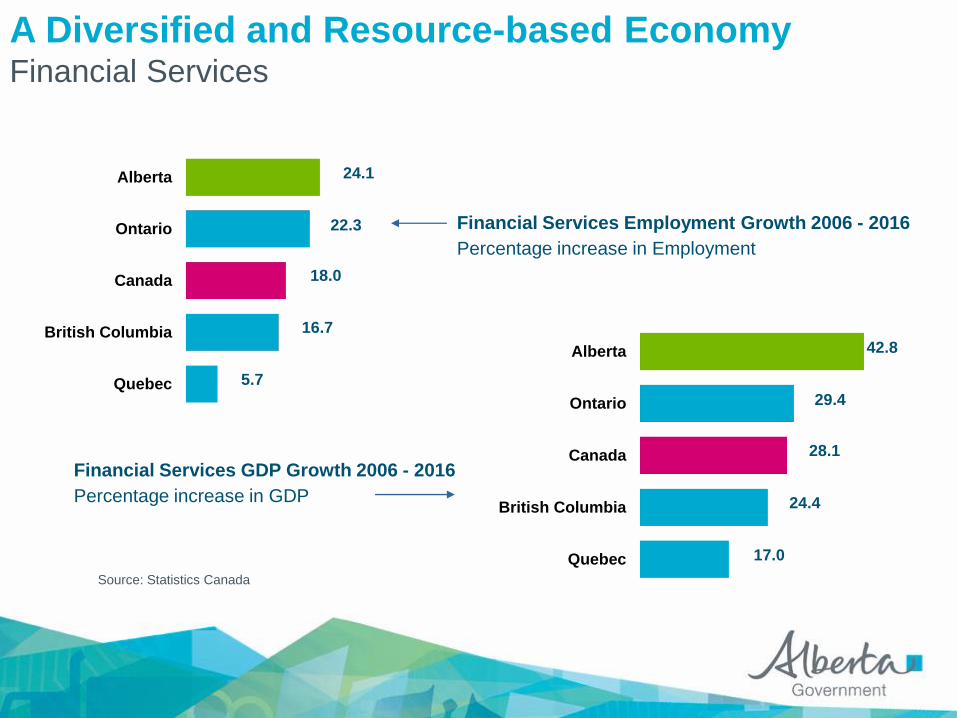
Over the past 10 years, Alberta’s financial services sector has
experienced exceptional growth fuelled by high levels of capital
investment in Alberta’s energy sector. Even during the 2015 – 2016
recession Alberta’s financial services sector continued to grow.
This sector includes six major Canadian banks and is also home to the
headquarters of a number of regional financial institutions including
Canadian Western Bank, Servus Credit Union, ATB Financial, and Alberta
Investment Management Corporation (AIMCO) as well as branches of 75
per cent of the top 20 global investment banks.
Alberta has developed world-class expertise in niche sectors in financial
services such as asset management and energy finance.
Between 2006 and 2016, Alberta’s financial services sector GDP rose 42
per cent, outpacing financial services sector GDP growth in all other
provinces. By comparison, GDP in Canada’s financial services sector
rose 28 per cent over the same period.
A Diversified and Resource-based EconomyFinancial Services
5.7
16.7
18.0
22.3
24.1
Quebec
British Columbia
Canada
Ontario
Alberta
17.0
24.4
28.1
29.4
42.8
Quebec
British Columbia
Canada
Ontario
Alberta
Financial Services Employment Growth 2006 - 2016
Percentage increase in Employment
Financial Services GDP Growth 2006 - 2016
Percentage increase in GDP
Source: Statistics Canada

A Diversified and Resource-based EconomyTourism
Tourism in Alberta is a significant economic driver. It supports more than
127,000 jobs across Alberta, and generated approximately $8.1 billion in
tourism expenditures in 2015. Forty-two per cent of these expenditures,
about $3.4 billion, came from out-of-province and international visitors.
The Calgary and area tourism region received the most domestic
overnight visitors in 2015, accounting for 26 per cent of all domestic
person-nights spent in the province. The Edmonton and area, Central, and
Canadian Rockies tourism regions followed closely behind, accounting
for 24 per cent, 21 per cent and 11 per cent, respectively.
Alberta offers its residents and visitors exceptional tourism experiences
and adventures. We have world-renowned attractions, vibrant cities, and
the most diverse and scenic landscapes in North America. Alberta has
five UNESCO World Heritage Sites, more than 480 provincial parks, 18
provincial historic sites, and five national parks.

A Diversified and Resource-based EconomyTourism
Alberta Tourism Expenditures by Visitor Origin (2015)
Total: $8.1 Billion
Source: Statistics Canada and Alberta Culture and Tourism
Alberta58%
Other Canada
19%
United States
10%
Overseas13%
Doing Business in AlbertaCompetitiveness
In 2016, Alberta’s business sector had the highest labour productivity
level in the country. The total value added per hour worked in Alberta
exceeded the Canadian average by about 39 per cent.
Alberta’s productivity advantage over other Canadian provinces is
substantial; however its rate of productivity growth had been slow for
many years. This low productivity growth rate was due to changes in the
nature and composition of Alberta’s energy output. In the last few years
Alberta’s productivity performance has improved because of a
productivity resurgence in the energy sector.
Although Alberta’s short-term economic growth prospects have weakened
because of low energy prices, Alberta’s long-term economic growth
prospects remain solid. Continued long-term economic growth depends
on increased productivity growth in order to optimize the economic
benefits from energy investment in Alberta, and to encourage higher value
added activity and industrial diversification.

Doing Business in AlbertaCompetitiveness
Source: Statistics Canada Cansim Table 383-0033 (business sector excluding private households)
Business Sector Labour Productivity 2016
Real GDP per Hour Worked, in 2007 constant dollars
$30.90
$35.90
$36.60
$44.20
$47.50
$48.60
$48.90
$50.40
$57.10
$66.90
$70.20
Prince Edward Island
Nova Scotia
New Brunswick
Quebec
Ontario
Manitoba
British Columbia
Canada
Saskatchewan
Newfoundland and Labrador
Alberta
Doing Business in AlbertaEntrepreneurship
Alberta’s dynamic and innovative business climate is evident by the
growth in the number of small businesses.
Although small businesses in Alberta have been hit hard by the recent
recession, the number of employees in small businesses still grew by 8.1
per cent between 2011 and 2016, higher than Canada’s 6.7% increase.
According to Statistics Canada small firms with 0 to 99 employees
account for about 40 per cent of Alberta’s GDP.
Alberta’s small business corporate income tax rate fell to two per cent in
2017, and the small business income threshold is $500,000.
Since it launched in 2009, the Innovation Voucher program awarded nearly
$40 million to almost 1,100 projects by small technology and knowledge-
driven businesses across Alberta.
The Government of Alberta has invested $100 million to attract more
venture capital to Alberta to grow early-stage technology companies.

Source: Survey of Employment, Payrolls and Hours, Statistics Canada
Doing Business in AlbertaEntrepreneurship
Small Business – Cornerstone of the Economy
Percentage Change in Employment in Small Business Establishments between 2011 and 2016 (Less than 50 Employees)
-0.5%
0.0%
0.1%
1.2%
3.2%
6.7%
7.4%
7.6%
8.1%
10.2%
10.2%
Nova Scotia
New Brunswick
Prince Edward Island
Quebec
Newfoundland and Labrador
Canada
Manitoba
Saskatchewan
Alberta
British Columbia
Ontario

Doing Business in AlbertaResearch, Innovation & Commercialization
The Alberta government’s research and development expenditures are
among the highest in Canada, on a per capita basis, partially thanks to
annual draws on two research endowment funds valued at over $2 billion.
Alberta has an established competitive funding program for Alberta’s
post-secondary institutions that supports the acquisition of research
equipment to build research capacity. Since 2001, the program’s
investment of $287 million has leveraged $926 million more in other
funding.
Alberta is at the forefront of key research areas, such as biorefining and
biocomposite materials, nanotechnology, machine learning and data
analysis, cleaner energy production and alternative energy,
cardiovascular health, brain health, diabetes, biomedical technologies,
and infectious diseases.
Alberta’s provincial SR&ED tax credit is worth 10 per cent of a company’s
eligible expenditures up to $4 million, for a maximum credit of $400,000.

Doing Business in AlbertaResearch, Innovation & Commercialization
Alberta Innovates, a provincial corporation, drives Alberta’s
provincial research and innovation efforts in key areas, building
on Alberta’s strengths in health, environment, energy, food,
forestry/fibre, and emerging technology.
It takes a more focused and integrated approach to meeting the
needs of innovators and researchers by having businesses,
government and academia collaborate and gain access to world
renowned experts and one-of-a-kind infrastructure and equipment
to solve problems.
Collectively, Alberta Innovates and Alberta’s post-secondary
institutions have attracted some of the world’s largest and most
successful corporations and researchers to partner with Alberta.
InnoTech Alberta Inc., a subsidiary of Alberta Innovates, provides
applied research services, including testing new technology on
province-wide scale to industry and government.
Doing Business in Alberta Government
The Alberta government is committed to free enterprise, sustainable
economic development, a competitive tax environment and strong
infrastructure.
Alberta’s strong fiscal position, minimal debt, and savings built from past
surpluses will assist the government in dealing with the current economic
and fiscal challenges posed by weak oil and gas prices.
As of September 30, 2017, Alberta’s Heritage Savings Trust Fund (long-
term savings) was valued at $17.9 billion.
Doing Business in Alberta Government
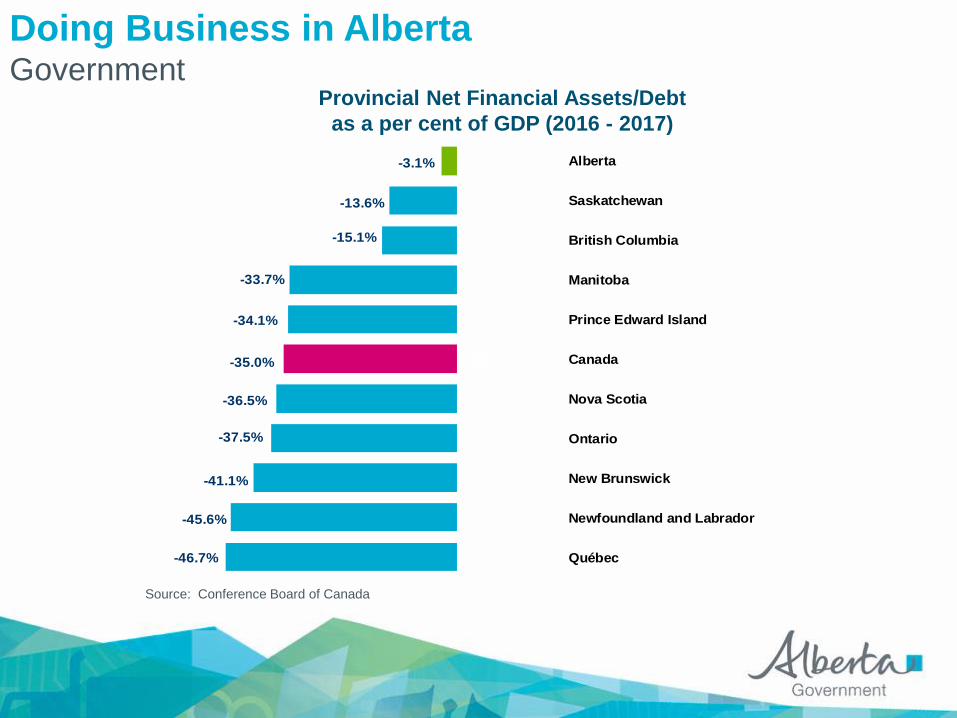
Source: Conference Board of Canada
Provincial Net Financial Assets/Debt
as a per cent of GDP (2016 - 2017)
-3.1%
-13.6%
-15.1%
-33.7%
-34.1%
-35.0%
-36.5%
-37.5%
-41.1%
-45.6%
-46.7%
Alberta
Saskatchewan
British Columbia
Manitoba
Prince Edward Island
Canada
Nova Scotia
Ontario
New Brunswick
Newfoundland and Labrador
Québec

Doing Business in Alberta Competitive Corporate Taxes
Alberta has one of the most competitive business tax environments in
North America.
The combined federal/provincial corporate income tax rate in Alberta is 27
per cent.
By comparison, the combined effective average federal/state corporate
income tax rate in the U.S. is 38.9 per cent.
The Government of Alberta’s general corporate income tax rate is 12 per
cent and the Government of Canada rate is 15 per cent.
The combined federal/provincial corporate income tax rate for small
businesses in Alberta is 12.5 per cent. In 2017, Alberta’s small business
income tax rate was reduced from three per cent to two per cent.
The low income tax rates combined with no provincial capital taxes or
taxes on financial institutions, no payroll taxes, no sales tax, and a
publicly funded health-care system makes Alberta’s tax environment very
competitive.

38.9%*
Doing Business in Alberta Competitive Corporate Taxes
Comparison of Corporate Income Taxes
32.9%
15.0%
6.0%
12.0%
United StatesJanuary 2017
AlbertaJanuary 2017
Federal Provincial / State
*6.0% represents the average top general state corporate income tax rate.
Sources: Alberta Economic Development & Trade and OECD.Stat
27.0%

Doing Business in Alberta Provincial & State Corporate Taxes
Provincial Corporate Income Tax Rates (per cent) State Corporate Income Tax Rates (per cent)
Province General
Manufacturing
& Processing
Small
Business State General
Manufacturing
& Processing
Small
Business
Alberta* 12 12 2 Oregon 7.6 7.6 6.6
British Columbia 11 11 2 California 8.84 8.84 8.84
New Brunswick 14 14 3 North Dakota 4.31 4.31 4.07
Quebec 11.8 11.8 8 Montana 6.75 6.75 6.75
Manitoba 12 12 0 Idaho 7.4 7.4 7.4
Saskatchewan 12 10 2 Colorado 4.63 4.63 4.63
Ontario 11.5 10 4.5 Utah 5 5 5
Newfoundland & Labrador 15 15 3 New Mexico 6.2 6.2 4.8
Prince Edward Island 16 16 4.5 Louisiana 8 8 6.42
Nova Scotia 16 16 3 Arizona 4.9 4.9 4.9
Federal 15 15 10.5 Federal 35 31.85 34
Note: U.S. rates are for January 2017 and Canadian rates are for April 2017
The small business rate is the effective tax rate for US$380,000 (comparable to the Canadian threshold of Cdn$500,000)
The small business income threshold for Nova Scotia and Manitoba is Cdn$350,000 and $450,000, respectively. For all other provinces
the small business income threshold is Cdn$500,000
Source: Canada Revenue Agency, Tax Foundation, KPMG Tax Facts 2016-2017, PWC

Doing Business in AlbertaEducated Work Force
Alberta’s labour force consists of 2.5 million workers.
In 2016, 68.7 per cent of the labour force 25 years of age and older
reported holding a university degree, post-secondary diploma or
certificate.
In 2016, there were more than 58,000 registered apprentices training at
approximately 14,800 employer sites around Alberta.
Alberta’s apprenticeship and industry training system is second to none,
training 21 per cent of Canada’s apprentices, despite having only 13 per
cent of its labour force.

Working in AlbertaLabour Market
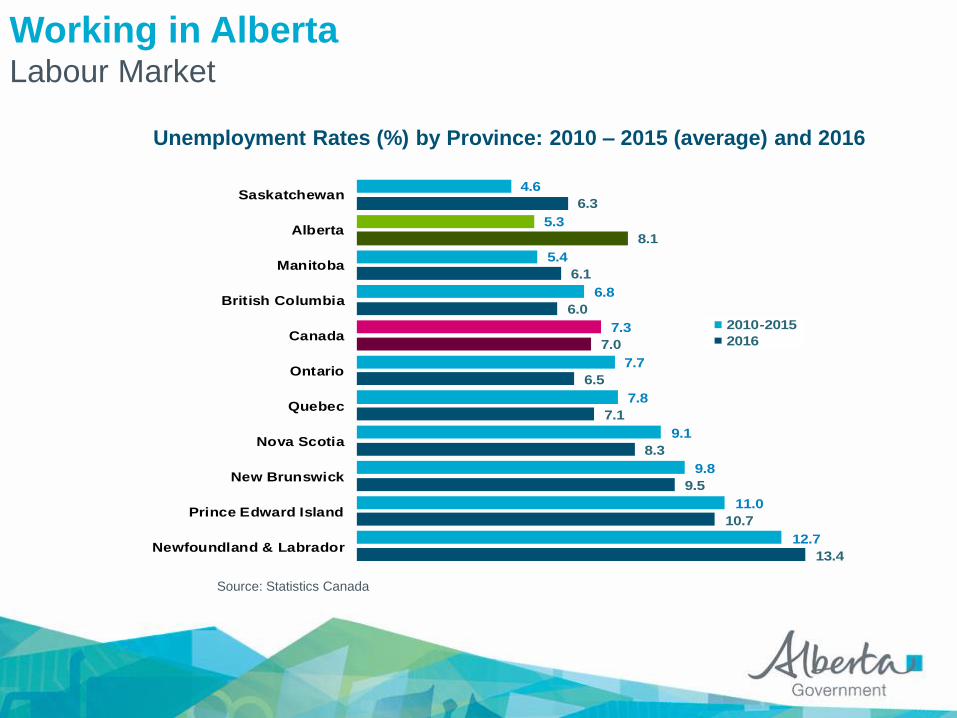
Between 1990 and 2015, Alberta’s unemployment rate was one of the three
lowest of all the provinces in Canada.
From 2010 to 2015, Alberta’s unemployment rate averaged 5.3 per cent,
compared to 6.8 per cent in British Columbia and 7.7 per cent in Ontario
over the same period. In 2016, Alberta’s unemployment rate had risen to
8.1 per cent, higher than the Canadian average of 7.0 per cent.
Although Alberta’s unemployment rate has risen from historical lows to
rates that are currently higher than what economists typically generalize
as a balanced labour market, Alberta is expected to have a balanced
labour market once the current slowdown ends.
Alberta has a dedicated work force: in 2016 full-time workers in Alberta
were absent from work for an average 7.5 days compared with 9.5 days for
the average Canadian worker.
Source: Statistics Canada
Working in AlbertaLabour Market
Unemployment Rates (%) by Province: 2010 – 2015 (average) and 2016
13.4
10.7
9.5
8.3
7.1
6.5
7.0
6.0
6.1
8.1
6.3
12.7
11.0
9.8
9.1
7.8
7.7
7.3
6.8
5.4
5.3
4.6
Newfoundland & Labrador
Prince Edward Island
New Brunswick
Nova Scotia
Quebec
Ontario
Canada
British Columbia
Manitoba
Alberta
Saskatchewan
2010-2015
2016

Note: Days lost due to illness, disability or personal or family responsibility
Source: Statistics Canada
Working in AlbertaA Dedicated Work Force
Total Days Lost per Full-Time Worker per Year by Province in 2016
11.9
10.6
10.5
10.5
10.5
10.4
9.7
9.5
9.4
8.5
7.5
Quebec
Saskatchewan
Nova Scotia
New Brunswick
Prince Edward Island
Manitoba
Newfoundland & Labrador
Canada
British Columbia
Ontario
Alberta

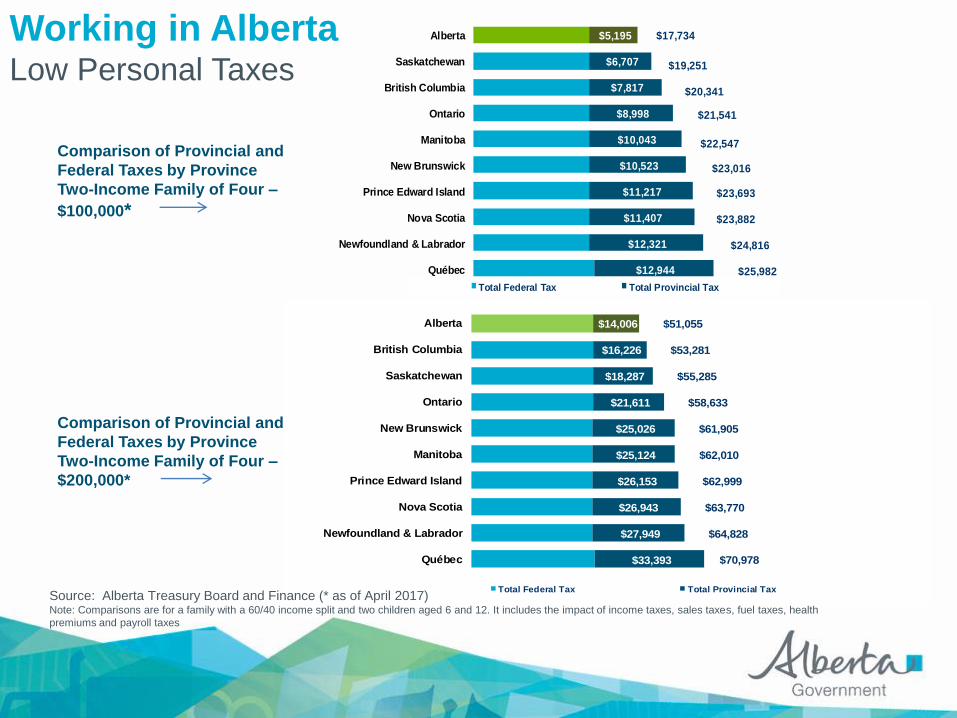
Working in AlbertaLow Personal Taxes
Alberta’s personal tax advantage results from low personal income tax
rates, no general sales tax, and low gasoline taxes.
Even with the new carbon levy, Alberta has the third-lowest provincial
charges on gasoline and diesel in 2017.
Albertans pay low personal income taxes, with one of the lowest marginal
income tax rates and the highest basic and spousal tax credit amounts in
Canada.
As provided in the following examples, in Alberta, a two-income family of
four:
Earning $100,000 pays $3,800 less in total taxes than in Ontario and
about $2,600 less than in British Columbia.
Earning $200,000 pays $7,600 less in total taxes than in Ontario and
about $20,000 less than in Quebec.

Working in AlbertaLow Personal Taxes
Top Marginal Personal Income Tax Rates 2017
* Prince Edward Island and Ontario’s top provincial rates include a surtax
** Quebec residents receive an abatement of 16.5% of basic federal tax because of the province’s
decision to opt out of federal cash transfers in support of provincial programs
Source: KPMG
33.0%
33.0%
33.0%
33.0%
33.0%
33.0%
33.0%
27.56%
33.0%
33.0%
14.7%
14.75%
15.0%
15.3%
17.4%
18.37%
20.3%
25.75%
20.53%
21.0%
British Columbia
Saskatchewan
Alberta
Newfoundland & Labrador
Manitoba
Prince Edward Island*
New Brunswick
Quebec**
Ontario*
Nova Scotia
47.7%
48.0%
48.3%
50.4%
51.37%
53.3%
53.31%
53.53%
54.0%
47.7%
48.3%
50.4%
53.3%
53.31%
53.53%
54.0%
47.75%
Working in AlbertaLow Personal Taxes
Comparison of Provincial and
Federal Taxes by Province
Two-Income Family of Four –
$100,000*
$12,944
$12,321
$11,407
$11,217
$10,523
$10,043
$8,998
$7,817
$6,707
$5,195
$25,982
$24,816
$23,882
$23,693
$23,016
$22,547
$21,541
$20,341
$19,251
$17,734
Québec
Newfoundland & Labrador
Nova Scotia
Prince Edward Island
New Brunswick
Manitoba
Ontario
British Columbia
Saskatchewan
Alberta
Total Federal Tax Total Provincial Tax
$$$$$$$$$$ $$$$$$$$$$
$33,393
$27,949
$26,943
$26,153
$25,124
$25,026
$21,611
$18,287
$16,226
$14,006
$70,978
$64,828
$63,770
$62,999
$62,010
$61,905
$58,633
$55,285
$53,281
$51,055
Québec
Newfoundland & Labrador
Nova Scotia
Prince Edward Island
Manitoba
New Brunswick
Ontario
Saskatchewan
British Columbia
Alberta
Total Federal Tax Total Provincial TaxSource: Alberta Treasury Board and Finance (* as of April 2017)Note: Comparisons are for a family with a 60/40 income split and two children aged 6 and 12. It includes the impact of income taxes, sales taxes, fuel taxes, health
premiums and payroll taxes
Comparison of Provincial and
Federal Taxes by Province
Two-Income Family of Four –
$200,000*

Working in AlbertaFamily Income
In 2015, for the 12th consecutive year, families living in Alberta had the
highest median after-tax income at $95,500. For that same year, the
median after-tax income was $83,800 in second-ranked Saskatchewan and
$76,900 for all of Canada.
After-tax family income is comprised of market income and government
transfers net of income taxes.
Another measure of income is median family market income. This is the
sum of earnings from employment, investment income and private
retirement income excluding government transfers.
In 2015, Alberta families had $101,500 in market income, 32 per cent more
than the Canadian average of $76,900, and $14,100 more than second-
ranked Saskatchewan.
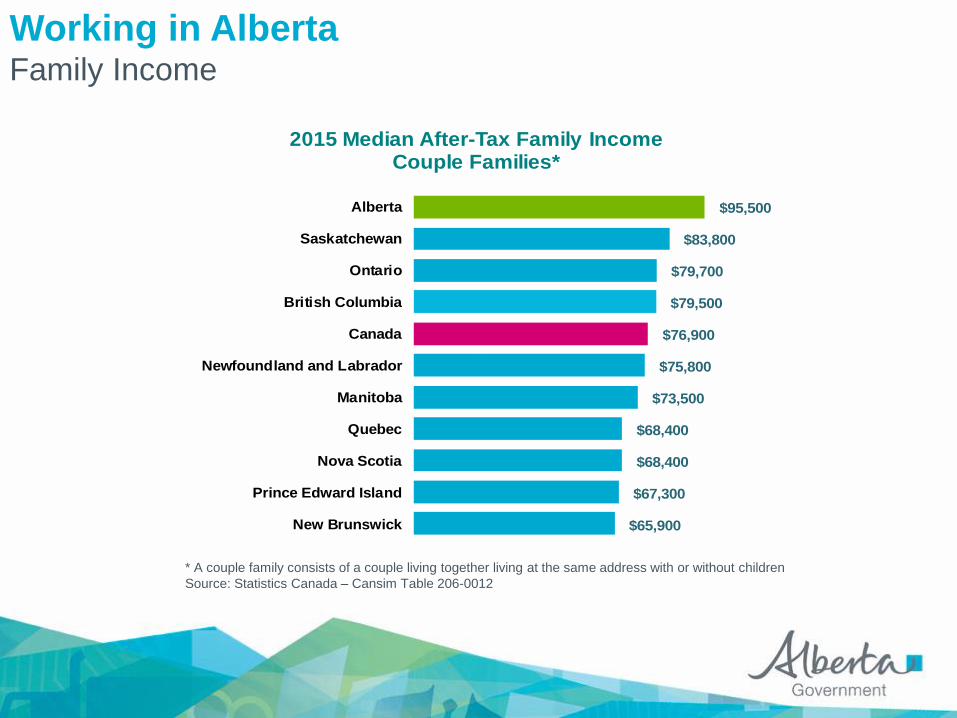
* A couple family consists of a couple living together living at the same address with or without children
Source: Statistics Canada – Cansim Table 206-0012
Working in AlbertaFamily Income
$65,900
$67,300
$68,400
$68,400
$73,500
$75,800
$76,900
$79,500
$79,700
$83,800
$95,500
New Brunswick
Prince Edward Island
Nova Scotia
Quebec
Manitoba
Newfoundland and Labrador
Canada
British Columbia
Ontario
Saskatchewan
Alberta
2015 Median After-Tax Family Income Couple Families*

Working in AlbertaStandard of Living
Alberta has been the nation’s leader in economic well-being for more than
30 years and in socio-economic well-being for the past 10 years.
The Index of Economic Well-Being is a measure of economic welfare and
includes measures of wealth, the distribution of income and wealth,
economic security, environmental sustainability and non-market activities
such as household work.
In 2015, Alberta maintained the top spot in the nation and ranked second
in an international comparison of economic well-being in Alberta and 14
OECD nations.
The Human Development Index is a measure of socio-economic well-
being and includes measures of life expectancy, education and income.
In 2015, Alberta was tied for first with Ontario among the provinces and
tied for fifth in an international comparison of the 13 Canadian provinces
and territories and 175 OECD nations.

Source: Centre for the Study of Living Standards
Working in AlbertaStandard of Living
Index of Economic Well-Being
Provincial Comparison, 2015
0.393
0.493
0.511
0.551
0.572
0.595
0.627
0.642
0.642
0.643
0.644
0.681
0.690
0.718
0.794
Spain
United States
Italy
Canada
Australia
United Kingdom
Sweden
France
Finland
Denmark
Germany
Belgium
Netherlands
Alberta
Norway
Index of Economic Well-Being
International Comparison, 2015
0.524
0.537
0.538
0.542
0.543
0.548
0.572
0.575
0.583
0.595
0.701
New Brunswick
Prince Edward Island
Nova Scotia
Manitoba
Quebec
Ontario
Canada
British Columbia
Saskatchewan
Newfoundland
Alberta

Source: Centre for the Study of Living Standards
Working in AlbertaStandard of Living
Human Development Index
Provincial Comparison, 2015
0.884
0.887
0.895
0.896
0.897
0.910
0.913
0.920
0.920
0.924
0.925
0.925
0.926
0.939
0.949
Spain
Italy
Finland
Belgium
France
United Kingdom
Sweden
Canada
United States
Netherlands
Denmark
Alberta
Germany
Australia
Norway
Human Development Index
International Comparison, 2015
0.888
0.890
0.894
0.894
0.903
0.908
0.916
0.920
0.921
0.925
0.925
New Brunswick
Prince Edward Island
Manitoba
Nova Scotia
Newfoundland
Saskatchewan
Quebec
Canada
British Columbia
Ontario
Alberta

Living in AlbertaPeople
Alberta is home to an ethnically diverse population of over four million
people.
One in six Albertans was born outside of Canada, making Alberta one of
the most multi-national and multi-cultural provinces in the country.
Alberta has the youngest population of all Canadian provinces with a
median age of 36.7. This compares to a median age of 40.6 in Canada.
A vast majority of the population are of European ancestry, with a strong
representation of Aboriginal people and an increasing number of migrants
from Asia and other regions. This all contributes to the province’s rich
cultural diversity.
Between 2006 and 2016 Alberta’s population grew by 23.8 per cent, the
largest increase of any province or state in North America.

Living in AlbertaPeople
Alberta Population by Ethnic Origin, 2016
Note: These numbers add up to more than the total population due to multiple responses
Source: Statistics Canada, 2016 Census of Population
Ethnic Origin Number% of Total
PopulationEthnic Origin Number
% of Total
Population
Totals 3,978,145 100.0% Total 3,978,145 100.0%
Canadian 902,310 22.7% Métis 113,735 2.9%
English 899,445 22.6% Russian 107,800 2.7%
German 712,955 17.9% Italian 101,265 2.5%
Scottish 704,200 17.7% Swedish 97,835 2.5%
Irish 596,750 15.0% Welsh 80,460 2.0%
French 411,560 10.3% American 72,355 1.8%
Ukrainian 369,095 9.3% Danish 60,380 1.5%
First Nations 200,285 5.0% Hungarian 56,275 1.4%
Dutch 195,725 4.9% Spanish 48,060 1.2%
Chinese 188,285 4.7% Austrian 39,530 1.0%
Polish 186,510 4.7% Vietnamese 36,780 0.9%
Filipino 175,130 4.4% Romanian 34,225 0.9%
East Indian 174,510 4.4% Lebanese 32,365 0.8%
Norwegian 156,595 3.9% Pakistani 29,265 0.7%

Living in AlbertaPeople
Alberta has Highest Population Growth in North America(Top 10 States/Provinces in Population Growth - 2006 to 2016)
Sources: Statistics Canada, U.S. Census Bureau
14.4%
14.6%
15.0%
16.5%
16.7%
17.4%
19.3%
19.4%
20.8%
23.8%
Washington
Idaho
Arizona
Nevada
North Dakota
Colorado
Texas
District of Columbia
Utah
Alberta

Living in AlbertaEducation
Albertans are among the best educated people in North America.
Alberta has 26 diverse educational institutions, modern facilities,
integrated technologies, and online learning combine to create innovative
teaching and research opportunities for over 268,000 students, spanning
every region of the province.
Alberta’s post-secondary system is instrumental in supporting learners,
society and the economy. It is a comprehensive, coordinated publicly
funded post-secondary system that ensures all Albertans have access to
affordable and high quality learning opportunities to meet their lifelong
learning goals. This system has benefited from significant ongoing public
investment in recent years.
Alberta’s post-secondary system is supplemented by a multitude of
community-based, religious, and vocational training opportunities.
Together, Alberta’s post-secondary providers are offering the quality
education and training Albertans need, where and when they need it.

Comprehensive Academic
& Research InstitutionsUniversity of Alberta; University of Calgary; University of
Lethbridge; Athabasca University
Baccalaureate & Applied
Studies Institutions Grant MacEwan University; Mount Royal University
Alberta College of Art and Design; The Banff Centre
Living in AlbertaEducation
Polytechnical InstitutionsNorthern Alberta Institute of Technology; Southern Alberta
Institute of Technology
Specialized Arts &
Culture Institutions
Independent
Academic
Institutions
Ambrose University; Burman University; Concordia
University; The King’s University; St. Mary’s University
Comprehensive
Community Institutions
Bow Valley College; Grande Prairie Regional College; Keyano
College; Lakeland College; Lethbridge College; Medicine Hat
College; NorQuest College; Northern Lakes College; Olds
College; Portage College; Red Deer College

Living in AlbertaQuality Education
Alberta ranks with the world’s best in terms of the quality of education.
The Program for International Student Assessment (PISA) is a tool
developed by the Organization for Economic Cooperation and
Development (OECD) to provide policy-oriented indicators of the skills
and knowledge of 15-year olds’ capabilities as they near the end of
compulsory education. Since 2000, PISA reports on reading literacy,
mathematical literacy and scientific literacy every three years.
The 2015 examinations placed Alberta among the top ranks of 79
jurisdictions, including 10 Canadian provinces, where the tests were
conducted. Alberta students have the second highest average score in
science, the third highest score in reading, and the fourteenth highest
score in mathematics.
According to the Programme for the International Assessment of Adult
Competencies, Alberta adults ranked first among the provinces for both
numeracy and literacy skills and also for problem solving skills.

Living in AlbertaQuality Education
Source: Measuring Up: Canadian Results of the OECD PISA Study, Council of Ministers of Education, Canada
Top Scores in Mathematics, Science and Reading
2015 Program for International Student Assessment (PISA) Examinations
Average = 500
Mathematics Science Reading
Rank Jurisdiction Score Rank Jurisdiction Score Rank Jurisdiction Score 1 Singapore 564 1 Singapore 556 1 British Columbia 536
2 Hong Kong-China 548 2 Alberta 541 2 Singapore 535
3 Quebec 544 3 British Columbia 539 3 Alberta 533
4 Macao-China 544 4 Japan 538 4 Quebec 532
5 Chinese Taipei 542 5 Quebec 537 5 Ontario 527
6 Japan 532 6 Estonia 534 6 Hong Kong-China 527
7 BSJG-China 531 7 Chinese Taipei 532 7 Canada 527
8 Korea 524 8 Finland 531 8 Finland 526
9 British Columbia 522 9 Macao-China 529 9 Ireland 521
10 Switzerland 521 10 Canada 528 10 Estonia 519
12 Canada 516 11 Vietnam 525 11 Korea 517
14 Alberta 511 12 Ontario 524 12 Nova Scotia 517
50 United States 470 34 United States 496 33 United States 497
1. PISA tests 15 year olds’ tests 15 year olds' Mathematics, Science and Reading skills
2. The rank is out of 79 jurisdictions

Living in AlbertaHealth Care
Compared to other Canadian provinces, Alberta has the highest
age/gender adjusted per capita spending on government health
expenditures, funding more health services than required under the
Canada Health Care Act.
Alberta’s health system directly employs over 100,000 people which
serves a population of over four million.
Alberta has the lowest 30-day hospital mortality rate for both strokes and
heart attacks in Canada. The University of Alberta Hospital has performed
the most heart, lung and heart/lung combined transplants in Canada, and
was the first to offer mechanical hearts to both adults and children.
The province provides 24-hour access to stroke care at 28 centres and
prevention clinics around Alberta, resulting in 23 per cent fewer
emergency/hospital visits and 25 per cent fewer in-hospital deaths from
strokes since 2005.

Living in AlbertaHealth Care
Selected Health Indicators
*Note: Risk Adjusted Percentages
**Canada data do not include Quebec due to differences in data collection
***Preliminary
Sources: National Health Expenditure Trends, 1975-2015, Canadian Institute of Health Information (CIHI); Health
Indicators 2015 Report, CIHI and Statistics Canada
15.0**
7.2**
4.3
13.9
6.4
5.2
30 Day In-HospitalMortality Rate fromStroke* (2009-2012)
30 Day In-HospitalMortality Rate from Heart
Attack* (2009-2012)
Per Capita GovernmentHealth Expenditures -
2015 ($ 000s)***
Alberta Canada

Living in AlbertaArts and Culture
Arts and culture activities accounted for 1.6 per cent of Alberta's gross
domestic product and employed 55,518 Albertans in 2014.
Alberta’s cultural policy, The Spirit of Alberta, supports and creates
opportunities for excellence in the arts, recreation and sports, and
encourages the growth of the cultural industries.
Alberta is a leader among the Canadian provinces in government
investment in the arts and culture. Alberta companies provide the second
highest level of per capita support to the arts in Canada.
In 2015-16, the Alberta Media Fund invested in 88 film, television and
digital media projects to develop local production expertise and talent.

Living in AlbertaArts and Culture
Note: Excludes statistics for Prince Edward Island which were too
unreliable to publish
$56
$71
$72
$90
$99
$105
$113
$173
$181
$183
Newfoundland and Labrador
Quebec
New Brunswick
Nova Scotia
Ontario
Saskatchewan
Canada
Alberta
Manitoba
British Columbia
Source: Statistics Canada
Average Household Spending on Live Sporting and Performing Arts Events: 2011 (Annual Dollars)
Private Sector Support of Performing Arts (2014)
Per Capita
$1.42
$1.91
$2.02
$2.27
$2.63
$4.20
$4.21
$4.33
$5.55
$5.68
New Brunswick
Newfoundland…
Nova Scotia
Saskatchewan
Quebec
Manitoba
British Columbia
Canada
Alberta
Ontario
Note: Excludes statistics for Prince Edward Island which were
suppressed for confidentiality reasons

Living in AlbertaDonations and Volunteerism
Charitable donations, volunteering time to charitable and non-profit
organizations, and helping people in need directly help build community.
Albertans give generously of their time and money for charitable causes.
The average annual donation for Alberta was $863 in 2013, the highest in
the country and far outpacing the Canadian average of $531.
The total amount donated by Albertans to charitable and non-profit
organizations was $2.4 billion in 2013, double the $1.2 billion that was
donated in 2004. By comparison, the total amount of donations all
Canadians made rose from $10.4 billion to $12.8 billion, an increase of 23
per cent.
In 2013, the volunteerism rate of Albertans in support of schools,
charitable and other non-profit organizations was 50.1 per cent compared
to 43.6 per cent in Canada. The total annual volunteer hours were 262
million hours or 161 hours per volunteer.

Living in AlbertaDonations and Volunteerism
Source: General Social Survey of Giving, Volunteering and Participating, Statistics Canada
$264
$345
$350
$396
$497
$531
$532
$680
$699
$704
$863
Quebec
New Brunswick
Newfoundland and Labrador
Nova Scotia
Prince Edward Island
Canada
Ontario
Saskatchewan
Manitoba
British Columbia
Alberta
Charitable Donor StatisticsAverage Annual Donations, 2013
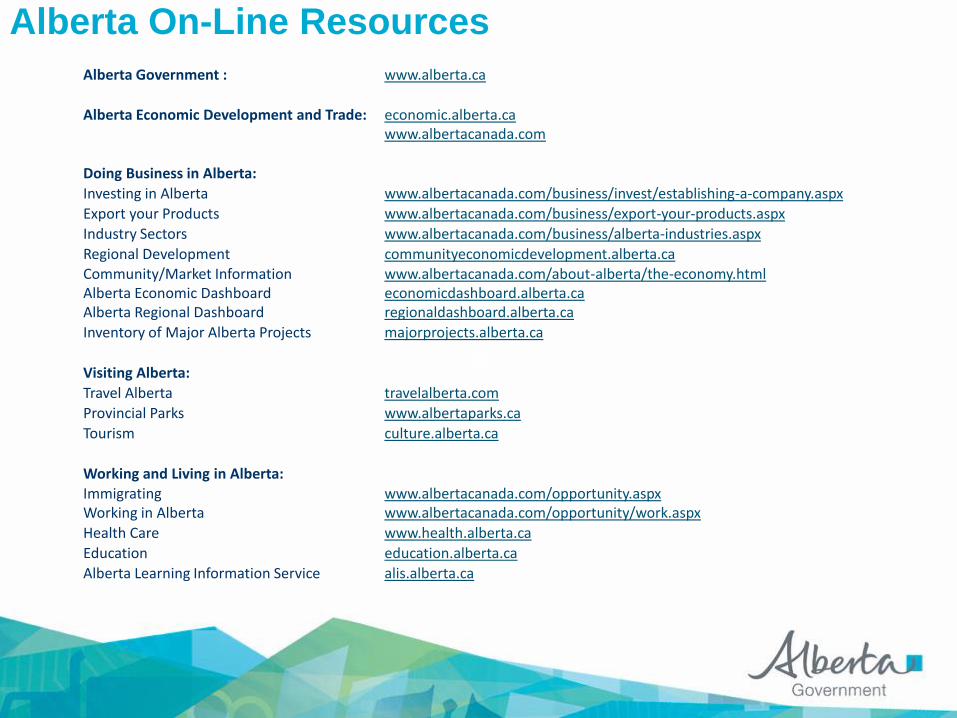
Alberta On-Line Resources
Alberta Government : www.alberta.ca
Alberta Economic Development and Trade: economic.alberta.cawww.albertacanada.com
Doing Business in Alberta:
Investing in Alberta www.albertacanada.com/business/invest/establishing-a-company.aspx
Export your Products www.albertacanada.com/business/export-your-products.aspx
Industry Sectors www.albertacanada.com/business/alberta-industries.aspx
Regional Development communityeconomicdevelopment.alberta.caCommunity/Market InformationAlberta Economic DashboardAlberta Regional Dashboard
www.albertacanada.com/about-alberta/the-economy.htmleconomicdashboard.alberta.caregionaldashboard.alberta.ca
Inventory of Major Alberta Projects majorprojects.alberta.ca
Visiting Alberta:
Travel Alberta travelalberta.com
Provincial Parks www.albertaparks.ca
Tourism culture.alberta.ca
Working and Living in Alberta:ImmigratingWorking in Alberta
www.albertacanada.com/opportunity.aspxwww.albertacanada.com/opportunity/work.aspx
Health Care www.health.alberta.ca
Education education.alberta.ca
Alberta Learning Information Service alis.alberta.ca