Embed Size (px)
Citation preview

Highlights of Second Quarter FY2017 Business Results
(Year ending March 31, 2018 )
1
(TSE 4539)

Contents
2
I. Summary of Results ………………………… 3
II. FY 2017 Forecasts ……………………………. 9
III. Management Strategy…………………………. 12
Slide

I. Summary of Results
3

Sales, Income (Consolidated)
4
(¥mn)
Amount % ofSales
Amount % ofSales
Amount Change (%)
AmountProgress
rate (%)
Net Sales 17,515 100.0 17,512 100.0 (3) (0.0) 18,700 93.6 Pharmaceuticals 17,022 97.2 17,097 97.6 74 0.4 ― ― Others 493 2.8 415 2.4 (77) (15.8) ― ― Cost of sales 9,586 54.7 9,562 54.6 (24) (0.3) ― ―
(0.1p) SG&A expenses 6,606 37.7 6,970 39.8 364 5.5 ― ―
2.1p
Operating income 1,323 7.6 979 5.6 (343) (26.0) 1,300 75.4
Income before income taxesand minority interests 1,147 6.6 1,064 6.1 (82) (7.2) ― ―
Net income attributable toowners of the parent 822 4.7 730 4.2 (92) (11.2) 800 91.3
2Q FY2016YOY
2Q FY2017 2Q FY2017(Forecast)
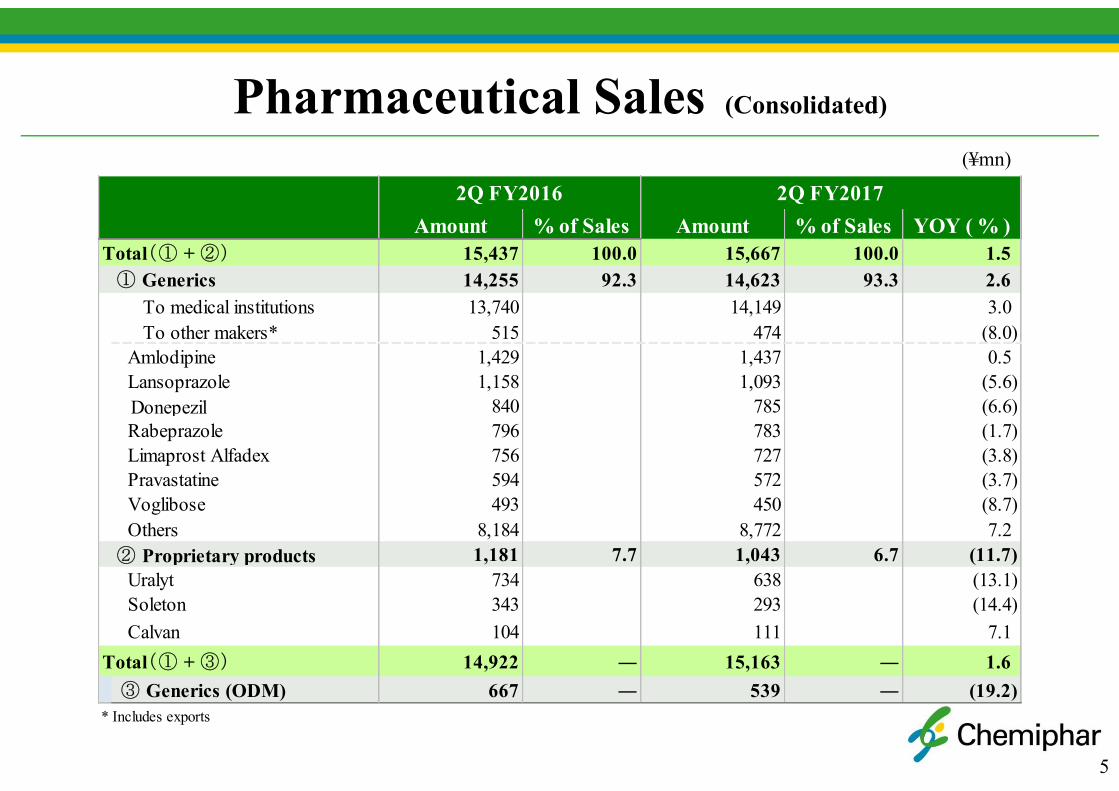
Pharmaceutical Sales (Consolidated)
5
Amount % of Sales Amount % of Sales YOY ( % )Total(① + ②) 15,437 100.0 15,667 100.0 1.5 ① Generics 14,255 92.3 14,623 93.3 2.6 To medical institutions 13,740 14,149 3.0 To other makers* 515 474 (8.0) Amlodipine 1,429 1,437 0.5 Lansoprazole 1,158 1,093 (5.6) Donepezil 840 785 (6.6) Rabeprazole 796 783 (1.7) Limaprost Alfadex 756 727 (3.8) Pravastatine 594 572 (3.7) Voglibose 493 450 (8.7) Others 8,184 8,772 7.2 ② Proprietary products 1,181 7.7 1,043 6.7 (11.7) Uralyt 734 638 (13.1) Soleton 343 293 (14.4) Calvan 104 111 7.1Total(① + ③) 14,922 ― 15,163 ― 1.6
③ Generics (ODM) 667 ― 539 ― (19.2)* Includes exports
2Q FY2016 2Q FY2017(¥mn)

6
Composition of Generics Sales by Destination(Non-consolidated)
70% of 58,000 dispensing pharmacies sell Chemiphar generics
80% of 1,700 DPC hospitals sell Chemiphar generics
2Q FY2015Distrib. Distrib.
YOY Sales(%) Distrib. YOY (%)
14 14 5.2 15 2.5
12 11 (4.7) 11 (2.3)
74 75 2.5 74 (0.4)
100 100 2.0 100 0.0
- - 7.0 - 2.8Of which, DPC hospitals
Total
2Q FY2016 2Q FY2017
Hospitals (100 beds or more)
Clinics (less than 100 beds)
Pharmacies

Balance Sheet (Consolidated)
7
(¥mn)
FY2016 2Q FY2017 Change
Cash, deposits (853)Notes, accounts receivable-trade (236)Inventories (131)Buildings and structures 1,344Machinery equipment, tool fixture 184Land (384)Construction in progress (1,048)Investments in securities 426
Total assets 47,002 46,160 (841)Notes, accounts payable-trade (804)Loans payable 337Accounts payable (502)Accured expenses 269Accured consumption tax etc. 145
Net assets 17,355 16,968 (387) Retained earnings 464
Equity ratio (%) 36.9 36.7 (0.2p) Valuation differences on available-for-sales securities
291
Treasury stock (1,000)
Liabilities, net assets 47,002 46,160 (841)
Components
Current assets 29,009 27,602 (1,406)
565
Liabilities 29,646 29,192 (453)
Non-current assets 17,991 18,556

Cash Flow
8
(¥mn)(¥mn)
848 208
193
1,113 1,295
(168) (1,001)(267) (1,392)
(1,064)
1,706 602
224
171
(1,097)
680
(792)
(74) (279)230
(6,000)
(5,000)
(4,000)
(3,000)
(2,000)
(1,000)
0
1,000
(3,000)
(2,000)
(1,000)
0
1,000
2,000
3,000
4,000
2014年3月期
第2四半期
2015年3月期
第2四半期
2016年3月期
第2四半期
2017年3月期
第2四半期
2018年3月期
第2四半期営業C/F 投資C/F 財務C/F フリーC/F(右軸)※Operating cash flow
Investment cash flow
Financing cash flow Free cash flow
2Q 2013 2Q 2014 2Q 2015 2Q 2016 2Q 2017
Free Cash Flow (as the end of FY)
FY 2013 FY 2014 FY 2015 FY 2016(606) 365 2,299 232
Ⅱ. FY2017 Forecasts
9

10
Revised Forecast (Consolidated)
(¥mn)
FY 2016
Amount 2Q Amount Originalforecast*
Revisedforecast**
Progressrate(%)
Net Sales 35,689 17,512 38,000 35,500 49.3
Pharmaceuticals 31,513 15,667 34,700 32,000 49.0
Generics 29,204 14,623 32,600 30,000 48.7
Proprietary products 1,395 1,043 2,100 2,000 52.2
Operating income 2,836 979 2,500 1,800 54.4
2,054 730 1,550 1,150 63.5* issued on March 11, 2017**issued on October 31, 2017
FY 2017
Net income attributable toowners of the parent

11
New Generics in FY 2017Set for launch in December, 2017
Launched in June, 2017
Product ItemIrbesartan 3Olmesartan 4Rosuvastatin 2Rosuvastatin OD 2
Product ItemTelmisartan 3Montelukast Fine Granules 1Montelukast Chewable 1

III. Management Strategy
12

Three Plus 1 Principal Strategies
Strategy 1Generics
Strategy 2Hyperuricemia
Strategy 3Drug discovery
Plus 1Overseas business
Overview
At present In future
13
Strategy 1: Secure our presence in the generics businessDevelop unique business by differentiating our products and enhance cost competitiveness.
Strategy 2: Achieve a stronger position in the hyperuricemia market, centered on Uralyt
Enhance group research initiatives, promote R&D in antihyperuricemic agents, and achieve out-licensing new drugs earlier.
Strategy 3: Contribute to society through drug discoveryFocus on discovery in our particular areas of strength.
Plus 1: Apply our goals to enter emerging marketsDevelop our business in foreign markets centeringon Asia.
Three principal strategies bolster our business By fulfilling our three principal strategies, we will establish a proprietary business model. Expanding business abroad will make business growth sustainable.
Management Strategy 1
14
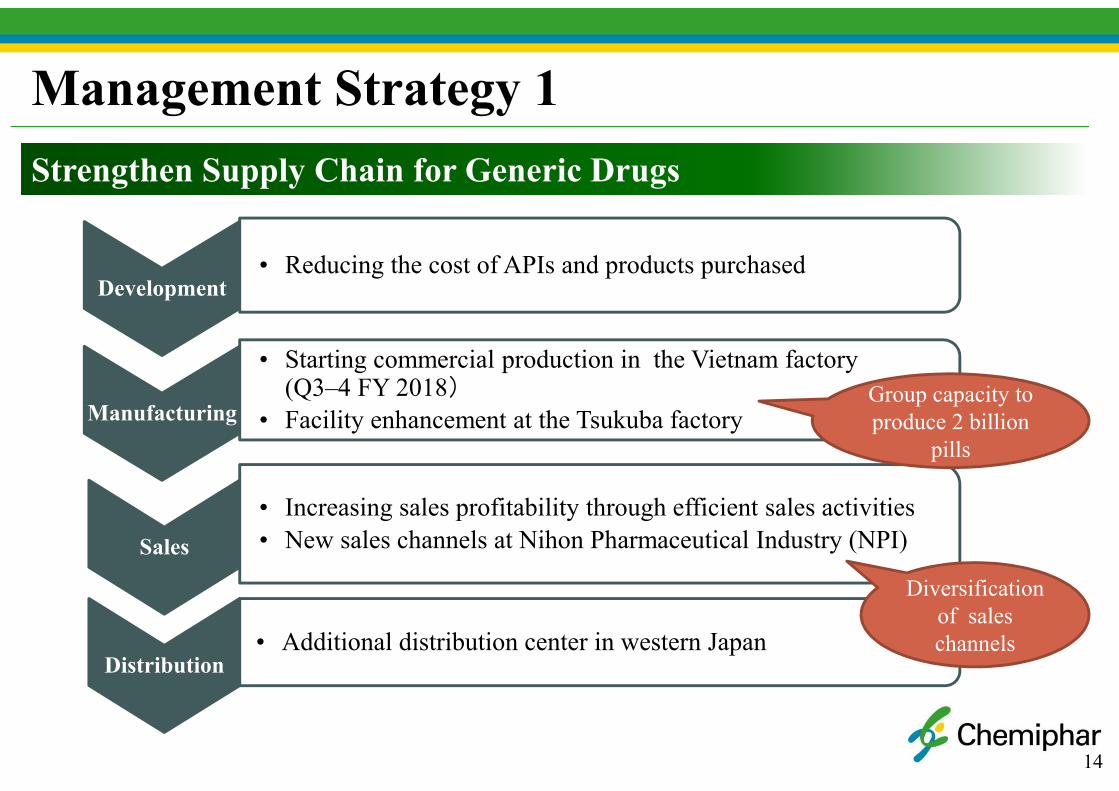
Strengthen Supply Chain for Generic Drugs
Development• Reducing the cost of APIs and products purchased
Manufacturing
• Starting commercial production in the Vietnam factory (Q3–4 FY 2018)
• Facility enhancement at the Tsukuba factory
Sales
• Increasing sales profitability through efficient sales activities• New sales channels at Nihon Pharmaceutical Industry (NPI)
Distribution• Additional distribution center in western Japan
Group capacity to produce 2 billion
pills
Diversification of sales channels

Management Strategy 2
15
Multifaceted Approach to Hyperuricemia (Urine Alkalization)
• NC Group almost entirely controls the citrate formulation market
NPI took over Urinmet (UralytGE) from Sawai in August 2016
• Possibility of citrate formulation market expansion
Progress of clinical research at Tohoku University
• Development of drugs with different mechanism of action
New drug discovery(NC-2500 and NC-2700)

Management Strategy 2
16
New Drug DiscoveryPipeline (as of October 2017)
No. Function (Target) Preclinical Phase 1 Phase 2 Notes
NC-2400 PPAR-delta agonist(Lipid metabolism)
Finished Phase 1. Licensed. • Licensed to Cerenis Therapeutics (France).
NC-2500 XOR inhibition (Hyperuricemia)
Finished Phase 1. Will be licensed next year.
• Phase1 was finished in September as originally planned. Currently, data is under analysis.
• Conducting premarketing. Aiming for speedy licensing.
NC-2600* P2X4 antagonist (Neuropathic pain)
Finished Phase 1. Will be licensed next year.
• Joint research with Kyusyu University.• Phase 1 was finished in September as originally planned.
Currently, data is under analysis.• Will be licensed after finishing Phase 1 (March 2018).
NC-2700 URAT1 inhibition(Hyperuriceia)
Finished preclinical trial. Data in under analysis.
• Finished preclinical trial. Data is under analysis.
NC-2800* Delta opioid receptor agonist (Depression / Anxiety)
Under preclinical trial until March 2018.
• Joint research with the University of Tsukuba, KitasatoUniversity, and the National Center of Neurology and Psychiatry.
• Study development policy while conducting licensing activities.
SoletonNSAID (Diffuse-type tenosynovialgiant cell tumor and others)
• Physician-initiated clinical trial started.
Calvan Α1β1 blocker(Huntington's disease)
• Phase 2 is scheduled for new application by an overseas venture.
* Supproted by the Japanese Agency for Research and Development (AMED).

Management Strategy 3
17
Drug Repositioning for Proprietary Drugs
Uralyt• Cooperating in clinical research at Tohoku University
Soleton• Started physician-initiated clinical trial, supported by the
Center for Clinical Trials, Japan Medical Association
Calvan• Development of Phase II clinical trial for orphan
adaptation by SOM (Spain)

Management Strategy 4
18
Overseas Business
■ Pharmaceuticals
■ DignosticsDiaPack3000
■ Vietnam factoryWe took delivery of the building on September 14, 2017, and will start commercial production in fall 2018. In the future, it will serve as a foothold for future sales in the ASEAN region.
Sales of Cilostazol in Hong Kong began in October 2017.
We are conducting marketing, mainly in Asia, centering on the world’s fastest allergy testing equipment (DiaPack3000) and allergy testing reagent (Oriton IgE).
Area Have been approved Approval applications
China Calvan2 products centerd in ASEAN
Hong Kong Pioglitazone, Cilostazol
Korea Soleton, Calvan
Thailand Uralyt
Note about Forward-looking Statements and ForecastsStatements made in this Highlights of Business Results, with respect to current plans, estimates, strategies and beliefs, and other statements of Nippon Chemiphar that are not historical facts are forward-looking statements about the future performance of Nippon Chemiphar.
These statements are based on management’s current assumptions and beliefs in light of the information currently available to it and involve known and unknown risks and uncertainties. Consequently, undue reliance should not be placed on these statements.
Nippon Chemiphar cautions the reader that a number of important factors could cause actual results to differ materially from those discussed in the forward-looking statements.
For further information contact:Public Relations Department, Nippon Chemiphar Co., Ltd.E-mail: [email protected]
19