Embed Size (px)
Citation preview

Chapter 1: Policy Context 1
Higher Education Outcomes
Graduation Years 2010-2014
Analysing Graduate Destinations and Earnings using Administrative Data
2 Chapter 1: Policy Context
Published by the Central Statistics Office, Ireland
Higher Education Outcomes

Chapter 1: Policy Context 3
© Government of Ireland 2018
Material compiled and presented by the Central Statistics Office.
Produced by the Central Statistics Office and the Higher Education Authority, January 2018
Reproduction is authorised, subject to acknowledgement of the source.
Further information is available at:
http://www.cso.ie/en/aboutus/copyrightpolicy/


Chapter 1: Policy Context 5
The core concept of the NDI is very simple. It involves the collection and storage, on all public sector data holdings, of the associated PPSN, Eircode and Unique Business Identifier (UBI, to be developed) whenever they are relevant to Public Sector Body (PSB) transactions with customers. What is needed to achieve this, in most cases, is collection of the PPSN and Eircode in transactions with people and the UBI and business Eircode in transactions with businesses. The benefits to statistics and to public services from well-structured data are enormous. This is recognised in Action 7 “Optimise the use of data” of the “Our Public Service 2020” strategy2.
The CSO is co-ordinating the establishment of the NDI through three main activities:
2 http://ops2020.gov.ie
The establishment of Departmental NDI Champions who promote NDI practices within government departments. Progress is measured using an NDI ‘maturity dashboard’, with reports to both the NDI Champions Group and the Civil Service Management Board. Pathfinder Projects – collaborative activities which demonstrate the value of administrative data. This report is the first of these partnership projects to be published.
Expansion of the seconded statistician service, (the ‘Irish Government Statistical Service’). Seconded statisticians with access to well-structured data in the public service deliver a wide range of business benefits and thus further advance the case for the NDI.
This report provides an in-depth analysis of the outcomes for graduates from Higher Education Institutions in Ireland and has been produced by the Central Statistics Office (CSO) in collaboration with the Higher Education Authority (HEA). Areas covered include employment, re-enrolment in education, the industry sectors in which graduates work and their earnings over time. The analysis includes graduates from a range of levels, including Certificates, Ordinary and Honours Bachelor’s Degrees, Master’s Degrees and Doctoral Degrees. To minimise the effect of working experience on outcomes this study excludes mature graduates. This report aims to aid policymakers, including the HEA, in the evaluation and promotion of excellence in Higher Education.
1 http://www.irishstatutebook.ie/eli/1993/act/21/enacted/en/html
This statistical release is an example of the policy-relevant research projects the CSO are developing in partnership with Public Sector Bodies, and as part of the CSO’s leadership role of the Irish Statistical System. These projects involve the integration of secondary datasets held by government departments and agencies with existing administrative data held by the CSO to produce aggregated analysis and outputs. The present study involved the transfer of graduation and enrolment records from the HEA to the CSO, where it was matched to existing administrative data to determine graduate outcomes. All data linking was carried out on pseudonymised datasets using Protected Identifier Keys. Care should be taken when interpreting the results. The methodology used to produce the data in this report is given in Appendix A. This is published by the CSO under the provisions of the Statistics Act, 19931.
Introduction and Background
Executive Summary
National Data Infrastructure (NDI)
Executive Summaryi

Chapter 1: Policy Context6 Executive Summary
Overall Findings Among 2010 Graduates, 66% were in substantial employment in the first year after graduation, and this had increased to 76% for 2014 graduates.
More than a quarter (28%) of 2014 graduates had re-enrolled in education in the first year after graduation, with most of these being simultaneously in substantial employment.
The largest sector for employment for 2010 graduates in the first year after graduation was Wholesale & Retail Trade which employed a fifth of all graduates but this proportion dropped to 10% after five years.
The proportion of 2010 graduates working in Education rose from 15% after one year to 19.2% after five years.
Graduates are more likely to work in large businesses than the general population, with 57% of 2010 graduates employed in large businesses five years after graduation compared to 47.8% of the general population.
Each 2010 graduate had an average of 3.2 different employers over their first five years after graduation.
Median weekly earnings for 2010 graduates rose from €420 in the first year after graduation to €640 by the fifth year.
Findings by Sex Female graduates from 2010 were more likely to be in substantial employment in the first year after graduation than males, with 71% of females and 60% of males in substantial employment one year after graduation. Five years later, 70% of females from the class of 2010 were in employment compared to 64% of males.
Female graduates were more likely to work in Education and Health & Social work than males.
Just under a quarter of female graduates from 2010 were working in Education five years after graduation compared to 12.1% of males while 17.5% of female
graduates were employed in Health & Social work compared to just 4.2% of males.
Males were more likely to work in the Professional, Scientific & Technical Activities, Finance & Real Estate, Industry and Information & Communication sectors.
In the first year after graduation, median weekly earnings were equal for men and women at €420 per week. However, after five years, median weekly earnings for men, at €655 per week, were €20 above the figure of €635 per week for women.
Findings by Field of Study Graduates from 2014 in Natural Sciences, Mathematics & Statistics and from Arts & Humanities had the lowest rates of employment one year after graduation at about 67%.
The proportion of Engineering, Manufacturing & Construction graduates in employment one year after graduation rose from 55% to 72% between 2010 and 2014 and was the largest increase in any field of study.
Chapter 1: Policy Context 7
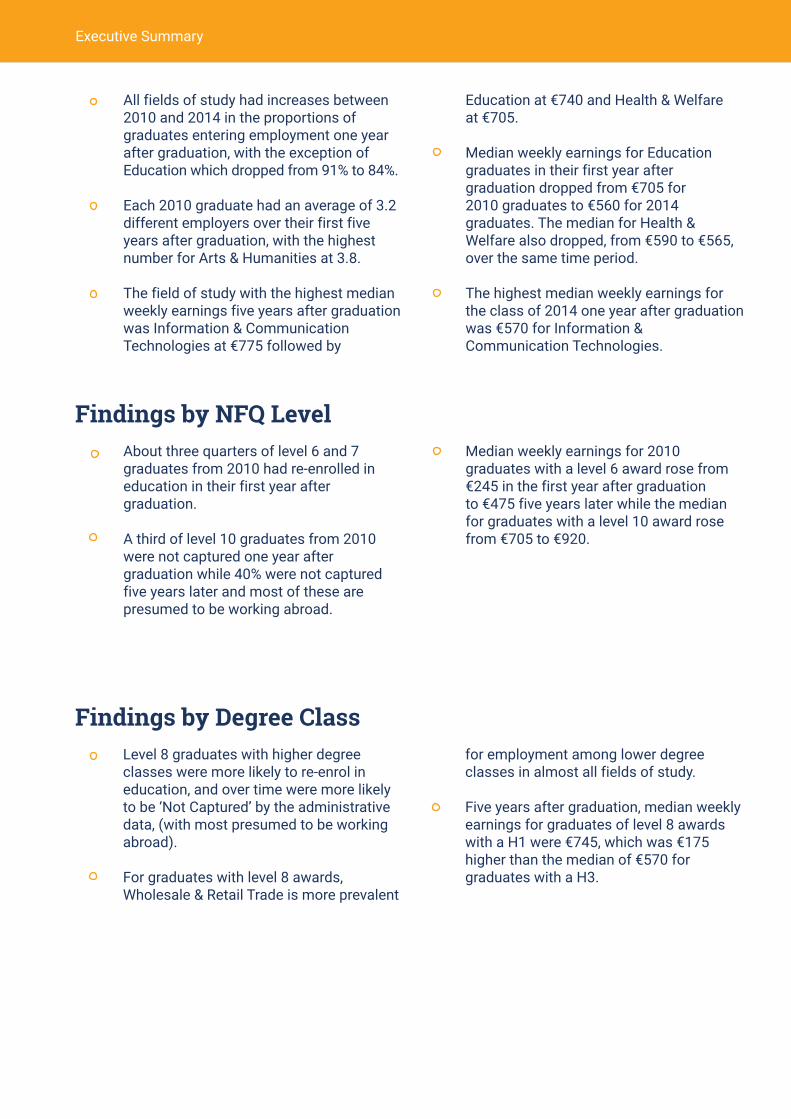
All fields of study had increases between 2010 and 2014 in the proportions of graduates entering employment one year after graduation, with the exception of Education which dropped from 91% to 84%.
Each 2010 graduate had an average of 3.2 different employers over their first five years after graduation, with the highest number for Arts & Humanities at 3.8.
The field of study with the highest median weekly earnings five years after graduation was Information & Communication Technologies at €775 followed by
Education at €740 and Health & Welfare at €705.
Median weekly earnings for Education graduates in their first year after graduation dropped from €705 for 2010 graduates to €560 for 2014 graduates. The median for Health & Welfare also dropped, from €590 to €565, over the same time period.
The highest median weekly earnings for the class of 2014 one year after graduation was €570 for Information & Communication Technologies.
Executive Summary
Findings by NFQ Level About three quarters of level 6 and 7 graduates from 2010 had re-enrolled in education in their first year after graduation.
A third of level 10 graduates from 2010 were not captured one year after graduation while 40% were not captured five years later and most of these are presumed to be working abroad.
Median weekly earnings for 2010 graduates with a level 6 award rose from €245 in the first year after graduation to €475 five years later while the median for graduates with a level 10 award rose from €705 to €920.
Findings by Degree Class Level 8 graduates with higher degree classes were more likely to re-enrol in education, and over time were more likely to be ‘Not Captured’ by the administrative data, (with most presumed to be working abroad).
For graduates with level 8 awards, Wholesale & Retail Trade is more prevalent
for employment among lower degree classes in almost all fields of study.
Five years after graduation, median weekly earnings for graduates of level 8 awards with a H1 were €745, which was €175 higher than the median of €570 for graduates with a H3.
Executive Summary ii
Overview of Terminology
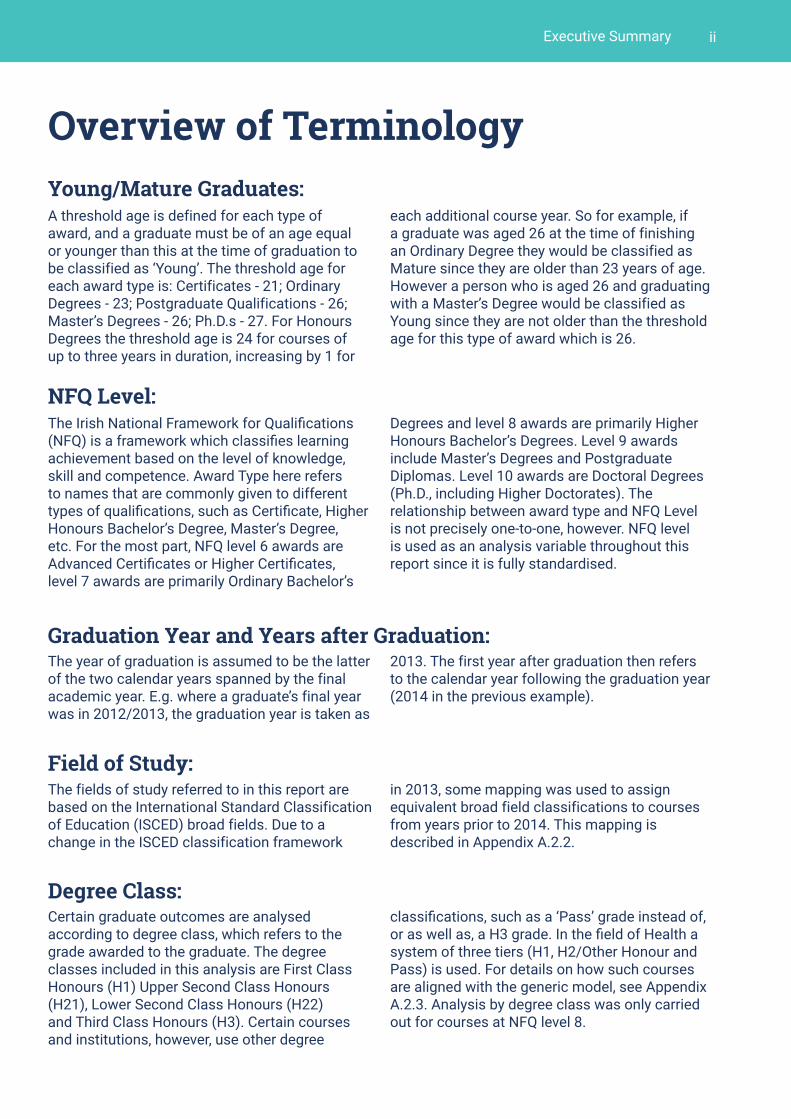
A threshold age is defined for each type of award, and a graduate must be of an age equal or younger than this at the time of graduation to be classified as ‘Young’. The threshold age for each award type is: Certificates - 21; Ordinary Degrees - 23; Postgraduate Qualifications - 26; Master’s Degrees - 26; Ph.D.s - 27. For Honours Degrees the threshold age is 24 for courses of up to three years in duration, increasing by 1 for
each additional course year. So for example, if a graduate was aged 26 at the time of finishing an Ordinary Degree they would be classified as Mature since they are older than 23 years of age. However a person who is aged 26 and graduating with a Master’s Degree would be classified as Young since they are not older than the threshold age for this type of award which is 26.
The Irish National Framework for Qualifications (NFQ) is a framework which classifies learning achievement based on the level of knowledge, skill and competence. Award Type here refers to names that are commonly given to different types of qualifications, such as Certificate, Higher Honours Bachelor’s Degree, Master’s Degree, etc. For the most part, NFQ level 6 awards are Advanced Certificates or Higher Certificates, level 7 awards are primarily Ordinary Bachelor’s
Degrees and level 8 awards are primarily Higher Honours Bachelor’s Degrees. Level 9 awards include Master’s Degrees and Postgraduate Diplomas. Level 10 awards are Doctoral Degrees (Ph.D., including Higher Doctorates). The relationship between award type and NFQ Level is not precisely one-to-one, however. NFQ level is used as an analysis variable throughout this report since it is fully standardised.
The year of graduation is assumed to be the latter of the two calendar years spanned by the final academic year. E.g. where a graduate’s final year was in 2012/2013, the graduation year is taken as
2013. The first year after graduation then refers to the calendar year following the graduation year (2014 in the previous example).
The fields of study referred to in this report are based on the International Standard Classification of Education (ISCED) broad fields. Due to a change in the ISCED classification framework
in 2013, some mapping was used to assign equivalent broad field classifications to courses from years prior to 2014. This mapping is described in Appendix A.2.2.
Graduation Year and Years after Graduation:
Field of Study:
NFQ Level:
Degree Class:
Young/Mature Graduates:
Certain graduate outcomes are analysed according to degree class, which refers to the grade awarded to the graduate. The degree classes included in this analysis are First Class Honours (H1) Upper Second Class Honours (H21), Lower Second Class Honours (H22) and Third Class Honours (H3). Certain courses and institutions, however, use other degree
classifications, such as a ‘Pass’ grade instead of, or as well as, a H3 grade. In the field of Health a system of three tiers (H1, H2/Other Honour and Pass) is used. For details on how such courses are aligned with the generic model, see Appendix A.2.3. Analysis by degree class was only carried out for courses at NFQ level 8..

Chapter 1: Policy Context 9
Table of Contents
Executive Summary National Data Infrastructure Table of Contents
Chapter 1 - Policy Context
1.1 HEA and Higher Education Policy Context 1.2 CSO Policy and National Data Infrastructure (NDI) 1.3 Operating Context in Higher Education 1.4 Developing the Evidence Base
Chapter 2 - Data Context 2.1 Introduction 2.2 Current Situation for Irish Graduates 2.3 Rates of Unemployment and Employment 2.4 Emigration Rates 2.5 Earnings and Income 2.6 International Studies using Administrative Data 2.7 Context Summary
Chapter 3 - Graduate Statistics 3.1 Introduction3.2 Graduation Dataset 3.3 Numbers of Graduates 3.3.1 Numbers of Graduates by Analysis Parameters 3.3.2 Non-Irish Graduates by Year 3.3.3 Irish/Non-Irish Proportions by NFQ Level 3.4 Fields of Study of Graduates 3.4.1 Number of Graduates by Field of Study by Year 3.4.2 Field of Study of Graduates by Sex3.4.3 Fields of Study by Geographical Region 3.4.4 Fields of Study by Institute Type 3.4.5 NFQ Proportions by Field of Study 3.4.6 Proportions of non-Irish Graduates by Field of Study
Page
iivvi
1
2235
7
889
12121415
16
17181920222223232426282829
Chapter 1: Policy Context10Chapter 4 - What do Graduates do? 4.1 Introduction 4.2 Destination Outcomes of All Graduates 4.3 Destination Outcomes by Sex 4.4 Destination Outcomes by Field of Study 4.5 Destination Outcomes by NFQ Level 4.6 Destination Outcomes by Degree Class Chapter 5 - Where do Graduates work? 5.1 Introduction 5.2 NACE Sectors 5.2.1 NACE Sectors of All Graduates 5.2.2 NACE Sectors by Sex 5.2.3 NACE Sectors by NFQ Level 5.2.4 NACE Sectors by Institute Type 5.2.5 NACE Sectors by Field of Study 5.2.6 NACE Sectors by Degree Class 5.3 Business Size 5.4 Job Churn 5.4.1 Number of Employers by Field of Study 5.4.2 Number of NACE Sectors by Field of Study
Chapter 6 - What do Graduates Earn?
6.1 Introduction 6.2 Earnings of All Graduates 6.3 Earnings by Sex 6.4 Earnings by NFQ Level 6.5 Earnings by Class of Degree 6.6 Earnings by Field of Study Chapter 7 - How do Higher Education Graduates compare to Non-Graduates?
7.1 Introduction 7.2 Destination Outcomes 7.3 NACE Sectors 7.4 Earnings
30
313336374143
45
464747515253535557585960
61
626363656768
70
71727374
Chapter 1: Policy Context 11Chapter 8 - Comparing Administrative Data with Survey Data
8.1 Introduction 8.2 Destination Outcomes 8.3 Earnings Appendix A - Methodology
A.1 Data Sources and Matching Overview A.2 HEA Data A.2.1 Graduates with Missing/Invalid PPSN A.2.2 Classification of Fields of Study A.2.3 Degree Class A.2.4 Institutes and Institute Types A.2.5 Young and Mature Definitions A.2.6 Graduates with more than one Graduation per year A.2.7 Re-Enrolment Data A.2.8 Excluded categories of students A.3 Revenue Data Source A.3.1 P35 Data A.3.2 IT Form 11 Data A.3.3 Benefits Data A.3.4 Substantial Employment A.3.5 Not Captured and Neither Employment nor Education A.3.6 Job Churn
Glossary
75
767780
82
8283838587878888898990909192929293
93

Chapter 1: Policy Context 1
Chapter 1:Policy Context

Chapter 1: Policy Context2
The HEA is the statutory funding authority for the universities, institutes of technology and a number of other institutions; and is an advisory body to the Minister for Education and Skills in relation to the higher education sector. The HEA was established with the enactment of the Higher Education Authority Act 1971. The functions of the HEA include ensuring governance oversight of the higher education system; coordinating state investment and allocating funding; promoting equality of opportunity; promoting attainment and maintenance of excellence in learning, teaching and research; and promoting an appreciation of the value of higher education and furthering its development. A full list of all the institutions funded by the HEA is provided in Appendix A.2.4.
In support of the wide range of activities in which it is involved, and to assist government and other agencies, the HEA collects, analyses, and reports on data from and across higher education
institutions. In addition, the HEA also engages in international benchmarking of its work and of the higher education sector to ensure that the development of the system is informed by international best and future practice.
The National Strategy for Higher Education to 2030, published in 2011, sets out the strategic role of the HEA in the further development of the higher education system; specifically monitoring of the performance of higher education institutions and providing accountability to the Minister in respect of performance outcomes for the sector. This is transacted through the System Performance Framework and the process of strategic dialogue. The higher education system is also informed by policies set out in the Action Plan for Education, the National Plan for Equity of Access to Higher Education, the Action Plan for Jobs, and Innovation 2020, amongst others.
HEA and Higher Education Policy Context
CSO Policy and National Data Infrastructure (NDI)
1.1
The CSO is committed to broadening the range of high quality information it provides on societal and economic change. The large increase in the volume and nature of secondary data in recent years poses a variety of challenges and opportunities for institutes of national statistics. Joining secondary data sources in a safe manner across public service bodies, while adhering to statistical and data protection legislation, can provide new analysis and outputs to support decision-making and accountability in a way that is not possible using discrete datasets. Furthermore, a coordinated approach to data integration can lead to cost savings, greater efficiency and a reduction in duplication.
The CSO has a formal role in coordinating the integration of statistical and administrative data across public service bodies that together make up the Irish Statistical System (ISS). Underpinning this integration is the development of a National Data Infrastructure – a platform for linking data across the administrative system using unique identifiers for individuals, businesses and locations. The data linking for statistical purposes is carried out by the CSO on pseudonymised datasets using only those variables which are relevant to the research being undertaken. A strong focus on data integration, which involves the use of identifiers such as PPSN and Eircodes, is a priority of the ISS in its goal of improving the analytical capacity of the system.
1.2
Chapter 1: Policy Context 3
The Department of Education and Skills, the ESRI and the Skills and Labour Market Research Unit (SLMRU) in SOLAS predict substantial and steady increases in demand for higher education right through the 2015-2020 period and beyond, as the demographic population base increases in size. Further, this increased demand arises not just because of demographic drivers, but also labour market requirements for high-level skills and for the upskilling of those working part-time.
Figures produced by the Department of Education and Skills estimate that by 2028 the number of new entrants to higher education will increase by 29% over 2013 levels3. The ESRI calculate similar figures, with the number of potential undergraduate higher education entrants each year to increase from 41,000 in 2010/2011 to just over 51,000 by 2029/20304.
In terms of employment and jobs, the Skills and Labour Market Research Unit projects that over the period 2012-2020, strong employment growth can be expected in construction; science, engineering and IT; and in legal, business and financial occupations5. The report notes that the strongest employment growth is expected for higher education graduates;
3 Department of Education and Skills, “Projections of Demand For Full-time Third Level Education 2014-2028”, July 2014.4 Economic and Social Research Institute, “A Study of Future Demand for Higher Education in Ireland”, December 2012.5 SOLAS (Skills and Labour Market Research Unit), “Occupational Employment Projections 2020”, January 2014.6 http://www.cedefop.europa.eu/printpdf/publications-and-resources/country-reports/ireland-skills-forecasts-20257 Expert Group on Future Funding for Higher Education, “The Role, Value and Scale of Higher Education in Ireland”, January 2015
“The educational distribution of occupational employment is projected to improve further, with the share of third level graduates increasing in all occupations; the share of Further Education and Training qualifications holders increasing in all occupations except professional, associate professional and administrative; [and] the share of persons with less than higher secondary education declining in all occupations.”
The European Centre for the Development of Vocational Training (Cedefop) estimates that most job opportunities will be for professionals in high level occupations such as science, engineering, healthcare, business and teaching6.
The Expert Group on Future Funding for Higher Education notes7:
“Projections suggest that 48% of job openings in the Irish economy to 2025 will be for graduates. Giving replacement demand equal attention to expansion demand nearly quadruples the number of people needed to fill jobs that are high skilled. The future outlook for jobs that require intermediate and lower skills is even more transformed.”
Operating Context in Higher Education
1.3
Data protection is a core principle of the CSO and is central to the development of the NDI. As well as the strict legal protections set out in the Statistics Act, 1993, and other existing regulations, we are committed to ensuring compliance with future data protection requirements. These include the Data Sharing and Governance Bill, which will set new governance standards for data sharing and management by public bodies, and the General Data Protection Regulation (GDPR, EU 2016/679), which will come into effect in May of this year.
This report on higher education outcomes using administrative data for the HEA is a good example of the type of partnership approach the CSO can adopt with a public agency using the National Data Infrastructure. The CSO is hopeful that this joint project between the CSO and the HEA, as well as the innovative methodologies used in the report, will become a template for further collaborations with other government departments and agencies.
Chapter 1: Policy Context4
The Group also states: “A useful distinction is made between new jobs likely to be created (expansion demand) and job openings arise as people retire, change career, emigrate, become ill or withdraw from the labour force (replacement demand). It is estimated that some 8,000 graduates in employment will have to be replaced each year due to retirement alone.”
Indications at this point are that the future graduate supply from higher education may not be sufficient to meet these employment openings, even taking into account the continued growth of the system. As noted by Department of Jobs, Enterprise and Innovation, “competition for talent
8 Department of Jobs, Enterprise and Innovation, “Policy Statement on Foreign Direct Investment in Ireland”, July 20149 OECD, Education at a Glance, 2017, Table B2.2.10 OECD, Education at a Glance, 2017, Table B2.3.
is global”8, and the most qualified and capable graduates are in shortage internationally in key economic areas.
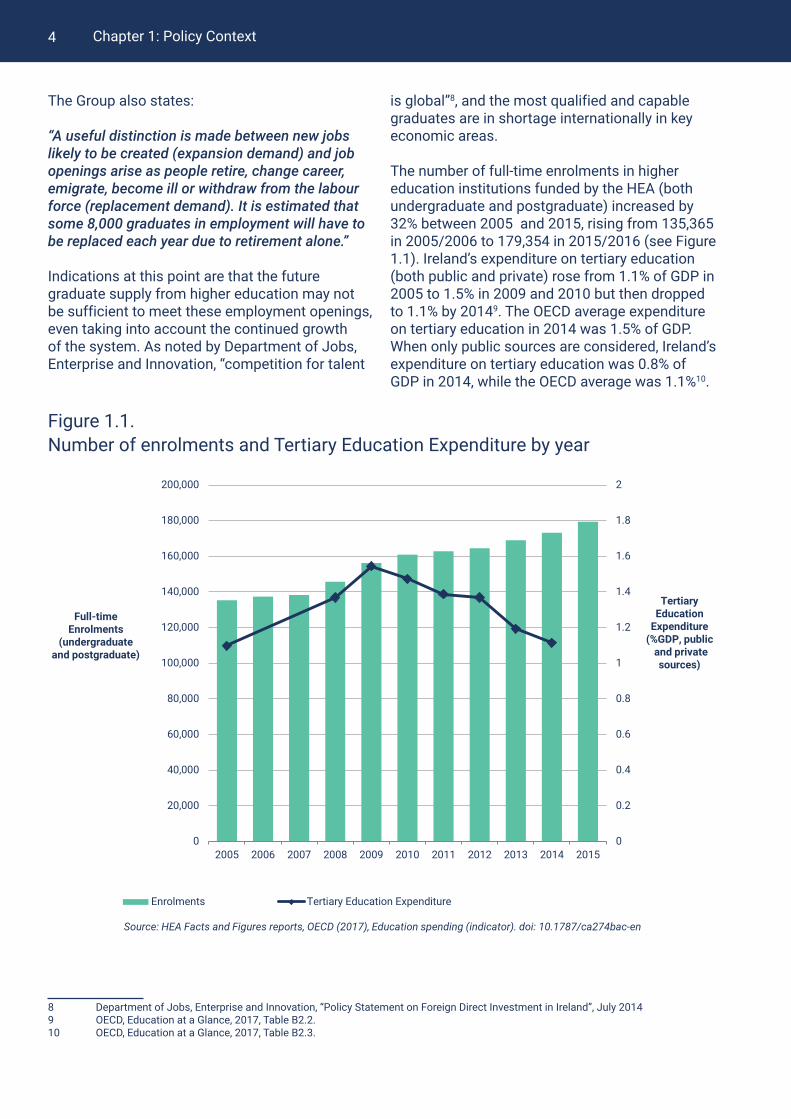
The number of full-time enrolments in higher education institutions funded by the HEA (bothundergraduate and postgraduate) increased by 32% between 2005 and 2015, rising from 135,365 in 2005/2006 to 179,354 in 2015/2016 (see Figure 1.1). Ireland’s expenditure on tertiary education (both public and private) rose from 1.1% of GDP in 2005 to 1.5% in 2009 and 2010 but then dropped to 1.1% by 20149. The OECD average expenditure on tertiary education in 2014 was 1.5% of GDP. When only public sources are considered, Ireland’s expenditure on tertiary education was 0.8% of GDP in 2014, while the OECD average was 1.1%10.
Figure 1.1. Number of enrolments and Tertiary Education Expenditure by year
0
0.2
0.4
0.6
0.8
1
1.2
1.4
1.6
1.8
2
0
20,000
40,000
60,000
80,000
100,000
120,000
140,000
160,000
180,000
200,000
2005 2006 2007 2008 2009 2010 2011 2012 2013 2014 2015
Tertiary Education
Expenditure (%GDP, public
and private sources)
Full-time Enrolments
(undergraduateand postgraduate)
Enrolments Tertiary Education Expenditure
Source: HEA Facts and Figures reports, OECD (2017), Education spending (indicator). doi: 10.1787/ca274bac-en
Chapter 1: Policy Context 5
The foregoing discussion illustrates the need to develop a robust evidence base on graduate outcomes. Graduate destinations data reflects higher education’s contribution to the economy through the provision of graduate labour from undergraduate and postgraduate programmes, and gathering and communicating graduate destinations data is particularly relevant in the current economic climate in Ireland. The HEA has a stated commitment to developing a strong evidence base for performance in higher education12:
The HEA strives to produce high-quality, consistent, relevant and timely statistical information on higher education to underpin the development of policy and services to meet the needs of the learner, education providers and other users.
Under the System Performance Framework, a high level indicator for the system in relation to higher education’s contribution to meeting Ireland’s capital needs is that higher education institutions and the HEA report on trends in graduate employment rates. The government’s Action Plan for Jobs requires that the HEA provides reliable and up-to-date information on the employability and skills of Ireland’s most recent graduates. A goal of the National Access Plan is the collection of data on graduate outcomes for students from the equity of access target groups. Complimentary to these priorities, the HEA/QQI/Solas National Employers Survey provides valuable information on the view of employers of higher education outcomes.
Data on graduate outcomes gives greater evidence for funding and quality agencies in
12 Graduate Surveys – Review of International Practice, HEA October 2015
their engagement with the higher education institutions, and also acts as a transparency and information tool for students choosing their third level course. This is in itself an important efficiency and effectiveness driver for an improved higher education system and with obvious benefits for future students. Robust data on graduate outcomes will also inform higher education institutions on the career development of their graduates, and will enable them to benchmark the quality of their courses against other institutions both nationally and internationally.
In order for the HEA to deliver on these policy priorities, the HEA developed a HEA Data Development and Knowledge Management Strategy for 2014-2017. This strategy aims to minimise the response burden and to maximise the strategic value of the evidence-base underpinning higher education policy and practice. The HEA is currently in the process of revising how graduate outcomes are measured through a new national annual graduate outcomes survey which will provide the following:
Data on graduate qualifications and employment both within Ireland and overseas,
Relevance of employment to area of study,
Data on graduate further study,
Data on graduate unemployment and unavailability for work,
The Expert Group on the Future Funding of Higher Education warns that these developments will place pressures on Irish HEIs11;
“The contribution of higher education to Ireland’s economic and social development can no longerbe assumed and is, in fact, severely threatened.
11 Expert Group on Future Funding for Higher Education “Investing in National Ambition: A Strategy for Funding Higher Education”, March 2016
Core funding per student in Ireland fell by 22 per cent in the seven year period to 2015. Because of funding reductions, the increased enrolment in recent years has been funded from internal efficiencies and by other cost-cutting measures that, by and large, have been exhausted.”
Developing the Evidence Base1.4

Chapter 1: Policy Context6
Career progression of graduates through longitudinal data.
The HEA anticipates that the new annual survey, which measures graduate outcomes 9 months after graduation will be in place by 2018 and run on a pilot basis in 2017 in a number of higher education institutions. This new survey will be of use to policy makers, students, guidance counsellors and teachers.
However, this new annual survey is a single point-in-time survey and does not capture the longer-term outcomes from higher education to graduates. The move towards large-scale graduate studies (as conducted in the UK, Germany, Canada, USA, New Zealand and Australia) indicates the importance of revisiting the same graduates over time. Methodologically,longitudinal data addresses problems with cross-sectional data analysis
by facilitating the analysis of cause and effect between different parameters.
A primary advantage to the use of administrative data sources (such as revenue and social welfare records) over surveys is that the reporting burden that is placed on graduates, higher education institutions, employers or other state bodies
13 UK Department for Education, “Higher Education Longitudinal Education Outcomes Experimental Statistics: Government informal consultation response”, December 2016
is reduced, if not eliminated. Conducting a statistical survey can place large demands in terms of cost, time and other resources. Contacting graduates after graduation can be increasingly difficult for higher education institutions as time goes on. Respondents may also react negatively if they feel they have already provided similar information (e.g. revenue) to earlier surveys. Administrative data also allows consideration of the entire population, rather than a sample.
There are some disadvantages to the use of administrative data and certain limitations with this approach are highlighted in the relevant sections of this report. In other jurisdictions13, concerns have been expressed about misinterpretation of information and the creation of rankings of higher education institutions based on employability or earnings statistics. Administrative data is also unable to capture more qualitative information on the wider benefits of higher education.
This report will add to the evidence base on higher education outcomes along with the forthcoming national survey data on graduate outcomes.Together these analyses will provide a wide range of stakeholders with high-quality data that reaches new standards in terms of coverage and quality.

Chapter 1: Policy Context 7
Chapter 2: Data Context
8 Chapter 2: Data Context
2.1
IntroductionThis chapter sets out the data that is already available nationally on the outcomes of graduates from third level education, in terms of employment and salaries. It compares these outcomes with those of non-third level
graduates, and with the experience in other countries. It also briefly considers longitudinal administrative studies undertaken in other countries in this area.
Current Situation for Irish GraduatesIreland has higher than average rates of third level attainment, and they have increased significantly between 2005 and 201514. In 2015, 52% of Irish 25-34 year olds had completed third level education, compared with the OECD average of 42%. Overall, levels of third level attainment for Irish 25-64 year olds have increased from 29% in 2005 to 43% in 2015 (OECD figures are 27% to 35% respectively)15.
Entry rates (the proportion of people who are expected to enter third level during their lifetime) are also significantly higher in Ireland than across the OECD as a whole (81% vs 59% OECD for a Bachelor’s Degree).
Official Statistics show that graduates from Irish higher education institutions experience relatively high rates of employment. In 2011, a CSO study noted that the unemployment rate for higher education graduates was 7%, and this compared with 18% for those with a post-Leaving Certificate qualification and 14% with a higher secondary education16. Similarly, the employment rate for higher education graduates was 81%, compared with 64% for those with a post-Leaving Certificate
14 OECD, “Education At A Glance 2016”, OECD 201615 It should be noted, however, that figures include migrants who have been educated outside Ireland and this leads to a higher level of educational attainment for Ireland as recent migrants have a higher level of educational attainment than the population as a whole. In Ireland, among 25-44 year old adults with below secondary education, 84% have native-born parents, 4% have one foreign-born parent and 12% have both parents foreign-born. The same figures for upper secondary are 74% with native-born parents, 6% with one foreign-born parent and 20% with both parents foreign-born. For tertiary education, the figures are 70% with native-born parents, 6% with one foreign-born parent and 24% with both parents foreign-born. Therefore, the recent period of migration in Ireland has seen an increase in educational attainment levels in this age category.16 CSO, “Quarterly National Household Survey: Educational Thematic Report 2011”, December 201117 QNHS (Post Census of Population 2011) - Supplementary Table S8
qualification and 65% for those with higher secondary education only. Based on 2016 Q4 CSO Quarterly National Household Survey data, the unemployment rate for those with higher education was 3.7%17. The figure was 9.2% for those with an upper secondary education and 12.7% for those with a lower secondary education. As with the OECD as a whole, Irish graduates have lower unemployment and higher employment rates than those without a third level qualification; and employment rates for graduates are in line with OECD averages.
The recent HEA report “What Do Graduates Do? The Class of 2015” gives an insight into the first destinations of university graduates in Ireland, nine months after graduation. For this group, 62% of Honours Degree graduates are in employment, and the proportion in further studies or training is 31%. The proportion seeking employment is 4%. A total of 78% of Higher and Postgraduate Diploma graduates are in employment and 80% of Master’s and Doctorate graduates are in employment. These findings are compared with those of the present study in Chapter 8 - Comparing Administrative Data with Survey Data.
2.2

9Chapter 2: Data Context
Graduates of third level are significantly less likely to be unemployed than those with lower levels of educational attainment. The CSO’s Quarterly National Household Survey (QNHS) provides data on the unemployment rates of the population by educational attainment level19. These rates are shown for the years 2011-2016 in Figure 2.1. This shows that those with higher levels of educational attainment experience significantly lower levels of employment; for the Q4 2016 data, the rate of
19 The Quarterly National Household Survey (QNHS) is a large-scale, nationwide survey of households in Ireland. It is designed to produce quarterly labour force estimates that include the official measure of employment and unemployment in the state (ILO basis). The survey began in September 1997, replacing the annual April Labour Force Survey (LFS). The QNHS also conducts special modules on different social topics each quarter.20 2015 is the most recent year for which Irish data is comparable to international data.
unemployment was 3.3% for those with a thirdlevel degree, compared to 8.5% for those with higher secondary education only.
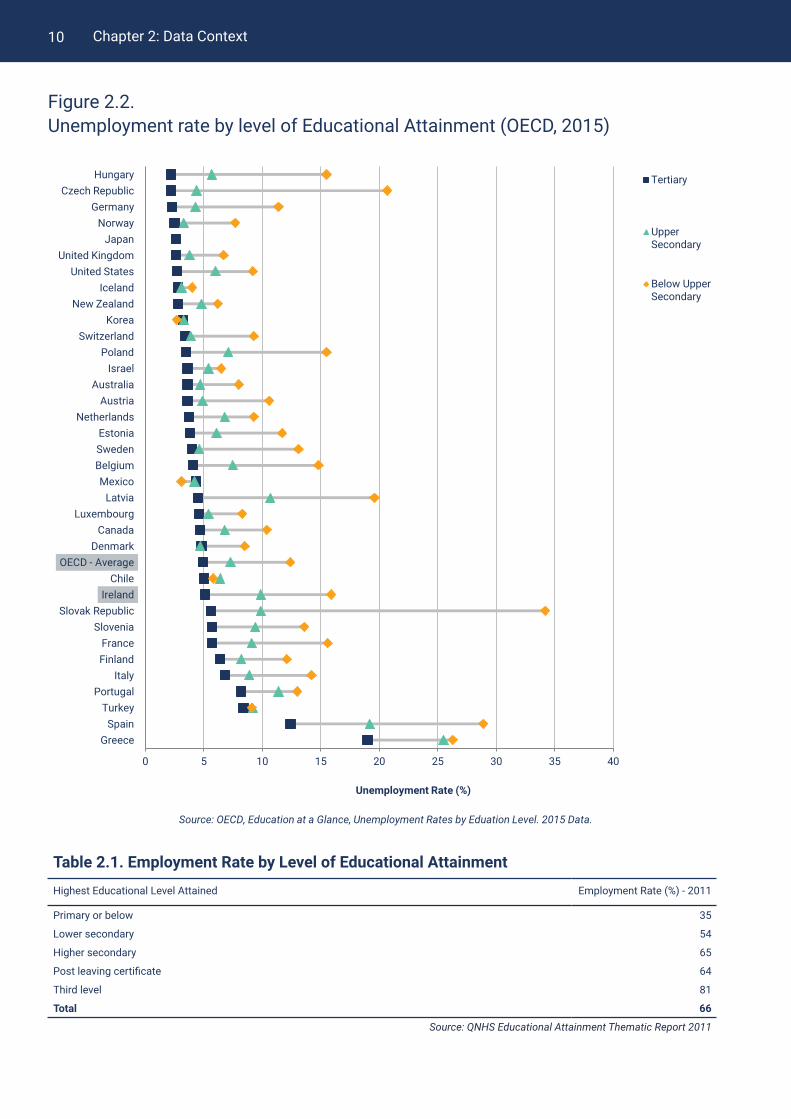
Internationally, the results are similar - labour market outcomes are better among the higher-educated: according to 2015 figures the average unemployment rate across OECD countries is 12.4% for adults with below upper secondary education, while it is 4.9% for those with a third level qualification, as shown in Figure 2.220.
A working paper by the ESRI indicates that there is a level of ‘labour market mismatch’ for graduates when they immediately leave college, with 23% mismatched to their first jobs across the range of European countries studied18. First job mismatch was lowest for graduates of health and welfare programmes, followed by education; and highest for graduates of humanities and arts, followed by services and business and social science. Movement between employers and/or industries may provide insight of job mismatch.
18 ESRI, Working Paper, “Is there a role for higher education institutions in improving the quality of first employment?” August 2016.
A graduate may also change jobs in order to move to more senior positions. This form of job churn is a common career path in some industries and is an important part of a functioning labour market. Graduate Job Churn is examined in the present report (see Section 5.4) in terms of the number of different employers and industries in which graduates were employed over a period of five years. Since descriptions of the type or seniority of occupations are not available, however, it is difficult to distinguish between cases of job mismatch and movement up a career ladder by changing jobs.
Rates of Unemployment and Employment
2.3
Figure 2.1.Unemployment Rate by Level of Educational Attainment (QNHS)
0%
5%
10%
15%
20%
25%
30%
2011 2012 2013 2014 2015 2016
Unemployment Rate
Primary orbelow
Lowersecondary
Highersecondary
Postsecondarynon-tertiary
Third levelnon-honoursdegree
Third levelhonoursdegree oraboveSource: QNHS - Main Results Table QNQ35/45 Data refers to Q4 for each year
10 Chapter 2: Data Context
Figure 2.2. Unemployment rate by level of Educational Attainment (OECD, 2015)
Table 2.1. Employment Rate by Level of Educational Attainment
Highest Educational Level Attained Employment Rate (%) - 2011
Primary or below 35
Lower secondary 54
Higher secondary 65
Post leaving certificate 64
Third level 81
Total 66
Source: QNHS Educational Attainment Thematic Report 2011
HungaryCzech Republic
GermanyNorway
JapanUnited Kingdom
United StatesIceland
New ZealandKorea
SwitzerlandPoland
IsraelAustralia
AustriaNetherlands
EstoniaSwedenBelgiumMexico
LatviaLuxembourg
CanadaDenmark
OECD - AverageChile
IrelandSlovak Republic
SloveniaFranceFinland
ItalyPortugal
TurkeySpain
Greece
0 5 10 15 20 25 30 35 40
Unemployment Rate (%)
Tertiary
UpperSecondary
Below UpperSecondary
Source: OECD, Education at a Glance, Unemployment Rates by Eduation Level. 2015 Data.

11Chapter 2: Data Context
Figure 2.3. Employment rates of tertiary educated adults by level of tertiary education (OECD, 2015)
Not only are graduates of third level significantly less likely to be unemployed than those with lower levels of educational attainment, but they are also more likely to be in significant employment. The CSO’s QNHS Education Thematic Report on Educational Attainment carried out in 2011 gives more detail on the employment rates of the population with different educational attainment levels, noting that employment rates increase with educational attainment, as shown in Table 2.1.
Looking internationally, employment rates for those aged 25-64 with third level education are similar to the OECD average. As shown in Figure 2.3, employment rates increase with educational attainment and continue to increase with further levels of third level education. On average across OECD countries, the employment rate is 80% for adults with a short-cycle third level qualification, rising to 82% for those with a Bachelor’s Degree, 87% with a Master’s Degree, and 91% with a Doctoral Degree.
OECD - Average
Ireland
50 60 70 80 90 100
IcelandSwedenNorway
SwitzerlandNetherlands
GermanyPoland
New ZealandLatviaIsrael
AustriaDenmark
LuxembourgCzech Republic
BelgiumSloveniaPortugalHungary
FranceEstonia
United KingdomChile
EU 22Australia
JapanFinland
CanadaUnited States
Slovak RepublicSpain
MexicoItaly
KoreaTurkeyGreece
Employment Rate (%)
Tertiaryeducation
Short-cycletertiaryeducation
Bachelor’s or equivalent education
Master’s or equivalent education
Doctoral orequivalenteducation
Source: OECD, Education at a Glance, Educational Attainment and Labour Force Status. 2015 Data

12
Educational attainment also has a significant effect on earnings. As a baseline, median weekly earnings over the period 2011-2014 can be obtained from the CSO’s earnings analysis (see Table 2.2).
The earnings advantage for third level education
22 OECD, Educational Earnings by Educational Attainment, 25-64 year-olds (2015 data). This calculation of the graduate earnings premium is net of income tax in Ireland. However, the calculation is made before tax in some other countries. Therefore comparison with the OECD average and other countries should be made with caution.
in Ireland was higher than the OECD average in 2015: on average third level graduates in Ireland earned 66% more than those with just an upper secondary education, compared to a differential of 60% across the OECD22.
Earnings also vary by industry (NACE) sector.
Chapter 2: Data Context
Emigration Rates
Figure 2.4. Number of Emigrants per year (15-24 year-olds only)
Earnings and Income
Employment rates are higher for men than women across the OECD, but the gender gap shrinks as educational attainment increases21. On average across OECD countries, the gender difference in employment rates among 25-64 year-olds is 20 percentage points for those with below upper secondary education, 14 percentage points for those with upper secondary or post-secondary non-third
21 This data is also taken from OECD, Education at a Glance, Educational Attainment and Labour Force Status, 2015.
level education and 9 percentage points for third level-educated adults. The difference in employment rates between third level-educated men and women in Ireland is not as wide as the OECD average, but the smaller difference may be driven by a slightly lower employment rate relative to the average across OECD countries, 87% against 88% for men and 78% against 79% for women.
2.4
2.5
The number of people emigrating from Ireland each year is captured by the “Population and Emigration Estimates”, published annually by the CSO. The number of people aged between 15 and 24
that emigrated in each year between 2011 and 2016 are shown in Figure 2.1. In 2011, approximately 34,500 people in this age group emigrated. By 2016 the number had fallen by 47% to 18,300.
0
5,000
10,000
15,000
20,000
25,000
30,000
35,000
40,000
2011 2012 2013 2014 2015 2016
Number Emigrating
per year
Source: CSO Population and Migration Estimates, Table PEA03

13Chapter 2: Data Context
Table 2.2 shows the median weekly earnings for the various NACE sectors from 2011 to 2014. The sector with the highest median weekly earnings in 2014 was Information & Communication at €868 per week, followed by Public Administration & Defence at €817 and Financial & Real Estate Activities at €732. The lowest earnings were among employees in Accommodation & Food Service Activities, which had median weekly earnings of €294, followed by Arts, Entertainment & Other Service Activities (named “Other NACE Activities (R,S)” in Table 2.2) at €338 per week and Wholesale & Retail Trade at €388.
Considering the trends in sectoral earnings over this period, we can see that the largest increase in earnings was among employees in Information & Communication, which saw median weekly earnings increase from €788 per week in 2011 to €868 in 2014, a rise of 10%. There was also an increase in earnings of 5% among those in Administrative & Support Service Activities, with median weekly earnings increasing from €408 in 2011 to €427 in 2014. The sector of Arts, Entertainment, Recreation & Other Service Activities saw a 4% decrease in weekly earnings, from €353 per week in 2011 to €338 per week in 2014. Earnings
23 This is the difference between average gross hourly earnings of male paid employees and of female paid employees as a percentage of average gross hourly earnings of male paid employees. Source: Eurostat - Gender pay gap in unadjusted form, code: tsdsc340.24 OECD, Education and earnings: Differences in earnings between female and male workers, by educational attainment, 25-64 year-olds, full-time earners (2015 data).
in Education saw a decrease of 3%, from €725 per week in 2011 to €701 per week in 2014.
Gender imbalances are reflected in the labour market and earnings both in Ireland and internationally. The CSO’s earnings analysis (2014) found that on average, women’s median weekly earnings were 80% of men’s (see Table 2.3).
Data on hourly earnings reduces the effects of different working patterns of men and women. Eurostat figures show that unadjusted gross hourly earnings for Irish women were between 12.2% and 14% less than that for men during the years 2010-201423. This compares to a difference of 16.5-17.3% for EU27 countries.
In terms of those with a third level education, the gender gap in annual earnings in Ireland for full-time third-level educated women is slightly greater than the OECD average: in Ireland, female graduate earnings are equal to 70% of male graduate earnings, while the average figure for the OECD is 73%24. The gap is most pronounced for women aged 55-64 who earn 63% of male earnings (77% OECD).
Table 2.2. Weekly Earnings by NACE Sector (2011-2014)
Median Weekly Earnings (€)
NACE Rev. 2 Economic Sector 2011 2012 2013 2014
Industry (B-E) 634 627 632 644
Construction (F) 544 533 549 555
Wholesale & Retail Trade (G) 381 379 379 388
Transportation & Storage (H) 580 565 568 568
Accommodation & Food Service Activities (I) 296 290 291 294
Information & Communication (J) 788 827 844 868
Finance & Real Estate (K,L) 740 735 742 732
Professional, Scientific, Technical Activities (M) 576 572 577 593
Administrative & Support Service Activities (N) 408 412 417 427
Public Administration & Defence (O) 806 810 824 817
Education (P) 725 716 716 701
Health & Social Work (Q) 597 608 607 606
Other NACE Activities (R,S) 353 339 338 338
All NACE Economic Sectors 523 519 523 529
Source: CSO – Earning Analysis using Administrative Data Sources – Table NSA85

14 Chapter 2: Data Context
It is valuable to compare the findings in this report with work undertaken in other countries in relation to the administrative longitudinal studies of graduates25. However, only a small number of countries use administrative data to evaluate the career development of graduates. The Eurograduate Feasibility study investigated the practice of studying graduates post-graduation and found that in most countries outcomes for graduates are identified using surveys rather than the linking of administrative data26.
However, the UK has carried out a number of longitudinal studies of graduates including the Institute for Fiscal Studies report on the earnings of English domiciled graduates27. The report found that:
25 The EUA TRACKIT report found that most longitudinal studies of graduate outcomes relied on surveys, further stating “This reflects the fact that administrative data on graduates may be difficult to obtain. This is especially true in an increasingly international higher education landscape, in which mobility of students and graduates has increased. Nevertheless, an additional graduate tracking instrument based on administrativedata exists in seven countries, namely the Czech Republic, Estonia, Hungary, Italy, the Netherlands, Sweden and the UK. Such instruments are based on the possibility of connecting student information from higher education institutions with other data sets, such as the national social security database.” Source: EUA, TRACKIT, 2012.26 www.eurograduate.eu27 UK Institute for Fiscal Studies, “How English domiciled graduate earnings vary with gender, institution attended, subject and socio-economic background”, April 2016
Graduates are much more likely to be in employment than non-graduates; There is an earnings gap between male and female graduates;
Graduates from wealthier family backgrounds earn more after graduation than those from poorer backgrounds, even when they have completed the same degree from the same university;
There are significant differences in earnings depending on the subject studied, with those studying medicine and economics earning far more than those studying other degree subjects, even taking school results into account;
Table 2.3. Median Weekly Earnings for Males and Females by NACE Sector (2014)Median Weekly Earnings (€)
NACE Rev. 2 Economic Sector Both Sexes Male FemaleFemale as % of Male
Industry (B-E) 644 674 579 86
Construction (F) 555 575 376 65
Wholesale & Retail Trade (G) 388 467 332 71
Transportation & Storage (H) 568 591 510 86
Accommodation & Food Service Activities (I) 294 332 260 78
Information & Communication (J) 868 962 712 74
Finance & Real Estate (K,L) 732 865 661 76
Professional, Scientific, Technical Activities (M) 593 691 527 76
Administrative & Support Service Activities (N) 427 458 373 81
Public Administration & Defence (O) 817 891 720 81
Education (P) 701 760 688 91
Health & Social Work (Q) 606 732 578 79
Other NACE Activities (R,S) 338 398 303 76
All NACE Economic Sectors 529 585 469 80
Source: CSO – Earning Analysis using Administrative Data Sources – Table NSA85
International Studies using Administrative Data
2.6

15Chapter 2: Data Context
There is considerable variation in graduate earnings depending on the university attended.
Another dataset has been created by the UK Department for Education (the Longitudinal Education Outcomes dataset), using the National Pupil Database, data on further and higher education students, employment data and work and pensions data. The 2016 report (considering 2004 graduates one, three, five and 10 years after graduation) found that sustained employment28 increases over time for graduates and graduate median earnings also increase over time29. The study also found that overall employment and further study outcomes after graduation vary little by subject studied, but earnings after five years vary by subject studied. Further, the study found that five years after graduation, female graduates were slightly more likely than males to be in sustained employment or further study.
28 The report by the UK Department for Education used the term “sustained employment” to describe the activity of graduates that met certain employment criteria. Since the nature of the administrative data which is available for outcomes analysis varies from one country to another, the criteria for employment activity in the present report is different to that in the UK analysis. This report uses the term “substantial employment”, and the criteria for this categorisation are outlined in Appendix A.3.4. 29 UK Department for Education, “Higher Education Longitudinal Education Outcomes Experimental Statistics: Government informal consultation response”, August 201630 www.bestcourse4me.com/media/98090/bestcourse4me-institution-analysis.pdf 31 www.educationcounts.govt.nz/publications/tertiary_education/education-outcomes
In another analysis, the UK student information website bestCourse4me linked data sets from the UK’s Higher Education Statistics Agency and the Office for National Statistics Labour Force survey and found that graduates earned 82% more than non-graduates at the peak of their earnings30. The report also found that graduates from more prestigious universities earn more than UK graduates in general. However, this report notes that there are significant regional disparities in income between London/the Southeast, and the rest of the UK.
In New Zealand, The Ministry of Education carried out an analysis of graduate outcomes by linking graduate and income data and found that employment rates increase with the level of qualification studied and that destinations differ depending on the field of study31. The report also found that there are earnings premiums associated with different areas of study.
Context Summary2.7
Both national and international studies show that graduates are more likely to be employed, less likely to be unemployed, and more likely to earn more than those with lower levels of educational qualification. In the chapters that follow, this report will consider individuals that graduated from Irish higher education institutions from
2010 to 2014 and their outcomes after one, three and five years in terms of employment and workforce participation levels, earnings, sector of employment and job churn. The influence of gender, level of qualification attained, degree class, field of study and type of higher education institution on graduate outcomes will also be analysed.

Chapter 1: Policy Context16
Chapter 3: Graduate Statistics

Chapter 1: Policy Context 17
One in four of all graduates studied Business, Administration & Law, the most popular field of study, while 15% took Arts & Humanities and 14% studied Health & Welfare.
The number graduating from Engineering, Manufacturing & Construction fell by more than a quarter between 2010 and 2014, with most of this reduction in Architecture & Construction.
Women represented almost 80% of Health & Welfare graduates and 72% of Education graduates.
Approximately 80% of graduates from Information & Communication Technologies and Engineering, Manufacturing & Construction were male.
Within Health & Welfare, the most common field of study for females was Nursing & Midwifery while for males it was Medicine.
More than one in eight graduates are non-Irish.
Key Findings
Non-Irish graduates made up 22.5% of ICT graduates, but only 1.6% of Education graduates.
More than half of all graduates were female.
Universities were the main source of graduations in Ireland accounting for three out of every five graduates.
Introduction3.1
This chapter contains statistics on the graduates whose outcomes are explored in later chapters. The numbers of graduates for years 2010 to 2014 are shown, along with variables such as sex, nationality, institute type, young/mature, NFQ level, degree class, field of study and region.
In later chapters, graduates without a valid PPSN are excluded, since these cannot be matched to outcome data. However they are included in this chapter in order to give a more accurate representation of the trends in Higher Education in Ireland. Rates of missing PPSN for a range of
different parameters are given in Appendix A.2.1.Mature graduates are included in Table 3.1 and Figure 3.1, but are then excluded from the rest of this chapter and the remainder of this report, with the exception of Chapter 8, where they are included to provide an accurate comparison of administrative and survey data. The reasons for this exclusion are given in Section 3.3 below.
Throughout this report, numbers of graduates are always rounded to the nearest ten. This is an added precaution against the disclosure of data for specific individuals.

18 Chapter 3: Graduate Statistics
The HEA Graduate data is the primary source of data and contains a record for each individual graduation. Details include the name of the course, the NFQ (National Framework Qualification) level, the degree class, and the field of study (broad, narrow and detailed fields as classified using the ISCED framework). Details on the graduates themselves include age, sex, nationality and the county in which they lived at the time of enrolment. In line with its data protocols, CSO replaces the official PPSN on analysis based datasets with a protected identifier key (PIK) which is based on PPSN. It is this PIK that is used to link person-based data. Further to this, identifiable information from each of these data sources is removed, such as name, date of birth and addresses. The resulting data is then said to be pseudonymised and this is what is used for all Analysis.
The HEA also provided an enrolment dataset with information on individuals for each year while they study a particular course. The contents of this enrolment dataset are similar to the one for graduates.
Not all graduates from the HEA graduation dataset are included in the analysis.
Overseas graduates are excluded because they complete a course at a campus which is associated with an Irish institution but is located in a different country.
The broad field of General/Generic courses (ISCED field 0) is excluded, as these are primarily aimed at helping individuals return to education (the majority of these are mature students).
Other course types including FETAC Certificates, Professional Training Qualifications and occasional courses are excluded.
32 Monitoring Ireland’s Skills Supply, Trends in Education and Training Outputs. Report by the Skills and Labour Market Research Unit (SLMRU) in SOLAS for the Expert Group on Future Skills Needs, 2015
Courses which were undertaken as part of initiatives to upskill people are excluded. One such initiative was the Springboard programme, which was introduced in 2011 as part of the Government’s Jobs Initiative and was subsequently incorporated into the 2012 Action Plan for Jobs and the Pathways to Work strategy. The primary objective of Springboard was to support unemployed people return to employment by providing access to free, part-time upskilling and re-skilling courses in higher education in areas where skills shortages have been identified. The courses were provided through higher education institutions and the awards ranged from level 6 to level 9. The HEA graduation dataset for 2014 includes approximately 1,300 graduations from Springboard courses and a further 100 graduations from other upskill programmes. However, many upskilling courses are taken at institutions which are not covered by the HEA. For further details see Appendix A.2.8.
Non-HEA institutions are by definition not covered in the HEA graduate dataset. A report for the Expert Group on Future Skills Needs estimated that in 2014 there were approximately 5,000 higher education awards made to learners outside the HEA-aided sector32. There are a growing number of private and independent colleges in Ireland. Some of the larger institutions include Griffith College, King’s Inns, National College of Ireland, Dublin Business School, Galway Business School, Independent College Dublin, Hibernia College, and a number of others in areas such as business, computing, music and psychothereapy/counselling.
Graduation Dataset3.2

19Chapter 3: Graduate Statistics
The total numbers of graduations captured in the HEA data source for each year, as well as numbers for young and mature graduations, are given in Table 3.133. Definitions for the thresholds for young and mature are given in Appendix A.2.5.
33 A small number of individuals graduate from more than one course in a single year. Common cases where multiple graduations arise include courses that are shared between multiple institutions or a teaching diploma being awarded in combination with an Honours Degree. For details on how a single course is chosen for individuals with multiple graduations see Appendix A.2.6.
The number of graduations increased from 56,070 in 2010 to 63,000 in 2014. Mature graduates made up 41.9% of the total in 2014, a slight increase from the 2010 proportion of 38.2%.
Numbers of Graduates
Table 3.1. Numbers of graduations by year2010 2011 2012 2013 2014
Courses Completed 56,070 57,700 58,310 61,730 62,990
Age
Young 34,660 34,540 35,090 36,220 36,630
% 61.8 59.9 60.2 58.7 58.1
Mature 21,410 23,160 23,220 25,510 26,370% 38.2 40.1 39.8 41.3 41.9
3.3
Figure 3.1. Numbers of (a) Young, and (b) Mature Graduates by Award Type by Year
(a)
The numbers of graduations in each year for young and mature graduates are broken down by award type in Figure 3.1. This graph shows there is considerable volatility in the figures for mature graduates, particularly among Certificates, which increased by almost 60% between 2010 and 2014.
The remainder of this report will focus on young graduates. This is because of the changing profile of mature graduates over the timeframe under investigation and the fact that their outcomes are substantially influenced by their employment and educational experience prior to taking on the course.
0
5,000
10,000
15,000
20,000
25,000
2010 2011 2012 2013 2014
Number of Young
Graduates
Graduation Year
Certificate Ordinary Degree Higher Degree
Postgraduate Qualification Masters PhD

20 Chapter 3: Graduate Statistics
(b)
Table 3.2. Numbers of Young Graduates
2010 2011 2012 2013 2014
Unique Young Graduates 34,460 34,360 35,000 36,070 36,470
Missing PPSN -3,940 -3,480 -3,330 -4,210 -4,860
Total for Outcomes Analysis 30,520 30,870 31,670 31,860 31,610
Numbers of Graduates by Analysis Parameters3.3.1
Since a valid PPSN is required for linking to the administrative datasets, those graduations which do not have an associated PPSN must be excluded, and this figure for each year is given in the second row in Table 3.2. The remainder, i.e. the numbers used for outcomes analysis, are given in the last row in Table 3.2. A detailed examination of prevalence of missing
PPSN across several variables is given in Appendix A.2.1.
For the remainder of this report, therefore, the term “graduates” refers to young graduates only, unless stated otherwise.
Table 3.3 provides a breakdown of graduates by sex, institute type, NFQ level, nationality and degree class. More than half (55.8%) of all graduates in 2010 were female, but this proportion declined slightly to 53.9% by 2014.
Universities are the main source of graduations in Ireland. In 2014, 59% of all graduations were from Universities while Institutes of Technology supplied 36% and Colleges accounted for the remaining 6%.
The numbers of graduates from Colleges and Institutes of Technology have not varied substantially between 2010 and 2014, while the number from Universities grew by about 10%.
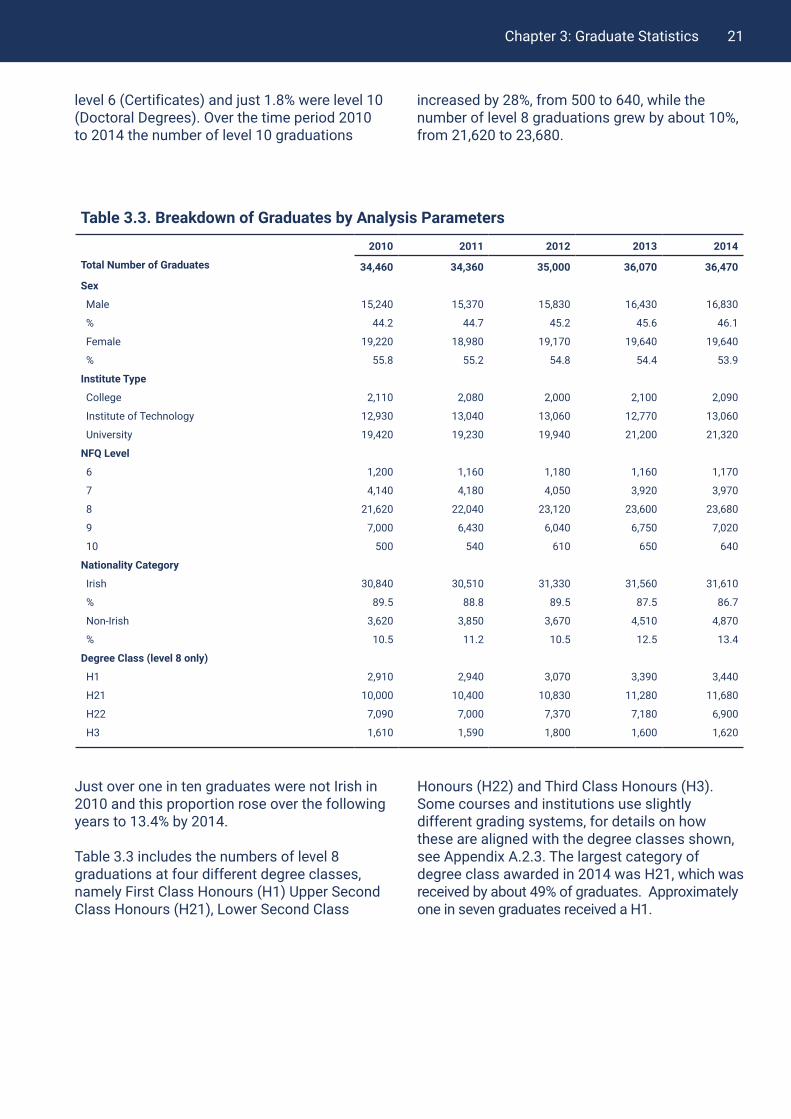
In 2014 close to two-thirds (64.9%) of all graduations were level 8 (Honours Degrees) while 19.2% were level 9 (Master’s Degrees and Postgraduate Qualifications). Level 7 (Ordinary Degrees) accounted for 10.9% while 3.2% were
0
1,000
2,000
3,000
4,000
5,000
6,000
7,000
8,000
2010 2011 2012 2013 2014
Number of Mature
Graduates
Graduation Year
Certificate Ordinary Degree Higher Degree
Postgraduate Qualification Masters PhD
21Chapter 3: Graduate Statistics
Table 3.3. Breakdown of Graduates by Analysis Parameters
2010 2011 2012 2013 2014
Total Number of Graduates 34,460 34,360 35,000 36,070 36,470
Sex
Male 15,240 15,370 15,830 16,430 16,830
% 44.2 44.7 45.2 45.6 46.1
Female 19,220 18,980 19,170 19,640 19,640
% 55.8 55.2 54.8 54.4 53.9
Institute Type
College 2,110 2,080 2,000 2,100 2,090
Institute of Technology 12,930 13,040 13,060 12,770 13,060
University 19,420 19,230 19,940 21,200 21,320
NFQ Level
6 1,200 1,160 1,180 1,160 1,170
7 4,140 4,180 4,050 3,920 3,970
8 21,620 22,040 23,120 23,600 23,680
9 7,000 6,430 6,040 6,750 7,020
10 500 540 610 650 640
Nationality Category
Irish 30,840 30,510 31,330 31,560 31,610
% 89.5 88.8 89.5 87.5 86.7
Non-Irish 3,620 3,850 3,670 4,510 4,870
% 10.5 11.2 10.5 12.5 13.4
Degree Class (level 8 only)
H1 2,910 2,940 3,070 3,390 3,440
H21 10,000 10,400 10,830 11,280 11,680
H22 7,090 7,000 7,370 7,180 6,900
H3 1,610 1,590 1,800 1,600 1,620
level 6 (Certificates) and just 1.8% were level 10 (Doctoral Degrees). Over the time period 2010 to 2014 the number of level 10 graduations
increased by 28%, from 500 to 640, while the number of level 8 graduations grew by about 10%, from 21,620 to 23,680.
Just over one in ten graduates were not Irish in 2010 and this proportion rose over the following years to 13.4% by 2014.
Table 3.3 includes the numbers of level 8 graduations at four different degree classes, namely First Class Honours (H1) Upper Second Class Honours (H21), Lower Second Class
Honours (H22) and Third Class Honours (H3). Some courses and institutions use slightly different grading systems, for details on how these are aligned with the degree classes shown, see Appendix A.2.3. The largest category of degree class awarded in 2014 was H21, which was received by about 49% of graduates. Approximately one in seven graduates received a H1.
22 Chapter 3: Graduate Statistics
Irish/Non-Irish Proportions by NFQ Level
Figure 3.2. Proportions of Irish and Non-Irish Graduates by NFQ Level (2014 Graduates)
3.3.3
Non-Irish Graduates by Year3.3.2
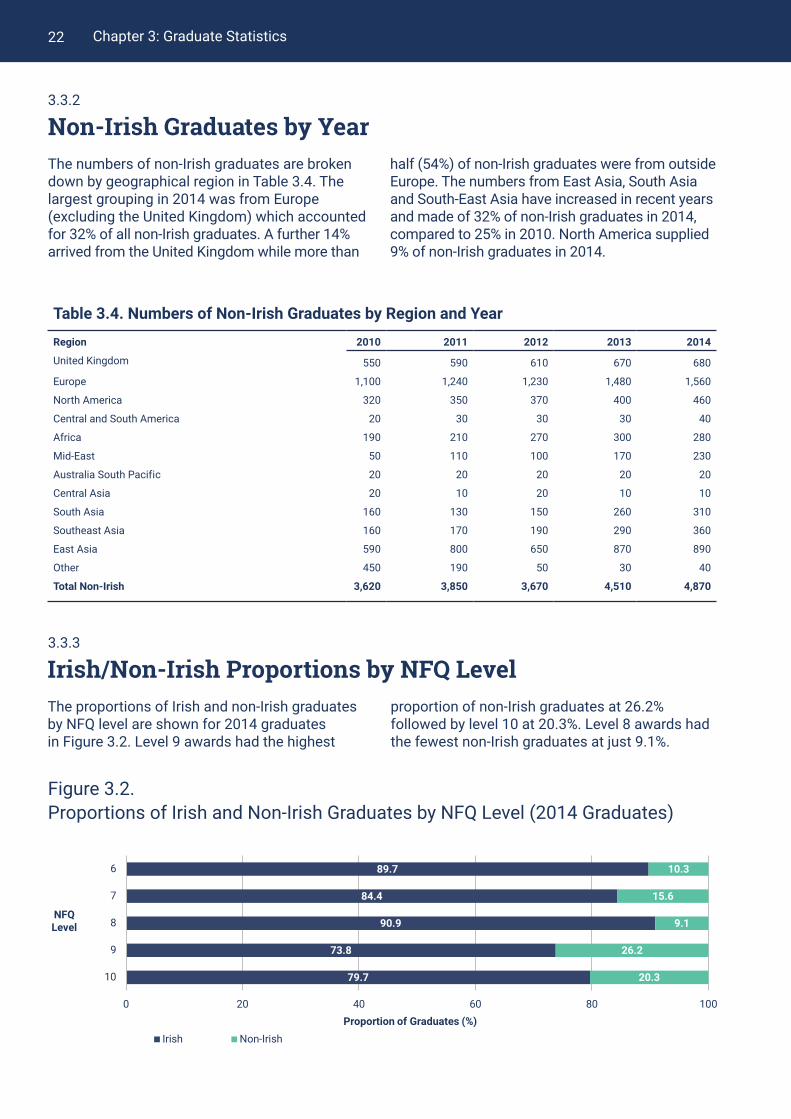
Table 3.4. Numbers of Non-Irish Graduates by Region and Year
Region 2010 2011 2012 2013 2014
United Kingdom 550 590 610 670 680
Europe 1,100 1,240 1,230 1,480 1,560
North America 320 350 370 400 460
Central and South America 20 30 30 30 40
Africa 190 210 270 300 280
Mid-East 50 110 100 170 230
Australia South Pacific 20 20 20 20 20
Central Asia 20 10 20 10 10
South Asia 160 130 150 260 310
Southeast Asia 160 170 190 290 360
East Asia 590 800 650 870 890
Other 450 190 50 30 40
Total Non-Irish 3,620 3,850 3,670 4,510 4,870
The numbers of non-Irish graduates are broken down by geographical region in Table 3.4. The largest grouping in 2014 was from Europe (excluding the United Kingdom) which accounted for 32% of all non-Irish graduates. A further 14% arrived from the United Kingdom while more than
half (54%) of non-Irish graduates were from outside Europe. The numbers from East Asia, South Asia and South-East Asia have increased in recent years and made of 32% of non-Irish graduates in 2014, compared to 25% in 2010. North America supplied 9% of non-Irish graduates in 2014.
The proportions of Irish and non-Irish graduates by NFQ level are shown for 2014 graduates in Figure 3.2. Level 9 awards had the highest
proportion of non-Irish graduates at 26.2% followed by level 10 at 20.3%. Level 8 awards had the fewest non-Irish graduates at just 9.1%.
89.7
84.4
90.9
73.8
79.7
10.3
15.6
9.1
26.2
20.3
0 20 40 60 80 100
6
7
8
9
10
Proportion of Graduates (%)
NFQLevel
Irish Non-Irish

23Chapter 3: Graduate Statistics
Fields of Study of Graduates
Figure 3.3. Proportion of Graduates by Field of Study by Year
3.4.
3.4.1
Number of Graduates by Field of Study by YearThe number of graduates by field of study are shown in Figure 3.3 for years 2010 to 2014. The most popular field of study is Business, Administration & Law which accounted for just under a quarter (24.2%) of all graduations in 2014. About 15% of all graduates in 2014 were from Arts & Humanities while Health & Welfare accounted for 14%.
The number of graduations in Natural Sciences, Mathematics & Statistics increased by 31% between 2010 and 2014 while there was a decrease of more than a quarter in the number
of Engineering, Manufacturing & Construction graduates, falling from 4,640 to 3,430.
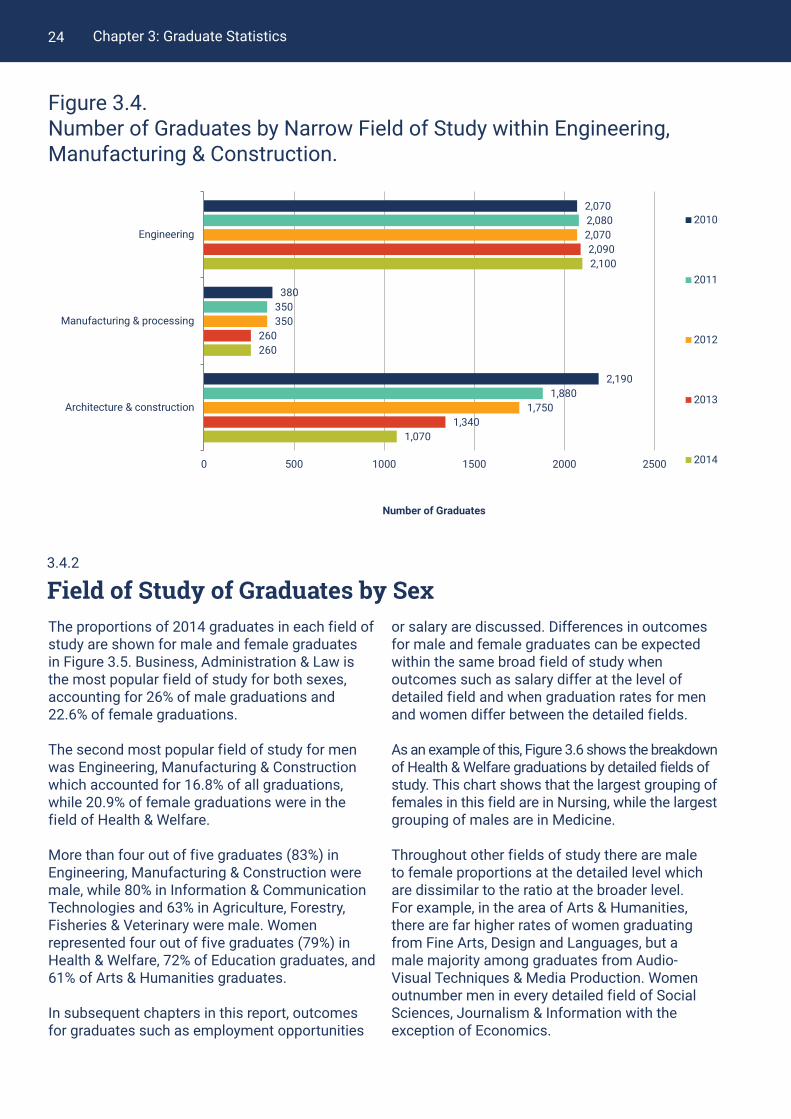
To further examine the decline in graduates from Engineering, Manufacturing & Construction, the numbers for each of the narrow fields within this broad field are illustrated in Figure 3.4. This chart shows how the number of Architecture & Construction graduates fell by more than 50% between 2010 and 2014, from 2,190 to 1,070. Manufacturing & Processing graduates declined by just over 30% over the same period while the number of Engineering graduates was relatively stable.
2,400
5,340
2,400
9,060
2,900
1,500
4,640
460
4,420
1,340
2,310
5,640
2,360
8,710
2,920
1,660
4,300
560
4,320
1,580
2,190
5,790
2,570
8,990
3,130
1,320
4,180
670
4,600
1,580
2,410
5,860
2,720
8,840
3,550
1,580
3,690
710
5,090
1,620
2,570
5,610
2,760
8,810
3,790
1,780
3,430
730
5,220
1,780
0 1,000 2,000 3,000 4,000 5,000 6,000 7,000 8,000 9,000 10,000
Education
Arts & Humanities
Social Sciences, Journalism & Information
Business, Administration & Law
Natural Sciences, Mathematics & Statistics
Information & Communication Technologies
Engineering, Manufacturing & Construction
Agriculture, Forestry, Fisheries & Veterinary
Health & Welfare
Services
Number of Graduates
2010
2011
2012
2013
2014
24 Chapter 3: Graduate Statistics
Figure 3.4. Number of Graduates by Narrow Field of Study within Engineering, Manufacturing & Construction.
Field of Study of Graduates by Sex3.4.2
The proportions of 2014 graduates in each field of study are shown for male and female graduates in Figure 3.5. Business, Administration & Law is the most popular field of study for both sexes, accounting for 26% of male graduations and 22.6% of female graduations.
The second most popular field of study for men was Engineering, Manufacturing & Construction which accounted for 16.8% of all graduations, while 20.9% of female graduations were in the field of Health & Welfare.
More than four out of five graduates (83%) in Engineering, Manufacturing & Construction were male, while 80% in Information & Communication Technologies and 63% in Agriculture, Forestry, Fisheries & Veterinary were male. Women represented four out of five graduates (79%) in Health & Welfare, 72% of Education graduates, and 61% of Arts & Humanities graduates.
In subsequent chapters in this report, outcomes for graduates such as employment opportunities
or salary are discussed. Differences in outcomes for male and female graduates can be expected within the same broad field of study when outcomes such as salary differ at the level of detailed field and when graduation rates for men and women differ between the detailed fields.
As an example of this, Figure 3.6 shows the breakdown of Health & Welfare graduations by detailed fields of study. This chart shows that the largest grouping of females in this field are in Nursing, while the largest grouping of males are in Medicine.
Throughout other fields of study there are male to female proportions at the detailed level which are dissimilar to the ratio at the broader level. For example, in the area of Arts & Humanities, there are far higher rates of women graduating from Fine Arts, Design and Languages, but a male majority among graduates from Audio-Visual Techniques & Media Production. Women outnumber men in every detailed field of Social Sciences, Journalism & Information with the exception of Economics.
2,070
380
2,190
2,080
350
1,880
2,070
350
1,750
2,090
260
1,340
2,100
260
1,070
0 500 1000 1500 2000 2500
Engineering
Manufacturing & processing
Architecture & construction
Number of Graduates
2010
2011
2012
2013
2014

25Chapter 3: Graduate Statistics
Figure 3.5. Proportion of Graduates by Sex by Field of Study (2014 Graduates)
4.2
13.0
6.5
26.0
10.6
8.5
16.8
2.7
6.6
4.9
9.5
17.4
8.5
22.6
10.2
1.8
3.0
1.4
20.9
4.8
0 5 10 15 20 25 30
Education
Arts & Humanities
Social Sciences, Journalism & Information
Business, Administration & Law
Natural Sciences, Mathematics & Statistics
Information & Communication Technologies
Engineering, Manufacturing & Construction
Agriculture, Forestry, Fisheries & Veterinary
Health & Welfare
Services
Proportion of Graduates (%)
Male
Female
Figure 3.6. Numbers of graduates by detailed field of study by Sex, within Health and Welfare (2014 Graduates)
20
360
90
80
150
100
90
90
130
80
480
1,080
130
460
230
740
590
320
0 200 400 600 800 1,000 1,200
Dental Studies
Medicine
Nursing & Midwifery
Medical Diagnostic & Treatment Technology
Therapy & Rehabilitation
Pharmacy
Child care & youth services
Social work & counselling
Other, Combined
Number of Graduates
Male
Female
26 Chapter 3: Graduate Statistics
Fields of Study by Geographical Region3.4.3
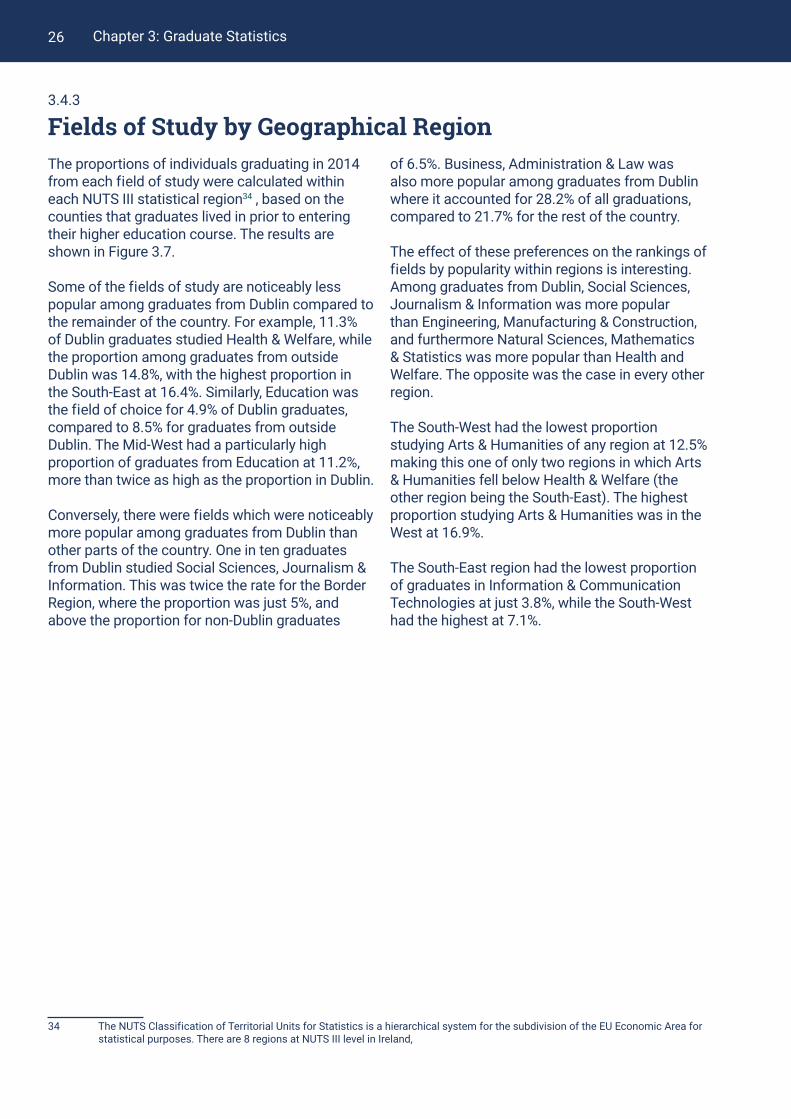
The proportions of individuals graduating in 2014 from each field of study were calculated within each NUTS III statistical region34 , based on the counties that graduates lived in prior to entering their higher education course. The results are shown in Figure 3.7.
Some of the fields of study are noticeably less popular among graduates from Dublin compared to the remainder of the country. For example, 11.3% of Dublin graduates studied Health & Welfare, while the proportion among graduates from outside Dublin was 14.8%, with the highest proportion in the South-East at 16.4%. Similarly, Education was the field of choice for 4.9% of Dublin graduates, compared to 8.5% for graduates from outside Dublin. The Mid-West had a particularly high proportion of graduates from Education at 11.2%, more than twice as high as the proportion in Dublin.
Conversely, there were fields which were noticeably more popular among graduates from Dublin than other parts of the country. One in ten graduates from Dublin studied Social Sciences, Journalism & Information. This was twice the rate for the Border Region, where the proportion was just 5%, and above the proportion for non-Dublin graduates
34 The NUTS Classification of Territorial Units for Statistics is a hierarchical system for the subdivision of the EU Economic Area for statistical purposes. There are 8 regions at NUTS III level in Ireland,
of 6.5%. Business, Administration & Law was also more popular among graduates from Dublin where it accounted for 28.2% of all graduations, compared to 21.7% for the rest of the country.
The effect of these preferences on the rankings of fields by popularity within regions is interesting. Among graduates from Dublin, Social Sciences, Journalism & Information was more popular than Engineering, Manufacturing & Construction, and furthermore Natural Sciences, Mathematics & Statistics was more popular than Health and Welfare. The opposite was the case in every other region.
The South-West had the lowest proportion studying Arts & Humanities of any region at 12.5% making this one of only two regions in which Arts & Humanities fell below Health & Welfare (the other region being the South-East). The highest proportion studying Arts & Humanities was in the West at 16.9%.
The South-East region had the lowest proportion of graduates in Information & Communication Technologies at just 3.8%, while the South-West had the highest at 7.1%.
27Chapter 3: Graduate Statistics
Figure 3.7. Proportion of graduates by Field of Study and Geographic Region (2014 Graduates)
BorderWest
MidlandDublin
Mid-EastMid-West
South-EastSouth-West
28.2
21.7
22.1
23.8
20.9
20.9
22.1
21.7
20.0
16.0
15.5
16.0
16.4
16.0
16.5
15.4
12.5
16.9
11.3
14.8
13.9
12.2
15.0
13.8
16.4
15.9
15.7
11.4
10.5
11.2
12.2
8.9
10.0
9.6
10.6
10.4
8.9
9.7
10.0
9.7
10.1
10.4
8.5
9.0
10.7
4.9
8.5
7.8
6.7
9.8
11.2
8.7
8.1
8.5
10.3
6.5
5.0
7.7
5.4
5.8
6.6
7.7
6.2
3.9
5.5
6.5
5.3
5.9
4.5
5.9
5.6
5.0
4.1
4.9
4.3
4.0
4.0
4.9
3.8
7.1
4.6
1.0
2.5
3.2
2.1
4.1
2.0
3.2
1.9
1.9
Dublin
Outside Dublin
Border
Mid-East
Midland
Mid-West
South-East
South-West
West
Most Popular Least Popular
Business, Administration & Law
Arts & Humanities
Health & Welfare
Natural Sciences, Mathematics & Statistics
Engineering, Manufacturing & Construction
Education
Social Sciences, Journalism & Information
Services
Information & Communication Technologies
Agriculture, Forestry, Fisheries & Veterinary

28 Chapter 3: Graduate Statistics
Fields of Study by Institute Type3.4.4
The proportions of 2014 graduates from each field of study are shown for each of the three institute types in Table 3.5. More than a third (35.9%) of University graduates studied Education, Arts & Humanities, or Social Sciences, Journalism & Information compared to just 12.6% in Institutes of Technology (IOTs). Natural Sciences, Mathematics & Statistics graduates account for 13% of University graduates, almost double the proportion of 7% in IOTs.
Business, Administration & Law accounted for 29% of IOT graduates compared to 24% for
graduates of Universities while in IOTs 15% had studied Engineering, Manufacturing & Construction compared with 7% from Universities. More than one in eight (13%) of IOT graduates were from the field of Services compared to less than 1% in Universities.
The composition of graduates from Colleges by field of study is noticeably different to the other institute types. More than half of graduates have studied Education (54%) and almost all of the remainder is comprised of graduates in Arts & Humanities (24%) and Health & Welfare (22%).
Table 3.5. Graduates by Institute Type and Field of Study (2014 Graduates)
Institute Type (%)
Field of Study Universities Institutes of Technology Colleges
Education 6 1 54
Arts & Humanities 18 10 24
Social Sciences, Journalism & Information 12 2 -
Business, Administration & Law 24 29 -
Natural Sciences, Mathematics & Statistics 13 7 -
Information & Communication Technologies 5 6 -
Engineering, Manufacturing & Construction 7 15 -
Agriculture, Forestry, Fisheries & Veterinary 2 3 -
Health & Welfare 14 14 22
Services - 13 -
Total (%) 100 100 100
Total Number 21,320 13,060 2,090
NFQ Proportions by Field of Study3.4.5
Table 3.6 shows the number of graduates by NFQ level for each field of study for the graduation year of 2014. Of the 36,470 graduates, close to two-thirds (65%) of the awards were at level 8 while 19% were at level 9 and 11% at level 7. The main field of study was Business, Administration & Law which was taken by one in four graduates followed by Arts & Humanities at 15% and Health & Welfare at 14%.
More than half of all graduates were at level 8 in each field of study, with the exception of Services, where 42% graduated at level 7 and 43%
at level 8. The field of Services made up just 5% of all graduations overall, but it accounted for 20% at level 6 and 19% at level 7. Engineering, Manufacturing & Construction represented 9% of all awards but 19% of level 7 qualifications.
Within both Education and Social Sciences, Journalism & Information, more than 98% of awards were at level 8 or above. Level 10 awards were dominated by the Field of Natural Sciences, Mathematics & Statistics which accounted for 44% of all graduations at this level.

29Chapter 3: Graduate Statistics
Table 3.6. Breakdown by NFQ Level for each Field of Study (2014 Graduates)
NFQ 6 NFQ 7 NFQ 8 NFQ 9 NFQ 10 All NFQ
Field of Study No. % No. % No. % No. % No. % No. %
Education - - - - 1,930 8 630 9 - - 2,570 7
Arts & Humanities 40 3 290 7 4,390 19 850 12 50 8 5,610 15
Social Sciences, Journalism & Information
- - 50 1 1,830 8 830 12 50 8 2,760 8
Business, Administration & Law 320 27 870 22 5,190 22 2,410 34 20 3 8,810 24
Natural Sciences, Mathematics & Statistics
30 3 290 7 2,710 11 480 7 280 44 3,790 10
Information & Communication Technologies
30 3 270 7 900 4 570 8 20 3 1,780 5
Engineering, Manufacturing & Construction
110 9 740 19 1,900 8 580 8 100 16 3,430 9
Agriculture, Forestry, Fisheries & Veterinary
50 4 260 7 390 2 20 0 20 3 730 2
Health & Welfare 360 31 470 12 3,680 16 600 9 100 16 5,220 14
Services 230 20 740 19 770 3 50 1 - - 1,780 5
All Fields of Study 1,170 100 3,970 100 23,680 100 7,020 100 640 100 36,470 100
Proportion of graduates that are non-Irish by field of study3.4.6
The proportions of 2014 graduates that are non-Irish are shown for each of the various fields of study in Figure 3.8. More than one in eight of all graduates are non-Irish. The highest proportion of non-Irish graduates was in the field of Information & Communication Technologies where 22.5%
were not Irish, with the second highest proportion of 18% in Business, Administration & Law. Education had the lowest proportion of non-Irish graduates at only 1.6% and the next lowest proportion was in Agriculture, Forestry, Fisheries & Veterinary at 2.7%.
Figure 3.8. Proportions of Non-Irish Graduates in each field of study (2014 Graduates)
13.4
1.6
10.5
13.4
18.8
12.4
22.5
15.2
2.7
11.7
10.7
0% 5% 10% 15% 20% 25%
All
Education
Arts & Humanities
Social Sciences, Journalism & Information
Business, Administration & Law
Natural Sciences, Mathematics & Statistics
Information & Communication Technologies
Engineering, Manufacturing & Construction
Agriculture, Forestry, Fisheries & Veterinary
Health & Welfare
Services
Proportion of Graduates that are Non-Irish

Chapter 1: Policy Context30
Chapter 4: What do Graduates do?
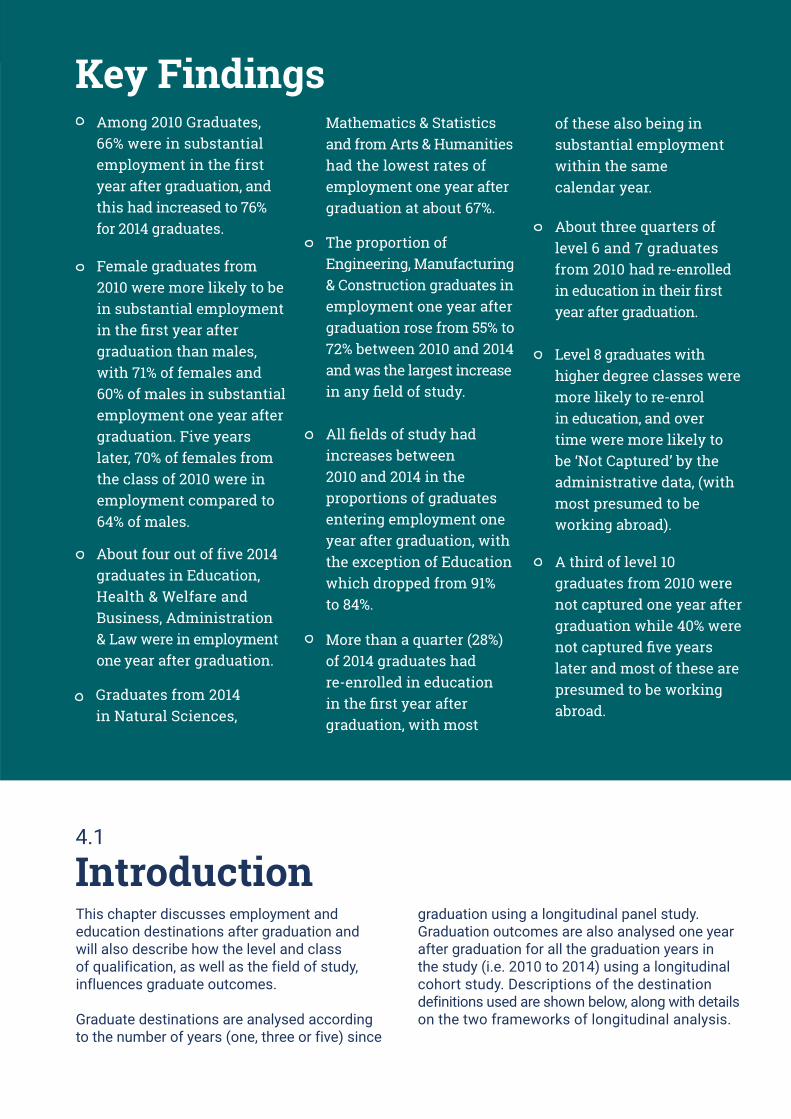
Chapter 1: Policy Context 31
Key FindingsAmong 2010 Graduates, 66% were in substantial employment in the first year after graduation, and this had increased to 76% for 2014 graduates.
Female graduates from 2010 were more likely to be in substantial employment in the first year after graduation than males, with 71% of females and 60% of males in substantial employment one year after graduation. Five years later, 70% of females from the class of 2010 were in employment compared to 64% of males.
About four out of five 2014 graduates in Education, Health & Welfare and Business, Administration & Law were in employment one year after graduation.
All fields of study had increases between 2010 and 2014 in the proportions of graduates entering employment one year after graduation, with the exception of Education which dropped from 91% to 84%.
More than a quarter (28%) of 2014 graduates had re-enrolled in education in the first year after graduation, with most
About three quarters of level 6 and 7 graduates from 2010 had re-enrolled in education in their first year after graduation.
A third of level 10 graduates from 2010 were not captured one year after graduation while 40% were not captured five years later and most of these are presumed to be working abroad.
Level 8 graduates with higher degree classes were more likely to re-enrol in education, and over time were more likely to be ‘Not Captured’ by the administrative data, (with most presumed to be working abroad).
Graduates from 2014 in Natural Sciences,
The proportion of Engineering, Manufacturing & Construction graduates in employment one year after graduation rose from 55% to 72% between 2010 and 2014 and was the largest increase in any field of study.
Introduction4.1
This chapter discusses employment and education destinations after graduation and will also describe how the level and class of qualification, as well as the field of study, influences graduate outcomes.
Graduate destinations are analysed according to the number of years (one, three or five) since
graduation using a longitudinal panel study. Graduation outcomes are also analysed one year after graduation for all the graduation years in the study (i.e. 2010 to 2014) using a longitudinal cohort study. Descriptions of the destination definitions used are shown below, along with details on the two frameworks of longitudinal analysis.
Mathematics & Statistics and from Arts & Humanities had the lowest rates of employment one year after graduation at about 67%.
of these also being in substantial employment within the same calendar year.

Outcome Year
Graduation Year
2011 2012 2013 2014 2015
2010 After 1 year After 3 Years After 5 Years
2011 After 1 Year After 3 Years
2012 After 1 Year After 3 Years
2013 After 1 Year
2014 After 1 Year
Panel Longitudinal Study Cohort Longitudinal Study
32 Chapter 4: What do Graduates do?
Destination Outcomes
Analysis Framework
Substantial Employment only: Graduates are considered in substantial employment if they have worked for at least 12 weeks in the year in question earning at least €100 a week on average from their main employer or have significant self-employment. To be in ‘Substantial Employment only’ the graduate has no record of enrolment in education in the year in question.
Substantial Employment and Education: The graduate must meet the conditions of substantial employment but also have a record of enrolment in a HEA institute in the year in question.
Education only: The graduate must have a record of enrolment in a HEA institute in the year in question but not meet the definition of substantial employment.
Neither Employment nor Education: The graduate does not meet the definition of substantial employment nor do they have a record of enrolment in a HEA institute but they do have a record of some employment or benefits in the year in question.
Not Captured: The Graduate has no record of either employment, benefits, or enrolment in education in the year in question.
Graduate outcomes are analysed in two types of longitudinal framework:
Cohort:Outcomes for graduates are analysed for the first year after graduation and compared by graduation year. This report concentrated on the graduation years of 2010, 2012 and 2014 and their outcomes in 2011, 2013 and 2015 respectively.
Panel:The outcomes for the set of graduates from 2010 are analysed for the first, third and fifth year after graduation, i.e., their outcomes in 2011, 2013 and 2015.
Further details on ‘neither employment nor education’ and ‘not captured’ are given in Appendix A.3.5.Further details on substantial employment and re-enrolment are given in Appendix A.3.4 and A.2.7

33Chapter 4: What do Graduates do?
Figure 4.1. Guide to representation of proportions of Graduates in each outcome category
Destination Outcomes of All Graduates
4.2
A sample diagram which is used throughout this chapter to illustrate the proportions of graduates in each destination outcome is given in Figure 4.1. The total proportion in substantial employment is represented by a blue colour ((a) in Figure 4.1), and the total proportion that are re-enrolled in education are represented by a light green colour ((b) in Figure 4.1). The proportion of graduates that are both in substantial employment and re-enrolled in education within the same calendar year is indicated by a hatched pattern of blue and light green ((c) in Figure 4.1). Graduates that are only substantially employed or only re-enrolled in education are represented by solid blocks of blue and light green respectively ((d) and (e) in Figure
4.1). Further details on substantial employment and enrolment are given in Appendix A.3.4 and A.2.6.
The graduates that are in neither employment nor education (but appear elsewhere in the administrative data) are represented by a orange colour ((f) in Figure 4.1), while graduates that are not captured in any way by the administrative data for that year are represented by a grey colour ((g) in Figure 4.1). Most of those who are not captured are assumed to have emigrated, but there is no definitive way the administrative data can be used to determine if an individual has emigrated. Further details on these categories are given in Appendix A.3.5.
The rates of engagement in employment and/or education for 2010 graduates are shown in Figure 4.2. In the first year following graduation 66% of graduates were in employment and 32% were in education. The overlap between these categories (i.e. the proportion in both employment and education) is 21%. Therefore the combined proportion in employment or education is 78%. The share in neither employment nor education is 9% while 14% were not captured by any administrative
data. Over the following four years the proportion in education fell sharply from 32% in year one to just 10% in year five while the share in employment rose only marginally from 66% to 67%. The proportion of graduates that are not captured increased from 14% in the first year after graduation to 26% after five years. The share of graduates that are neither in employment nor education fell by more than half over the course of the five years, from 9% in year one to 4% five years after graduation.
0% 20% 40% 60% 80% 100%
(d) Substantial Employment only
(c) Substantial Employment and Education
(e) Education only (g) Not Captured
(a) Substantial Employment
(b) Education(f) Neither Employment nor Education (but
are in Administrative Data)
Guide to Outcome Categories

34
45
55
60
21
10
8
11
5
2
9
6
4
14
24
26
0 20 40 60 80 100
1
3
5
Proportion of Graduates (%)
Years sinceGraduation
Substantial Employment only Employment and Education Education Only
Neither Employment nor Education Not Captured
Chapter 4: What do Graduates do?
Figure 4.2. Destination Outcomes of 2010 Graduates by Years since Graduation
Figure 4.3. Net Movements of 2010 Graduates between Destination Outcomes
-760 -350-870
-1,870
200
-330-360
1,8701,080540 360
870
4,000
-540
330
350
-4000-1080
-200
760
Substantial Employment Only
Employment and Education
Education Only Neither Employment nor Education
Not Captured
-6,000
-4,000
-2,000
0
2,000
4,000
6,000
↑Net number of
movements into Destination
Net number of movements out of
Destination↓
Substantial Employment Only Employment and Education Education Only
Neither Employment nor Education Not Captured

35Chapter 4: What do Graduates do?
Figure 4.4. Destination Outcomes of Graduates in first year following Graduation by Graduation Year
The net movements between each pair of outcome categories for the 2010 graduates in their first five years after graduation (2011-2015) are illustrated in Figure 4.3.
The increase in the proportion of employed persons is primarily due to the movement of graduates out of ‘education’. There were 4,000 movements into ‘substantial employment only’ from ‘employment and education’ and a further 1,080 from ‘education only’.
This graph also shows that the increase over time in the ‘not captured’ category is mainly due to 1,870 moving away from ‘neither employment nor education’. The second largest addition to the group that are ‘not captured’ are the 870
graduates who were previously in ‘education only’.
The outcomes for graduates in the first year following graduation are examined for years 2010 to 2014 in Figure 4.4. Over three quarters (76%) of 2014 graduates were in ‘substantial employment’ one year after graduation, an increase of 10 percentage points on the rate of 66% in 2010. More than a quarter (28%) of 2014 graduates were in ‘education’ one year after graduation, with most of these graduates also in employment, and this was a drop on the proportion for 2010 graduates of 32%. The proportion in ‘neither employment nor education’ saw a substantial decrease from 9% in 2010 to 5% in 2014 while the share of graduates that were ‘not captured’ fell from 14% to 11%.
45
48
50
51
55
21
20
20
20
21
11
11
10
9
7
9
7
7
7
5
14
14
13
13
11
34,460
34,360
35,000
36,070
36,470
0 20 40 60 80 100
2010
2011
2012
2013
2014
Number ofGraduates
GraduationYear
Substantial Employment only Employment and Education Education Only
Neither Employment nor Education Not Captured
Proportion of Graduates (%)

36 Chapter 4: What do Graduates do?
Destination Outcomes by Sex
Figure 4.5. Destination Outcomes of 2010 Graduates by Sex and by years since Graduation
4.3
Female graduates are more likely to enter ‘substantial employment’ including ‘employment and education’ (see Figure 4.5). In the first year after graduation, 71% of female graduates were in ‘substantial employment’ compared to 60% of males, a difference of 11 percentage points. After five years this gap narrowed to just 6 percentage points, with 70% of female graduates and 64% of male graduates in ‘substantial employment’.
Men are more likely than women to be re-enrolled in education, with 36% of men and 29% of women
enrolled in the first year. This proportion reduces over time for men and women alike, and after 5 years the proportion in education is 10% for both male and female graduates.
Male graduates were more likely to be ‘not captured’, with 16% of males in this category in the first year after graduation compared to 13% of females. After five years the proportion that was ‘not captured’ increased for both sexes, to 28% for males and 25% for females.
39
50
52
58
57
62
21
21
10
9
7
8
15
9
6
4
3
2
9
8
6
6
4
4
16
13
26
23
28
25
13,380
17,140
13,380
17,140
13,380
17,140
0 20 40 60 80 100
After 1 year, Male
Female
After 3 years, Male
Female
After 5 years, Male
Female
Number ofGraduates
Substantial Employment only Employment and Education Education Only
Neither Employment nor Education Not Captured
Proportion of Graduates (%)

37Chapter 4: What do Graduates do?
Destination outcomes for men and women in the first year after graduation are examined by graduation year in Figure 4.6. The increase in employment for more recent graduates affected males to a greater extent than females. For 2010 graduates, 60% of males and 71% of females went straight into ‘substantial employment’, a difference of 11 percentage points. This gap dropped to just 4 percentage points by 2014, when 74% of males and
35 These numbers do not exactly match the sum of constituent figures in Figure 4.6 due to rounding.
78% of females were in ‘substantial employment’ 35.
In other categories there is a similar pattern where outcomes for males change more over time than for females which results in reduced differences in more recent years. For example, the proportion of males who were ‘not captured’ fell by four percentage points from 16% to 12% compared to a drop of 13% to 11% for females.
Figure 4.6. Destination Outcomes in first year after graduation by Sex and by Graduation Year
Destination Outcomes by Field of Study
4.4
The destinations of 2010 graduates five years after graduation are shown for each field of study in Figure 4.7. The field of study with the highest proportion in employment five years after graduation was Education at 87%. The next highest rate was 72% for graduates in Business, Administration & Law and Agriculture, Forestry, Fisheries & Veterinary.
About 60% of 2010 graduates in Natural Sciences, Mathematics & Statistics and Engineering, Manufacturing & Construction were in employment five years after graduation.
Just over one in three Engineering, Manufacturing & Construction graduates from 2010 was ‘not captured’ five years later, the highest rate for any
39
50
45
54
52
57
21
21
21
19
21
20
15
9
12
8
9
6
9
8
7
7
5
5
16
13
14
12
12
11
13,380
17,140
14,300
17,370
14,690
16,920
0 20 40 60 80 100
2010, Male
Female
2012, Male
Female
2014, Male
Female
Number ofGraduates
Substantial Employment only Employment and Education Education Only
Neither Employment nor Education Not Captured
Proportion of Graduates (%)

38 Chapter 4: What do Graduates do?
Figure 4.7. Destination Outcomes for 2010 Graduates after five years by Field of Study
field of study, while the lowest rate was 11% for Education graduates.
Natural Sciences, Mathematics & Statistics graduates from 2010 had the highest rate of ‘education’ five years later at 17% while the lowest rate was for Business, Administration & Law at just 5%. However, it may be worth noting that a large portion of courses offered by private and other non-HEA institutions are in the areas of business, accountancy, management and law.
Since enrolment in non-HEA institutions is not captured here, the proportion of graduates of Business, Administration & Law that are actually in education may be higher than shown here. The field of Education had the lowest proportion of graduates in ‘neither employment nor education’, at just 2%, followed by Health and Welfare at 3%. The field with the highest such rate was Agriculture, Forestry, Fisheries & Veterinary at 8%.
60
75
54
53
69
50
65
52
67
58
61
8
12
8
8
4
11
5
7
6
11
6
2
3
3
1
6
2
3
3
2
2
4
2
6
4
4
4
4
4
8
3
5
26
11
29
31
23
29
24
35
17
27
27
30,520
2,150
4,850
2,120
7,950
2,660
1,180
4,230
370
3,740
1,270
0 20 40 60 80 100
All
Education
Arts & Humanities
Social Sciences, Journalism & Information
Business, Administration & Law
Natural Sciences, Mathematics & Statistics
Information & Communication Technologies
Engineering, Manufacturing & Construction
Agriculture, Forestry, Fisheries & Veterinary
Health & Welfare
Services
Proportion of Graduates (%) Number ofGraduates
Substantial Employment only Employment and Education Education Only
Neither Employment nor Education Not Captured
39Chapter 4: What do Graduates do?
The destination outcomes in the first year after graduation by field of study for 2010 and 2014 graduates are shown in Figure 4.8. About four out of five 2014 graduates in Education, Health & Welfare and Business, Administration & Law were in ‘substantial employment’ one year after graduating. Graduates from Natural Sciences, Mathematics & Statistics and Arts & Humanities had the lowest rates of ‘substantial employment’ at about 67%.
The proportion of 2014 graduates who were ‘not captured’ one year after graduation was at least 9% with the highest rate of 15% among Engineering, Manufacturing & Construction graduates.
More than 40% of Agriculture, Forestry, Fisheries & Veterinary graduates from 2014 had re-enrolled in ‘education’ one year later. Natural Sciences, Mathematics & Statistics graduates and Arts & Humanities graduates also had high proportions in ‘education’ at about 36%. Graduates from 2014 for all other fields of study had rates of at least 22% in ‘education’ with the sole exception of the Education field with a rate of just 10% 36.
36 Some of the values quoted here do not match the sum of constituent data points as they appear in Figure 4.8 due to rounding.
The proportion of Engineering, Manufacturing & Construction graduates who entered ‘substantial employment’ one year after graduation rose from 55% to 72% between 2010 and 2014, which was the largest increase in any field of study. All other fields of study also had increases in the proportion of graduates entering ‘substantial employment’ between 2010 and 2014 with the exception of Education which dropped from 91% to 84%.
The proportion re-enrolling in education fell in most fields of study between 2010 and 2014, with the largest reductions of about 9 percentage points in the fields of Business, Administration & Law and Information & Communication Technologies.
Most fields saw a reduction in the proportion of graduates in neither employment nor education. The largest reduction was in Engineering, Manufacturing & Construction which fell by more than half, from 10% to just 4% while Social Sciences, Journalism & Information fell by nearly half from 11% to 6%.

40 Chapter 4: What do Graduates do?
Figure 4.8. Destination Outcomes in first year after graduation by Field of Study for 2010 and 2014 Graduates
84
76
35
43
39
52
46
60
36
45
47
64
36
51
32
40
55
62
39
49
7
8
23
25
23
23
25
20
20
22
19
14
19
21
27
29
17
19
30
29
1
1
15
10
10
7
10
6
18
14
12
8
17
9
19
13
5
4
13
7
3
4
11
8
11
6
7
4
9
5
6
3
10
4
8
4
9
7
9
5
5
11
16
14
17
12
11
9
17
14
16
11
18
15
14
14
14
9
9
9
2,150
2,480
4,850
5,000
2,120
2,340
7,950
7,310
2,660
3,390
1,180
1,500
4,230
3,070
370
690
3,740
4,160
1,270
1,680
0 20 40 60 80 100
Education 2010
2014
Arts & Humanities 2010
2014
Social Sciences, Journalism 2010
& Information 2014
Business, 2010
Administration & Law 2014
Natural Sciences, Mathematics 2010
& Statistics 2014
Information & 2010
Communication Technologies 2014
Engineering, Manufacturing 2010
& Construction 2014
Agriculture, Forestry, 2010
Fisheries & Veterinary 2014
Health & Welfare 2010
2014
Services 2010
2014
Number ofGraduates
Substantial Employment only Employment and Education Education Only
Neither Employment nor Education Not Captured
Proportion of Graduates (%)

41Chapter 4: What do Graduates do?
Destination Outcomes by NFQ LevelFigure 4.9. Destination Outcomes of 2010 Graduates by NFQ Level and by Years since Graduation
4.5
17
48
66
16
55
61
47
54
58
63
62
64
52
53
53
43
21
8
49
9
6
18
10
8
9
8
7
6
3
7
31
10
3
23
4
2
10
5
2
5
4
2
4
7
6
5
9
5
9
6
4
9
5
3
10
3
4
14
17
7
24
26
15
25
27
14
22
25
32
40
40
1,200
4,140
21,620
7,000
500
0 20 40 60 80 100
NFQ 6, 1
3
5
NFQ 7, 1
3
5
NFQ 8, 1
3
5
NFQ 9, 1
3
5
NFQ 10, 1
3
5
Number of Graduates
Years sinceGraduation
Substantial Employment only Employment and Education Education Only
Neither Employment nor Education Not Captured
Proportion of Graduates (%)
42 Chapter 4: What do Graduates do?
The destinations of 2010 Graduates are analysed in Figure 4.9 by the NFQ Level of the award. A very large proportion of graduates at levels 6 and 7 were re-enrolled in education in the first year after graduation, with 75% of level 6 and 72% of level 7 graduates continuing their studies at higher level. A number of courses at levels 6 and 7 offer students an optional “add-on year”, usually resulting in another award at a higher NFQ level. Therefore it is possible that many of those level 6 and level 7 graduates that were re-enrolled in education were completing an optional year associated with their initial award. This seems likely given that the proportion in education falls off quite dramatically between one and three years after graduation – for level 7 this proportion drops from 72% at year one to 13% at year three.
As the NFQ level rises, the proportion of graduates that are re-enrolled in education one year after graduation decreases. Among level 8 graduates, 28% were in ‘education’ one year later, compared to 14% of level 9 and just 6% of level 10 graduates. After 5 years, the proportions in education are quite similar across the various NFQ levels and are in the range of 7% to 11%.
One year after graduation, 60% of level 6 and 65% of level 7 and 8 graduates were in employment. Level 9 graduates has the highest employment rates one year later at 71% while level 10 graduates had the lowest rate at 58%. Five years after graduation, level 6 graduates had the highest rates of employment at 74% while level 7 and level 8 were about 67%. The lowest proportion in employment after 5 years was
among level 10 graduates at just 60%.
The proportion of graduates that are ’not captured’ in the first year following graduation increases with increasing NFQ level, from 4% at level 6 to 15% at levels 8 and 9, and finally to 32% for level 10 graduates. A combination of factors may be responsible for the particularly high proportion of level 10 graduates that are not captured, such as the higher proportion of non-Irish graduates in this group, the higher average age of level 10 graduates or the availability of relevant employment for such graduates in Ireland as compared to other countries. On this last point, it may be relevant to note that the breakdown by field of study at level 10 is very different to other levels; as described in Section 3.4.5 Natural Sciences, Mathematics & Statistics account for 44% of level 10 courses, and Engineering Manufacturing & Construction represent a further 17%.
After five years the proportion of graduates that were ’not captured’ had increased across all levels, but the highest proportion was still level 10 with 40% not captured, followed by level 8 with 27%.
NFQ levels 6 and 7 graduates had the lowest proportions in ‘neither employment nor education’ in the first year after graduation at about 5% and there was very little change in this five years after graduation. The proportion of level 8 graduates in ‘neither employment nor education’ was 9% in the first year after graduation, falling to 4% after five years. A similar trend can be observed for level 9 and 10 graduates.

43Chapter 4: What do Graduates do?
Figure 4.10. Destination Outcomes of 2010 Level 8 Graduates by Degree Class and Years since Graduation
Destination Outcomes by Degree Class
4.6
This section analyses the effect of degree class on destination outcomes. As the proportions of
the various degree classes are not uniform across NFQ levels, this section will focus only on level 8 graduates.
38
45
51
58
48
55
55
57
51
58
61
63
20
21
16
7
11
10
9
7
11
8
7
6
16
10
9
4
10
5
3
3
4
2
2
1
7
9
11
12
5
6
7
7
3
4
4
5
18
15
14
19
27
24
25
27
31
27
26
25
2,660
9,220
6,490
1,510
2,660
9,220
6,490
1,510
2,660
9,220
6,490
1,510
0 20 40 60 80 100
After 1 year, H1
H21
H22
H3
After 3 years, H1
H21
H22
H3
After 5 years, H1
H21
H22
H3
Number ofGraduates
Substantial Employment only Employment and Education Education Only
Neither Employment nor Education Not Captured
Proportion of Graduates (%)

44 Chapter 4: What do Graduates do?
Figure 4.10 shows outcomes for level 8 graduates from 2010 by degree class. In the first year following graduation, H1 graduates were slightly less likely to be in employment and more likely to be in education. About two-thirds of graduates with a H21, H22 or H3 were in employment in the first year after graduation but for H1 graduates the proportion was slightly smaller at 59%. About a third of graduates with a H1 were in ‘education’ compared to just 11% of those with a H3. Those with higher classes of degree are also less likely to be in ‘neither employment nor education’, with 7% of H1 graduates in this category compared to 12% of H3 graduates.
One of the main trends over the following four years is a decrease in the proportion in education and this trend is most pronounced among the higher degree classes which had the largest proportions in education one year after
graduation. Among H1 graduates, the proportion in education fell from 36% in year one to 14% by year five while for H3 graduates the decrease was from 11% in year one to 7% in year five.
Another clear trend over the following four years is an increase in the proportion that are ‘not captured’, which rises with the increasing class of degree. The share of H1 graduates who were ‘not captured’ rose from 18% to 31% between year one and year five while for H3 graduates the share rose from 19% to 25%.
There is very little change in the proportion who are in substantial employment over the five year period. One year after graduation, 59% of H1 graduates were in employment and this rose slightly to 62% after five years. Among H3 graduates, 66% were in employment after one year and 69% after five years.

Chapter 1: Policy Context 45
Chapter 5: Where do Graduates work?
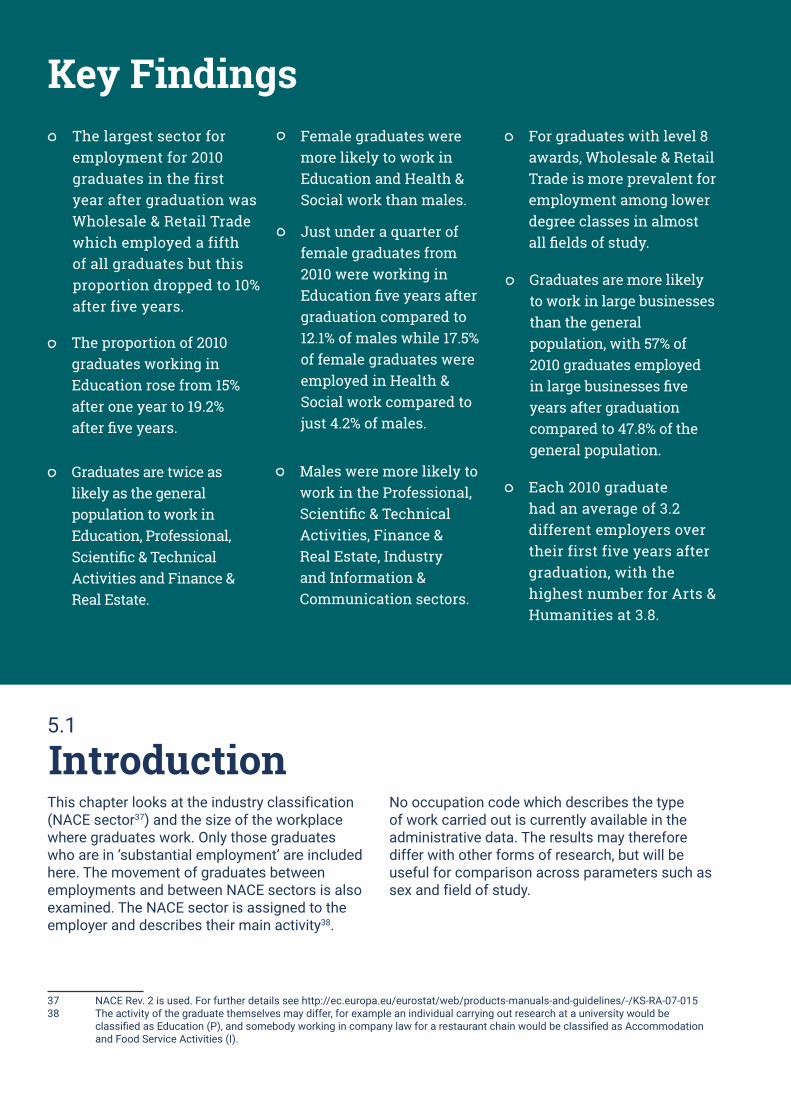
Chapter 1: Policy Context46
The largest sector for employment for 2010 graduates in the first year after graduation was Wholesale & Retail Trade which employed a fifth of all graduates but this proportion dropped to 10% after five years.
Key Findings
Introduction5.1
This chapter looks at the industry classification (NACE sector37) and the size of the workplace where graduates work. Only those graduates who are in ‘substantial employment’ are included here. The movement of graduates between employments and between NACE sectors is also examined. The NACE sector is assigned to the employer and describes their main activity38.
37 NACE Rev. 2 is used. For further details see http://ec.europa.eu/eurostat/web/products-manuals-and-guidelines/-/KS-RA-07-01538 The activity of the graduate themselves may differ, for example an individual carrying out research at a university would be classified as Education (P), and somebody working in company law for a restaurant chain would be classified as Accommodation and Food Service Activities (I).
No occupation code which describes the type of work carried out is currently available in the administrative data. The results may therefore differ with other forms of research, but will be useful for comparison across parameters such as sex and field of study.
The proportion of 2010 graduates working in Education rose from 15% after one year to 19.2% after five years.
Graduates are twice as likely as the general population to work in Education, Professional, Scientific & Technical Activities and Finance & Real Estate.
Just under a quarter of female graduates from 2010 were working in Education five years after graduation compared to 12.1% of males while 17.5% of female graduates were employed in Health & Social work compared to just 4.2% of males.
Males were more likely to work in the Professional, Scientific & Technical Activities, Finance & Real Estate, Industry and Information & Communication sectors.
Female graduates were more likely to work in Education and Health & Social work than males.
For graduates with level 8 awards, Wholesale & Retail Trade is more prevalent for employment among lower degree classes in almost all fields of study.
Graduates are more likely to work in large businesses than the general population, with 57% of 2010 graduates employed in large businesses five years after graduation compared to 47.8% of the general population.
Each 2010 graduate had an average of 3.2 different employers over their first five years after graduation, with the highest number for Arts & Humanities at 3.8.

47Chapter 5: Where do Graduates work?
NACE Sectors 5.2.1
NACE Sectors of All Graduates
5.2
The proportion of substantially employed 2010 graduates working in each NACE sector at one, three and five years after graduation are shown in Figure 5.1. The largest sector in the first year is Wholesale & Retail Trade, with 20.8% of substantially employed graduates working in this sector. The Education sector was the next most popular at 15%, followed by Health & Social Work at 12.1%. Over the following four years the proportion working in Wholesale & Retail Trade fell by more than half, from 20.8% to 10.3%, while the proportion of graduates in Accommodation & Food Service Activities fell by two thirds, from 8.9% to 2.8%.
Sectors which saw increases over the following four years include Education, which rose by 4.2 percentage points to 19.2%, and Information & Communication, which increased by 3.3 percentage points to 7.7%. Finance & Real Estate
39 Note that the figures used are averaged over the values for the five years 2011-2015. The values for the individual sectors varied during this time by as much as 1.2 percentage points, though the majority varied by less than 0.5 percentage points.
grew from 7.7% to 10.2% over the same time period.
Figure 5.1 includes vertical lines which indicate the proportion of the general population working in each NACE sector. The source for this data is the Quarterly National Household Survey, a large-scale, nationwide survey of households in Ireland which produces data on employment and unemployment39.
Five years after graduation, graduates are twice as likely as the general population to work in Education, Professional, Scientific & Technical Activities and Finance & Real Estate. The sectors where graduates are much less likely to work than the general population include Agriculture, Forestry & Fishing, Industry, Construction, and Accommodation & Food Service Activities.
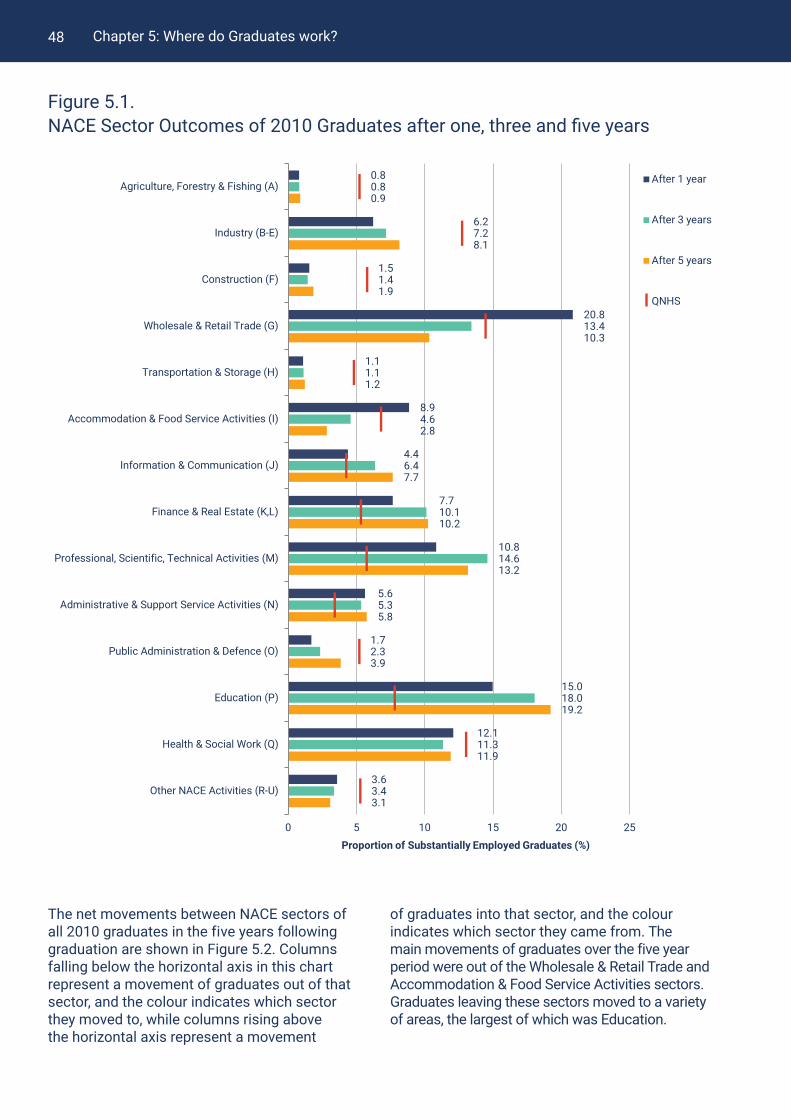
48 Chapter 5: Where do Graduates work?
Figure 5.1. NACE Sector Outcomes of 2010 Graduates after one, three and five years
The net movements between NACE sectors of all 2010 graduates in the five years following graduation are shown in Figure 5.2. Columns falling below the horizontal axis in this chart represent a movement of graduates out of that sector, and the colour indicates which sector they moved to, while columns rising above the horizontal axis represent a movement
of graduates into that sector, and the colour indicates which sector they came from. The main movements of graduates over the five year period were out of the Wholesale & Retail Trade and Accommodation & Food Service Activities sectors. Graduates leaving these sectors moved to a variety of areas, the largest of which was Education.
0.8
7.2
1.4
13.4
1.1
4.6
6.4
10.1
14.6
5.3
2.3
18.0
11.3
3.4
0.8
6.2
1.5
20.8
1.1
8.9
4.4
7.7
10.8
5.6
1.7
15.0
12.1
3.6
0.9
8.1
1.9
10.3
1.2
2.8
7.7
10.2
13.2
5.8
3.9
19.2
11.9
3.1
0 5 10 15 20 25
Agriculture, Forestry & Fishing (A)
Industry (B-E)
Construction (F)
Wholesale & Retail Trade (G)
Transportation & Storage (H)
Accommodation & Food Service Activities (I)
Information & Communication (J)
Finance & Real Estate (K,L)
Professional, Scientific, Technical Activities (M)
Administrative & Support Service Activities (N)
Public Administration & Defence (O)
Education (P)
Health & Social Work (Q)
Other NACE Activities (R-U)
Proportion of Substantially Employed Graduates (%)
After 1 year
After 3 years
After 5 years
QNHS
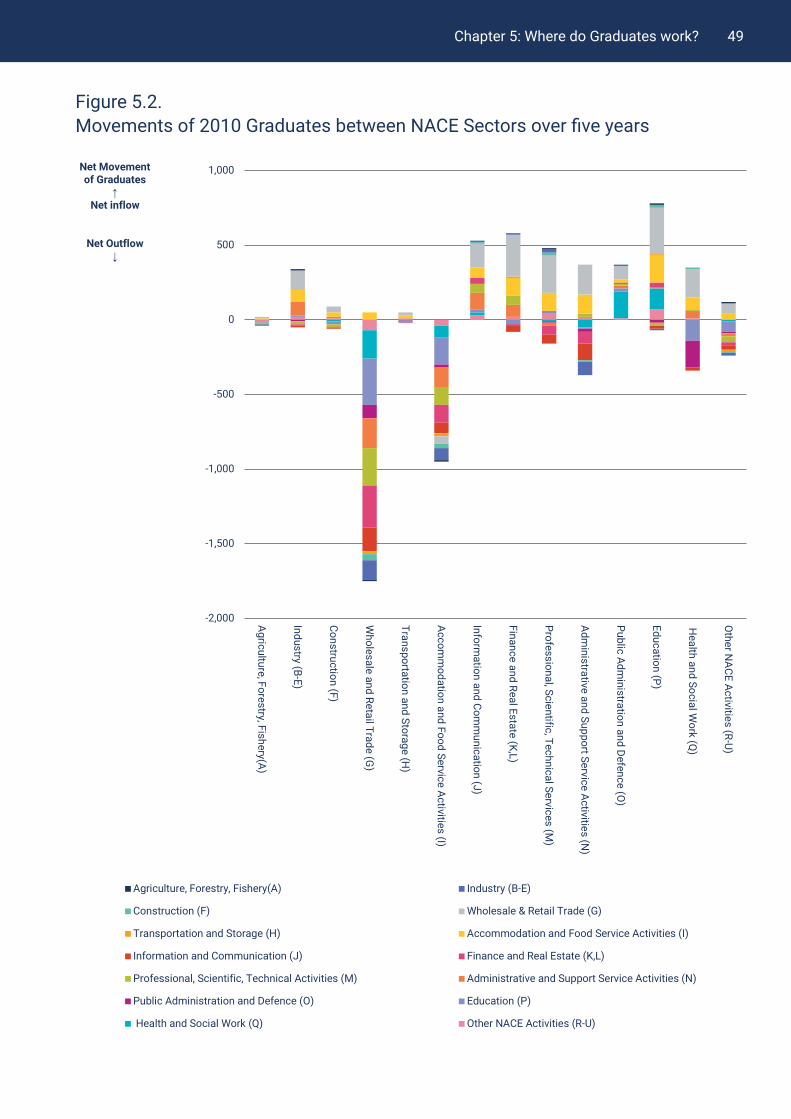
49Chapter 5: Where do Graduates work?
Figure 5.2. Movements of 2010 Graduates between NACE Sectors over five years
-2,000
-1,500
-1,000
-500
0
500
1,000
Agriculture, Forestry, Fishery(A)
Industry (B-E)
Construction (F)
Wholesale and Retail Trade (G
)
Transportation and Storage (H)
Accomm
odation and Food Service Activities (I)
Information and Com
munication (J)
Finance and Real Estate (K,L)
Professional, Scientific, Technical Services (M)
Administrative and Support Service Activities (N
)
Public Administration and Defence (O
)
Education (P)
Health and Social W
ork (Q)
Other N
ACE Activities (R-U)
Net Movement of Graduates
↑Net inflow
Net Outflow↓
Agriculture, Forestry, Fishery(A) Industry (B-E)
Construction (F) Wholesale & Retail Trade (G)
Transportation and Storage (H) Accommodation and Food Service Activities (I)
Information and Communication (J) Finance and Real Estate (K,L)
Professional, Scientific, Technical Activities (M) Administrative and Support Service Activities (N)
Public Administration and Defence (O) Education (P)
Health and Social Work (Q) Other NACE Activities (R-U)
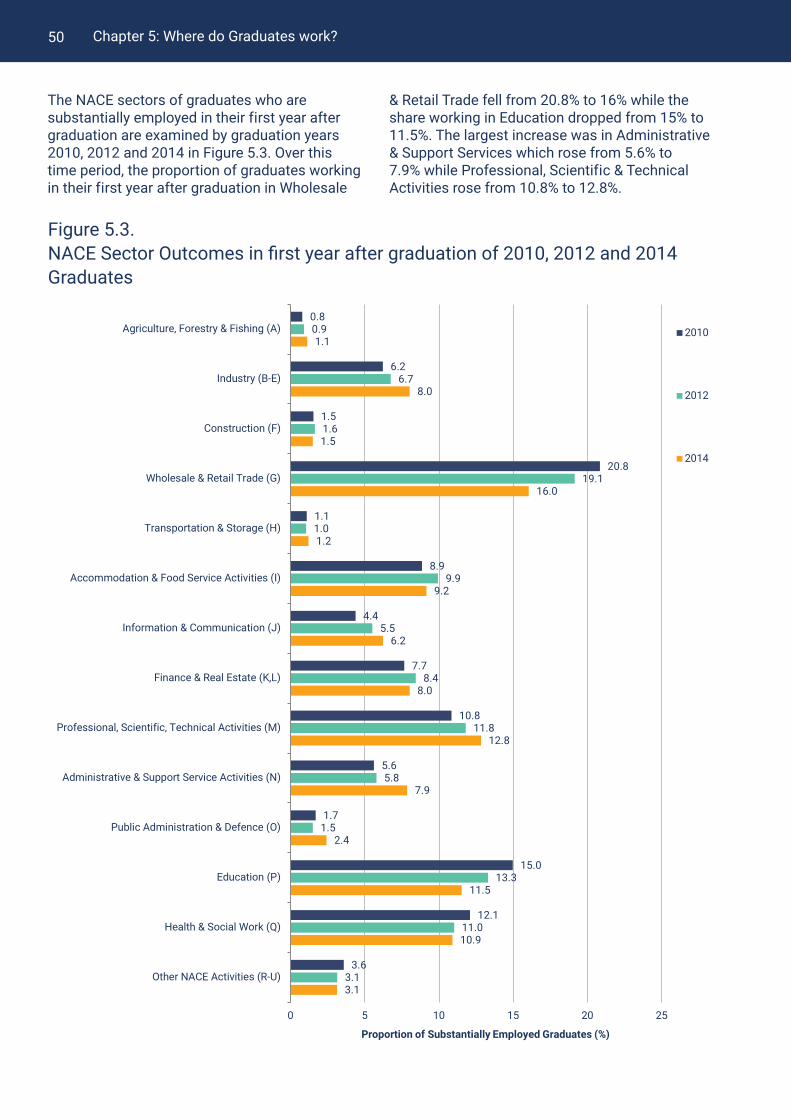
50 Chapter 5: Where do Graduates work?
Figure 5.3. NACE Sector Outcomes in first year after graduation of 2010, 2012 and 2014 Graduates
The NACE sectors of graduates who are substantially employed in their first year after graduation are examined by graduation years 2010, 2012 and 2014 in Figure 5.3. Over this time period, the proportion of graduates working in their first year after graduation in Wholesale
& Retail Trade fell from 20.8% to 16% while the share working in Education dropped from 15% to 11.5%. The largest increase was in Administrative & Support Services which rose from 5.6% to 7.9% while Professional, Scientific & Technical Activities rose from 10.8% to 12.8%.
0.8
6.2
1.5
20.8
1.1
8.9
4.4
7.7
10.8
5.6
1.7
15.0
12.1
3.6
0.9
6.7
1.6
19.1
1.0
9.9
5.5
8.4
11.8
5.8
1.5
13.3
11.0
3.1
1.1
8.0
1.5
16.0
1.2
9.2
6.2
8.0
12.8
7.9
2.4
11.5
10.9
3.1
0 5 10 15 20 25
Agriculture, Forestry & Fishing (A)
Industry (B-E)
Construction (F)
Wholesale & Retail Trade (G)
Transportation & Storage (H)
Accommodation & Food Service Activities (I)
Information & Communication (J)
Finance & Real Estate (K,L)
Professional, Scientific, Technical Activities (M)
Administrative & Support Service Activities (N)
Public Administration & Defence (O)
Education (P)
Health & Social Work (Q)
Other NACE Activities (R-U)
Proportion of Substantially Employed Graduates (%)
2010
2012
2014
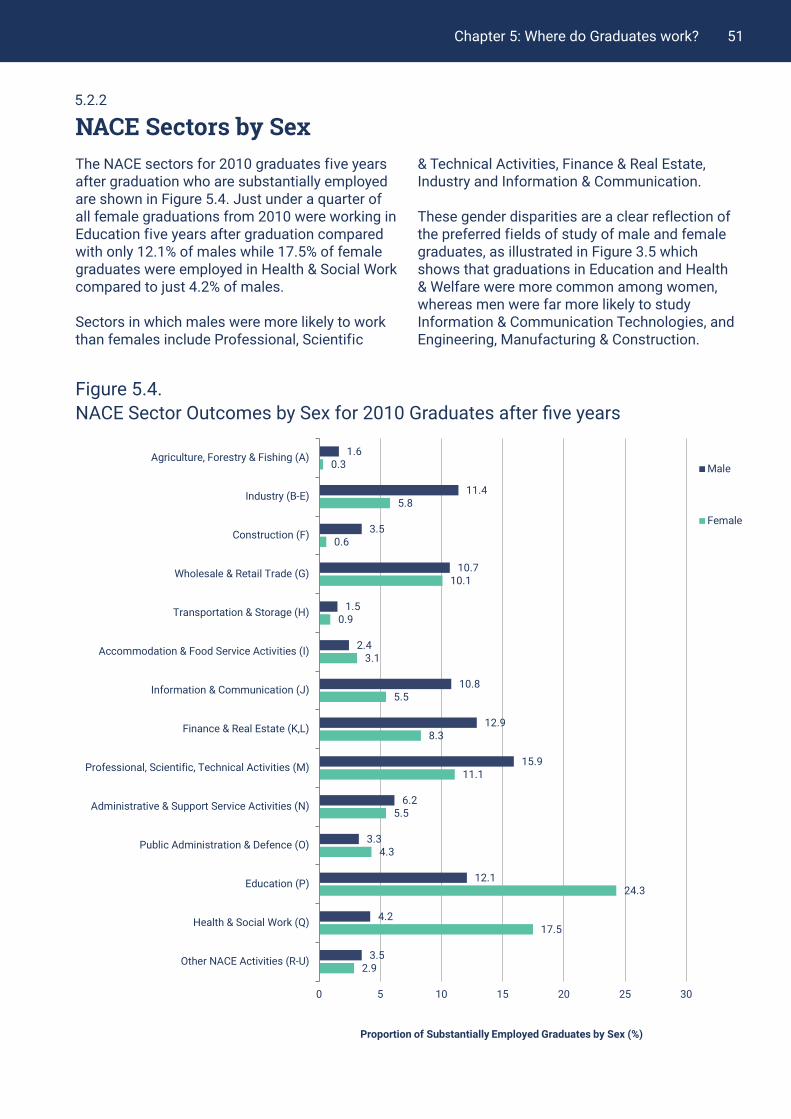
51Chapter 5: Where do Graduates work?
NACE Sectors by Sex
Figure 5.4. NACE Sector Outcomes by Sex for 2010 Graduates after five years
5.2.2
The NACE sectors for 2010 graduates five years after graduation who are substantially employed are shown in Figure 5.4. Just under a quarter of all female graduations from 2010 were working in Education five years after graduation compared with only 12.1% of males while 17.5% of female graduates were employed in Health & Social Work compared to just 4.2% of males.
Sectors in which males were more likely to work than females include Professional, Scientific
& Technical Activities, Finance & Real Estate, Industry and Information & Communication.
These gender disparities are a clear reflection of the preferred fields of study of male and female graduates, as illustrated in Figure 3.5 which shows that graduations in Education and Health & Welfare were more common among women, whereas men were far more likely to study Information & Communication Technologies, and Engineering, Manufacturing & Construction.
1.6
11.4
3.5
10.7
1.5
2.4
10.8
12.9
15.9
6.2
3.3
12.1
4.2
3.5
0.3
5.8
0.6
10.1
0.9
3.1
5.5
8.3
11.1
5.5
4.3
24.3
17.5
2.9
0 5 10 15 20 25 30
Agriculture, Forestry & Fishing (A)
Industry (B-E)
Construction (F)
Wholesale & Retail Trade (G)
Transportation & Storage (H)
Accommodation & Food Service Activities (I)
Information & Communication (J)
Finance & Real Estate (K,L)
Professional, Scientific, Technical Activities (M)
Administrative & Support Service Activities (N)
Public Administration & Defence (O)
Education (P)
Health & Social Work (Q)
Other NACE Activities (R-U)
Proportion of Substantially Employed Graduates by Sex (%)
Male
Female

52 Chapter 5: Where do Graduates work?
NACE Sectors by NFQ Level
Figure 5.5. NACE Sector Outcomes by NFQ Level for 2010 Graduates after five years
5.2.3
Figure 5.5 shows the NACE sectors for those 2010 graduates who are substantially employed five years after graduation by NFQ level. The proportion of graduates working in Education increases as the NFQ level rises. More than 20% of level 8 and 9 graduates worked in Education compared to 44% of level 10 graduates. Many of these level 10 graduates working in Education may be carrying out research in a Post-Doctoral position at a University. The share of graduates who are in the Professional, Scientific & Technical Activities also increases with NFQ level, rising from 13% at level 8 to 17% at level 10.
Interestingly, 17% of level 10 graduates work in Industry which is the largest proportion at any NFQ level for this NACE sector. This may be related to the fields of study which are more common at level 10, with 44% studying Natural
Sciences, Mathematics & Statistics and a further 16% studying Engineering, Manufacturing & Construction. As shown later in Section 5.2.5, these are the fields with the highest proportions of graduates working in the Industry sector.
Over a fifth (21%) of level 6 graduates from 2010 were employed in Wholesale & Retail Trade five years after graduation, while 16% of level 7 graduates were also in this sector. Part of the reason for these high proportions may be that high numbers of level 6 and 7 graduates re-enrolled in education after their initial graduation. Therefore the average number of years since leaving education is likely to be less than five years for this group, and Figure 5.1 earlier in this report showed that more recent graduates are more likely to be employed in Wholesale & Retail Trade than more established graduates.
4
2
1
12
14
7
7
17
4
6
1
1
21
16
10
7
2
2
1
1
5
6
3
1
5
7
7
10
6
12
10
10
11
6
9
11
13
16
17
9
7
6
5
6
4
2
4
5
6
4
4
21
26
44
8
9
14
8
6
5
4
3
3
0 20 40 60 80 100
6
7
8
9
10
Proportion of Substantially Employed Graduates (%)
NFQ Level
Agriculture, Forestry & Fishing (A) Industry (B-E)
Construction (F) Wholesale & Retail Trade (G)
Transportation & Storage (H) Accommodation & Food Service Activities (I)
Information & Communication (J) Finance & Real Estate (K,L)
Professional, Scientific, Technical Activities (M) Administrative & Support Service Activities (N)
Public Administration & Defence (O) Education (P)
Health & Social Work (Q) Other NACE Activities (R-U)

53Chapter 5: Where do Graduates work?
NACE Sectors by Institute Type
Figure 5.6. NACE Sector Outcomes by Institute Type, 2010 Graduates after five years
NACE Sectors by Field of Study
5.2.4
5.2.5
The NACE sectors for 2010 graduates five years after graduation are shown in Figure 5.6 by institute type. More than four out of five graduates from Colleges were working in Education five years after graduation, compared to 21% of graduates from Universities and just 5% from
Institutes of Technology (IOT). These differences are clearly related to the courses offered by Colleges; Table 3.5 showed that 54% of College graduates studied Education while a further 24% studied Arts & Humanities.
Figure 5.7 shows the NACE sector of employment five years after graduation for 2010 graduates by field of study. More than nine out of ten Education graduates from 2010 were working in the Education sector five years after graduation while 33% of Arts & Humanities and 20% of Natural Sciences, Mathematics & Statistics graduates were also working in Education.
Just under two-thirds of Health & Welfare graduates had found work in the Health & Social Work sector and 14% of Social Sciences, Journalism & Information graduates were also at work in this sector.
More than 40% of Information & Communication Technologies graduates were working in the Information & Communication sector. Close to
1
1
7
11
1
4
3
8
15
1
2
2
4
8
8
11
11
15
12
≈1
6
7
5
3
83
21
5
5
13
11
1
3
4
0 20 40 60 80 100
Colleges
Universities
Institutes of Technology
Proportion of Substantially Employed Graduates (%)
Agriculture, Forestry & Fishing (A) Industry (B-E)
Construction (F) Wholesale & Retail Trade (G)
Transportation & Storage (H) Accommodation & Food Service Activities (I)
Information & Communication (J) Finance & Real Estate (K,L)
Professional, Scientific, Technical Activities (M) Administrative & Support Service Activities (N)
Public Administration & Defence (O) Education (P)
Health & Social Work (Q) Other NACE Activities (R-U)
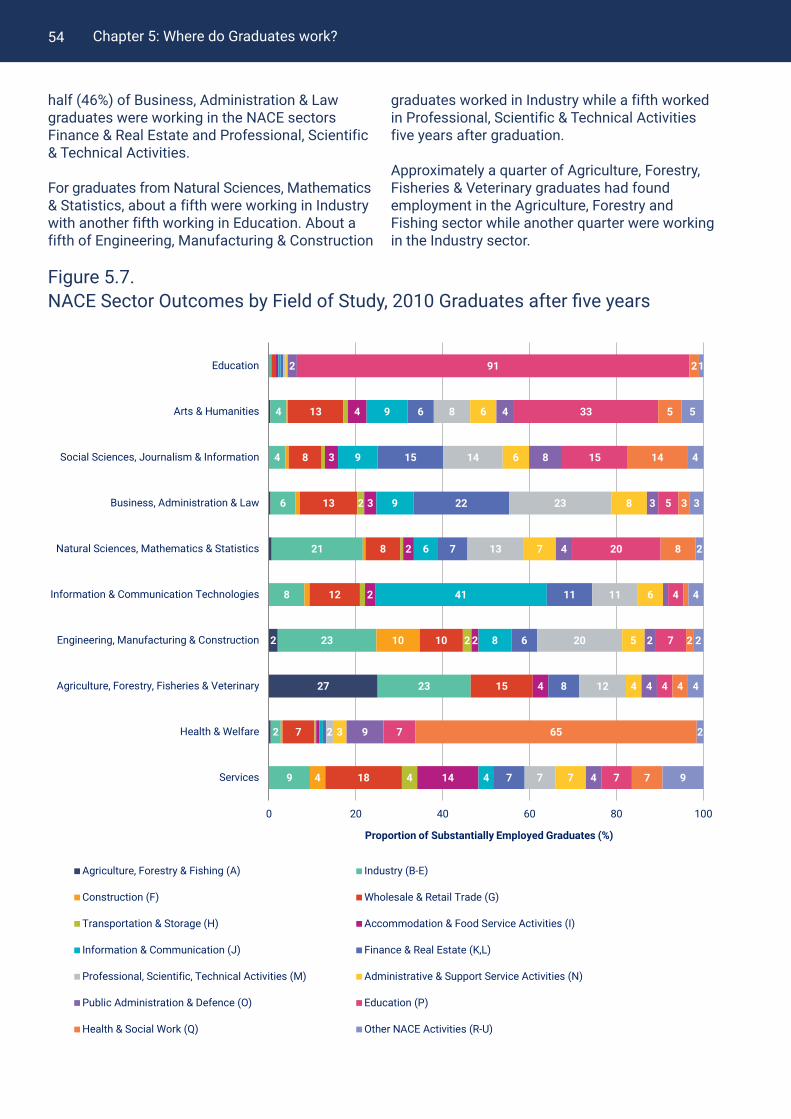
54 Chapter 5: Where do Graduates work?
Figure 5.7. NACE Sector Outcomes by Field of Study, 2010 Graduates after five years
half (46%) of Business, Administration & Law graduates were working in the NACE sectors Finance & Real Estate and Professional, Scientific & Technical Activities.
For graduates from Natural Sciences, Mathematics & Statistics, about a fifth were working in Industry with another fifth working in Education. About a fifth of Engineering, Manufacturing & Construction
graduates worked in Industry while a fifth worked in Professional, Scientific & Technical Activities five years after graduation.
Approximately a quarter of Agriculture, Forestry, Fisheries & Veterinary graduates had found employment in the Agriculture, Forestry and Fishing sector while another quarter were working in the Industry sector.
2
27
4
4
6
21
8
23
23
2
9
10
4
13
8
13
8
12
10
15
7
18
2
2
4
4
3
3
2
2
2
4
14
9
9
9
6
41
8
4
6
15
22
7
11
6
8
7
8
14
23
13
11
20
12
2
7
6
6
8
7
6
5
4
3
7
2
4
8
3
4
2
4
9
4
91
33
15
5
20
4
7
4
7
7
2
5
14
3
8
2
4
65
7
1
5
4
3
2
4
2
4
2
9
0 20 40 60 80 100
Education
Arts & Humanities
Social Sciences, Journalism & Information
Business, Administration & Law
Natural Sciences, Mathematics & Statistics
Information & Communication Technologies
Engineering, Manufacturing & Construction
Agriculture, Forestry, Fisheries & Veterinary
Health & Welfare
Services
Proportion of Substantially Employed Graduates (%)
Agriculture, Forestry & Fishing (A) Industry (B-E)
Construction (F) Wholesale & Retail Trade (G)
Transportation & Storage (H) Accommodation & Food Service Activities (I)
Information & Communication (J) Finance & Real Estate (K,L)
Professional, Scientific, Technical Activities (M) Administrative & Support Service Activities (N)
Public Administration & Defence (O) Education (P)
Health & Social Work (Q) Other NACE Activities (R-U)

55Chapter 5: Where do Graduates work?
NACE Sectors by Degree Class5.2.6
The NACE sectors for 2010 graduates five years after graduation are shown by degree class in Figure 5.8. The field of study is also shown so that the effect of degree class within a particular field can be examined. This section only looks at graduates with NFQ level 8 awards as the proportions of the various degree classes vary significantly by NFQ level and also because NACE sector is strongly influenced by NFQ level.
More than 90% of Education graduates were working in the Education sector five years later and there is little variation for these graduates by class of degree. Most Health & Welfare graduates were working in the Health & Social work sector and, similar to Education graduates, there is little variation by class of degree.
For Information & Communication Technologies graduates, 60% with a H1 were working in the Information & Communication sector compared to 36% with a H22.
In other fields, there are greater differences between the classes. Wholesale & Retail Trade and Accommodation & Food Service Activities are more prevalent for employment among lower degree classes in almost all fields of study. Another interesting trend is that the higher the degree class then the more likely it is that the graduate is working in Education. For example, 30% of Natural Sciences, Mathematics & Statistics graduates with a H1 were working in Education compared to 18% of those with a H22.
Working in the sector of Professional, Scientific & Technical Activities is more prevalent among graduates with higher degree classes for several fields of study. For example, 30% of Engineering, Manufacturing & Construction graduates with a H1 work in this sector compared to 18% with a H22. Working in the Industry sector is less popular among graduates in Natural Sciences, Mathematics & Statistics who have a higher degree class whereas for graduates in Engineering, Manufacturing & Construction the Industry sector is more popular among those with a higher degree class.

56 Chapter 5: Where do Graduates work?
Figure 5.8. NACE Sector Outcomes by Degree Class and by Field of Study, 2010 Graduates after five years (NFQ level 8 only)
H1H21H22
H1H21H22
H1H21H22
H1H21H22
H1H21H22
H1H21H22
H1H21H22
H1H21H22
H1*H21H22
0 20 40 60 80 100
Education
Arts & Humanities
Social Sciences, Journalism & Information
Business, Administration & Law
Natural Sciences, Mathematics & Statistics
Information & Communication Technologies
Engineering, Manufacturing & Construction
Health & Welfare
Services
Proportion of Substantially Employed Graduates (%)
Agriculture, Forestry & Fishing (A) Industry (B-E)
Construction (F) Wholesale & Retail Trade (G)
Transportation & Storage (H) Accommodation & Food Service Activities (I)
Information & Communication (J) Finance & Real Estate (K,L)
Professional, Scientific, Technical Activities (M) Administrative & Support Service Activities (N)
Public Administration & Defence (O) Education (P)
Health & Social Work (Q) Other NACE Activities (R-U)
*Data for H1 graduates from Services not included due to small numbers in this group

57Chapter 5: Where do Graduates work?
Table 5.1 shows the size of businesses that 2010 graduates were working in after graduation40. Data is only shown for those graduates that were in substantial employment in the relevant year. In the first year after graduation half of all graduates worked in large businesses with about a fifth working in medium and also in small businesses. The remaining 11.7% worked in micro businesses. Over the following four years, the proportion of graduates working in large businesses rose from 49.7% to 57% while the proportion working in small businesses fell from 19.7% to 15.1%.
40 The calculation for number of employees considers the average number of weeks worked. See Appendix A.3.1 for further details.41 The methodology here is different to that used for official statistics, for example those provided in the CSO Business Demography Survey. One difference is that public sector industries are no excluded here.
The entire P35 dataset (representing all employees in the country) was examined for each of the years 2011 to 2015. The proportion of employees in each business size was averaged over this time period and is shown in the last column of Table 5.141. These figures show that graduates are more likely to work in large businesses than the general population of employees. Five years after graduation, 57% of 2010 graduates worked in a large business compared to 47.8% of the general population while 24.4% of 2010 graduates worked in a micro or small business compared to 33.7% of the general population.
Business Size
Table 5.1. Number of 2010 Graduates by Business Size, after one, three and five years
Size Category 1 year after Graduation
% 3 years after Graduation
% 5 years after Graduation
% All P35 (%) 2011-2015
Micro (<10) 2,340 11.7 2,010 10.3 1,880 9.3 15.9
Small (10-49) 3,950 19.7 3,250 16.6 3,060 15.1 17.8
Medium (50-249) 3,800 19.0 3,490 17.9 3,760 18.6 18.6
Large (250+) 9,950 49.7 10,790 55.2 11,530 57.0 47.8
Total Substantially Employed 20,030 100.0 19,550 100.0 20,230 100.0 100
Total 30,520 30,520 30,520
5.3
The breakdown by business size for 2010 graduates five years after graduation is shown in Figure 5.9 by field of study. Only those graduates who were in substantial employment are included. More than 90% of Education graduates and 69% of Health & Welfare graduates were working in large businesses which is likely due to public
sector workers having Government departments listed as their employer, or employment in large educational institutions or private hospitals. Agriculture, Forestry, Fisheries & Veterinary had the highest proportion of graduates (46%) working in micro and small businesses.

58 Chapter 5: Where do Graduates work?
Figure 5.9. Business Size of Employer for Graduates by Field of Study, 2010 graduates after five years
Job Churn5.4
Figure 5.10 shows the movement of graduates between jobs in the years after graduation (i.e. job churn). The movement of graduates between NACE sectors was also examined, see Figure 5.11. note that the NACE sector code refers to the primary activity of the employer and not the employee. In some cases a change in NACE sector may not correspond to a distinct change in work for the employee, e.g. an individual could work in company law for a restaurant chain and then change job to work in company law for a pharmaceutical company. As occupation codes are not available, issues such as these cannot be identified.
All employments in the first five years following graduation were examined for the graduates of 2010. Only graduates who were “captured” by the administrative data in all five years were included in the study, i.e. any graduate who was ‘not captured’ for one or more of the five years between 2011 and 2015 was excluded. This is to prevent fields of study that are associated with high rates of graduates who are ‘not captured’ from obtaining an artificially low rate of job churn.
Only P35 employment is included here. For further details, see Appendix A.3.6.
9
2
12
7
9
7
10
13
25
8
11
15
3
17
16
17
13
18
20
21
11
19
19
3
17
19
23
18
23
24
21
13
31
57
92
53
57
51
63
48
43
33
69
39
0 20 40 60 80 100
All
Education
Arts & Humanities
Social Sciences, Journalism & Information
Business, Administration & Law
Natural Sciences, Mathematics & Statistics
Information & Communication Technologies
Engineering, Manufacturing & Construction
Agriculture, Forestry, Fisheries & Veterinary
Health & Welfare
Services
Proportion of Substantially Employed Graduates (%)
Micro
Small
Medium
Large

59Chapter 5: Where do Graduates work?
Number of Employers by Field of Study
Figure 5.10. Number of Distinct Employers per Graduate by Field of Study, 2010 Graduates over first five years
5.4.1
The number of distinct employers that each 2010 graduate had between 2011 and 2015 was calculated. The average values for each field of study are shown in Figure 5.10. The average number of distinct employers per graduate involving substantial work only is also shown, where an occupation is defined as substantial if the duration was at least 12 weeks and the average weekly earnings was at least €100.
The average number of distinct employers over the five year period for all 2010 graduates was 3.2. The fields with the highest number of employers were Arts & Humanities with an average of 3.8 employers per graduate and Health & Welfare with an average of 3.5. Information & Communication Technologies graduates had the lowest number of employers at 2.6.
Where only substantial occupations are considered, the average number of distinct employers over the five year period was 2.2. Graduates from Health & Welfare had the highest number of substantial employments at 2.5 while Education had the lowest at 1.5.
For Education graduates there was a particularly large difference between the average number of employers per graduate at 3.1 and the average number of substantial employers at 1.5. This may be related to income from substitute teaching, work at private or independent schools and the correction and invigilation of exams. The next section on NACE sectors provides more insight on this issue.
2.2
1.5
2.3
2.3
2.3
2.1
2.1
2.1
1.9
2.5
2.3
3.2
3.1
3.8
3.3
3
2.9
2.6
2.8
2.8
3.5
3.2
0 1 2 3 4
All Graduates
Education
Arts & Humanities
Social Sciences, Journalism & Information
Business, Administration & Law
Natural Sciences, Mathematics & Statistics
Information & Communication Technologies
Engineering, Manufacturing & Construction
Agriculture, Forestry, Fisheries & Veterinary
Health & Welfare
Services
Average Number of Distinct Empoyers per Graduate
Substantial P35Employment
All P35 Employment
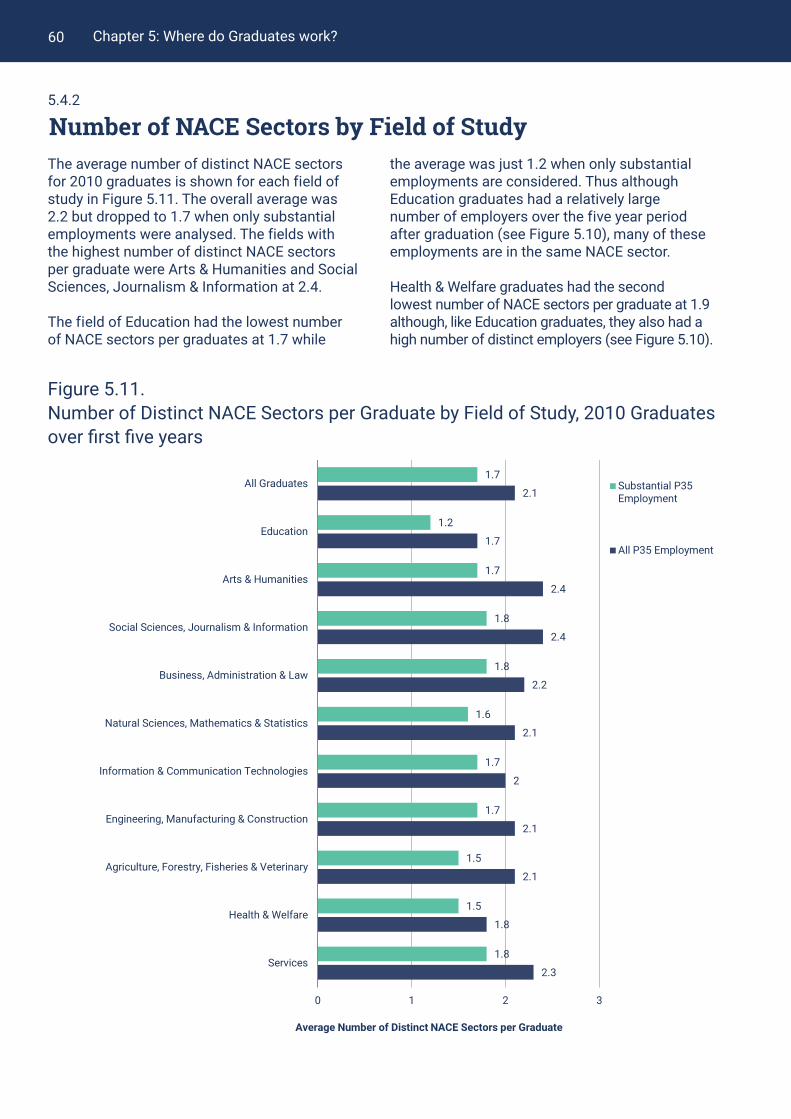
60 Chapter 5: Where do Graduates work?
Number of NACE Sectors by Field of Study
Figure 5.11. Number of Distinct NACE Sectors per Graduate by Field of Study, 2010 Graduates over first five years
5.4.2
The average number of distinct NACE sectors for 2010 graduates is shown for each field of study in Figure 5.11. The overall average was 2.2 but dropped to 1.7 when only substantial employments were analysed. The fields with the highest number of distinct NACE sectors per graduate were Arts & Humanities and Social Sciences, Journalism & Information at 2.4.
The field of Education had the lowest number of NACE sectors per graduates at 1.7 while
the average was just 1.2 when only substantial employments are considered. Thus although Education graduates had a relatively large number of employers over the five year period after graduation (see Figure 5.10), many of these employments are in the same NACE sector.
Health & Welfare graduates had the second lowest number of NACE sectors per graduate at 1.9 although, like Education graduates, they also had a high number of distinct employers (see Figure 5.10).
1.7
1.2
1.7
1.8
1.8
1.6
1.7
1.7
1.5
1.5
1.8
2.1
1.7
2.4
2.4
2.2
2.1
2
2.1
2.1
1.8
2.3
0 1 2 3
All Graduates
Education
Arts & Humanities
Social Sciences, Journalism & Information
Business, Administration & Law
Natural Sciences, Mathematics & Statistics
Information & Communication Technologies
Engineering, Manufacturing & Construction
Agriculture, Forestry, Fisheries & Veterinary
Health & Welfare
Services
Average Number of Distinct NACE Sectors per Graduate
Substantial P35Employment
All P35 Employment

Chapter 1: Policy Context 61
Chapter 6: What do Graduates Earn?

Chapter 1: Policy Context62
Median weekly earnings for 2010 graduates rose from €420 in the first year after graduation to €640 by the fifth year.
In the first year after graduation, median weekly earnings were equal for men and women at €420 per week. However, after five years, median weekly earnings for men, at €655 per week, were €20 above the figure of €635 per week for women.
Median weekly earnings for 2010 graduates with a level 6 award rose from €245
Key Findings
Five years after graduation, median weekly earnings for graduates of level 8 awards with a H1 were €745, which was €175 higher than the median of €570 for graduates with a H3.
The field of study with the highest median weekly earnings five years after graduation was Information & Communication Technologies at €775
Median weekly earnings for Education graduates in their first year after graduation dropped from €705 for 2010 graduates to €560 for 2014 graduates. The median for Health & Welfare also dropped, from €590 to €565, over the same time period.
The highest median weekly earnings for the class of 2014 one year after graduation was €570 for Information & Communication Technologies.
Introduction6.1
This chapter describes the weekly earnings of graduates and how this is influenced by the various parameters relating to their degree. The only income considered here is from the P35 dataset, which covers all PAYE income for employees. Individuals who are self-employed using the self-assessment system are not represented here. Only graduates who meet the criteria for substantial P35 employment as defined in Appendix A.3.4 are considered here
(note that graduates who are both substantially employed and re-enrolled in education are included in this Chapter). All earnings relate to gross pay and are adjusted for inflation using the Consumer Price Index (base = December 2016). The first, second and third quartiles of weekly earnings are shown, and aggregated earnings data are rounded to the nearest €5.
See appendix A.3.1 for further details.
in the first year after graduation to €475 five years later while the median for graduates with a level 10 award rose from €705 to €920.
followed by Education at €740 and Health & Welfare at €705.

63Chapter 6 : What do Graduates Earn?
Earnings of All Graduates
Figure 6.1. Earnings of Graduates by years since Graduation (for 2010 Graduates) and Graduation Year
Earnings by Sex
6.2
6.3
The earnings of individuals who graduated in 2010 in their first, third and fifth years following graduation are illustrated in the left hand side of Figure 6.1. Median weekly earnings increased by €55 per week each year, rising from €420 per week in year one to €640 per week in year five. The earnings of graduates in their first year
following graduation are shown for each graduation year from 2010-2014 in the right hand side of Figure 6.1. For 2010 graduates, median weekly earnings in the first year after graduation was €420. The median then dropped to €415 for 2012 graduates before increasing to €445 for 2014 graduates.
The breakdown in earnings by Sex for 2010 graduates at one, three and five years after graduation is shown in Figure 6.2. In the first year after graduation, the median earnings for men and women were equal at €420 per week, although the upper quartile for women was €70 higher than that for men. After three years, earnings for
females were €10 higher than for males. After five years this position had reversed and median weekly earnings for men at €655 per week were €20 above the figure of €635 for women. Both upper and lower quartiles of weekly earnings were also greater for males than for females after 5 years.
1 3 5
420
530
640
2010 2011 2012 2013 2014
420 425 415 430 445
0
100
200
300
400
500
600
700
800
0
100
200
300
400
500
600
700
800
Weekly Earnings (€)
Years since Graduation Graduation Year
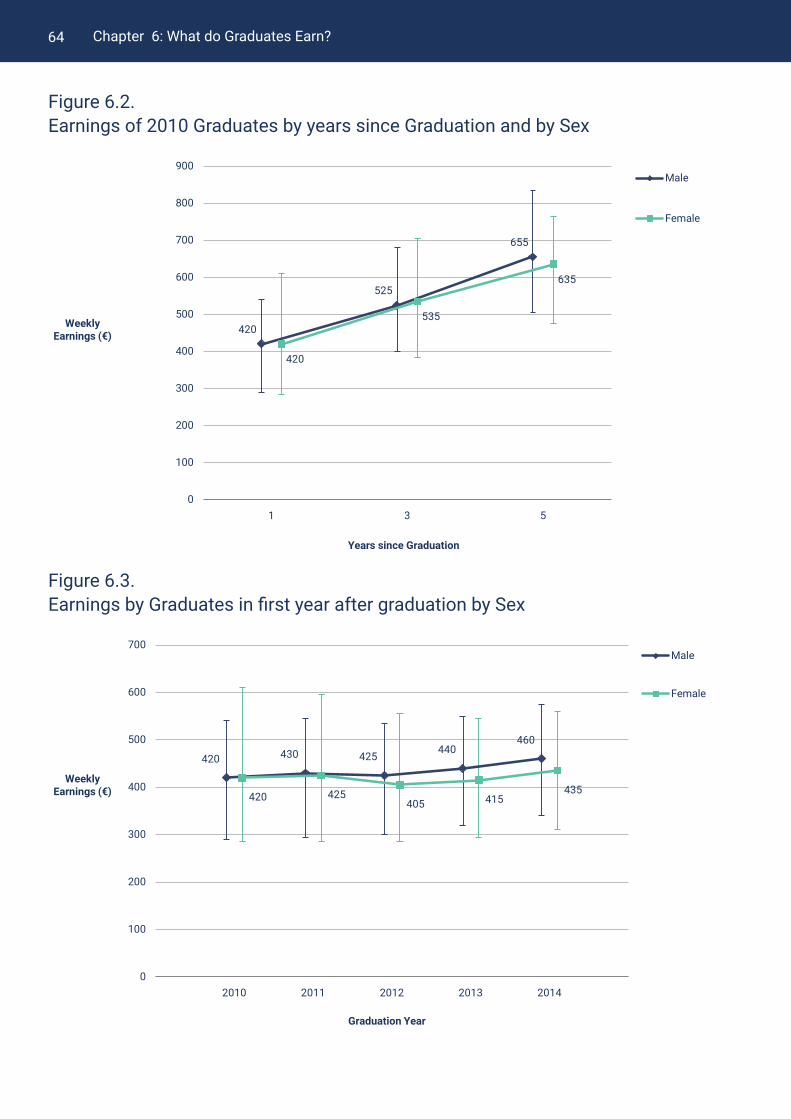
64 Chapter 6: What do Graduates Earn?
Figure 6.2. Earnings of 2010 Graduates by years since Graduation and by Sex
Figure 6.3. Earnings by Graduates in first year after graduation by Sex
1 3 5
420
525
655
420
535
635
0
100
200
300
400
500
600
700
800
900
WeeklyEarnings (€)
Years since Graduation
Male
Female
2010 2011 2012 2013 2014
420 430 425440
460
420 425405 415
435
0
100
200
300
400
500
600
700
WeeklyEarnings (€)
Graduation Year
Male
Female

65
Weekly earnings are examined by the NFQ Level of the degree in Figure 6.4. The median weekly earnings in the first year after graduation for NFQ level 6 graduates (Advanced or Higher Certificates) from 2010 was €245 while the median for NFQ level 7 (Ordinary Bachelor’s
42 Note that the award types shown here in brackets do not correlate exactly to NFQ level, as there is not a precise one-to-one relation ship between these classifications. The award type names are given here as a guide.
Degrees) was €29042. Holders of an NFQ level 8 qualification (Honours Bachelor’s Degrees) earned more again with a median of €425 while those graduates with NFQ level 9 awards (Master’s and Postgraduate Diplomas) had a median of €510. The highest median weekly earnings of €705 went to those with NFQ level 10 awards (Doctoral Degrees).
Chapter 6: What do Graduates Earn?
Earnings by NFQ Level
Figure 6.4. Earnings of 2010 Graduates by NFQ Level and by years since Graduation
6.4
Earnings by Sex for each graduation year are shown in Figure 6.3. Median weekly earnings for 2010 graduates were €420 for both men and women. However, earnings for males were higher for each of the subsequent years. Median weekly earnings for males were €430 for those who graduated in 2011, €5 higher than for females. This difference increased over the following three years to €25 by 2014, when median weekly earnings for males were €460 compared to
€435 for females. Figure 6.3 also illustrates that the difference between the values of the upper quartiles changed quite dramatically between 2010 and 2014. For 2010 graduates the upper quartile for female earnings was €70 per week higher than that for males, but this difference declined over the following years, and for the 2014 graduates the upper quartile for male earnings was €15 per week higher than that for females.
1 3 5 1 3 5 1 3 5 1 3 5 1 3 5
245
360
475
290
420
525
425
535
650
510
630
740705
805
920
0
200
400
600
800
1,000
1,200
Weekly Earnings (€)
Years since Graduation
NFQ 6 NFQ 7 NFQ 8 NFQ 9 NFQ 10

66 Chapter 6 : What do Graduates Earn?
Figure 6.5. Earnings of Graduates in first year after graduation by NFQ Level and by Graduation Year
The rate of increase in earnings for the 2010 graduates over the five year period after graduation were highest for those with level 6 awards and the rate of the increase declines as the level of the NFQ award rises. The median weekly earnings for graduates with a level 6 award rose from €245 in the first year after graduation to €475 five years later, an increase of 94%. At the other end of the scale, the median for graduates with a level 10 award rose 30% over the five years, from €705 to €920.
The weekly earnings for graduates in their first year following graduation are shown by NFQ level in Figure 6.5. Between 2010 and 2014 the highest increase in median weekly earnings for graduates in their first year after graduation was for NFQ level 7 which rose from €290 per week to €350 per week, an increase of €60. The second highest increase was for graduates with NFQ level 6 which rose by €35 per week while NFQ level 8 rose by €25. Levels 9 and 10 saw a decrease in median weekly earnings over the period, with a €35 decrease for level 10 and a €10 decrease for level 9.
2010 2012 2014 2010 2012 2014 2010 2012 2014 2010 2012 2014 2010 2012 2014
245 260280 290
315350
425 420450 510
480500
705670 670
0
100
200
300
400
500
600
700
800
900
Weekly Earnings (€)
Graduation Year
NFQ 6 NFQ 7 NFQ 8 NFQ 9 NFQ 10
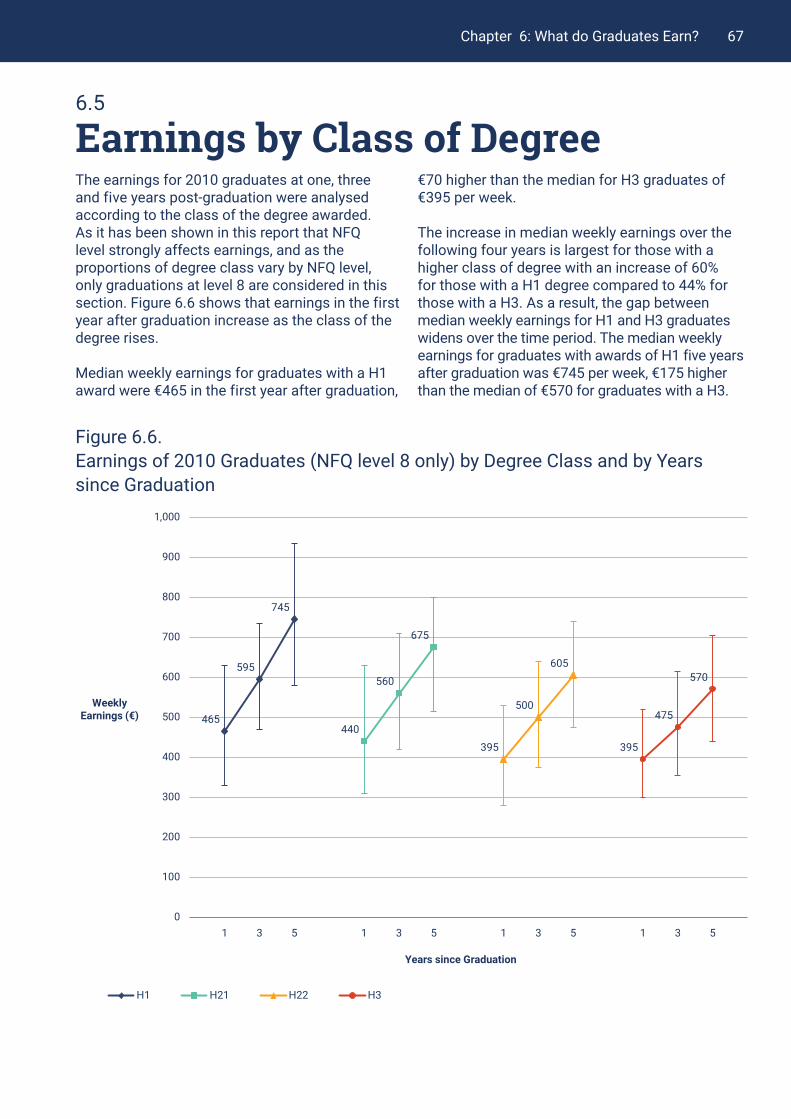
67Chapter 6: What do Graduates Earn?
Earnings by Class of Degree
Figure 6.6. Earnings of 2010 Graduates (NFQ level 8 only) by Degree Class and by Years since Graduation
6.5
The earnings for 2010 graduates at one, three and five years post-graduation were analysed according to the class of the degree awarded. As it has been shown in this report that NFQ level strongly affects earnings, and as the proportions of degree class vary by NFQ level, only graduations at level 8 are considered in this section. Figure 6.6 shows that earnings in the first year after graduation increase as the class of the degree rises.
Median weekly earnings for graduates with a H1 award were €465 in the first year after graduation,
€70 higher than the median for H3 graduates of €395 per week.
The increase in median weekly earnings over the following four years is largest for those with a higher class of degree with an increase of 60% for those with a H1 degree compared to 44% for those with a H3. As a result, the gap between median weekly earnings for H1 and H3 graduates widens over the time period. The median weekly earnings for graduates with awards of H1 five years after graduation was €745 per week, €175 higher than the median of €570 for graduates with a H3.
1 3 5 1 3 5 1 3 5 1 3 5
465
595
745
440
560
675
395
500
605
395
475
570
0
100
200
300
400
500
600
700
800
900
1,000
Weekly Earnings (€)
Years since Graduation
H1 H21 H22 H3
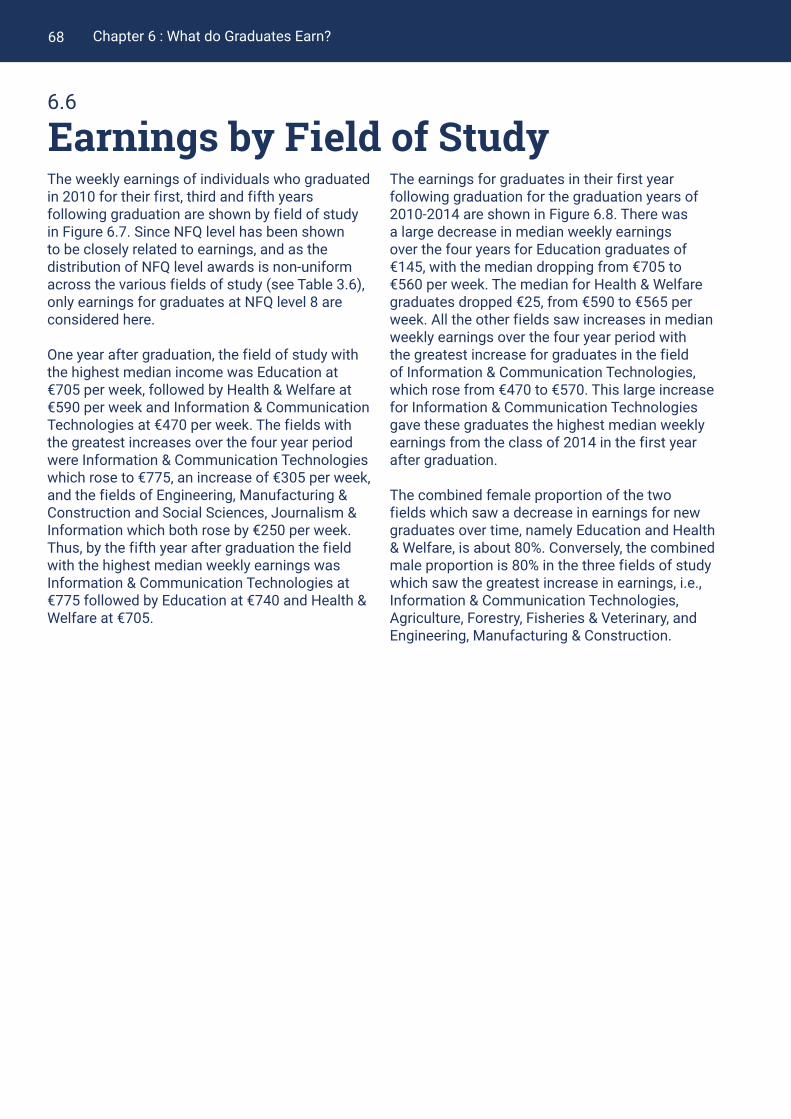
68 Chapter 6 : What do Graduates Earn?
Earnings by Field of Study6.6
The weekly earnings of individuals who graduated in 2010 for their first, third and fifth years following graduation are shown by field of study in Figure 6.7. Since NFQ level has been shown to be closely related to earnings, and as the distribution of NFQ level awards is non-uniform across the various fields of study (see Table 3.6), only earnings for graduates at NFQ level 8 are considered here.
One year after graduation, the field of study with the highest median income was Education at €705 per week, followed by Health & Welfare at €590 per week and Information & Communication Technologies at €470 per week. The fields with the greatest increases over the four year period were Information & Communication Technologies which rose to €775, an increase of €305 per week, and the fields of Engineering, Manufacturing & Construction and Social Sciences, Journalism & Information which both rose by €250 per week. Thus, by the fifth year after graduation the field with the highest median weekly earnings was Information & Communication Technologies at €775 followed by Education at €740 and Health & Welfare at €705.
The earnings for graduates in their first year following graduation for the graduation years of 2010-2014 are shown in Figure 6.8. There was a large decrease in median weekly earnings over the four years for Education graduates of €145, with the median dropping from €705 to €560 per week. The median for Health & Welfare graduates dropped €25, from €590 to €565 per week. All the other fields saw increases in median weekly earnings over the four year period with the greatest increase for graduates in the field of Information & Communication Technologies, which rose from €470 to €570. This large increase for Information & Communication Technologies gave these graduates the highest median weekly earnings from the class of 2014 in the first year after graduation.
The combined female proportion of the two fields which saw a decrease in earnings for new graduates over time, namely Education and Health & Welfare, is about 80%. Conversely, the combined male proportion is 80% in the three fields of study which saw the greatest increase in earnings, i.e., Information & Communication Technologies, Agriculture, Forestry, Fisheries & Veterinary, and Engineering, Manufacturing & Construction.

69Chapter 6: What do Graduates Earn?
Figure 6.7. Earnings of Graduates (NFQ level 8 only) by Field of Study at one, three and five years Graduation
Figure 6.8. Earnings of Graduates (NFQ level 8 only) by Field of Study in first year after graduation, for Graduation Years 2010, 2012, 2014
705
615
560
310300
320350
335380
410415440
425420
440 470525
570
450465
515
400440
480
590
555 565
375 380395
0
100
200
300
400
500
600
700
800
900
Weekly Earnings (€)
Education Arts & Humanities
Social Sciences, Journalism & Information Business, Administration & Law
Natural Sciences, Mathematics & Statistics Information & Communication Technologies
Engineering, Manufacturing & Construction Agriculture, Forestry, Fisheries & Veterinary
Health & Welfare Services
705710 740
310
420
525
350
490
600
410
510
640
425
555
660
470
605
775
450
570
700
400485
565590
645705
375
460
550
0
100
200
300
400
500
600
700
800
900
1,000
Weekly Earnings (€)
Education Arts & Humanities
Social Sciences, Journalism & Information Business, Administration & Law
Natural Sciences, Mathematics & Statistics Information & Communication Technologies
Engineering, Manufacturing & Construction Agriculture, Forestry, Fisheries & Veterinary
Health & Welfare Services

Chapter 1: Policy Context70
Chapter 7: How do Higher Education Graduates compare to Non-Graduates?
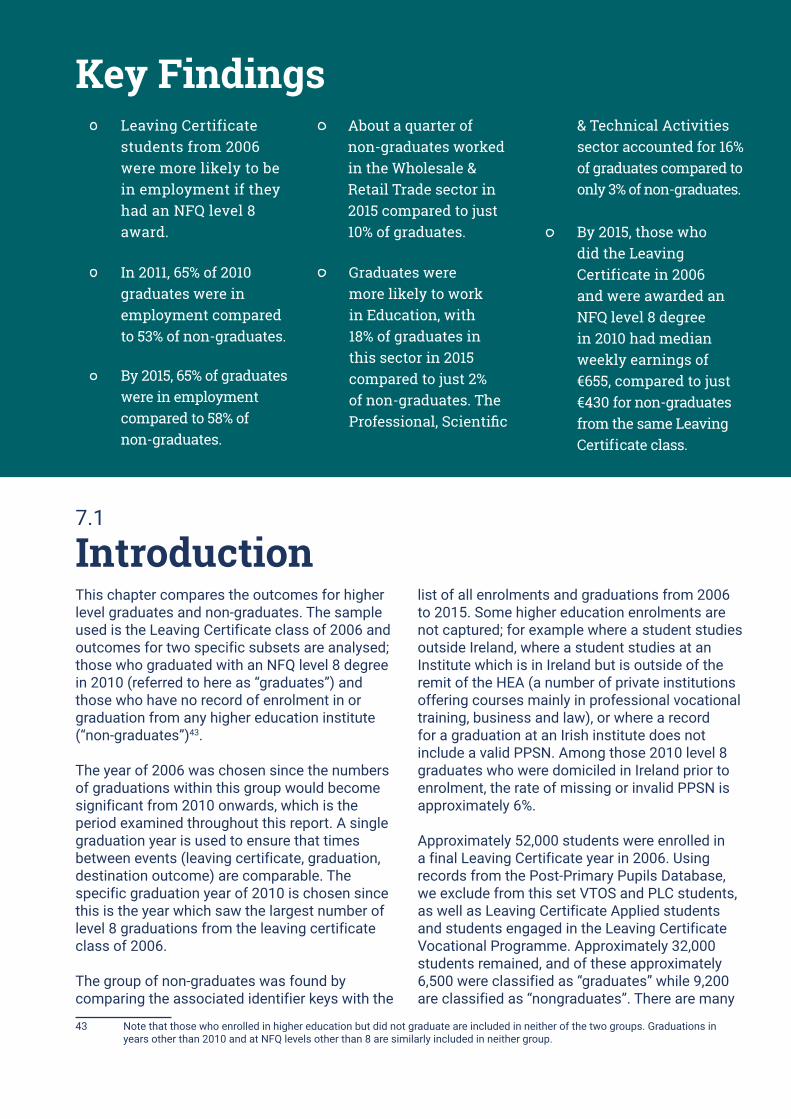
Chapter 1: Policy Context 71
Key FindingsLeaving Certificate students from 2006 were more likely to be in employment if they had an NFQ level 8 award.
In 2011, 65% of 2010 graduates were in employment compared to 53% of non-graduates.
By 2015, 65% of graduates were in employment compared to 58% of non-graduates.
About a quarter of non-graduates worked in the Wholesale & Retail Trade sector in 2015 compared to just 10% of graduates.
Graduates were more likely to work in Education, with 18% of graduates in this sector in 2015 compared to just 2% of non-graduates. The Professional, Scientific
By 2015, those who did the Leaving Certificate in 2006 and were awarded an NFQ level 8 degree in 2010 had median weekly earnings of €655, compared to just €430 for non-graduates from the same Leaving Certificate class.
Introduction7.1
This chapter compares the outcomes for higher level graduates and non-graduates. The sample used is the Leaving Certificate class of 2006 and outcomes for two specific subsets are analysed; those who graduated with an NFQ level 8 degree in 2010 (referred to here as “graduates”) and those who have no record of enrolment in or graduation from any higher education institute (“non-graduates”)43.
The year of 2006 was chosen since the numbers of graduations within this group would become significant from 2010 onwards, which is the period examined throughout this report. A single graduation year is used to ensure that times between events (leaving certificate, graduation, destination outcome) are comparable. The specific graduation year of 2010 is chosen since this is the year which saw the largest number of level 8 graduations from the leaving certificate class of 2006.
The group of non-graduates was found by comparing the associated identifier keys with the
43 Note that those who enrolled in higher education but did not graduate are included in neither of the two groups. Graduations in years other than 2010 and at NFQ levels other than 8 are similarly included in neither group.
list of all enrolments and graduations from 2006 to 2015. Some higher education enrolments are not captured; for example where a student studies outside Ireland, where a student studies at an Institute which is in Ireland but is outside of the remit of the HEA (a number of private institutions offering courses mainly in professional vocational training, business and law), or where a record for a graduation at an Irish institute does not include a valid PPSN. Among those 2010 level 8 graduates who were domiciled in Ireland prior to enrolment, the rate of missing or invalid PPSN is approximately 6%.
Approximately 52,000 students were enrolled in a final Leaving Certificate year in 2006. Using records from the Post-Primary Pupils Database, we exclude from this set VTOS and PLC students, as well as Leaving Certificate Applied students and students engaged in the Leaving Certificate Vocational Programme. Approximately 32,000 students remained, and of these approximately 6,500 were classified as “graduates” while 9,200 are classified as “nongraduates”. There are many
& Technical Activities sector accounted for 16% of graduates compared to only 3% of non-graduates.
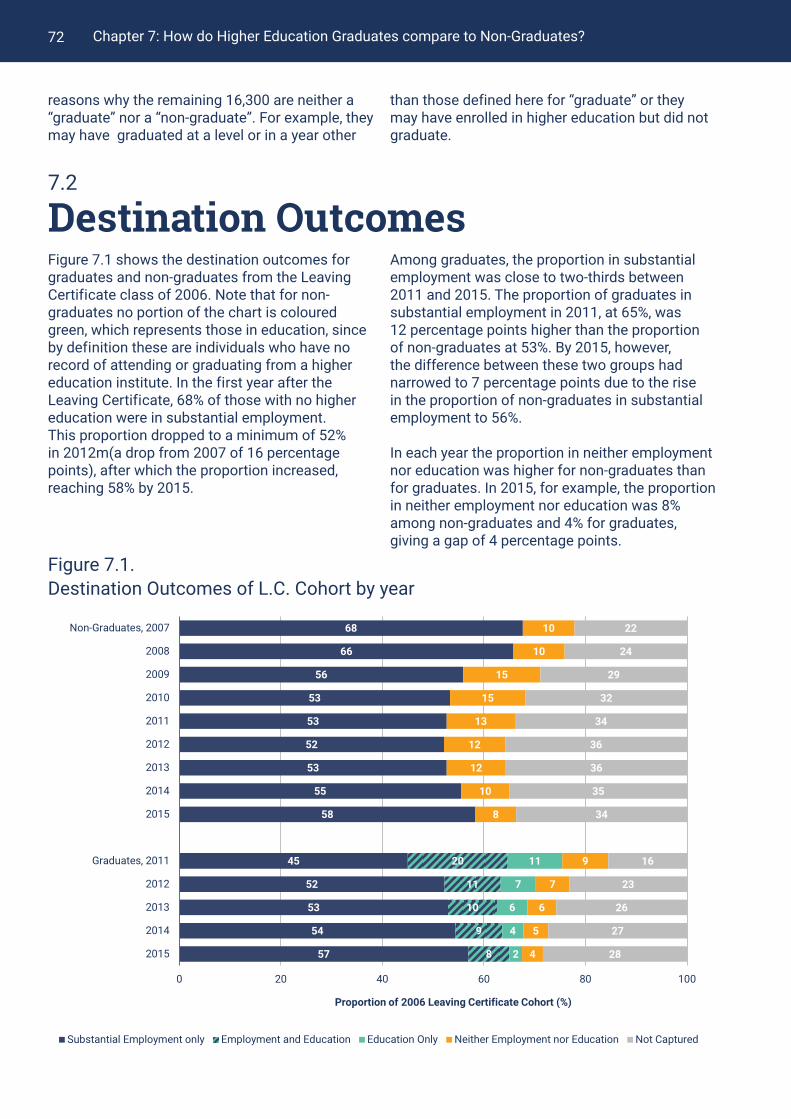
72 Chapter 7: How do Higher Education Graduates compare to Non-Graduates?
Destination Outcomes7.2
Figure 7.1. Destination Outcomes of L.C. Cohort by year
reasons why the remaining 16,300 are neither a “graduate” nor a “non-graduate”. For example, they may have graduated at a level or in a year other
than those defined here for “graduate” or they may have enrolled in higher education but did not graduate.
Figure 7.1 shows the destination outcomes for graduates and non-graduates from the Leaving Certificate class of 2006. Note that for non-graduates no portion of the chart is coloured green, which represents those in education, since by definition these are individuals who have no record of attending or graduating from a higher education institute. In the first year after the Leaving Certificate, 68% of those with no higher education were in substantial employment. This proportion dropped to a minimum of 52% in 2012m(a drop from 2007 of 16 percentage points), after which the proportion increased, reaching 58% by 2015.
Among graduates, the proportion in substantial employment was close to two-thirds between 2011 and 2015. The proportion of graduates in substantial employment in 2011, at 65%, was 12 percentage points higher than the proportion of non-graduates at 53%. By 2015, however, the difference between these two groups had narrowed to 7 percentage points due to the rise in the proportion of non-graduates in substantial employment to 56%.
In each year the proportion in neither employment nor education was higher for non-graduates than for graduates. In 2015, for example, the proportion in neither employment nor education was 8% among non-graduates and 4% for graduates, giving a gap of 4 percentage points.
68
66
56
53
53
52
53
55
58
45
52
53
54
57
20
11
10
9
8
11
7
6
4
2
10
10
15
15
13
12
12
10
8
9
7
6
5
4
22
24
29
32
34
36
36
35
34
16
23
26
27
28
0 20 40 60 80 100
Non-Graduates, 2007
2008
2009
2010
2011
2012
2013
2014
2015
Graduates, 2011
2012
2013
2014
2015
Proportion of 2006 Leaving Certificate Cohort (%)
Substantial Employment only Employment and Education Education Only Neither Employment nor Education Not Captured

73Chapter 7: How do Higher Education Graduates compare to Non-Graduates?
NACE Sectors7.3
Figure 7.2. NACE Sector Outcomes of L.C. Cohort by Year
The NACE categories for the Leaving Certificate class of 2006 are shown for each year for Graduates and Non-Graduates in Figure 7.2. Four out of ten non-graduates who were in substantial employment in the first year after the Leaving Certificate found work in Wholesale & Retail Trade. The proportion dropped over the following years to 26% by 2015. About one in ten non-graduates worked in Construction in the first year after the Leaving Certificate but this share dropped to 4% by 2015.
When a comparison by NACE sector is made between graduates and non-graduates for
the year 2015, it can be seen that 26% of non-graduates were working in Wholesale & Retail Trade compared to 10% of graduates. Non-graduates also had higher rates of working in Accommodation & Food Service Activities at 8% compared to just 2% for graduates.
Graduates were much more likely to work in Education, with 18% of graduates in this sector in 2015 compared to just 2% of non-graduates. The Professional, Scientific & Technical sector accounted for 6% of graduates compared to 3% of non-graduates.
1
1
1
1
1
1
1
1
1
1
6
6
6
5
6
6
7
7
7
6
7
7
7
7
10
7
5
4
3
3
2
4
4
1
1
1
1
1
42
38
33
33
31
30
29
28
26
20
16
13
11
10
2
3
3
3
3
3
3
3
4
1
1
1
1
1
12
10
11
10
10
10
9
8
8
9
5
4
3
2
1
2
2
2
2
3
3
4
4
5
7
7
9
9
4
6
10
9
10
9
9
9
9
10
12
12
12
12
2
2
3
3
3
3
4
4
3
13
16
18
17
16
5
6
5
6
7
6
6
7
7
6
6
6
6
6
2
3
3
4
4
4
4
4
4
2
2
2
3
3
1
1
2
2
2
3
2
3
2
12
15
16
16
18
4
5
7
8
9
9
10
10
11
12
10
10
10
10
7
9
10
10
9
9
9
9
9
4
3
3
3
4
0 20 40 60 80 100
Non-Graduates, 2007
2008
2009
2010
2011
2012
2013
2014
2015
Graduates, 2011
2012
2013
2014
2015
Proportion of 2006 Leaving Certificate Cohort (%)
Agriculture, Forestry & Fishing (A) Industry (B-E)Construction (F) Wholesale & Retail Trade (G)Transportation & Storage (H) Accommodation & Food Service Activities (I)Information & Communication (J) Finance & Real Estate (K,L)Professional, Scientific, Technical Activities (M) Administrative & Support Service Activities (N)Public Administration & Defence (O) Education (P)Health & Social Work (Q) Other NACE Activities (R-U)

74 Chapter 7: How do Higher Education Graduates compare to Non-Graduates?
Earnings7.4
Figure 7.3. Weekly Earnings of Leaving Certificate Cohort by Year
The weekly earnings for graduates and non-graduates are shown in Figure 7.3. In the first year after the Leaving Certificate, the median weekly earnings of non-graduates was €300 per week. Eight years later in 2015, this had risen to €430 per week, an increase of €130 per week, with almost half of this increase occurring by 2009.
The median weekly earnings of graduates in their first year after graduation (i.e., in 2011) was €425
per week, €45 higher than the weekly earnings for non-graduates in the same year. Earnings for graduates increased more strongly between 2011 and 2015 than for non-graduates. Over this time period, median weekly earnings for graduates increased from €425 to €655 per week, an increase of 54% compared to an increase of just 13% for non-graduates, who saw their earnings rise from €380 to €430 per week.
300
335365
380 380 385 395 405430
425
485
535
595
655
2007 2008 2009 2010 2011 2012 2013 2014 20150
100
200
300
400
500
600
700
800
900
Weekly Earnings (€)
Year
Graduates
Non-Graduates

Chapter 1: Policy Context 75
Chapter 8: Comparing Administrative Data with Survey Data
Chapter 1: Policy Context76
Key FindingsThe administrative data on graduate outcomes closely matched the HEA survey data. Differences are likely to be linked to activities that are not captured by administrative data, such as education and training courses that are not covered by the HEA.
The HEA survey response rate on the topic of earnings was around
The administrative data revealed larger numbers of low income earners than the HEA survey, possibly due to survey bias or because the survey captures activity at a single point in time.
Earnings for Agriculture, Forestry, Fisheries and Veterinary graduates are higher in the HEA survey and this may be due to self-employment incomes which are not covered by the administrative data and may be particularly important for this group of graduates.
Introduction8.1
A report from the HEA “What Do Graduates Do? The Class of 2014”, published in May 2016, examined graduate outcomes using survey data. These HEA survey findings are compared in this chapter with the results of this present report, which are produced from administrative data.
The HEA report on the class of 2014 surveyed the destination outcomes, earnings and industry sectors of graduates nine months after graduation. In this section a comparison is made with the HEA survey results and the administrative data for graduates in the calendar year following graduation. Systematic differences can be expected in the findings as an outcome may appear in the administrative data that was not relevant to a survey respondent at the time of the survey. For example, a graduate may have found substantial employment after the survey
but within the calendar year. Nevertheless, this comparison will highlight the strengths and weaknesses of both approaches and help in the interpretation of both types of report in the future.
The HEA report for 2014 had data for specific award types, did not distinguish between young and mature graduates and included only a subset of the higher education institutions for some of the findings.
For the rest of this chapter, the analysis of the administrative data is matched to the specific survey cohort, i.e., award types and institutions are matched and also mature graduates are included. Because of this, the administrative data in the rest of this chapter may differ from similar results elsewhere in this report.
30%, and as low as 16% for certain fields of study. Thus there is high potential for administrative data to fill this gap.

77Chapter 8: Comparing Administrative Data with Survey Data
Destination Outcomes8.2
Table 8.1. Comparable destination outcome categories for administrative and survey data comparison
Administrative Data Colour Survey Data
Substantial Employment In Employment in Ireland
Substantial Employment and Education < No equivalent category >
Re-enrolled in Education Further Studies/Training
Neither in Employment nor Education Seeking Employment
Not Captured In employment overseas
Unavailable for work/study
The destination outcomes of survey respondents were assigned to categories which are different to those used throughout this report. The
comparable categories from the HEA survey data and the administrative data used in this report are shown in Table 8.1.
The destination outcomes for graduates in the first year following graduation (from administrative data), and outcomes nine months after graduation (from HEA survey data), are shown in Figure 8.1. Both datasets include young and mature graduates with An Honours Bachelor’s Degree from University44.
There was no option on the HEA survey for graduates to indicate that they were both in employment and taking further studies. A comparison of the data in Figure 8.1 suggested that many graduates who were in both employment and education picked the category “further studies/training” in the HEA survey. For example, for the graduation year of 2014, 35% of HEA respondents said they were in “further studies/training” which matches well to the combined 32% of graduates who were classified in the administrative data as being in either “employment and education” or “education only”.
There is a reasonably good match between the HEA survey data and the administrative data for the categories “employed in Ireland” and
44 The group Honour’s Bachelor Degrees are broadly synonymous with NFQ level 8 awards, with 99% of Honour’s Bachelor’s Degrees being awarded at this level.
“substantial employment only” for 2010, 2012 and 2014. However in 2011 and 2013 the proportions are different by 6 and 8 percentage points respectively.
There is good agreement between the categories of “neither employment nor education” in the administrative data and “seeking employment” in the HEA survey data – these proportions differ by 1 percentage point or less and the trend in both datasets is similar. There was also good agreement between “not captured” in the administrative data and “unavailable for work, employed overseas” in the HEA survey data.
The destination outcomes for graduates from administrative data and the HEA survey are compared in Figure 8.2 by field of study. This chart has two bars for each field of study, the first for administrative data and the second for the HEA survey. The outcomes match well for most subject areas, providing that those who are in “employment and education” and “education only” from the administrative data are assumed to correlate to “further studies and training” in the HEA survey. However there are a few exceptions.

78 Chapter 8: Comparing Administrative Data with Survey Data
Figure 8.1. Destination Outcomes of graduates using administrative and survey data
The largest difference is for Services where the proportion in “further studies or training” in the HEA survey at 37% was significantly higher than the 22% in ‘‘education’’ according to the administrative data. Many of the courses subsequently taken by graduates from the field of Services (which includes detailed fields such as Military and Defence, Transport Services, Hair and Beauty Services, Hotel Restaurant & Catering and Sports) may be in non-HEA institutions. This would explain why a respondent could answer “further studies and training” in the HEA survey but then not appear as an enrolment in a HEA institution in the administrative data.
The proportion of graduates who were “not captured” in the administrative data matched the share who were “unavailable for work, employed overseas” in the HEA survey for most fields of study with the exceptions of Services, Health
& Welfare, and Education. For Services, the proportion in this residual category was 22% in the administrative data and just 8% in the HEA survey. This is likely to be related to a number of graduates being classified as “not captured” when in fact they are taking further studies at non-HEA institutions. The proportion “not captured” for Health & Welfare in the administrative data was 8% compared to 18% who were “unavailable for work, employed overseas” in the HEA survey, while in Education the proportion in this residual category was 11% in the administrative data and 18% in the HEA survey. It is possible that a number of graduates from Health & Welfare and Education had spent some time in employment in the administrative year but had emigrated by the time of the survey. Both of these fields saw a decline in weekly earnings for new graduates over the period of the survey (2011 to 2015), see Section 6.6.
41
45
46
47
50
38
39
42
39
48
22
20
22
23
23
13
12
11
10
9
42
41
37
40
35
8
7
7
7
6
8
7
7
6
5
16
16
14
13
12
12
13
13
15
12
Administrative Data
Survey Data
0 20 40 60 80 100
2010
2011
2012
2013
2014
2010
2011
2012
2013
2014
Proportion of Graduates (%)
Graduation Year
Administrative Data Survey Data
Substantial Employment only Employed in Ireland
Employment and Education One Empty One
Education Only Further Studies and Training
Neither Employment nor Education Seeking Employment
Not Captured Unavailable for work, Employed Overseas

79Chapter 8: Comparing Administrative Data with Survey Data
Figure 8.2. Destination Outcomes of graduates using administrative and survey data, by field of study (2014 graduates)
58
64
38
33
53
49
41
42
68
66
52
57
55
54
65
58
44
49
23
30
24
24
8
17
14
17
11
3
12
13
45
8
37
17
41
6
13
11
25
3
25
3
21
11
37
5
8
6
6
5
5
5
6
4
12
6
4
7
4
7
3
11
6
11
18
14
15
10
10
14
10
14
9
14
14
21
18
8
18
22
8
0 20 40 60 80 100
Education
Arts & Humanities
Social Science, Business & Law
Natural Sciences, Mathematics & Statistics
Information & Communication Technologies
Engineering, Manufacturing & Construction
Agriculture, Forestry, Fisheries & Veterinary
Health & Welfare
Services
Proportion of Graduates (%)
Administrative Data Survey Data
Substantial Employment only Employed in Ireland
Employment and Education One blank one
Education Only Further Studies and Training
Neither Employment nor Education Seeking Employment
Not Captured Unavailable for work, Employed Overseas

80 Chapter 8: Comparing Administrative Data with Survey Data
Earnings8.3
The HEA survey included details on the annual salaries of graduates (where salary was assigned to one of ten salary bands), but the response rate for this portion of the survey was low, in the region of 30% and ranged from 16% to 47% depending on the field of study. These results were compared with administrative data by extracting total earnings for graduates across all employment from the P35 dataset for the particular calendar year and assigning them to one of the ten salary bands.
Only graduates with an Honours Bachelor’s Degree were included in the administrative data so that it could be matched with the HEA survey data. The administrative data was further limited to those graduates in “substantial employment only” and excluded those in “employment and education”. This was done because all the comparisons between the HEA survey and administrative data suggest that those in both employment and in education predominantly self-identified as being in education in the HEA survey and thus it is reasonable to assume that the HEA survey data for salaries excludes those who are in both employment and education.
The results comparing graduate earnings from the HEA survey and administrative data are shown in Figure 8.3. (The Services field of study has been excluded due to the low number of HEA survey respondents.) For each field of study there is a high proportion of graduates with low salaries in the administrative data which are not represented by the survey data. There are a number of possible reasons for this, such as an unwillingness to respond to the survey, or because they were not in employment at the time of the survey. Graduates may also have quoted an annual salary level at the time of the HEA survey and later may have left employment or emigrated so that the administrative value did not reflect a full year’s pay.
Salaries for Agriculture & Veterinary graduates are higher in the HEA survey than in the administrative data and this may be due to incomes from self-employment which are not covered by the administrative data but may be particularly important for this group of graduates. There is also a large discrepancy between administrative and HEA survey data for Health & Welfare graduates, particularly in the €25,000 to €29,000 salary band which was the range for 29% of HEA survey respondents but just 13% of graduates in the administrative data.

81Chapter 8: Comparing Administrative Data with Survey Data
Figure 8.3. Annual earnings by Field of Study using Administrative and Survey data
Education
Arts & Humanities
Social Sciences, Business, Law, Journalism
Natural Sciences, Mathematics & Statistics
Information & Communication
Technologies
Engineering, Manufacturing &
Construction
Agriculture & Veterinary
Health & Welfare
1020304050
1020304050
1020304050
1020304050
<13 13-
17
17-
21
21-
25
25-
29
29-
33
33-
37
37-
41
41-
45
45+ <13 13-
17
17-
21
21-
25
25-
29
29-
33
33-
37
37-
41
41-
45
45+
Proportions ofGraduates by
Field of Study (%)
Annual Earnings, Range (thousands €)
Admin Data: Employment only Survey Data
82 Appendix A - Methodology
Appendix A - MethodologyA.1
Data Sources and Matching OverviewThe analysis datasets used are constructed by merging four separate data sources as follows
HEA Graduate and reenrolment data source
P35L and IT Form 11 data source from the Revenue Commissioners on employment records
CRS Central Record System from the Department of Social Protection related to Personal Public Service Numbers (PPSN)
CBR Central Business Register at CSO
The HEA Graduate data is the primary source of data and contains a record for each course undertaken as well as the award given. Details include the course name, NFQ (National Framework Qualification) level, degree class, field of study (ISCED broad, narrow and detailed fields). There are a few details on the graduates themselves including age and sex and it also contains the Personal Public Service Number. The PPSN facilitates merging with CRS to assign person based attributes and benefit information and also with P35 and IT Form 11 data for employment attributes.
The HEA also provide an enrolment data set that provides data on individuals for each year that they continue their studies in a particular course. The P35L administrative data source contains an Employer Registration Number (PREM number) that facilitates merging with the CBR to assign business based attributes to the employer. The P35L administrative data source also contains information on number of weeks of insurable work and reckonable pay (for tax purposes) for each employment record which can be used as
indicators of job volume and value (and can be combined to give mean reckonable pay).
The IT Form 11 data source contains data of self-assessed earnings. This is the primary source of information on the self-employed. The IT Form 11 data source contains information on self-employed turnover as well as time spent at the related activity; this can be used as an indicator of self-employed volume and value.
The CBR is the Business Register of enterprises maintained by CSO to support the compilation of statistics on business as laid down in EU statistical legislation. In general there is a one-to-one relationship between the enterprise number and the employer registration number. However in a small number of cases an enterprise group may pass all of its employment through a single PREM number attached to a single enterprise. Another type of exception occurs where an enterprise can comprise of a number of legal units and hence have multiple PREM numbers. The CBR also does not have comprehensive coverage of all employment sectors. These difficulties arise due to the lack of a Unique Business Identifier across all public administration systems and also the lack of a standard methodology to profile enterprises in the Public Sector.
The CRS is a master register of all PPSNs assigned and contains information collected at registration on date of birth, sex and nationality as declared by the applicant. Nationality has only been collected since 2002. Any PPSNs assigned prior to this period are given a nationality of Irish for the purposes of creating these analysis datasets (note that in the present study nationality is taken from the HEA data source). This is done on the basis that prior to 2002 Ireland did not have the same influx of foreign nationals as it did after the EU enlarged to EU 25. The PPSN
83Appendix A - Methodology
came into being in 1998 and replaced the old Revenue and Social Insurance (RSI) number used for tax and welfare purposes. The purpose of the PPSN is to uniquely identify persons/customers when engaging or transacting with the state and is assigned when a person first interacts with the State. For those born in Ireland the PPSN is assigned shortly after birth (and is required to avail of child benefit). It is acknowledged that there are some quality issues with respect to PPSNs inherited from the old RSI number such as duplicate numbers, persons being assigned more than one RSI number or an identical RSI number (with a suffix of M or F) for husband and wife. However for statistical purposes these quality issues are not considered significant.
All datasets are held in the CSO’s Administrative Data Centre (ADC). The ADC was set up in 2009 to act as an interface between the CSO and the public authorities that provide data. The ADC aims to streamline data flow, reduce the response burden of data providers, and promote good data governance in line with best practice in data protection. The ADC recognises that while the
individual sources have significant analytical potential, there is huge potential for new and improved statistical products, as well as improved data quality, when linking between administrative datasets is facilitated. Central to this is the development of the National Data Infrastructure (NDI) – a platform for linking datasets using unique identifiers for individuals, businesses and locations. The ADC has an important role in the development and coordination of the NDI across the government departments and agencies which make up the Irish Statistical System (ISS).
In line with its data protocols, CSO replaces the official PPSN on analysis based datasets with a proxy for PPSN called the CSOPPSN. It is this proxy that is used to link person based data. Further to this, identifiable information from each of these data sources is removed, such as name, date of birth, addresses and names of businesses/employers (in the case of employment data). The resulting data is then said to be pseudonymised and it is this data that is used for all Analysis.
HEA DataA.2
A.2.1
Graduates with Missing/Invalid PPSN
Rates of missing or invalid PPSN across a number of parameters are shown in Figure A.1, and rates across various fields of study are shown in Figure A.2. The group with the highest rate of missing PPSN is the Non-Irish category, in which only 40% of graduations had an associated PPSN. The variation in missing PPSN among the other parameters is closely associated with the proportions of Non-Irish graduates within those groups; for example there are higher rates of missing PPSN among NFQ level 9 and 10 graduates, and these are also the levels with the highest rates of Non-Irish graduates (as shown in Figure 3.2). Similarly the rates of missing or invalid PPSN is highest among those fields of study which had the highest proportions of Non-Irish graduates (see Figure 3.8).
As seen throughout this report, graduate outcomes are most closely related to variables such as field of study and NFQ level. A brief examination of the variations in outcomes by Nationality revealed that the differences were predominantly related to the types of courses preferred by non-Irish graduates. The outcomes throughout this report are therefore not adjusted for undercoverage of PPSN, since to do so would effectively correct for Nationality proportions, which is not a strong determinant of graduate outcomes.
The data for rates of missing PPSN is given here as a guide to the reader, and may be used to develop a clearer picture of the quality of the data and composition of the various groups.
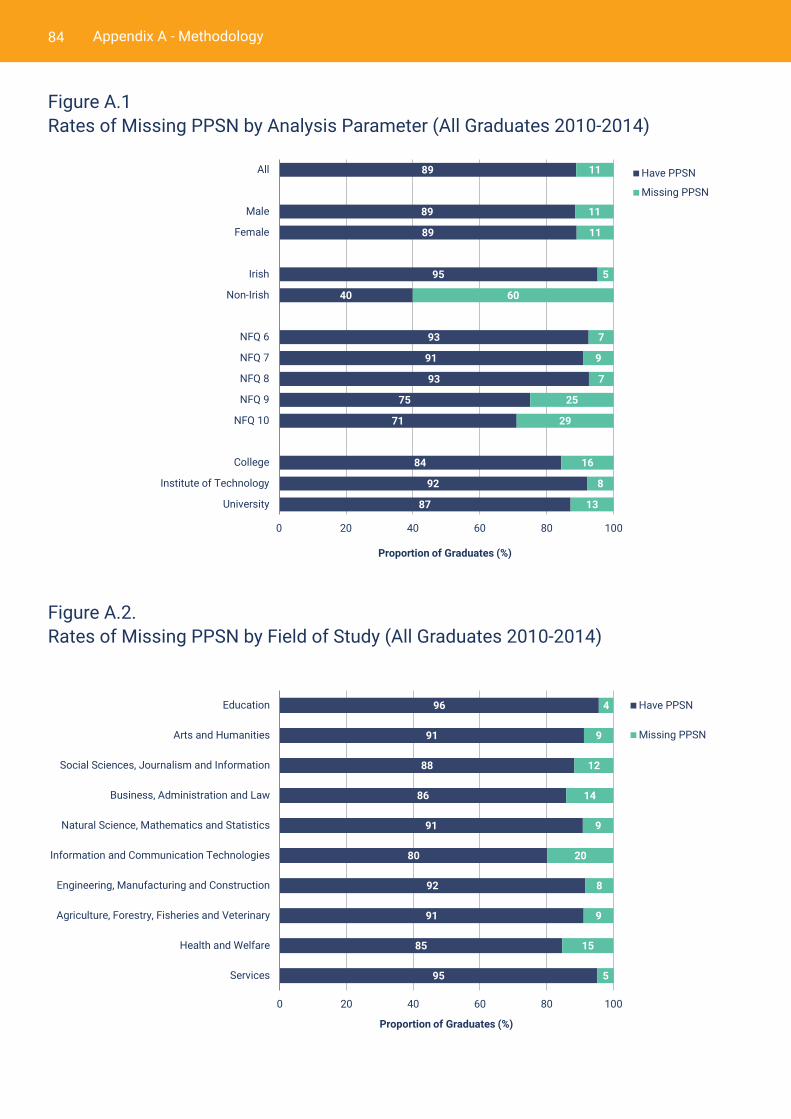
84 Appendix A - Methodology
Figure A.1 Rates of Missing PPSN by Analysis Parameter (All Graduates 2010-2014)
Figure A.2. Rates of Missing PPSN by Field of Study (All Graduates 2010-2014)
96
91
88
86
91
80
92
91
85
95
4
9
12
14
9
20
8
9
15
5
0 20 40 60 80 100
Education
Arts and Humanities
Social Sciences, Journalism and Information
Business, Administration and Law
Natural Science, Mathematics and Statistics
Information and Communication Technologies
Engineering, Manufacturing and Construction
Agriculture, Forestry, Fisheries and Veterinary
Health and Welfare
Services
Proportion of Graduates (%)
Have PPSN
Missing PPSN
89
89
89
95
40
93
91
93
75
71
84
92
87
11
11
11
5
60
7
9
7
25
29
16
8
13
0 20 40 60 80 100
All
Male
Female
Irish
Non-Irish
NFQ 6
NFQ 7
NFQ 8
NFQ 9
NFQ 10
College
Institute of Technology
University
Proportion of Graduates (%)
Have PPSN
Missing PPSN

Appendix A - Methodology 85
Classification of Fields of StudyA.2.2
Fields of study are classified according to the International Standard Classification of Education (ISCED), which is the UNESCO classification system for education and training. This classification system identifies broad, narrow and detailed fields of study. The framework was adjusted in 2012 and includes two new broad codes. This report uses these new broad ISCED fields, and on occasion reference is made to narrow or detailed fields of study where behaviour in a specific field is disproportionately affecting behaviour of the broad field.
The graduation and enrolment data up to and including 2012 uses the old ISCED coding. The mapping between these codes and the new broad ISCED codes (as used in this report), as well as the narrow fields within these broad fields, are illustrated in Figure A.3. The vast majority of courses could be simply mapped to a new equivalent broad ISCED field. A few more complex mapping conditions are outlined below:
Pre-2013 narrow fields Business & Administration and Law were mapped to the post-2013 broad field Business, Administration & Law. The remainder of the pre-2013 broad field, Social Science, Business and Law was mapped to the new broad field Social Sciences, Journalism & Information.
With the exception of Computing, the entire pre-2013 broad field of Science, Mathematics & Computing was mapped to Natural Sciences, Mathematics & Statistics, while the pre-2013 narrow field of Computing was mapped to the new broad field of Information & Communication Technologies.
The pre-2013 narrow field of Environmental Science (85) consisted of three detailed fields which were reassigned to new narrow fields under the ISCED revision. Graduates in this study were classified according to the detailed field. Environmental Protection Technology (851) was reassigned to Engineering, Manufacturing & Construction. Natural
Environments & Wildlife (852) was reassigned to Natural Sciences, Mathematics & Statistics. Community Sanitation Services (853) was reassigned to Services.
The ISCED framework prior to the 2013 revision included two fields, 90 – Balanced Combinations across different fields, and 91 – Balanced Combinations across Arts, Humanities, Social Science, Business & Law. There were approximately 1,000 young graduates from these fields in 2010 and 2011 but none in subsequent years and no equivalent field under the new framework. Therefore these courses were assigned to fields according to the course names. If the course name contained “Arts”, “Music” or “Philosophy” then it was reassigned to Arts & Humanities. If it contained “Commerce” or “Business” then it was reassigned to Business, Administration & Law. If it contained “Computer” it was reassigned to Information & Communication Technologies. These steps successfully assigned fields to all but approximately 80 graduates, who were then assigned to either Arts & Humanities or Natural Sciences, Mathematics & Statistics depending on whether the course name contained “BA” or “Science” (there were no conflicting cases).
Note that the broad field known as General/Generic Programmes was not included in the current study. The majority of graduates from these courses are mature; there were fewer than 250 young graduates from this category over the period 2010-2014. An examination of course names in this category reveals that the majority of courses appear to be aimed at individuals who are seeking to return to education as mature students. More than three quarters of graduates in this field of study completed a course with one of the following keywords in its title: Access, Foundation, Return/Returning, Preparatory, Continuing. Due to the small numbers involved, the nature of the courses and the difficulty in merging this field with any other, it was decided to exclude this field from the current study.

Appendix A - Methodology86
Post-2013 ISCED Fields
1 Education
11 Education
2 Arts and Humanities
21 Arts22 Humanities (except languages)23 Languages28 Interdisciplinary Arts/Humanities
3 Social Sciences, Journalism & Information
31 Social & Behavioural Sciences32 Journalism & Information38 Interdisciplinary
4 Business, Administration & Law
41 Business & Administration42 Law48 Interdisciplinary Business, Administration, Law
5 Natural Sciences, Mathematics & Statistics
51 Biological & Related Science52 Environment53 Physical Sciences54 Mathematics & Statistics58 Interdisciplinary Science
6 Information & Communication Technologies
61 Information & Communication Technologies68 Interdisciplinary ICT
7 Engineering, Manufacturing & Construction
71 Engineering & Engineering Trades72 Manufacturing & Processing73 Architecture & Construction
8 Agriculture, forestry, fisheries & veterinary
81 Agriculture82 Forestry83 Fisheries
Allocate according todetailed field
84 Veterinary
9 Health & Welfare
91 Health
92 Welfare
10 Services
Allocate according tocourse name
101 Personal Services102 Hygiene & Occupational Health Services103 Security Services104 Transport Services
0 Generic Programmes
Not included in thisreport
01 Basic Programmes02 Literacy & Numeracy03 Personal Skills & Development
Pre-2013 ISCED Fields
1 Education
14 Teacher Training & Education Science
2 Humanities & Arts
20 Combined Arts & Humanities 21 Arts22 Humanities
3 Social Sciences, Business & Law
30 Combined Social Science, Business & Law31 Social & Behavioural Science32 Journalism & Information34 Business & Administration38 Law
4 Science, Mathematics & Computing
40 Combined Science42 Life Sciences44 Physical Science46 Mathematics & Statistics48 Computing
5 Engineering, Manufacturing & Construction
50 Combined Engineering52 Engineering & Engineering Trades54 Manufacturing & Processing58 Architecture & Construction
6 Agriculture & Veterinary
60 Combined Agriculture & Veterinary62 Agriculture, Forestry & Fishery64 Veterinary
7 Health & Welfare
70 Combined Health & Welfare72 Health76 Social Services
8 Services
81 Personal Services84 Transport Services
85 Environmental Protection
86 Security Services
90 Balanced Combination across Different Fields of Education
91 Balanced Combination across Arts, Humanities, Social Science, Business & Law
0 General Programmes1 Basic Programmes8 Literacy & Numeracy9 Personal Development
A.3. Mapping between old and new ISCED field of study codes

Appendix A - Methodology 87
Degree ClassA.2.3
Only degrees awarded at NFQ level 8 were considered where outcomes were analysed by degree class. The degree classes considered were First Class Honours (H1), Upper Second Class Honours (H21), Lower Second Class Honours (H22) and Third Class Honours (H3). Since some courses and institutions use slightly different grading classification systems, the grades awarded for each course in every institution were analysed, and certain records were re-assigned to one of the four standard classifications listed above. In cases where a course awarded a grade of Pass instead of H3, these were re-assigned to H3. Some courses break up the range normally assigned to a H3 into two classes, H3 and Pass (e.g. 40-45% = Pass, 45-50% = H3) and these
were also both assigned to H3. In some courses, particularly in the area of Health, a classification consisting of H1, H2/Other Honour and Pass is used, where H2 or Other Honour corresponds to the same percentage score associated with H21, and Pass corresponds to the score associated with H22 . These were re-assigned as appropriate. Some courses use a four-tier system of Distinction, Merit 1, Merit 2 and Pass, and these were reassigned to H1, H21, H22 and H3 (respectively) as the associated percentage scores are the same. Finally, some courses have Pass or Fail grades only, and it was necessary to excluded these. This was done by identifying courses with 5 graduates or more where Pass was the only degree class awarded.
Institutes and Institute TypesA.2.4
Certain sections of the report are broken down by Institute type. The specific institutes included in each category are listed below. Note that while some of the Colleges are affiliated or incorporated
with certain Universities, they are considered here as separate institutions and have graduates in each of the years from 2010 to 2014.
UniversitiesUniversity College Cork Dublin City University
University College Dublin National University of Ireland, Galway
University of Limerick Maynooth University
Trinity College Dublin
Institutes of TechnologyAthlone Institute of Technology Institute of Technology Blanchardstown
Cork Institute of Technology Institute of Technology Carlow
Dundalk Institute of Technology Dún Laoghaire Institute of Art, Design and Technology
Dublin Institute of Technology Galway-Mayo Institute of Technology
Limerick Institute of Technology Letterkenny Institute of Technology
Institute of Technology Sligo Institute of Technology Tallaght
Institute of Technology Tralee Waterford Institute of Technology
CollegesNational College of Art and Design St. Angela's College, Sligo
Mater Dei Institute of Education Mary Immaculate College
St Patrick's College Royal College of Surgeons in Ireland

Appendix A - Methodology88
Young and Mature DefinitionsA.2.5
For distinction of young and mature graduates, we used the same criteria that the New Zealand Ministry of Education have applied in several reports in this area , which uses age in
combination with the award type. The threshold ages for each award type are shown in Table A.1. Note that the relationship between award type and NFQ level is not precisely one-to-one.
Table A.1. Threshold Ages for Young Graduates for each Award Type
Award TypeMaximum Age to classify
as “Young” Graduate
Certificate 21
Ordinary Degree 23
Higher Degree 24 plus 1 for each course year beyond three years
Postgraduate Qualification 26
Master’s 27
Ph.D. 29
Graduates with more than one Graduation per year
A.2.6
Graduates were sometimes recorded as having received more than one higher education award in a single year. Typical examples include a course which was jointly hosted by more than one institute, or a graduate who received a diploma in education in combination with an award for completing a degree course. If the award types were different, it is possible for a graduate to be classified as young in the case of one award and mature in the case of another within the same year. In such cases the duplication would not have to be dealt with since the mature graduations were already excluded.
It was desirable for the purposes of data matching that there be only one graduation record per year per individual. In cases where an individual graduated from more than one course, then
the course with the higher NFQ level was kept. In cases where a graduate had more than one course with equal NFQ level, then one course was kept according to a hierarchy based on Award Type (note that the relationship between NFQ level and award type is not precisely one-to-one), with the following order of preference from highest to lowest applied: Ph.D., Master’s, Honours Degree, Ordinary Degree, Postgraduate Qualification, Certificate. There were approximately 320 cases which still had no higher-ranking course, and in these cases one of the two courses was selected at random. In 90% of these cases the narrow ISCED field was the same for both courses, and from an examination of course names the vast majority appear to be courses that are jointly hosted by two institutes, or duplications of the same award within one institute.

89Appendix A - Methodology
Re-Enrolment DataA.2.7
Re-enrolment of graduates in further third-level education was analysed using a dataset on enrolments provided by the HEA, which includes a record for each academic year that an individual is enrolled. Since the academic year spans two calendar years, for the purposes of our outcomes analysis a graduate was considered to be re-enrolled in both of the calendar years covered by an academic year, e.g. an individual enrolled in 2013/2014 was categorised as being in education in both 2013 and 2014. Certain types of course
which were excluded from the graduation dataset such as FETAC courses, professional training qualifications and courses in the General/Generic field (ISCED code 0) were not excluded from the enrolment dataset. E.g. a graduate from a FETAC course is not included in the outcomes analysis, but a person who graduates with an Honours Bachelor’s Degree and subsequently begins a FETAC course is considered to be in ‘‘education’’ from the perspective of assigning a destination outcome.
Excluded categories of students A.2.8
Graduates were excluded from the study if they were recorded as being an “overseas student”. These are students who attend a campus which is associated with an Irish institution but located in a different country.
Graduates were excluded from the study if they were recorded as being involved in a number of upskilling programmes, including the Springboard programme, the Labour Market Activation programme and the ICT Skills Conversion programme.
As mentioned above, graduates in General/Generic courses (broad ISCED field 0) were also excluded from the study, as these are primarily
courses which are aimed at helping individuals return to education.
A number of course types were excluded from the analysis, including Access/Foundation courses, FETAC Certificates, Professional Training Qualifications, undergraduate diplomas and occasional courses.
In the graduation years studied, between 4,500 and 9,000 graduations per year fell into one or more of these excluded categories, and these are not included in the figures for graduates and graduations given in Chapter 3, or in any of the subsequent outcomes analysis chapters.
90 Appendix A - Methodology
In cases where an individual had more than one occupation in a single year, then the business size associated with that individual for that year was
taken from their main employer. Each employer was assigned to a category for business size based on their effective number of employees:
Effective Number of Employees
No. of unique employees in year
52
Average number of weeks worked×=
Revenue Data SourceA.3
P35 DataA.3.1
Employment data from the P35 data source includes one record for each occupation of every individual. Each record includes the number of weeks of insurable work and the gross pay received by the employee. It does not include the hourly wage or the number of hours worked. The Main Employer for each individual is the one which contributes the single largest pay to that individual over the course of the year. The average Weekly Earnings for each individual is found using data from the main employer only, and is calculated as the gross pay divided by the number of weeks of insurable work. Earnings are adjusted for inflation by multiplying by a factor based on the Consumer Price Index (CPI, base = December 2016). The multiplication factors for each year are given in Table A.2.
The P35 dataset does not contain an occupation code which may provide greater information on the type of work carried out by each employee. It does contain a NACE code which is associated
with the main activity of the employer, rather than that of the employee. In cases where an individual had more than one employment in a single year, then the NACE code associated with that individual for that year was taken from the main employer. In cases where a NACE code was not included with the record for the main employer, then the individual was excluded from any analysis where breakdown was given by NACE code (sections 5.2, 5.4.2 and 7.3), but included in all other analyses such as earnings and destination outcomes.
The Business Size was calculated using all P35 data for that year. The number of unique individuals associated with each enterprise number within that calendar year was calculated. The average number of weeks worked for each enterprise was also calculated, and this was used as a weighting factor for the effective number of people employed within the year. Thus, the effective number of employees was calculated as:
Business Size Number of Employees
Micro < 10
Small 10 - 49
Medium 50 - 249
Large > 250

Appendix A - Methodology 91
IT Form 11 DataA.3.2
The self-employment dataset can contain data from a number of previous years, but for the purposes of outcomes analysis it was desirable to consider outcomes within specific calendar years only. All self-employment records spanning all of the outcome years were therefore first combined into a single dataset, and the turnover and number of days associated with each activity were calculated. The turnover here includes income from sales, receipts from Government agencies and other income including tax exempt income. Each activity was then assigned to one or more calendar years depending on the start and end dates associated with that activity. The turnover associated with that activity was subdivided into each of those calendar years depending on the proportion of days associated with that activity which were in each of those calendar years. Note that turnover was adjusted for inflation in the same way as P35 earnings (see Section A.3.1).
Example A: An activity began in March 2012 and ended in August 2012, and the turnover is €6,000. In this case 100% of the turnover would be assigned to 2012.
Example B: An activity began 100 days before the end of 2012 and ended 200 days into 2013, and the turnover is €15,000. In this case the turnover would be subdivided in the ratio 1:2 into the calendar years 2012 and 2013, i.e. €5,000 in 2012 and €10,000 in 2013.
The Total Turnover for each calendar year was then calculated as the sum of all of the portions of turnovers which were assigned to that year.
Thus, if both of the examples A and B above were associated with a single individual, their total turnover for 2012 would be the €6,000 from example A plus the €5,000 portion from example B, leading to a total turnover for 2012 of €11,000. Their total turnover for 2013 would be the associated portion of example B, i.e. €10,000.
Each self-employment record had an associated NACE code. For outcomes analysis it was desirable to have a single NACE code associated with each calendar year. In cases where there was more than one self-employment record assigned to a single calendar year, then the NACE code for that individual for that year was taken from the record which contributed the single greatest portion of turnover to that calendar year. In our example where a single individual carried out both activities in examples A and B above in separate self-assessment records, their NACE code for 2012 would be that of the activity in example A, since this activity contributed €6,000 to the total turnover for 2012 while the activity in example B contributed only €5,000 to the total turnover in 2012.
The IT Form 11 also allows a spouse to declare self-employment income, and the appropriate PPSN is also supplied. These make up approximately 10.5% of all entries in the IT Form 11 dataset.
Business size is not available for self-employed persons, unless they are also engaged in substantial P35 employment, in which case business size refers to that occupation.
Table A.2Year CPI (base = Dec. 2016) Multiplication Factor for Earnings (100/CPI)
2007 97.3 1.03
2008 101.2 0.99
2009 96.7 1.03
2010 95.8 1.04
2011 98.3 1.02
2012 99.9 1.00
2013 100.4 1.00
2014 100.6 0.99
2015 100.3 1.00
2016 100.3 1.00

Appendix A - Methodology92
Not Captured and Neither Employment nor EducationA.3.5
Where a graduate was neither in substantial employment nor re-enrolled in education within a specific calendar year, then they may be assigned to one of two remaining categories: Neither Employment nor Education and Not Captured. A graduate is assigned to Neither Employment nor Education if they appear in any of the datasets for that year without being classified as being in substantial employment or re-enrolled in education. The following is a list of examples of situations where a graduate would fall into this category.
The graduate had a total number of weeks of insurable work which was less than 12.
The graduate had an average weekly earnings of less than €100 per week from their main employer.
The graduate had a self-employment activity but had a total turnover within that calendar year of less than €1,000.
Substantial EmploymentA.3.4
An individual is regarded as being in Substantial Employment within a given calendar year if they fulfil either of the criteria A or B below.
A. Substantial P35 Employment - They fulfil the following two requirements
1. They have at least 12 weeks of insurable work within the calendar year across all employments. This can be supplemented by weeks of maternity leave and/or illness leave.
2. The average weekly earnings from their main employer only is at least €100 per week.
B. Substantial Self-Employment - Their total turnover across all self-employment
activities is at least €1,000 within the calendar year.
Note that a graduate may have more than 12 weeks of maternity leave or illness leave (thereby fulfilling the sub-criterion A.1), but without at least one week of insurable work they will not have a value for weekly earnings which can satisfy the sub-criterion A.2.
In cases where an individual had both Substantial P35 Employment and Substantial Self-Employment within the same calendar year, and where the NACE codes from those two occupations differed, the NACE code for outcomes analysis was taken from the occupation which had the longest duration.
Benefits DataA.3.3
The CRS (Central Records System) data source includes data on a wide range of benefits, including Jobseekers Allowance, Jobseekers Benefit, Maternity benefit and Disability benefits. A note was taken as to whether or not each graduate received any benefit in this dataset for each year. This indicator could be used to distinguish between the outcome categories of “Not captured” and “In neither Employment nor
Education”. More specifically, a graduate could not be categorised as Not Captured within a calendar year if they received any benefit on the CRS data source during that year.
The total number of weeks spent in receipt of illness and/or maternity benefits within each year was also calculated, as this was used as an input into the classification for substantial employment.

93Appendix A - Methodology
Job ChurnA.3.6
The graduate received some benefit, e.g. disability benefit or jobseekers allowance.
A graduate is assigned to the category of Not Captured if they do not appear in any of the datasets for that year, and have no recorded activities such as those listed above.
Most of these graduates categorised as Not
Captured are assumed to have emigrated or returned to their country of origin, but it is possible that a graduate remained in the country but was not captured by any of the administrative data. It is also possible that a graduate had emigrated but engaged in some activity which was captured by the administrative data, and therefore was categorised as being in Neither Employment nor Education.
For the 2010 graduates, the total number of distinct employers and the number of distinct NACE sectors worked in over the years 2011-2015 were calculated for each individual. These include all employments and not just main employers for each year, and graduates could have more than one distinct NACE code in a single year for the purposes of this calculation. These counts included employment from the P35 dataset only, and did not include self-employment activities from the self-assessment dataset. Counts were calculated for “substantial employment” as well as for “all employment”. The classification for “substantial” used the same two requirements as used in criterion A in Section A.3.4, (rest of this sentence is the same).
Self-employment is not included in the job churn analysis for a number of reasons. One reason is that the number of distinct self-employments undertaken by an individual is not well-defined for self-employment as it is for P35 employments, since a single period of self-employment can
be reported in a variety of ways. For example a period of self-employment over three years could be reported on an annual basis or in a single assessment. Additionally, the IT Form 11 Dataset only includes a single NACE code for each individual for each year, even where a number of dissimilar activities were undertaken. Therefore it is not possible to reliably calculate a number of distinct NACE codes for self-employed persons. The exclusion of self-employment data may lead to job churn figures being understated, particularly for courses associated with higher rates of self-employment, such as Agriculture, Forestry, Fisheries and Veterinary.
Graduates who were Not Captured for any of the years from 2011 to 2015 were excluded from the analysis on Job Churn. This was done to exclude individuals who had emigrated and would therefore lead to an understatement in the numbers for distinct employers and NACE sectors, particularly in fields of study associated with high rates of emigration.

Glossary94
GlossaryADC Administrative Data Centre – Division in the CSO
responsible for the development, management and processing of administrative data
CBR Central Business Register
CRS Central Record System (Department of Social Protection)
CSO Central Statistics Office
Distinction M1 M2 Pass Degree classification system commonly used at NFQ levels 6 and 7 which are analogous to H1, H21, H22 and H3. M1 and M2 are Merit 1 and Merit 2.
Education (Outcome Destination category)
The graduate is regarded as being in education in a particular calendar year if they are enrolled in a course in either of the two academic years that overlap that calendar year.
ESRI Economic and Social Research Institute
H1 H21 H22 H3 Most commonly used degree classification system
HEA Higher Education Authority
HEI Higher Education Institution
ISCED International Standard Classification of Education. The broad ISCED codes are used as the basis for the fields of study in this report (see A.2.2)
ISS Irish Statistical System
M1 M2 See ‘Distinction M1 M2 Pass’
Main employer The employer which contributed the largest earnings to the graduate in a single calendar year
Mature Graduate Young/Mature classification of graduates is based on the age of the graduate at the time of graduation and the award type (see A.2.3)
NACE Statistical Classification of Economic Activities in the European Community. The industry sectors in this report are based on the alphabetical letter of the NACE code (Revision 2)

Glossary 95
NDI National Data Infrastructure
Neither employment nor education
Outcome Destination category – Graduate is not in substantial employment and is not re-enrolled in education, but appears at least once in administrative data (some employment, benefits, etc.)
Not captured Outcome Destination category – Graduate is not in substantial employment and is not re-enrolled in education, and furthermore appears nowhere in the administrative data for that year.
NFQ (Level). National Framework of Qualifications - a framework through which all learning achievements may be measured and related to each other in a coherent way, based on their level of knowledge, skill and competence. In this report NFQ levels 6 to 10 are examined. Level 6 includes Advancced Certificates and Higher Certificates, while levels 7 and 8 predominantly correspond to Ordinary and Honours Bachelor’s Degrees, respectively. Master’s Degrees and Postgraduate Diplomas are at level 9 and Doctoral Degrees (Ph.D.) are level 10
Pass (Degree class) See ‘Distinction M1 M2 Pass’
PPSN Personal Public Services Number
QNHS Quarterly National Household Survey
QQI Quality and Qualifications Ireland
SLMRU Skills and Labour Market Research Unit
Substantial Employment Outcome Destination category – Graduates have substantial P35 employment and/or substantial self-employment
Substantial P35 Employment
Graduates had at least 12 weeks of work across all employments, and average weekly earnings with main employer was at least €100. Weeks of work can be compensated by weeks of illness or maternity benefit, except in relation to Job Churn analysis. See A.3.4 for further details
Substantial Self-Employment Graduates’ total turnover across all self-employment activities is at least €1,000 within the calendar year
Young Graduate See ‘Mature Graduate’

Chapter 1: Policy Context96
Designed and printed by the Central Statistics Office

Designed and printed by the Central Statistics Office