Embed Size (px)
Citation preview
1
India
Country Summary of Higher Education
1. Background 1.1: Current Status
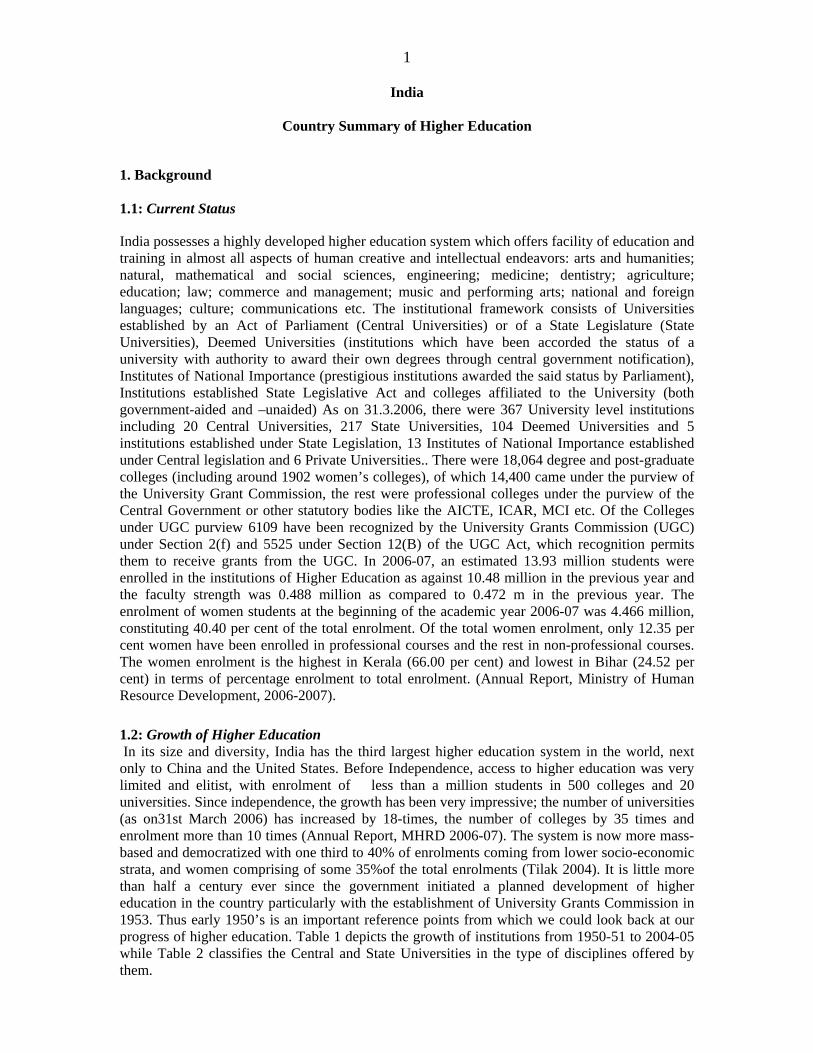
India possesses a highly developed higher education system which offers facility of education and training in almost all aspects of human creative and intellectual endeavors: arts and humanities; natural, mathematical and social sciences, engineering; medicine; dentistry; agriculture; education; law; commerce and management; music and performing arts; national and foreign languages; culture; communications etc. The institutional framework consists of Universities established by an Act of Parliament (Central Universities) or of a State Legislature (State Universities), Deemed Universities (institutions which have been accorded the status of a university with authority to award their own degrees through central government notification), Institutes of National Importance (prestigious institutions awarded the said status by Parliament), Institutions established State Legislative Act and colleges affiliated to the University (both government-aided and –unaided) As on 31.3.2006, there were 367 University level institutions including 20 Central Universities, 217 State Universities, 104 Deemed Universities and 5 institutions established under State Legislation, 13 Institutes of National Importance established under Central legislation and 6 Private Universities.. There were 18,064 degree and post-graduate colleges (including around 1902 women’s colleges), of which 14,400 came under the purview of the University Grant Commission, the rest were professional colleges under the purview of the Central Government or other statutory bodies like the AICTE, ICAR, MCI etc. Of the Colleges under UGC purview 6109 have been recognized by the University Grants Commission (UGC) under Section 2(f) and 5525 under Section 12(B) of the UGC Act, which recognition permits them to receive grants from the UGC. In 2006-07, an estimated 13.93 million students were enrolled in the institutions of Higher Education as against 10.48 million in the previous year and the faculty strength was 0.488 million as compared to 0.472 m in the previous year. The enrolment of women students at the beginning of the academic year 2006-07 was 4.466 million, constituting 40.40 per cent of the total enrolment. Of the total women enrolment, only 12.35 per cent women have been enrolled in professional courses and the rest in non-professional courses. The women enrolment is the highest in Kerala (66.00 per cent) and lowest in Bihar (24.52 per cent) in terms of percentage enrolment to total enrolment. (Annual Report, Ministry of Human Resource Development, 2006-2007). 1.2: Growth of Higher Education In its size and diversity, India has the third largest higher education system in the world, next only to China and the United States. Before Independence, access to higher education was very limited and elitist, with enrolment of less than a million students in 500 colleges and 20 universities. Since independence, the growth has been very impressive; the number of universities (as on31st March 2006) has increased by 18-times, the number of colleges by 35 times and enrolment more than 10 times (Annual Report, MHRD 2006-07). The system is now more mass-based and democratized with one third to 40% of enrolments coming from lower socio-economic strata, and women comprising of some 35%of the total enrolments (Tilak 2004). It is little more than half a century ever since the government initiated a planned development of higher education in the country particularly with the establishment of University Grants Commission in 1953. Thus early 1950’s is an important reference points from which we could look back at our progress of higher education. Table 1 depicts the growth of institutions from 1950-51 to 2004-05 while Table 2 classifies the Central and State Universities in the type of disciplines offered by them.
2
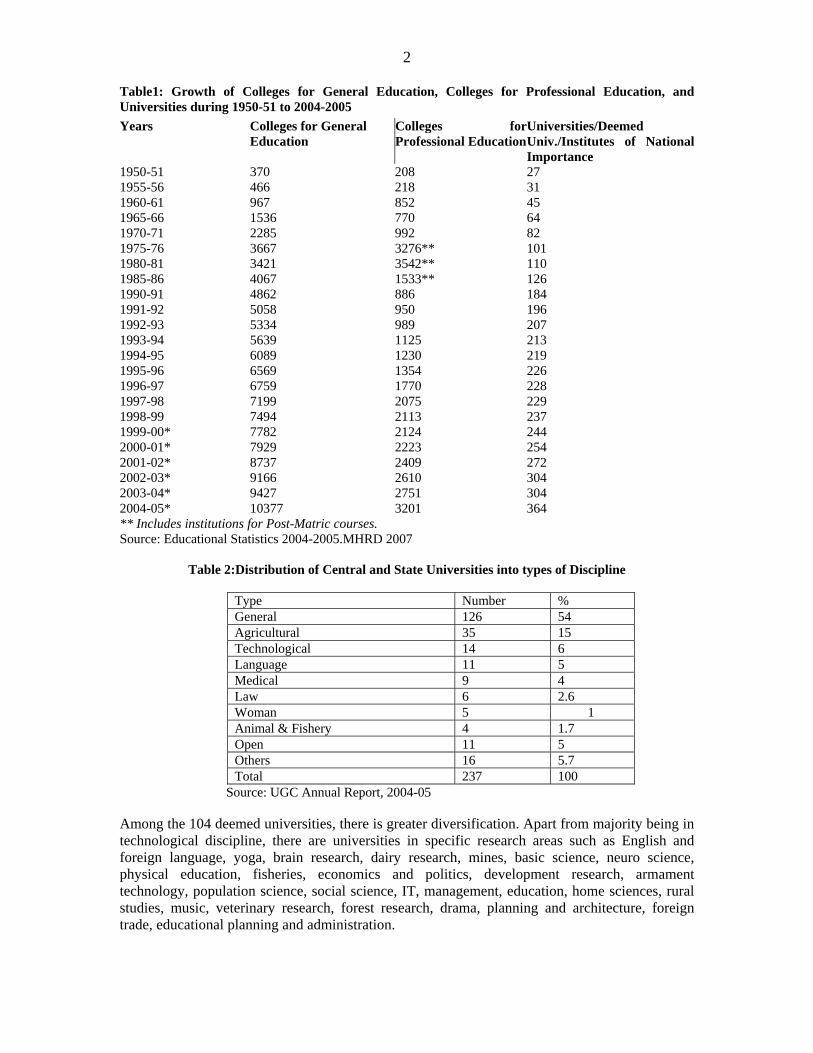
Table1: Growth of Colleges for General Education, Colleges for Professional Education, and Universities during 1950-51 to 2004-2005 Years Colleges for General
Education Colleges forProfessional Education
Universities/Deemed Univ./Institutes of National Importance
1950-51 370 208 27 1955-56 466 218 31 1960-61 967 852 45 1965-66 1536 770 64 1970-71 2285 992 82 1975-76 3667 3276** 101 1980-81 3421 3542** 110 1985-86 4067 1533** 126 1990-91 4862 886 184 1991-92 5058 950 196 1992-93 5334 989 207 1993-94 5639 1125 213 1994-95 6089 1230 219 1995-96 6569 1354 226 1996-97 6759 1770 228 1997-98 7199 2075 229 1998-99 7494 2113 237 1999-00* 7782 2124 244 2000-01* 7929 2223 254 2001-02* 8737 2409 272 2002-03* 9166 2610 304 2003-04* 9427 2751 304 2004-05* 10377 3201 364 ** Includes institutions for Post-Matric courses. Source: Educational Statistics 2004-2005.MHRD 2007
Table 2:Distribution of Central and State Universities into types of Discipline
Type Number % General 126 54 Agricultural 35 15 Technological 14 6 Language 11 5 Medical 9 4 Law 6 2.6 Woman 5 1 Animal & Fishery 4 1.7 Open 11 5 Others 16 5.7 Total 237 100
Source: UGC Annual Report, 2004-05 Among the 104 deemed universities, there is greater diversification. Apart from majority being in technological discipline, there are universities in specific research areas such as English and foreign language, yoga, brain research, dairy research, mines, basic science, neuro science, physical education, fisheries, economics and politics, development research, armament technology, population science, social science, IT, management, education, home sciences, rural studies, music, veterinary research, forest research, drama, planning and architecture, foreign trade, educational planning and administration.
3
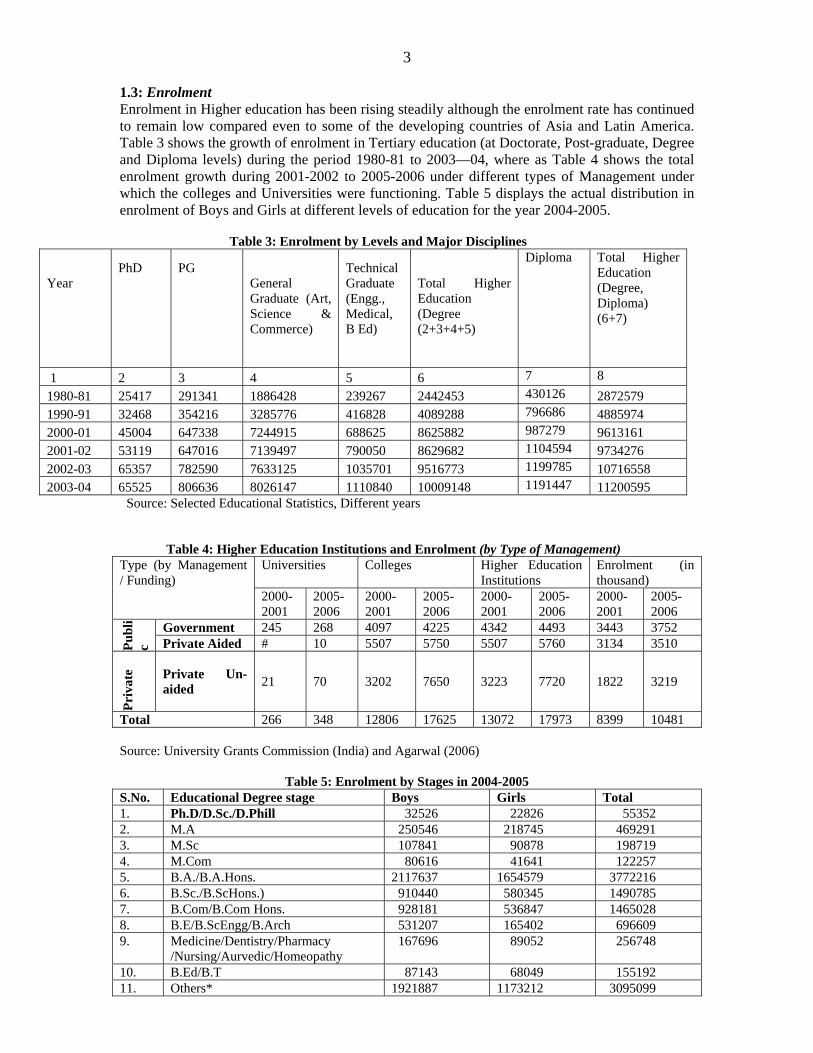
1.3: Enrolment Enrolment in Higher education has been rising steadily although the enrolment rate has continued to remain low compared even to some of the developing countries of Asia and Latin America. Table 3 shows the growth of enrolment in Tertiary education (at Doctorate, Post-graduate, Degree and Diploma levels) during the period 1980-81 to 2003—04, where as Table 4 shows the total enrolment growth during 2001-2002 to 2005-2006 under different types of Management under which the colleges and Universities were functioning. Table 5 displays the actual distribution in enrolment of Boys and Girls at different levels of education for the year 2004-2005. Table 3: Enrolment by Levels and Major Disciplines
Year
PhD
PG
General Graduate (Art, Science & Commerce)
Technical Graduate (Engg., Medical, B Ed)
Total Higher Education (Degree (2+3+4+5)
Diploma Total Higher Education (Degree, Diploma) (6+7)
1 2 3 4 5 6 7 8 1980-81 25417 291341 1886428 239267 2442453 430126 2872579 1990-91 32468 354216 3285776 416828 4089288 796686 4885974 2000-01 45004 647338 7244915 688625 8625882 987279 9613161 2001-02 53119 647016 7139497 790050 8629682 1104594 9734276 2002-03 65357 782590 7633125 1035701 9516773 1199785 10716558 2003-04 65525 806636 8026147 1110840 10009148 1191447 11200595
Source: Selected Educational Statistics, Different years Table 4: Higher Education Institutions and Enrolment (by Type of Management)
Universities Colleges Higher Education Institutions
Enrolment (in thousand)
Type (by Management / Funding)
2000-2001
2005-2006
2000-2001
2005-2006
2000-2001
2005-2006
2000-2001
2005-2006
Government 245 268 4097 4225 4342 4493 3443 3752
Publ
ic Private Aided # 10 5507 5750 5507 5760 3134 3510
Priv
ate Private Un-
aided 21 70 3202 7650 3223 7720 1822 3219
Total 266 348 12806 17625 13072 17973 8399 10481 Source: University Grants Commission (India) and Agarwal (2006)
Table 5: Enrolment by Stages in 2004-2005 S.No. Educational Degree stage Boys Girls Total 1. Ph.D/D.Sc./D.Phill 32526 22826 55352 2. M.A 250546 218745 469291 3. M.Sc 107841 90878 198719 4. M.Com 80616 41641 122257 5. B.A./B.A.Hons. 2117637 1654579 3772216 6. B.Sc./B.ScHons.) 910440 580345 1490785 7. B.Com/B.Com Hons. 928181 536847 1465028 8. B.E/B.ScEngg/B.Arch 531207 165402 696609 9. Medicine/Dentistry/Pharmacy
/Nursing/Aurvedic/Homeopathy 167696 89052 256748
10. B.Ed/B.T 87143 68049 155192 11. Others* 1921887 1173212 3095099
4
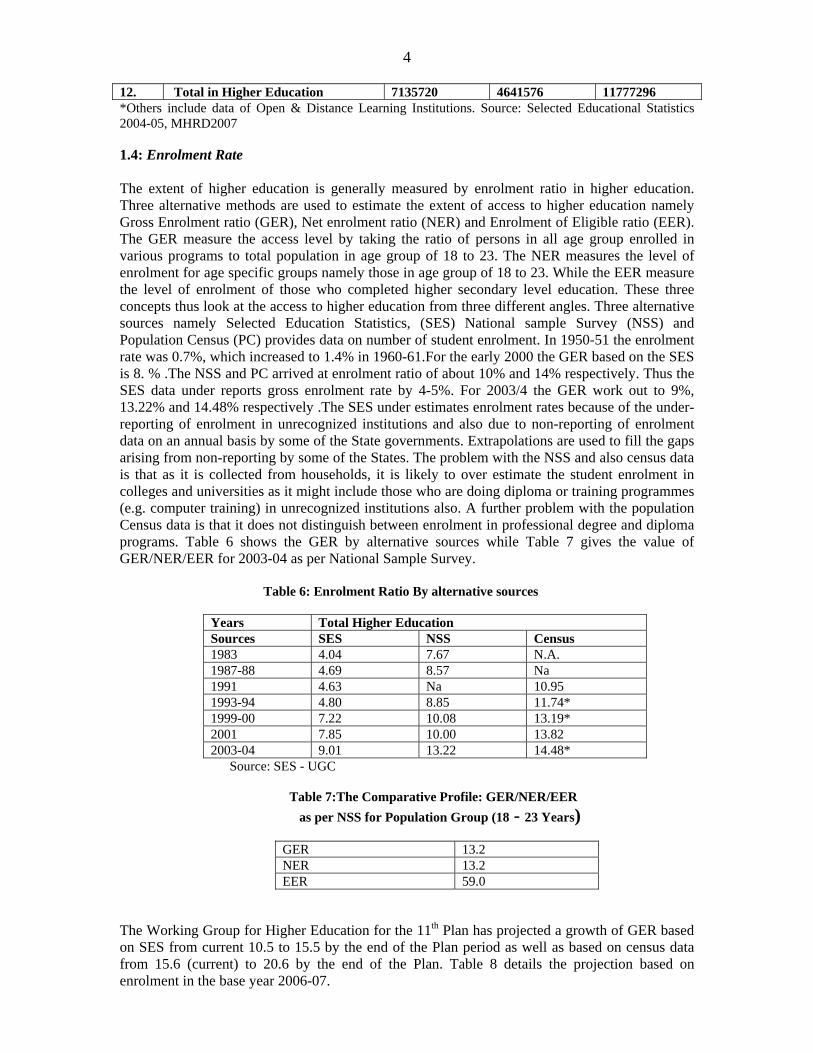
12. Total in Higher Education 7135720 4641576 11777296 *Others include data of Open & Distance Learning Institutions. Source: Selected Educational Statistics 2004-05, MHRD2007 1.4: Enrolment Rate The extent of higher education is generally measured by enrolment ratio in higher education. Three alternative methods are used to estimate the extent of access to higher education namely Gross Enrolment ratio (GER), Net enrolment ratio (NER) and Enrolment of Eligible ratio (EER). The GER measure the access level by taking the ratio of persons in all age group enrolled in various programs to total population in age group of 18 to 23. The NER measures the level of enrolment for age specific groups namely those in age group of 18 to 23. While the EER measure the level of enrolment of those who completed higher secondary level education. These three concepts thus look at the access to higher education from three different angles. Three alternative sources namely Selected Education Statistics, (SES) National sample Survey (NSS) and Population Census (PC) provides data on number of student enrolment. In 1950-51 the enrolment rate was 0.7%, which increased to 1.4% in 1960-61.For the early 2000 the GER based on the SES is 8. % .The NSS and PC arrived at enrolment ratio of about 10% and 14% respectively. Thus the SES data under reports gross enrolment rate by 4-5%. For 2003/4 the GER work out to 9%, 13.22% and 14.48% respectively .The SES under estimates enrolment rates because of the under-reporting of enrolment in unrecognized institutions and also due to non-reporting of enrolment data on an annual basis by some of the State governments. Extrapolations are used to fill the gaps arising from non-reporting by some of the States. The problem with the NSS and also census data is that as it is collected from households, it is likely to over estimate the student enrolment in colleges and universities as it might include those who are doing diploma or training programmes (e.g. computer training) in unrecognized institutions also. A further problem with the population Census data is that it does not distinguish between enrolment in professional degree and diploma programs. Table 6 shows the GER by alternative sources while Table 7 gives the value of GER/NER/EER for 2003-04 as per National Sample Survey.
Table 6: Enrolment Ratio By alternative sources
Years Total Higher Education Sources SES NSS Census 1983 4.04 7.67 N.A. 1987-88 4.69 8.57 Na 1991 4.63 Na 10.95 1993-94 4.80 8.85 11.74* 1999-00 7.22 10.08 13.19* 2001 7.85 10.00 13.82 2003-04 9.01 13.22 14.48*
Source: SES - UGC Table 7:The Comparative Profile: GER/NER/EER as per NSS for Population Group (18 - 23 Years)
GER 13.2 NER 13.2 EER 59.0
The Working Group for Higher Education for the 11th Plan has projected a growth of GER based on SES from current 10.5 to 15.5 by the end of the Plan period as well as based on census data from 15.6 (current) to 20.6 by the end of the Plan. Table 8 details the projection based on enrolment in the base year 2006-07.

5
Table 8: Current and 11th Plan Enrolment Rates based on SES and Census Data
Year Academic Year
Population 18-23 Years
Total Higher Education enrolment based on SES
Total GER based on SES
Total Higher Education enrolment based on Census Data
Total GER based on Census Data
Base Year 2006 2006-07 132243 13934 10.5 20666 15.6 11th Plan 2007 2007-08 135440 15034 11.1 22212 16.4 2008 2008-09 138318 16460 11.9 23929 17.3 2009 2009-10 141257 18222 12.9 25850 18.3 2010 2010-11 144259 20341 14.1 27986 19.4 2011 2011-12 144287 22365 15.5 29723 20.6
Source: Draft Report of Working Group on Higher Education for 11th Five-year Plan. 1.5:Discipline wise Output of Graduates and Post-graduates: The output of the Higher Education Institutions in terms of graduates and Post-graduates is shown in Tables 9A and 9B respectively for the Year 2003. Table 9A: Graduate Output during 2003. No. Faculty/Course Pass out
Male Pass out Female
Pass out Total
1. Arts-B.A level courses 547324 425396 972720 2. Science-B.Sc level Courses 196058 131717 327775 3. Commerce-B.Com level Courses 227744 145448 373192 4. Education-B.E 58258 47790 106048 5. Engineering/Technology-B.E level Courses 101143 26467 127610 6. Medicine-Bachelor level courses 22756 16031 38787 7. Agriculture-Bachelor level Courses 6524 1277 7801 8. Vet. Science-Bachelor level Courses 1151 346 1497 9. Law-LL.B level courses 47008 11220 58228 10. Others: Lib.Sc, Journalism, Phy.Edn., Music, Fine Arts,
Computer Appl., Performing Arts, Mass Comm, Visual Arts, Theatre, Hospitality Mgt. etc.-Bachelor level courses
27478 11061 38539
11 Total Graduates 1235444 816753 2052197 Table 9B: Post Graduate Output during 2003 No. Faculty/Course Pass out
Male Pass out Female
Pass out Total
1. Arts-M.A level Courses 168036 138383 306419 2. Science-M.Sc. level Courses 42364 31931 74295 3. Commerce-M.Com level courses 59118 35308 94426 4. Education-M.Ed.. Course 3044 1669 4713 5. Engineering/Technology-M.Tech level courses 10205 2165 12370 6. Medicine-M.S, MD, MAMS, MHMS, M.Pharm, MSc
(Nursing), MCH,DM etc. 5834 2385 8219
7. Agriculture, Fisheries, Forestry-M.Sc Level 3009 707 3716 8. Vet.Science-M.Sc, M.V.Sc. 577 123 700 9. Law-LL.M 1414 779 2193 10. Others; Lib.Sc., Journalism etc. Master level courses 23604 10003 33607 11 Total Post Graduates 317205 223453 540658

6
12. Total Graduates and Post-Graduates 1552649 1040206 2592855 Source: SES 2004-05 based on UGC Report It is seen from the tables above that among the prominent disciplines at the Bachelor’s level 47.4% of students obtain degrees in arts, 18.2%in commerce, 16% in science, 6.2% in engineering/technology and 5.2% in education courses while at the Master’s level arts degree is obtained by 56.6%, commerce by 17.5% and science by 13.7%, and engineering by only 2.3% of students. The ratio of Male graduates to Female graduates is 1.51:1 at the Bachelor’s level and 1.42:1 at the Master’s level. 1.6: Teachers in Higher education Of the 472,000 teachers in Higher Education, 77,000 are in University departments whereas 3,95,000 are in affiliated colleges. While the student/teacher ratio in University departments is 18:1 that in affiliated colleges is 23:1.Table 10 gives the data of enrolment and the teachers employed in 2004-2005 (Source: UGC Annual Report, 2004-05) while Table 11 gives the ratio in NAAC accredited Colleges. Table 12 gives an idea of the percentage distribution of Teacher’s qualification in Colleges.
Table 10:Number of Teachers in Institutions of Higher Education, 2004 (Source: UGC Annual Report 2004-05) Institution Enrolment
(in ‘000) Teachers (in ‘000s)
Student teacher ratio
Students per Institute
University Departments & University Colleges
13,88 77 18
Affiliated Colleges 90,93 3,95 23
Total 104,81 4,72 22
594
Table 11: Distribution of student teacher ratio in the NAAC accredited colleges
NAAC Grades Indicators
A & Above
B++ & B+
B only
C++, C+ & C
Non- Accredited
Total
No. of Sample Colleges 110 547 298 233 285 1473 STR (Student Teacher ratio) 20.4 31.8 28.6 28.5 25.2 25.0 STR by Permanent teachers 29.8 31.8 38.1 35.8 35.6 33.5
Source: Analysis of Self Assessment Report of NAAC Accredited Colleges by UGC (unpublished).

7
Table 12: Qualification of Teachers in various grades of Colleges in 2003-04
1.7: Quality Assurance Mechanisms The Higher Education sector ensures quality of the educational process with the help of accreditation agencies established for the purpose. The main agency which accredits University and Colleges in general education is the National Assessment and Accreditation Council (NAAC) established by the UGC in 1994, where as similar function is done for Technical Education by the National Board of Accreditation (NBA) set up by AICTE in 1994, and for Agricultural education by Accreditation Board (AB) set up by ICAR in 1996. Some of the other professional regulatory bodies are attempting to set up their own accreditation agencies, for instance both the Distance Education Council (DEC) and the National Council for Teacher Education (NCTE) are currently discussing with NAAC the procedures for developing their own accreditation mechanisms. Because of their very late arrival on the scene, the progress of accreditation so far has been very slow. As on May 21, 2006, NAAC has accredited only 128 universities and 2879 colleges and reaccredited 4 Universities and 43 Colleges (NAAC Website), where as NBA by June2005 has accredited merely 1232 programs from 325 institutions (NBA Website) as against a total of 14000 programs in 3589 approved UG and PG and 1608 diploma institutions. Initially the progress of accreditation was very slow but has picked up speed in the last few years, and both NAAC and NBA have plans to complete the backlog of accreditation of eligible institutions during the next few years .In addition to National accreditation, local quality inspection of affiliated colleges are carried out by the affiliating University to ensure provision of adequate academic infrastructure and satisfactory teaching-learning processes. Analysis of examination performance of students is also used by Universities to assess the quality of educational offerings of individual colleges. 1.8. Financing Higher Education Higher Education in India has received enormous financial support from both the Central and the State Governments. At the start of the Planning process in 1950, the total allocation for higher

8
education was only Rs.170 million which has now gone beyond Rs.90, 000million. This impressive increase is offset to some extent by the rise in prices (inflation) and rise in number of students entering higher education. An analysis of government expenditure on higher education shows a real annual growth rate of 7.5% in the 1950s, 11%in the 1960s, 3.4%, in the 1970s, and 7.3% in the 1980s. (CABE Report 2005) The following Table13 gives details of total expenditure incurred by Centre and States on Education from 1993-94 to 2004-2005.where as Table 14 gives both nominal and real expenditure per student in all sectors of education for the same period. Table 13: Sector wise Plan & Non Plan Budgeted Expenditure for Education Departments of State & Center (Revenue Account) (Figure in Rs. Thousand Crore) Year Elementary Secondary Higher Technical Higher + Technical Total 1993-94 10822 7759 3104 1018 4122 23413 1994-95 12639 9050 3525 1189 4714 27232 1995-96 15218 10344 3871 1290 5161 31517 1996-97 17850 11736 4288 1450 5738 36372 1997-98 20392 13262 4859 1623 6482 41109 1998-99 25150 16782 6117 2073 8190 51225 1999-00 27905 20845 8248 2459 10707 61281 2000-01 29758 19743 9195 2528 11723 62498 2001-02 32493 20431 8087 2560 10647 64847 2002-03 33474 22049 8859 2820 11679 68561 2003-04(R) 38260 23983 9380 3138 12518 76387 2004-05 (B) 40586 24990 9562 3387 12949 80286 Source: Analysis of Budgeted Expenditure on Education, MHRD, Govt. of India, Various Years. 1 Crore is 10 million Table 14:Public Expenditure per Student: Nominal and Real (Base year – 1993-94) Rs. Year Elementary Secondary Higher Nominal Real Nominal Real Nominal Real 1993-94 825 825 3748 3748 8961 8961 1994-95 893 793 4040 3588 9821 8722 1995-96 1052 865 4517 3715 9384 7717 1996-97 1220 959 4890 3844 8438 6634 1997-98 1361 1025 5221 3932 9003 6779 1998-99 1654 1175 6285 4467 10238 7276 1999-00 1792 1233 7392 5087 13219 9097 2000-01 1900 1220 7153 4594 13956 8963 2001-02 2047 1269 6699 4153 12099 7501 2002-03 1977 1185 6641 3982 12294 7370 2003-04® 2162 1229 6852 3896 12518 7117 Table 15 shows how the Plan allocation for Higher Education, which went up to 28% in the Vth Plan period, has been slowly going down in subsequent plans and has reached only 6% of the total Plan expenditure during the Xth Plan period. Table 16, which gives the annual Plan allocation during the Xth Plan period and the actual expenditure, highlights the priority given in allocation to Technical education (10.72%) over Higher Education (9.53%) although Higher education sector overspent the allocation whereas the Technical education sector had a significant saving. Table 17 shows the distribution of total public expenditure per student in Higher education.

9
Table 15: Plan Expenditure on Higher Education as % of Total Plan Expenditure
% Plan Expenditure in University & Higher Education
8
1815
2528
2116
10 96
05
1015202530
I II III IV V VI VII VIII IX X
Five year Plan Period
% P
lan
Expe
nditu
re
University & Higher
Source: Annual Financial Statistics of Education Sector 2003-04, MHRD, Govt. of India, New Delhi, 2005.
Table 16: Central Plan Allocation and Expenditure During X plan (Rs. Crore)
Scheme X plan Allocation
Percent To total
2002-3 (Actual)
2003-4 (Actual)
2004-5 (RE)
2005-6 (Revised)
2006-7 (B)
X Plan Expenditure
% To total
Difference (2-9)
1 2 3 4 5 6 7 8 9 10 Univ.& Higher
4176.5 9.53% 619.14 560.44 789.95 873.27 1403.5 4246.3 7 -69.8
Tech. Edu. 4700 10.72% 600.47 626.34 653.31 643.67 930 3453.79 6 1246.21
Total Education
43825 100.00%
6388.84 7377.21 9570.84
15041.76 20744 59122.65 100 -15297.7
Source: Annual Financial Statistics of Education Sector 2003-04, MHRD, Govt. of India, New Delhi, 2005 and Expenditure Budget 2006-07, Volume – 2, Government of India, February, 2006 Table17: Distribution of Total Public Expenditure per Student in Higher Education
Public Expenditure per Student 2002-03 2003-04 (R) 2004-05 (B)
Central Plan 758 639 686 Central Non-plan 1386 1336 1240 State Plan 527 558 529 State Non-plan 8176 8063 7803 Total 10847 10596 10258 1.8:Public Expenditure on Education as a Percentage of GDP Table 18 below shows how different States in the Indian Union spend different amounts on Education as a percentage of their net domestic product with Sikkim spending close to 12% where as Uttar Pradesh and Delhi spend less than 3%. Table 18: Expenditure on Education as a % of Net State Domestic Product

10
Table 18: Expenditure on Education by Different States as % of NSDP
The total expenditure on the Revenue Account at the all India level during 2005-06 formed 28.33% of the total Gross Domestic Product (GDP) and only 3.01% of the GDP was provided in the budgets of the education departments. When the provision for education for all departments including education departments is taken into account this percentage works out to be 3.72% (Source: Analysis of Budget Expenditure on Education from 2003-2006, Ministry of HRD Planning and Monitoring Unit 2006). So far as expenditure on Higher education sector is concerned, there is some variation in data depending on the source. Table 19 is reproduced from the CABE report on financing of Higher and Technical Education (June 2005) whereas Table 20 is taken from Selected Educational Statistics 2003-2004 document published by MHRD in 2007.
Table 19: Public Expenditure on Higher and Technical Education as % of GDP
Source: CABE Report on Financing of Higher and Technical Education, June 2005.
11
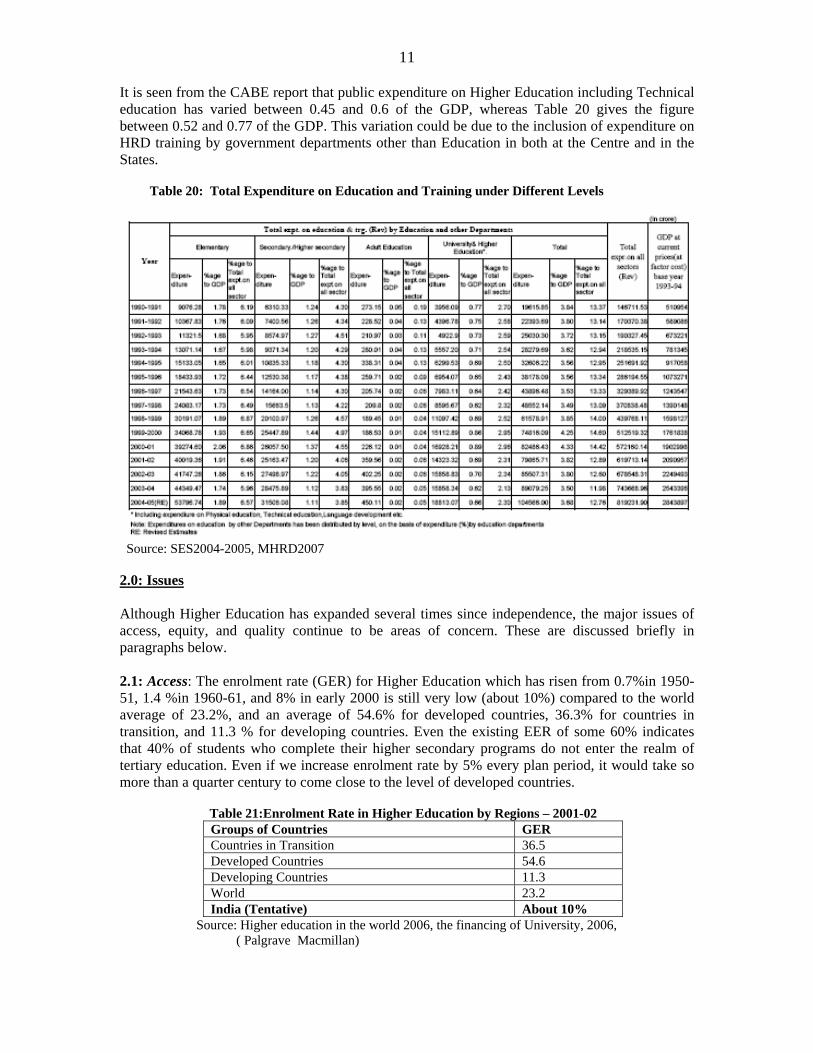
It is seen from the CABE report that public expenditure on Higher Education including Technical education has varied between 0.45 and 0.6 of the GDP, whereas Table 20 gives the figure between 0.52 and 0.77 of the GDP. This variation could be due to the inclusion of expenditure on HRD training by government departments other than Education in both at the Centre and in the States. Table 20: Total Expenditure on Education and Training under Different Levels
Source: SES2004-2005, MHRD2007 2.0: Issues Although Higher Education has expanded several times since independence, the major issues of access, equity, and quality continue to be areas of concern. These are discussed briefly in paragraphs below. 2.1: Access: The enrolment rate (GER) for Higher Education which has risen from 0.7%in 1950-51, 1.4 %in 1960-61, and 8% in early 2000 is still very low (about 10%) compared to the world average of 23.2%, and an average of 54.6% for developed countries, 36.3% for countries in transition, and 11.3 % for developing countries. Even the existing EER of some 60% indicates that 40% of students who complete their higher secondary programs do not enter the realm of tertiary education. Even if we increase enrolment rate by 5% every plan period, it would take so more than a quarter century to come close to the level of developed countries. Table 21:Enrolment Rate in Higher Education by Regions – 2001-02
Groups of Countries GER Countries in Transition 36.5 Developed Countries 54.6 Developing Countries 11.3 World 23.2 India (Tentative) About 10%
Source: Higher education in the world 2006, the financing of University, 2006, ( Palgrave Macmillan)

12
2.2: Equity: while the GER continues to be low for the overall population, there are large variations among the various categories of population based on gender, urban or rural habitation and reach and poor. Table 22 below illustrates these divergences. Table 22: Enrolment Ratio under Different groups of Population
Other Religion
30.9 24.3 65.8
Rural/ Urban
Rural 9.0 7.8 6.1 51.5 Urban 24.5 27.2 21.9 66.0 Poor 2.43 Non-Poor 12.81
Source: Chairman UGC’s Nehru Memorial Lecture, University of Mumbai, Nov.24, 2006 2.3:Quality: The higher educational institutions suffer from large quality variation in so much so that a recent Nasscom-Mackinsey Report (2005) has said that not more than 15% of graduates of general education and 25-30% of Technical Education are fit for employment. Since only a small number of Universities and colleges are eligible for funding by UGC and hence monitoring for quality by NAAC for ensuring quality standards set by it, a vast majority of institutions are under no quality monitoring and control except what is provided under university regulations and occasional university team visits. Tables 23A and 23B below give the quality status of colleges (as on 31st March 2005) and Universities as in 2007.
Table 23 A: Current Quality Status in Colleges of Higher Education in India (As on March 31, 2005)
Details Number Total Number of Colleges 17,625 Number of Colleges under UGC purview 14,000 Number of Colleges recognized under Section 2(f) of UGC Act 5,589 (40%) Number of Colleges recognized under Section 12(B) of UGC Act 5,273 (38%) Number of Colleges actually funded by the UGC 4,870 (35%) Number of Colleges accredited by the NAAC 2,780 (20%) Number of Colleges accredited by the NAAC and scoring above 60% 2,506 (17.9)
Source: Draft Report of Working Group on Higher Education for 11th Five-year Plan.

13
Table 23 B: Current Quality Status of Universities in India (As in 2007)
Details Total Number
Total Number of University Level Institutions 367
Total Number of Universities under UGC Purview 317 Number of Universities actually funded by the UGC 164 Number of Universities accredited by the NAAC 128 Number of Universities accredited by the NAAC and scoring above 60% 128
Source: Draft Report of Working Group on Higher Education for 11th Five-year Plan. As per the University sector is concerned, a total of 317 Universities under the purview of UGC only about 50% (164) have been assessed for minimum quality under 12(B) while seeking UGC funding whereas only about 40%(128) have been assessed for more elaborate criteria of quality as per NAAC. A sample study by UGC of 111 universities funded by it has shown that 31% of them fall under A grade (High quality), 52% in B grade (Medium quality) and 16% under C grade (Low quality). It is observed that A grade Universities generally perform better with respect to number of indicators, which include faculty strength in number per department and quality (PhD degree), and both physical and academic facilities. (Based on UGC Chairman’s Nehru Memorial Lecture, Univ. of Mumbai, November 2006). As per the latest data available NAAC has completed accreditation of 140 Universities (28 more than the above Table), and 3492 colleges (some 700 more than given in table above). An analysis of 2698 colleges accredited earlier is given in Table 24 below which confirms that even under the small number of colleges so far accredited, some 24% are of low quality and one does not know anything about the quality standard of some 80% of colleges under UGC purview.
Table 24: NAAC Ranking of Colleges 2006
An earlier analysis of performance standard of facilities in NAAC accredited Colleges is given in Table 25 below. It is obvious that performance parameters are better in institutions with A and B++/B+ grades.

14
Table 25: Performance quality of selected accredited Colleges
3.0 Government Initiatives to tackle the above Issues:
3.1: Access and Equity: The Central Government is conscious of the need to raise both the enrolment rate and access to higher education to all who deserve irrespective of class, caste, religion, gender or economic status. In the last plan period enrolment rate has gone up form some 6% to 10%and the 11th Plan it is proposed to raise it 15 percent. 30 new Central Universities, 8 new IITs, 20 new IIITs and 7new IIMs, and several high grade Medical Institutes are proposed to be established during the next plan period, and one degree college would be established in each district of the country. The Prime Minister has invited private sector participation in this venture. Knowledge Commission, which was established at the suggestion of the present Government, has submitted its first report on Higher Education and is under scrutiny for implementation by the Government. There are proposals for improving access to quality higher education to disadvantaged groups in the population (Moily Committee and Sachar Committee reports). The Indian Prime Minister in his Independence Day speech on 15th August 2007 said, “We will also ensure that adequate numbers of colleges are set up across the country, especially in districts where enrolment levels are low. We will help States set up colleges in 370 such districts. The University system, which has been relatively neglected in recent years, is now the focus of our reform and development agenda. We will set up thirty new Central Universities. Every state that does not have a central university will now have one. In order to promote science and professional education, we are setting up five new Indian Institutes of Science Education and Research, eight new Indian Institutes of Technology, seven new Indian Institutes of Management,

15
and twenty new Indian Institutes of Information Technology. These will generate new educational opportunities for our youth. I am sure that, working together, we can ensure that at least a fifth of our children go to college as compared to one-tenth now.”
3.2: Some Public Initiatives: The success stories of the initiatives of the Government in the field of higher education, which have already received both national and international recognition, are only a few:
• the setting up of Central Universities, with high quality of infrastructure for teaching and research
• setting up Indian Institutes of Technology and Indian Institutes of Management, which are leaders in Technical and Management Education in the country and have earned very high reputation for their graduates internationally
• Opening up the Professional Education Sector to large scale private investment and permitting the investors cost recovery from student fees
• establishing Indian Institutes of Information Technology both in the Public and Private sectors, and crating a new phase of public/ private partnership in the IT area with the Institutions given Deemed University Status and ensuring active Industry involvement in Governance.
• implementing the plan for producing the required human resource for the rapidly growing Information Technology Industry permitting private sector to establish a world class institution
• permitting private sector to establish a world class institution in Management (ISB at Hyderabad) with linkages with world class institutions
• permitting some deemed Universities to open campuses both in other states and abroad 3.3. Innovative Schemes: A number of innovative schemes have also been in operation in the Higher Education sector, some promoted by the University Grants Commission, others by the Technical education division of the Ministry of Human Resource development and All India Council Of Technical Education, and yet others by Indian Council of Agricultural research and several other Departments of the Central Government dealing with Science and Technology and their applications. A brief description of some of these schemes is listed below in Tables 26A and 26B: Table 26 A: Some Selected UGC Schemes and new Initiatives: Name of the Scheme
Purpose /Functions Implemented in Number of Institutions
Limitations *Rating of Impact
1. Vocationalization of higher education
Career oriented courses offered
368 colleges and 2 Universities
Not enough depth in courses
Low
2. Academic Staff Colleges
Continuing Education of Teachers
51 Universities have established them so far and more planned
Not enough for such a large system
Low coverage, Medium quality of offering
3. Autonomous Colleges
Authority to curricular and examination reforms
132 in 29 Univ. in 8 states (2003-04)
Plan to make 10%colleges autonomous remains a dream
Good but so few autonomous
4.Inter University Centers/ National Facilities Centers
Provide advanced research facilities to all who need
Six IUCs and 4 National facilities centers
Very few areas covered
Excellent for researchers in the area
5. UGC Infonet Nation wide high speed communication network for information sharing, access to educational
149 Universities so far connected, 108 network managers from 99 universities trained at
Although dedicated secure quality network, start of sharing could have been implemented through internet
Would be very useful when fully implemented, would improve information

16
materials and distance education
ERNET Center, New Delhi and 63 library professionals at INFLIBNET center at Ahmedabad
collection and reliability of statistics
6. Consortium Based Subscription
Access to e-journals through consortium
Implemented from Jan.2004 with membership of 100+ Universities subscribing 4450 journals from 25 publishers
Needs early extension to all Universities and colleges as well with incentives, if necessary
Advantage so far limited to connected Universities but very useful to research for PG students, PhD scholars and faculty.
7. Performance Radars
Evaluation of Universities on Academic, Research and Governance and comparison on bench mark parameters
Implemented through 10th plan visits to Universities. Basis for performance-based grants from UGC
Can be used also for self monitoring and evaluation of colleges
Benchmarking difficult and often controversial otherwise a good tool
8.PIEHEAD To collate efforts for promotion of Indian Higher education abroad
Implemented through conference in June 2005
Needs permanent secretariat, and a current website to be effective
Useful initiative
9.New National Institutes of Sciences
High Quality Institutions for world class science education
Institutes at Allahabad, Bhubneshwar, Chennai, and Pune
Still early days of implementation, needs networking with local universities and colleges
Too few to make impact. 5more planned in 11th Plan.
10. Higher Education Information System (HISP)
Ambitious system for collecting and collating information on higher education with 9 functional modules
Concept stage awaiting detailed Project report and specifications of functional modules
Early implementation required even with fewer modules
Very useful when completed
11. Promotion of Knowledge Based enterprises through Institutions of Higher Learning (A concept note)
Collaboration with DST/NASSCOM to promote Entrepreneurship development cells (EDC) Technology and Business incubators (TBI), and Science and technology Entrepreneur’s Parks (STEP)
Still to be implemented in although several EDCs, TBIs, and STEP have been established
Very active involvement of Government, Industry, venture capitalists needed with Higher Education Institutions
A necessary Initiative needs encouragement and incentives for start-ups and exploitation of Research results
12. NET Examination
Quality benchmarking for eligibility for teaching and
For 84 subjects at 65 centers in India and 6 abroad
Need to extend to all subjects and review test
Good quality filter but impedes motivation for
17
research procedures Research degrees
13. Career Advancement Scheme
Promotion on merit after years of service in a grade
Almost universally applied
Merit is often a casualty, only years of service considered
Satisfaction of teachers but serious in breeding
Based on author’s experience and Information collected from UGC Publications and MHRD annual reports.
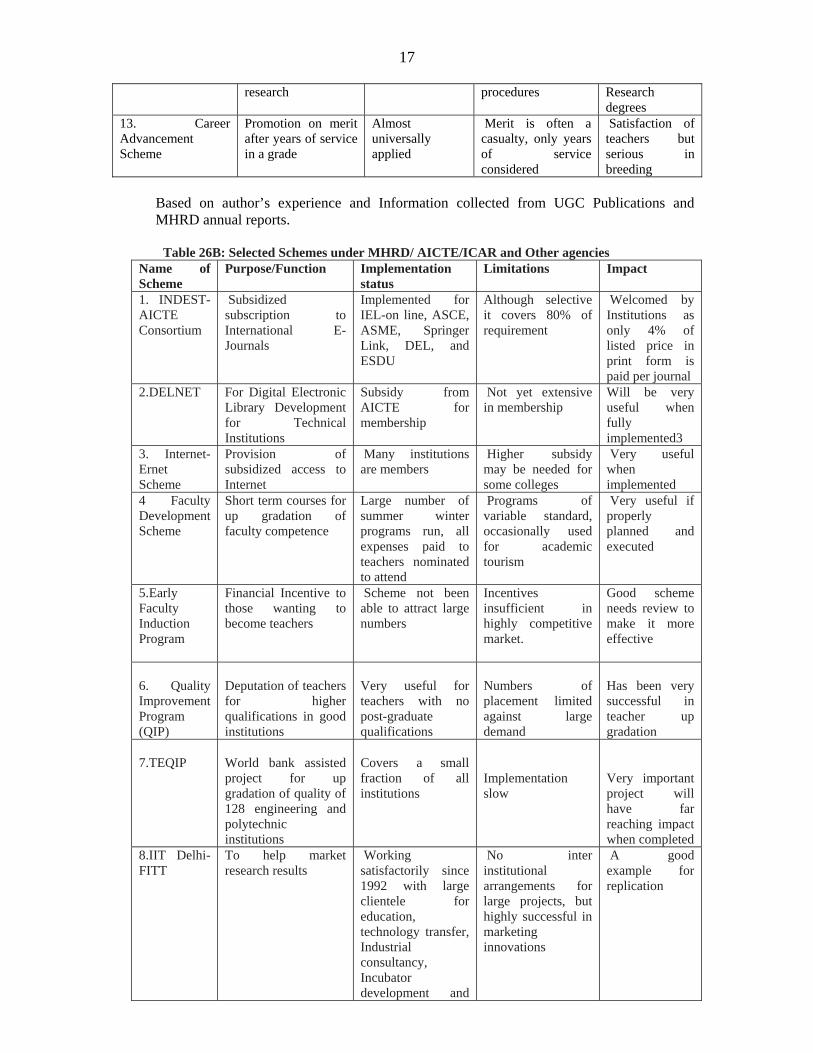
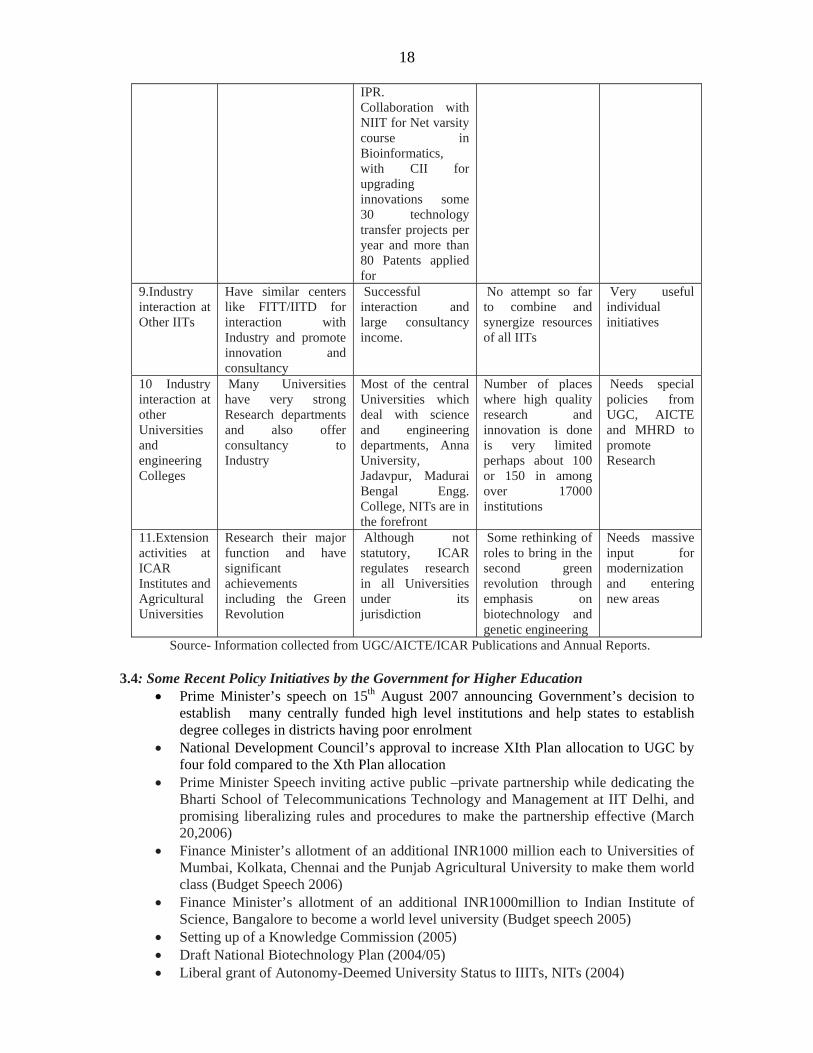
Table 26B: Selected Schemes under MHRD/ AICTE/ICAR and Other agencies
Name of Scheme
Purpose/Function Implementation status
Limitations Impact
1. INDEST-AICTE Consortium
Subsidized subscription to International E-Journals
Implemented for IEL-on line, ASCE, ASME, Springer Link, DEL, and ESDU
Although selective it covers 80% of requirement
Welcomed by Institutions as only 4% of listed price in print form is paid per journal
2.DELNET For Digital Electronic Library Development for Technical Institutions
Subsidy from AICTE for membership
Not yet extensive in membership
Will be very useful when fully implemented3
3. Internet-Ernet Scheme
Provision of subsidized access to Internet
Many institutions are members
Higher subsidy may be needed for some colleges
Very useful when implemented
4 Faculty Development Scheme
Short term courses for up gradation of faculty competence
Large number of summer winter programs run, all expenses paid to teachers nominated to attend
Programs of variable standard, occasionally used for academic tourism
Very useful if properly planned and executed
5.Early Faculty Induction Program
Financial Incentive to those wanting to become teachers
Scheme not been able to attract large numbers
Incentives insufficient in highly competitive market.
Good scheme needs review to make it more effective
6. Quality Improvement Program (QIP)
Deputation of teachers for higher qualifications in good institutions
Very useful for teachers with no post-graduate qualifications
Numbers of placement limited against large demand
Has been very successful in teacher up gradation
7.TEQIP
World bank assisted project for up gradation of quality of 128 engineering and polytechnic institutions
Covers a small fraction of all institutions
Implementation slow
Very important project will have far reaching impact when completed
8.IIT Delhi-FITT
To help market research results
Working satisfactorily since 1992 with large clientele for education, technology transfer, Industrial consultancy, Incubator development and
No inter institutional arrangements for large projects, but highly successful in marketing innovations
A good example for replication
18
IPR. Collaboration with NIIT for Net varsity course in Bioinformatics, with CII for upgrading innovations some 30 technology transfer projects per year and more than 80 Patents applied for
9.Industry interaction at Other IITs
Have similar centers like FITT/IITD for interaction with Industry and promote innovation and consultancy
Successful interaction and large consultancy income.
No attempt so far to combine and synergize resources of all IITs
Very useful individual initiatives
10 Industry interaction at other Universities and engineering Colleges
Many Universities have very strong Research departments and also offer consultancy to Industry
Most of the central Universities which deal with science and engineering departments, Anna University, Jadavpur, Madurai Bengal Engg. College, NITs are in the forefront
Number of places where high quality research and innovation is done is very limited perhaps about 100 or 150 in among over 17000 institutions
Needs special policies from UGC, AICTE and MHRD to promote Research
11.Extension activities at ICAR Institutes and Agricultural Universities
Research their major function and have significant achievements including the Green Revolution
Although not statutory, ICAR regulates research in all Universities under its jurisdiction
Some rethinking of roles to bring in the second green revolution through emphasis on biotechnology and genetic engineering
Needs massive input for modernization and entering new areas
Source- Information collected from UGC/AICTE/ICAR Publications and Annual Reports. 3.4: Some Recent Policy Initiatives by the Government for Higher Education
• Prime Minister’s speech on 15th August 2007 announcing Government’s decision to establish many centrally funded high level institutions and help states to establish degree colleges in districts having poor enrolment
• National Development Council’s approval to increase XIth Plan allocation to UGC by four fold compared to the Xth Plan allocation
• Prime Minister Speech inviting active public –private partnership while dedicating the Bharti School of Telecommunications Technology and Management at IIT Delhi, and promising liberalizing rules and procedures to make the partnership effective (March 20,2006)
• Finance Minister’s allotment of an additional INR1000 million each to Universities of Mumbai, Kolkata, Chennai and the Punjab Agricultural University to make them world class (Budget Speech 2006)
• Finance Minister’s allotment of an additional INR1000million to Indian Institute of Science, Bangalore to become a world level university (Budget speech 2005)
• Setting up of a Knowledge Commission (2005) • Draft National Biotechnology Plan (2004/05) • Liberal grant of Autonomy-Deemed University Status to IIITs, NITs (2004)
19
• Setting up Indian Institutes of Information Technology, Design and Manufacturing (IIITDM) at Kancheepuram and Jabalpur in 2003-04. These institutes are to provide a sustainable competitive advantage to the Indian industry in the area of design and manufacturing of new products
• New Science and Technology Policy (2003). • Setting up an Educational Satellite (2003) • Transforming India into a Knowledge Superpower (2003) • Ambani Report on “ A Policy Framework for Reforms in Education” submitted to the
then Prime Minister as part of a special subject group on Policy frame work for private investment in Education, Health and Rural Development (April 2000)
• National Policy on Education (1986/92/2000) • Information Technology Action Plan (1998) • Technology Vision Of India 2020(1996) • Establishment of NAAC, NBA (1994) • Encouraging Private Investment in Professional Education (Since 1980s) • Upgrading Technical Education System through World Bank Assistance-Tech Ed.I, II,
III and TEQIP (1987-2008). • Selecting Universities and Colleges with “Potential for Excellence” started by UGC
during Xth Plan to identify at least 161 colleges during the Plan period.. So far 9 Universities and 97 colleges have been identified and given special grants.
3. 5: References: (i) Annual Report Ministry of Human Resource Development, Government of India 2006-2007. (ii)Draft Report of Working Group on Higher Education for the XI Plan, Planning Commission, Government of India (2007) (iii) Selected Educational Statistics 2004-2005 (as on September 2004), Ministry of Human Resource Development Government of India (2007) (iv) Agarwal, P (2006), Higher education in India: The need for change. New Delhi, Indian Council for Research on International Economic Relations. URL: www.icrier.org/publication/working_papers_180.html. (v)Jha: Higher Education in India-Restructuring for increased innovation, Document prepared for the World Bank, June 2006. (vi)UGC: Chairman’s Nehru Memorial Lecture, University of Mumbai, Nov.24, 2006 (available on the Web) (vii)UGC Annual Report 2004-05