Embed Size (px)
Citation preview

Higher Education and
Healthcare Update
September 2018


NAHEFFA, September 2018 3
Agenda
1. Overview of portfolios and rating activity
2. Methodologies
3. Outlooks

Overview of portfolios
and rating activity1
NAHEFFA, September 2018 5
Global higher education & not-for-profits
coverage» Coordinated credit analysis brings together both sector and region specific expertise:
over 30 dedicated analysts
USA» Around 500 universities
» >200 community colleges
» Nearly 100 not-for-profits
» Almost 35 private
K-12 schools
Canada» 13 public universities
» Ratings from Aa1-A3
UK» 9 public universities
» Ratings from Aaa-Aa3
» One philanthropic
organization
Australia» 5 public universities
» Ratings from Aa1-Aa3
Singapore» 2 public universities
» Both rated Aaa
Mexico» 1 public university
» Rated Baa3
Peru» 1 private university
» Rated Ba2

NAHEFFA, September 2018 6
US higher education portfolio rating
distribution
0
10
20
30
40
50
60
Aaa Aa1 Aa2 Aa3 A1 A2 A3 Baa1Baa2Baa3 Ba1 Ba2 Ba3 B1 B2 B3 Caa1Caa2Caa3 Ca C
Private PublicBreakpoint between
investment grade and
speculative grade
Source: Moody's Investors Service, as of August 2018

NAHEFFA, September 2018 7
Beginning in 2008, rating downgrades
began to outpace upgrades Rating upgrades and downgrades for four-year public and
not-for-profit private universities by calendar year
0
5
10
15
20
25
30
35
40
45
1999 2001 2003 2005 2007 2009 2011 2013 2015 2017
Upgrades Downgrades
Source: Moody's Investors Service

NAHEFFA, September 2018 8
» We rate ~380 not-for-profit hospitals and health systems (~1,900 total
hospitals)
– Over ~$190 billion of total rated debt outstanding
– Stand-alone hospitals (as small as 800 admissions)
– Multi-state systems (with more than 780,000 admissions)
» Not-for-profit healthcare median rating is A2
Moody’s not-for-profit healthcare
portfolio

NAHEFFA, September 2018 9
Majority of US not-for-profit healthcare
ratings remain investment grade…
# o
f R
ating
s
Source: Moody’s Investors Service

NAHEFFA, September 2018 10
…but reflect enterprise risk and volatile
business model
Source: Moody’s Investors Service

NAHEFFA, September 2018 11
Elevated rating activity in 2017
Source: Moody’s Investors Service
5856
44
34
40
37 37
31 32
42
21
27
40
23
38
27 28
21 21
13
0.0
0.5
1.0
1.5
2.0
2.5
3.0
3.5
0
10
20
30
40
50
60
70
2008 2009 2010 2011 2012 2013 2014 2015 2016 2017
Downgrades Upgrades Ratio of downgrade to upgrade

NAHEFFA, September 2018 12
More downgrades, fewer upgrades
» Downgrades primarily on smaller systems (under $1 billion in revenue) and
Rust Belt hospitals
– Labor shortage a key driver to expense pressures
» Upgrades highlighted some bright spots:
– Expense management and good volume growth, rising liquidity
» What about M&A? A mixed impact on credit
– Acquisitions involve purchase price, particularly with for-profit purchases
– Mergers often involve no exchange of cash
– Immediate change in the legal package securing the outstanding bonds lead
to multi-notch upgrades
› Example: Bethesda upgraded to A1 from Baa2 following merger with Baptist Health

NAHEFFA, September 2018 13
Rating downgrades tempering in 2018
Source: Moody’s Investors Service
42
15
13
7
0
5
10
15
20
25
30
35
40
45
2017 Through July 27, 2018
Downgrades Upgrades

Rating
methodologies2

NAHEFFA, September 2018 15
» Rating methodologies provide transparency about how we assign ratings
» Scorecard serves as an analytical tool, but is not an exhaustive list of possible credit
factors
» Ratings incorporate our forward-looking assessment of credit quality
Global higher education methodology
Global higher education scorecard overview
Market Profile (30%) Scope of Operations (15%)
Reputation and Pricing Power (5%)
Strategic Positioning (10%)
Operating Performance (25%) Operating Results (10%)
Revenue Diversity (15%)
Wealth & Liquidity (25%) Total Wealth (10%)
Operating Reserve (10%)
Liquidity (5%)
Leverage (20%) Financial Leverage (10%)
Debt Affordability (10%)

NAHEFFA, September 2018 16
Examples of excellent strategic
positioning
» Planning
– Well-integrated financial, treasury, and debt management, ensuring solid liquidity to
meet the university’s operating, debt and investment needs.
– Board and management have developed credit positive operational management
practices, including long-range financial planning, tight budgetary controls with
program level transparency, and integrated capital budgeting.
» Resources
– XYZ university’s strong academic reputation, diversified programs, and urban
location will continue to translate into excellent strategic positioning and healthy
student demand despite a highly competitive environment.
– The rating favorably incorporates the college's steady student demand as a liberal
arts college with an increasingly national brand, contributing to excellent strategic
positioning. The college has generated consistently strong operating cash flow and
has sizeable financial reserves and very good liquidity. Leverage is comparatively low
and manageable.

NAHEFFA, September 2018 17
Examples of fair strategic positioning
» Planning
– The college is highly opportunistic and has limited long-range strategic, financial and
capital planning. Many of the standard policies adopted by peer institutions, such as
an investment policy, do not exist at this college.
» Capital Investment
– A rising age of plant and limited capital spending that hasn’t exceeded depreciation in
five out of the last six years could lead to needed capital investment and an increase
in the university’s leverage profile.
– Limited ability to sustain strategic facilities and programmatic investments given
weak operating performance and very thin liquidity.
» Resources
– Highly competitive market, with a regional draw from areas with stagnant or declining
high school graduates, causing the university to invest more in financial aid to draw
students.
– Matriculation of admitted students remains low at about 15% compounded by a weak
retention rate of 82% in fall 2015.

NAHEFFA, September 2018 18
Methodology includes other credit
considerations» Multi-year trends
» Governance and management
» Debt structure considerations
» Liquidity quality
» Government relationship
» Pension and other post-employment obligations
» Healthcare operations

NAHEFFA, September 2018 19
Healthcare: three factors support the
rating methodology
Market Position
Operating Performance
& LiquidityLeverage
Moody’s
Rating

NAHEFFA, September 2018 20
A health system with a strong market position has a greater ability to attract
patients, physicians and more favorable payment terms
» Scope of operations: size indicates market leverage, stability, and
revenue diversity
Operating revenue ($)
» Market demand: ability to grow revenue organically indicates patient
demand and provides cushion from healthcare inflation
Three-year operating revenue CAGR (%)
» Market landscape: qualitative factor used to assess regulatory
environment, service area quality, and degree of competition
Factor 1: market position (45%)

NAHEFFA, September 2018 21
Strong operations and liquidity enable health systems to repay debt and
make strategic investments from core cash flow
» Operating results: ability to manage expenses and grow revenues to
generate cash flow to sustain business model
Operating cash flow margin (%)
» Payor concentration: reliance on government payors
Gross revenue of combined Medicare and Medicaid (%)
» Financial reserves: unrestricted cash to cover daily expenses
Cash on hand (days)
» Financial management and reinvestment: qualitative factor to
assess thoughtfulness of business strategies and long-range operating
and capital plans
Factor 2: operating performance &
Liquidity (35%)
NAHEFFA, September 2018 22
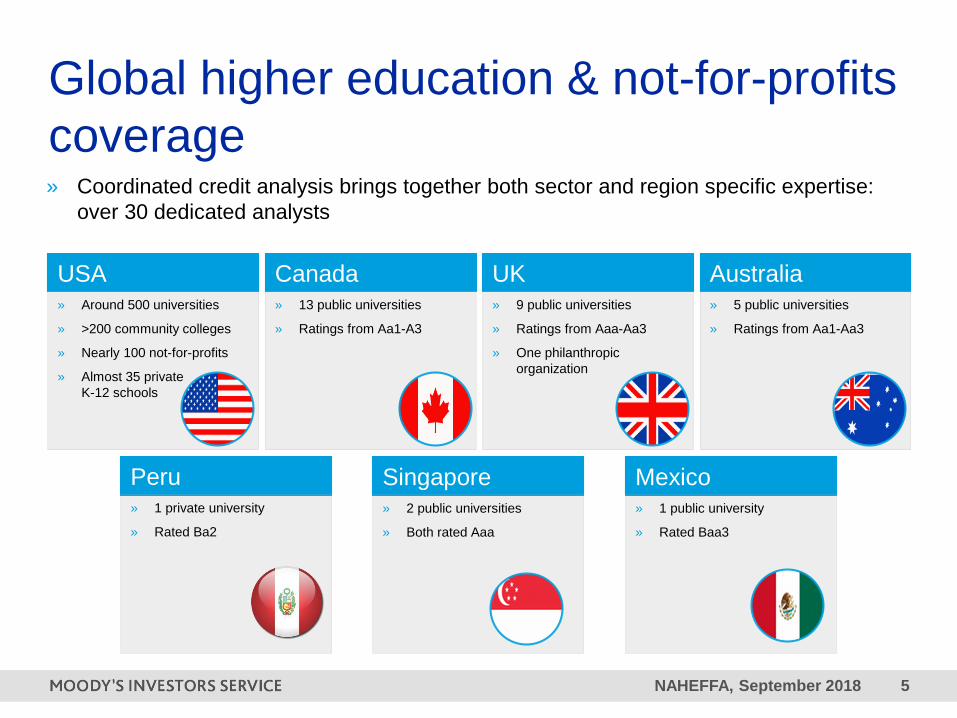
Examination of liquidity and cash flow relative to debt burden is critical to
understanding a health system’s ability to repay debt while funding capital
» Financial leverage: financial reserves relative to debt indicates
balance sheet flexibility
Unrestricted cash and investments to total debt (%)
» Debt affordability: degree to which a health system is able to
generate cash flow to service debt and fund reinvestment
Total debt to cash flow (%)
Factor 3: leverage (20%)

NAHEFFA, September 2018 23
Source: Moody’s Investors Service
Not-for-profit healthcare scorecard

Outlooks3

NAHEFFA, September 2018 25
Higher ed: six themes shaping global
credit
Growth
» Solid momentum in global economic
growth will underpin continued demand
for higher education, but not necessarily
translate into steady governmental
support or pricing power.
Financial Stability
» Exposure to financial markets is
increasing as universities become more
reliant on external financing and
philanthropic support.
Political & Geopolitical Risk
» Rapidly evolving political landscapes will
provide challenges and opportunities for
universities across the globe.

NAHEFFA, September 2018 26
Six themes shaping global credit in 2018
Technology and Innovation
» Technological advances provide
opportunities to reach new student
populations, offer alternative methods
of teaching and gain operational
efficiencies.
Demographics
» Increasing rates of participation in
higher education will support the
sector's overall credit. Further, with
increasing numbers of women
receiving higher education degrees,
we expect a continued expansion in
overall student populations.
Climate Change and Sustainability
» Universities will continue to be
subject to risks of climate change,
and their ability to prepare for and
respond to these risks will play a
growing role in their credit profiles.

NAHEFFA, September 2018 27
Higher education2018 outlook changed to negative as revenue growth
moderates
NEGATIVE STABLE POSITIVE
» Annual change in aggregate
operating revenue will soften
to about 3.5%; a growing
portion of the sector will have
revenue growth under 3%
» Constrained growth in
multiple key revenue streams,
including tuition, research and
state appropriations
» Expense growth of almost 4%
» Uncertainty at the federal
level over potential policy
changes
What could change outlook
to stable
» An annual change in
aggregate operating
revenue in our rated
sample of at least 3%,
representing real growth in
a low inflation environment,
and outpacing expense
growth
» Ongoing solid student
demand
» Financial reserve strength
What could change outlook
to positive
» Revenue growth well in
excess of inflation
expectations and expense
growth
Note: A negative sector outlook indicates our view that fundamental credit conditions will worsen. A positive outlook indicates that we expect fundamental credit conditions to improve. A
stable sector outlook indicates that conditions are not expected to change significantly. Since sector outlooks represent our forward looking view on conditions that factor into ratings, a
negative (positive) outlook indicates that negative (positive) rating actions are more likely on average.
Source: Moody's Investors Service

NAHEFFA, September 2018 28
Aggregate revenue growth below 3%
excluding patient care revenues
Source: Moody's Investors Service
0%
1%
2%
3%
4%
5%
6%
7%
2013 2014 2015 2016 2017 Est. 2018 For. 2019 For.
Aggregate revenue growth Aggregate expense growthAggregate revenue growth without patient care Aggregate expense growth without patient care
“Est” indicates our estimated data based on preliminary information. “For” indicates our forecasted data.
» Aggregate operating revenue growth will soften and will not keep pace with expense
growth
» Excluding patient care revenue, revenue growth is projected to decline to below 3% for
the outlook period.

NAHEFFA, September 2018 29
Expected growth rates vary by
revenue streams
Source of Revenue
FY 2018 and 2019
Forecast Growth
Assumptions (%)
% of Aggregate
Private University
Revenue
Median
Private University
Revenue (%)
% of Aggregate
Public University
Revenue
Median
Public University
Revenue (%)
Net tuition and
auxiliaries2-3.5 35 74 33 50
State appropriations 2-2.5 0 0 19 24
Patient care 5-7 27 0 19 0
Grants and contracts 1-2 14 2 16 10
Endowment income 2-5 13 9 4 2
Gifts for operations 6-6.5 3 6 3 2
Other revenue 6-6.5 8 3 6 4
Total 100 100
Median data is the median for each revenue stream and will not add up to 100%. Median data may be 0 in some cases, meaning that the median data point
indicated no revenue from that particular revenue source. Aggregate data is driven by the largest universities in the portfolio, whereas median data adjusts for
the diversity across the sector.
Source: Moody's Investors Service
» Tuition revenue growth will remain subdued, as will research funding and state
appropriations.
» Patient care revenue growth will moderate after very strong growth in fiscal 2015-17.
» Public universities will experience greater pressure than their private counterparts.

NAHEFFA, September 2018 30
Total net tuition revenue will grow slowly
over outlook period
“Est.” indicates our estimated data based on preliminary information. “For.” indicates our forecasted data.
Source: Moody's Investors Service
0%
2%
4%
6%
8%
10%
12%
14%
16%
2006 2007 2008 2009 2010 2011 2012 2013 2014 2015 2016 2017Est.
2018For.
% Change in Aggregate Net Tuition Revenue (public)
% Change in Aggregate Net Tuition Revenue (private)

NAHEFFA, September 2018 31
Changes in state funding vary widely
across states 5-Year % Change in State Support, FY13-FY18
» Seven large states (CA, TX, NY, FL, NC, GA and IL) accounted for half of FY 2018 state
support for higher education. Their total increase for FY 2018 was 2.4%, compared to
0.9% for remaining states.
Source: Grapevine; Moody’s Investor Service
-30%
-20%
-10%
0%
10%
20%
30%
40%
50%
60%
Okla
ho
ma
We
st
Vir
gin
iaA
laska
Kan
sa
sM
issis
sip
pi
Wyo
min
gA
rkansa
sL
ou
isia
na
Ken
tucky
New
Me
xic
oA
rizo
na
Pen
nsylv
an
iaIllin
ois
Iow
aN
ort
h D
ako
taV
erm
ont
Mis
sou
riN
ort
h C
aro
lina
New
Jers
ey
Dela
ware
Ohio
Ma
ine
Ind
ian
aN
ew
York
Ala
ba
ma
Nebra
ska
Virg
inia
Te
xas
Sou
th D
ako
taM
ichig
an
Sou
th C
aro
lina
Mo
nta
na
Rhod
e Isla
nd
Ma
ryla
nd
Ma
ssa
chu
sett
sT
enn
essee
Min
neso
taC
onn
ecticut
Wis
con
sin
Geo
rgia
Nevad
aId
ah
oW
ash
ing
ton
Ha
wa
iiU
tah
Colo
rado
Ore
go
nN
ew
Ha
mp
shir
eF
lorid
aC
alif
orn
ia

NAHEFFA, September 2018 32
Research funding moderately improving
“Est.” indicates our estimated data based on preliminary information. “For.” indicates our forecasted data.
Sources: Moody's Investors Service, National Science Foundation, National Center for Science and Engineering Statistics, Higher Education Research and
Development Survey
» Research funding will likely continue to shift toward comprehensive universities, which
offer more opportunity for collaboration across disciplines.
0
10
20
30
40
50
60
70
80
2000 2001 2002 2003 2004 2005 2006 2007 2008 2009 2010 2011 2012 2013 2014 2015 2016 2017Est.
2018For.
Bill
ion
s
Federally funded Nonfederally funded

NAHEFFA, September 2018 33
Not-for-profit healthcare outlook revised
to negative in 2017
NEGATIVE STABLE POSITIVE
» Operating cash flow will
contract by 2%-4% over a
12 to 18 month period
» Slowed revenue growth
and increased expense
pressures
» Major regulatory changes
or disruptions to current
policies
What could change outlook to
stable
» Operating cash flow growth
of 0% to 4% over a 12 to 18
month period
» Continued growth in patient
volumes should drive
revenue growth, although
expense pressures continue
to build
What could change outlook
to positive
» Sustained operating cash
flow growth above 4%
over a 12 to 18 month
period, after inflation
» Changes to state or
federal reimbursement
policies that result in
increased ongoing and
supplemental funding
A negative sector outlook indicates our view that fundamental business conditions will worsen. A positive outlook indicates that we expect fundamental business conditions
to improve. A stable sector outlook indicates that conditions are not expected to change significantly. Since sector outlooks represent our forward looking view on conditions
that factor into ratings, a negative (positive) outlook indicates that negative (positive) rating actions are more likely on average.

NAHEFFA, September 2018 34
Forecasted contraction in performance
underscores negative outlook
Source: Moody’s Investors Service

NAHEFFA, September 2018 35
Hospital revenues show growth of
governmental payors
» Medicare: Federal budget pressure;
DSH cuts; 340B changes
» Medicaid: Growing pension
liabilities mean cuts in Medicaid
» Exchanges: Uncertainty with
discontinuation of federal mandate
» Commercial: Much tougher
negotiations; benefit restrictions
» Uncompensated care: Bad debt
rising as high deductible plans and
co-pays continue to permeate many
employer benefit packages
2017
Governmental
Commercial
2011
Governmental
Commercial
Source: Moody’s Investors Service

NAHEFFA, September 2018 36
Expense pressures escalate
» Labor: nursing shortage as nurses retire; new graduates seek flexible
arrangements; locum tenens
» Supplies and drugs: drug price increases, shortages, new cancer drugs
» Retirement benefits: rising PBGC premiums as liabilities increase
» Information technology: escalating costs to install, maintain and upgrade
systems
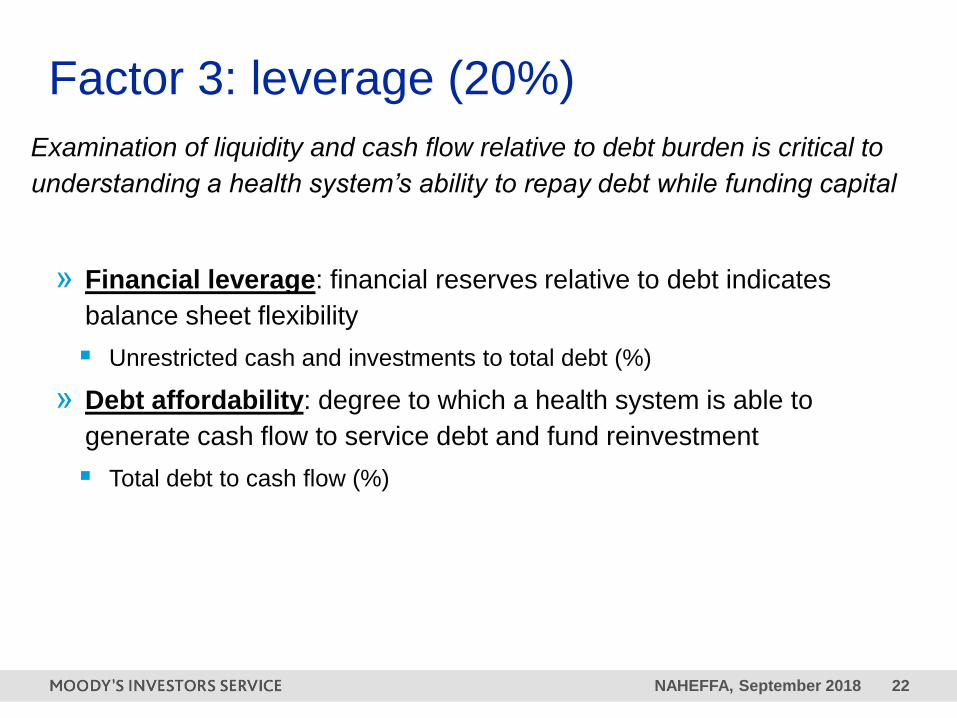
NAHEFFA, September 2018 37
What could change the outlook?
To Positive:
» Projection of sustained strong operating cash flow growth
» Expectation of materially lower expense growth
» Robust economic expansion
» Significant growth in balance sheet reserves
To Stable:
» Projection of resumption of operating cash flow growth
» Stabilization of expense growth
» Revenue growth outpacing expenses

NAHEFFA, September 2018 38
Expenses outpace revenue growth,
leading to margin decline
Key Ratios
2016 Prelim 2017
Operating Revenue $789m $878m
Operating Cash Flow Margin 9.3% 8.1%
Operating Margin 2.7% 1.8%
Days Cash on Hand 204 208
Medicare Mix 45.1% 46.3%
Cash to Debt 157% 166%
Cash to Adjusted Debt* 115% 126%
Debt to Revenue 35% 34%
Debt to Cash Flow (x) 2.8 3.0
*Adjusted debt includes pension liabilities and operating lease debt-equivalent
using a 4x multiplier
Source: Moody’s Investors Service
0
1
2
3
4
5
6
7
8
2013 2014 2015 2016 2017
Expenses outpacing revenues
Annual Operating Revenue GrowthRate (%)
Annual Operating Expense GrowthRate (%)
0
10
20
30
40
50
60
70
80
90
100
2013 2014 2015 2016 2017
Number of hospitals with operating deficits increasing

NAHEFFA, September 2018 39
Disruptors to not-for-profit healthcare
» Commercial insurers pursuing aggressive strategies
– Purchasing providers (Optum, CVS/Aetna, Humana/Kindred)
– Narrow networks; reductions in rates
– Benefit design: limiting coverage (non-emergent ER visits)
» Non-traditional disruptors could be positive
– Amazon selling medical products
– Intermountain Healthcare, SSM, Trinity Health and others entering generic drug
manufacturing
» Ongoing M&A
– Seeking scale, diversification and cost efficiencies, but is scale always good?
NAHEFFA, September 2018 40
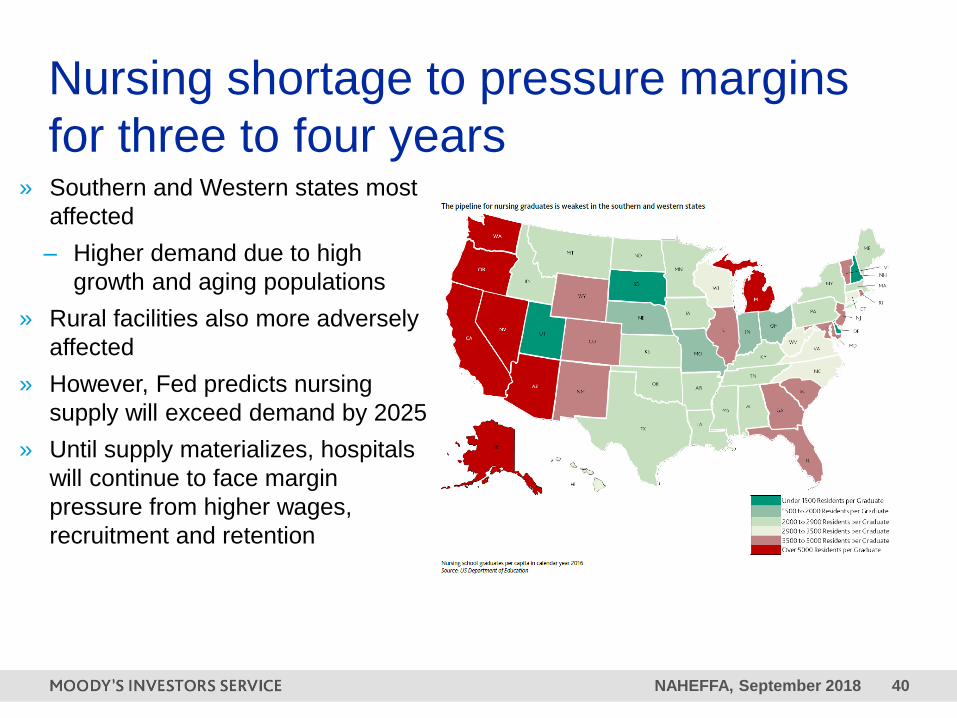
Nursing shortage to pressure margins
for three to four years» Southern and Western states most
affected
– Higher demand due to high
growth and aging populations
» Rural facilities also more adversely
affected
» However, Fed predicts nursing
supply will exceed demand by 2025
» Until supply materializes, hospitals
will continue to face margin
pressure from higher wages,
recruitment and retention

NAHEFFA, September 2018 41
Changes to 340B drug program» Drug costs continue to rise but the pace will moderate
– Increased public scrutiny
– Generic competition will reduce generic pricing
» Changes to 340B will have varying credit implications
– Unlikely to impact individual credit quality – but an added operating headwind
– Mainly credit neutral for cancer and children’s hospitals

NAHEFFA, September 2018 42
Challenges facing rural America
» Poor labor market prospects
– Sales, income and property taxes negatively affected
– Rural areas without oil-, gas- or tourism industries affected the most
– Rural-urban gap in total employment significantly diverged after Great
Recession and continues to widen
» Population loss and aging workforce
– Driven by urban migration and falling birth rates
– Rate of business formation has weakened
» Growing costs due to increased need for public services
– Public health services have grown with aging population

NAHEFFA, September 2018 43
What will healthcare of the future look like?
» Finding the right balance of inpatient and outpatient will be integral
» Ongoing investments in IT, EMR and digitalization; cybersecurity in prime focus
» Labor and output productivity measures
» Commitment of board to multi-year strategies, even those without short-term gain
» Integrated capital, financial and strategic
» Willingness and flexibility to change strategy, culture
» Physician buy-in

Lisa Goldstein
Associate Managing Director
Not-for-profit Healthcare
Public Finance
+1.212.553.4431
moodys.com
Susan Fitzgerald
Associate Managing Director
Global Higher Education
Public Finance
+1.212.553.6832
Kendra Smith
Managing Director
Global Higher education,
healthcare and housing
Public Finance
+1.212.553.4807
NAHEFFA, September 2018 45
© 2018 Moody’s Corporation, Moody’s Investors Service, Inc., Moody’s Analytics, Inc. and/or their licensors and
affiliates (collectively, “MOODY’S”). All rights reserved.
CREDIT RATINGS ISSUED BY MOODY'S INVESTORS SERVICE, INC. AND ITS RATINGS AFFILIATES
(“MIS”) ARE MOODY’S CURRENT OPINIONS OF THE RELATIVE FUTURE CREDIT RISK OF ENTITIES,
CREDIT COMMITMENTS, OR DEBT OR DEBT-LIKE SECURITIES, AND MOODY’S PUBLICATIONS MAY
INCLUDE MOODY’S CURRENT OPINIONS OF THE RELATIVE FUTURE CREDIT RISK OF ENTITIES,
CREDIT COMMITMENTS, OR DEBT OR DEBT-LIKE SECURITIES. MOODY’S DEFINES CREDIT RISK AS
THE RISK THAT AN ENTITY MAY NOT MEET ITS CONTRACTUAL, FINANCIAL OBLIGATIONS AS THEY
COME DUE AND ANY ESTIMATED FINANCIAL LOSS IN THE EVENT OF DEFAULT. CREDIT RATINGS DO
NOT ADDRESS ANY OTHER RISK, INCLUDING BUT NOT LIMITED TO: LIQUIDITY RISK, MARKET VALUE
RISK, OR PRICE VOLATILITY. CREDIT RATINGS AND MOODY’S OPINIONS INCLUDED IN MOODY’S
PUBLICATIONS ARE NOT STATEMENTS OF CURRENT OR HISTORICAL FACT. MOODY’S PUBLICATIONS
MAY ALSO INCLUDE QUANTITATIVE MODEL-BASED ESTIMATES OF CREDIT RISK AND RELATED
OPINIONS OR COMMENTARY PUBLISHED BY MOODY’S ANALYTICS, INC. CREDIT RATINGS AND
MOODY’S PUBLICATIONS DO NOT CONSTITUTE OR PROVIDE INVESTMENT OR FINANCIAL ADVICE,
AND CREDIT RATINGS AND MOODY’S PUBLICATIONS ARE NOT AND DO NOT PROVIDE
RECOMMENDATIONS TO PURCHASE, SELL, OR HOLD PARTICULAR SECURITIES. NEITHER CREDIT
RATINGS NOR MOODY’S PUBLICATIONS COMMENT ON THE SUITABILITY OF AN INVESTMENT FOR ANY
PARTICULAR INVESTOR. MOODY’S ISSUES ITS CREDIT RATINGS AND PUBLISHES MOODY’S
PUBLICATIONS WITH THE EXPECTATION AND UNDERSTANDING THAT EACH INVESTOR WILL, WITH
DUE CARE, MAKE ITS OWN STUDY AND EVALUATION OF EACH SECURITY THAT IS UNDER
CONSIDERATION FOR PURCHASE, HOLDING, OR SALE.
MOODY’S CREDIT RATINGS AND MOODY’S PUBLICATIONS ARE NOT INTENDED FOR USE BY RETAIL
INVESTORS AND IT WOULD BE RECKLESS AND INAPPROPRIATE FOR RETAIL INVESTORS TO USE
MOODY’S CREDIT RATINGS OR MOODY’S PUBLICATIONS WHEN MAKING AN INVESTMENT DECISION.
IF IN DOUBT YOU SHOULD CONTACT YOUR FINANCIAL OR OTHER PROFESSIONAL ADVISER.
ALL INFORMATION CONTAINED HEREIN IS PROTECTED BY LAW, INCLUDING BUT NOT LIMITED TO,
COPYRIGHT LAW, AND NONE OF SUCH INFORMATION MAY BE COPIED OR OTHERWISE
REPRODUCED, REPACKAGED, FURTHER TRANSMITTED, TRANSFERRED, DISSEMINATED,
REDISTRIBUTED OR RESOLD, OR STORED FOR SUBSEQUENT USE FOR ANY SUCH PURPOSE, IN
WHOLE OR IN PART, IN ANY FORM OR MANNER OR BY ANY MEANS WHATSOEVER, BY ANY PERSON
WITHOUT MOODY’S PRIOR WRITTEN CONSENT.
CREDIT RATINGS AND MOODY’S PUBLICATIONS ARE NOT INTENDED FOR USE BY ANY PERSON AS A
BENCHMARK AS THAT TERM IS DEFINED FOR REGULATORY PURPOSES AND MUST NOT BE USED IN
ANY WAY THAT COULD RESULT IN THEM BEING CONSIDERED A BENCHMARK.
All information contained herein is obtained by MOODY’S from sources believed by it to be accurate and
reliable. Because of the possibility of human or mechanical error as well as other factors, however, all
information contained herein is provided “AS IS” without warranty of any kind. MOODY'S adopts all necessary
measures so that the information it uses in assigning a credit rating is of sufficient quality and from sources
MOODY'S considers to be reliable including, when appropriate, independent third-party sources. However,
MOODY’S is not an auditor and cannot in every instance independently verify or validate information received in
the rating process or in preparing the Moody’s publications.
To the extent permitted by law, MOODY’S and its directors, officers, employees, agents, representatives,
licensors and suppliers disclaim liability to any person or entity for any indirect, special, consequential, or
incidental losses or damages whatsoever arising from or in connection with the information contained herein or
the use of or inability to use any such information, even if MOODY’S or any of its directors, officers, employees,
agents, representatives, licensors or suppliers is advised in advance of the possibility of such losses or
damages, including but not limited to: (a) any loss of present or prospective profits or (b) any loss or damage
arising where the relevant financial instrument is not the subject of a particular credit rating assigned
by MOODY’S.
To the extent permitted by law, MOODY’S and its directors, officers, employees, agents, representatives,
licensors and suppliers disclaim liability for any direct or compensatory losses or damages caused to any person
or entity, including but not limited to by any negligence (but excluding fraud, willful misconduct or any other type
of liability that, for the avoidance of doubt, by law cannot be excluded) on the part of, or any contingency within
or beyond the control of, MOODY’S or any of its directors, officers, employees, agents, representatives,
licensors or suppliers, arising from or in connection with the information contained herein or the use of or inability
to use any such information.
NO WARRANTY, EXPRESS OR IMPLIED, AS TO THE ACCURACY, TIMELINESS, COMPLETENESS,
MERCHANTABILITY OR FITNESS FOR ANY PARTICULAR PURPOSE OF ANY SUCH RATING OR OTHER
OPINION OR INFORMATION IS GIVEN OR MADE BY MOODY’S IN ANY FORM OR MANNER
WHATSOEVER.
Moody’s Investors Service, Inc., a wholly-owned credit rating agency subsidiary of Moody’s Corporation
(“MCO”), hereby discloses that most issuers of debt securities (including corporate and municipal bonds,
debentures, notes and commercial paper) and preferred stock rated by Moody’s Investors Service, Inc. have,
prior to assignment of any rating, agreed to pay to Moody’s Investors Service, Inc. for appraisal and rating
services rendered by it fees ranging from $1,500 to approximately $2,500,000. MCO and MIS also maintain
policies and procedures to address the independence of MIS’s ratings and rating processes. Information
regarding certain affiliations that may exist between directors of MCO and rated entities, and between entities
who hold ratings from MIS and have also publicly reported to the SEC an ownership interest in MCO of more
than 5%, is posted annually at www.moodys.com under the heading “Investor Relations — Corporate
Governance — Director and Shareholder Affiliation Policy.”
Additional terms for Australia only: Any publication into Australia of this document is pursuant to the Australian
Financial Services License of MOODY’S affiliate, Moody’s Investors Service Pty Limited ABN 61 003 399
657AFSL 336969 and/or Moody’s Analytics Australia Pty Ltd ABN 94 105 136 972 AFSL 383569 (as applicable).
This document is intended to be provided only to “wholesale clients” within the meaning of section 761G of the
Corporations Act 2001. By continuing to access this document from within Australia, you represent to MOODY’S
that you are, or are accessing the document as a representative of, a “wholesale client” and that neither you nor
the entity you represent will directly or indirectly disseminate this document or its contents to “retail clients” within
the meaning of section 761G of the Corporations Act 2001. MOODY’S credit rating is an opinion as to the
creditworthiness of a debt obligation of the issuer, not on the equity securities of the issuer or any form of
security that is available to retail investors. It would be reckless and inappropriate for retail investors to use
MOODY’S credit ratings or publications when making an investment decision. If in doubt you should contact your
financial or other professional adviser.
Additional terms for Japan only: Moody's Japan K.K. (“MJKK”) is a wholly-owned credit rating agency subsidiary
of Moody's Group Japan G.K., which is wholly-owned by Moody’s Overseas Holdings Inc., a wholly-owned
subsidiary of MCO. Moody’s SF Japan K.K. (“MSFJ”) is a wholly-owned credit rating agency subsidiary of MJKK.
MSFJ is not a Nationally Recognized Statistical Rating Organization (“NRSRO”). Therefore, credit ratings
assigned by MSFJ are Non-NRSRO Credit Ratings. Non-NRSRO Credit Ratings are assigned by an entity that is
not a NRSRO and, consequently, the rated obligation will not qualify for certain types of treatment under U.S.
laws. MJKK and MSFJ are credit rating agencies registered with the Japan Financial Services Agency and their
registration numbers are FSA Commissioner (Ratings) No. 2 and 3 respectively.
MJKK or MSFJ (as applicable) hereby disclose that most issuers of debt securities (including corporate and
municipal bonds, debentures, notes and commercial paper) and preferred stock rated by MJKK or MSFJ (as
applicable) have, prior to assignment of any rating, agreed to pay to MJKK or MSFJ (as applicable) for appraisal
and rating services rendered by it fees ranging from JPY200,000 to approximately JPY350,000,000.
MJKK and MSFJ also maintain policies and procedures to address Japanese regulatory requirements.
This publication does not announce a credit rating action. For any credit ratings referenced in this publication, please see the ratings tab on the issuer/entity page on www.moodys.com for the most updated credit rating action
information and rating history.