Embed Size (px)
Citation preview

Higher-Ed Policy in 2015: What Should the Goal Be?
Diana CarewProgressive Policy Institute
February 3, 2014

Agenda• A Hot Topic: Flurry of New Proposals• What Should the Goal Be?• Why Completion Matters • Targeting Completion• The Bigger Picture:– The importance of skills matching in
addition to completion• Higher Ed in the 21st Cetury• Implications for Policy

Lots of New Proposals• FAST• REPAY• Free Community College• Institutional Rankings• Discharge student debt in bankruptcy• Re-fi, revisited?• And many more (but not 529s)

What Should the Goal Be?• The emphasis is mainly on increasing
access and enrollment– Less on completion and outcomes– Rankings are an attempt at accountability
• Should We Care More About Completion?– A factor in majority of loan defaults– Seriously divergent outcomes
• What about Alternative Pathways into the Workforce?– Is it practical for everyone to get a college
degree, and do we all need one?
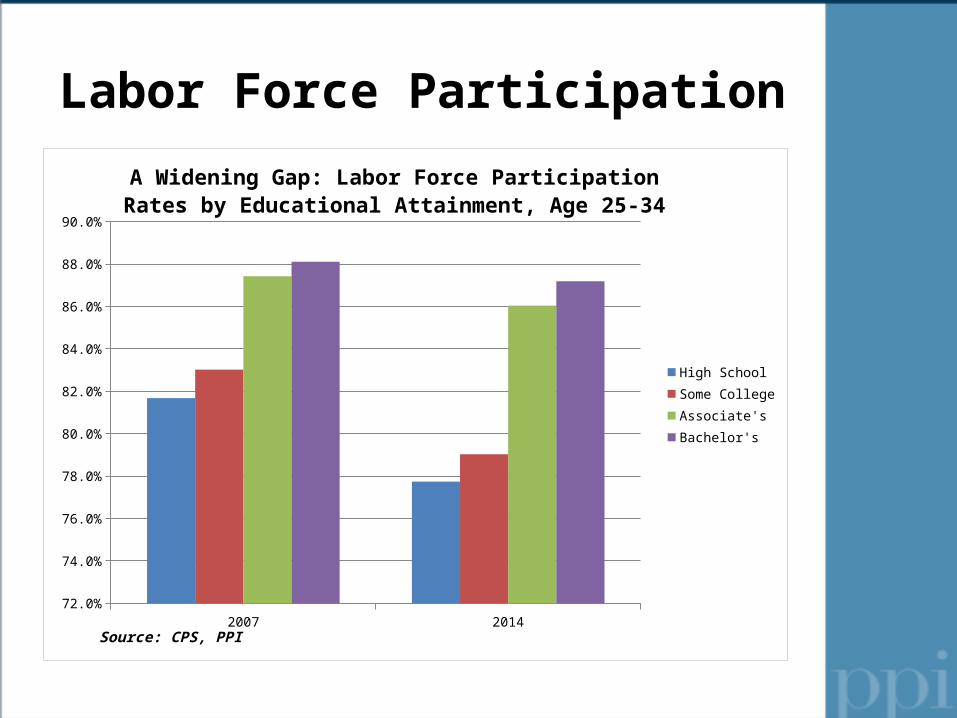
Labor Force Participation
2007 201472.0%
74.0%
76.0%
78.0%
80.0%
82.0%
84.0%
86.0%
88.0%
90.0%
A Widening Gap: Labor Force Participation Rates by Educational Attainment, Age 25-34
High SchoolSome CollegeAssociate'sBachelor's
Source: CPS, PPI

Real Earnings
2007 2008 2009 2010 2011 2012 2013$20,000
$25,000
$30,000
$35,000
$40,000
$45,000
$50,000
$55,000
$60,000
$65,000
$70,000
Real Average Annual Earnings by Education Level, Age 25-34 (in 2013$)*
High School
Some College
Associate's
Bachelor's
*Full-time, year-round workers aged 25-34, average annual earnings in 2013$
Source: Current Population Survey, PPI

Jobs: College Grads• Workforce Shifting: 2009-2014 Employment Change,
BA only, age 25-34*
2009-2014 Change
Healthcare practitioner and technician 29.3%Business and financial 24.3%Computer and mathematical 22.7%Food preparation and serving 21.8%Arts, design, entertainment, sports, media 16.8%Offi ce and administrative 13.9%All occupations 12.2%*In occupational groups with employment over 200,000Source: CPS, PPI

Jobs: Some College• No Degree: 2009-2014 Employment
Change, age 25-34*2009-2014
ChangeProduction 31.8%Healthcare practitioner and technician 18.4%Food preparation and serving 15.2%Personal care 12.7%Transportation and material moving 12.5%Installation, maintenance, and repair 7.4%All occupations 2.6%*In occupational groups with employment over 200,000Source: CPS, PPI

Point: Completion, Skills Matching Better Goals
• Completion critical but so is skills matching and alternative pathways– Too many people getting degrees they aren’t
using, squeezing everyone else down and out
High School
Some College
Bachelor's only
Business and financial -20.1% -20.3% 24.3%Computer and mathematical -41.5% -14.6% 22.7%Food preparation and serving 5.5% 15.2% 21.8%Offi ce and administrative -10.5% -7.8% 13.9%Source: CPS, PPI
College Gone Wrong: Both Essential and UneccessaryEmployment change, 2009-2014, age 25-34

Targeting Completion & Skills Matching
• Students Need More!– Better Information about Schools• That includes the various types of schools
and pathways into the workforce
– Better Career Counseling– Better Financial Literacy
• Schools Need to do Better!– Better Matching to Skills in Demand– Working with Employers (PPPs for
human capital infrastructure)

The Bigger Picture: Tech Opportunity
• Tech jobs (computer & mathematical) have increased by about 1 million since recovery began:– Not just in Silicon Valley or at Google
• Enormous source of opportunity and economic mobility for minorities:– More jobs gained for college-educated African Americans
in tech than healthcare since 2009• Need better career matching and college counseling:
– Too many science minded female and minority students are being funneled into healthcare over tech jobs
– Women especially are not benefiting from the tech jobs boom

The Bigger Picture: Post-Recession Consumer Welfare
• Data Sector driving post-recession gains in consumer welfare– As defined by per capita real PCE
• New way to think about stale inequality debate and stagnant wages– And why Americans are frustrated even as
official data shows recovery• Those who can participate in data-
driven economy will benefit most– Goes back to jobs chart

Future of Higher-Ed• Defined by Better Matching of
Education/Training to Skills in Demand– More pathways into the workforce – Data-driven curriculum in partnership with
employers• Using tech to customize design and delivery
of knowledge• Training for tomorrow’s middle-skill jobs to
promote shared prosperity– Driverless car mechanics– Unmanned drone technicians– Smart home network designers

Thinking about Policy• Invest more in CTE training
– Not free college• Encourage new models of higher-ed
– Competency-based– Customized (online/in person hybrid)
• Start earlier than college– Incorporate financial literacy and effective career
decision-making in high-schools• Figure out data privacy issues
– Network integration across stakeholders• Streamline student loan repayment programs
– Reduce unnecessary complications