Embed Size (px)
Citation preview

Highbridge Multi-Strategy Fund LimitedFormerly known as BlueCrest AllBlue Fund Limited Annual Report & Accounts for the year ended 31st December 2015
COPYRIGHT HIGHBRIDGE MULTI-STRATEGY FUND LIMITED 2016 REGISTERED COMPANY NUMBER: 44704
Contents Contents .............................................................................................................................................................. 2 2015 in Numbers ................................................................................................................................................. 3 Chairman’s Statement ......................................................................................................................................... 4 Company & Investment Overview ....................................................................................................................... 8 Highbridge 2016 Market Outlook ....................................................................................................................... 13 Directors and Secretary ..................................................................................................................................... 15 Report of the Directors ....................................................................................................................................... 17 Risk Committee Report ...................................................................................................................................... 37 Audit Committee Report .................................................................................................................................... 40 Independent Auditor’s Report ............................................................................................................................ 45 Audited Financial Statements Primary Accounting Policies .................................................................................................................... 51 Financial Statements ............................................................................................................................... 52 Notes to the Financial Statements .......................................................................................................... 60 AllBlue Report .................................................................................................................................................... 79 Glossary ............................................................................................................................................................. 88 Directors and Service Providers ........................................................................................................................ 89
2015 IN NUMBERS DISCLAIMERS:
1. Information is for the Company as at 31 December 2015. 2. Published NAV. 3. Information is for the Highbridge Multi-Strategy Fund as at 31 December 2015. 4. Performance represents returns for the Highbridge Multi-Strategy Fund’s non-restricted Class D shares from 1 January 2015 to 31 December 2015, net of all applicable fees and expenses. PAST PERFORMANCE IS NOT NECESSARILY INDICATIVE OF FUTURE RESULTS. 5. Source: FTSE International Limited (“FTSE”) © FTSE 2015. “FTSE ®” is a trade mark of the London Stock Exchange Group companies and is used by FTSE International Limited under license. All rights in the FTSE indices vest in FTSE and/or its licensors. Neither FTSE nor its licensors accept any liability for any errors or omissions in the FTSE indices or underlying data. No further distribution of FTSE data is permitted without FTSE’s express written consent. 6. FTSE 100 Total Return Index (USD) (“FTSE 100”). The FTSE 100 Index (USD) measures the total return of the underlying FTSE 100 index, combining both capital performance and income (reinvested on the dividend (xd) date). It comprises the 100 most highly capitalised blue chip companies listed on London Stock Exchange. Ticker: TUKXG Index (Currency USD). 7. Annualised Volatility measures the dispersal or uncertainty in a random variable. It measures the degree of variation (in this case) of monthly net returns around the average monthly net return. For this reason, volatility is often used as a measure of investment risk. Values are calculated by applying the traditional sample standard deviation formula to monthly return data, and then annualised by multiplying the result by the square root of twelve. Volatility is annualised. HMSF Beta is calculated as the realised slope of the portfolio’s return to the index’s return, based on monthly observations. 8. The Products are not sponsored, endorsed, sold or promoted by Barclays Capital, and Barclays Capital makes no warranty, express or implied, as to the results to be obtained by any person or entity from the use of any index, any opening, intra-day or closing value therefor, or any data included therein or relating thereto, in connection with any Fund or for any other purpose. Barclays Capital’s only relationship to the Licensee with respect to the Products is the licensing of certain trademarks and trade names of Barclays Capital and the Barclays Capital indexes that are determined, composed and calculated by Barclays Capital without regard to Licensee or the Products. The Barclays Aggregate Bond Index (“Barclays Agg.") represents securities that are U.S. domestic, taxable and dollar denominated. The index covers the U.S. investment grade fixed rate bond market, with index components for government and corporate securities, mortgage pass-through securities, and asset-backed securities. These major sectors are subdivided into more specific indices that are calculated and reported on a regular basis. 9. Source: Hedge Fund Research, Inc. (HFR). The HFRI Fund of Funds Diversified Index includes fund of funds classified as 'Diversified' which exhibit one or more of the following characteristics: invests in a variety of strategies among multiple managers; historical annual return and/or a standard deviation generally similar to the HFRI Fund of Fund Composite index; demonstrates generally close performance and returns distribution correlation to the HFRI Fund of Fund Composite Index. A fund in the HFRI FOF Diversified Index tends to show minimal loss in down markets while achieving superior returns in up markets. Index is USD denominated. Note: All index performance information has been obtained from third parties and should not be relied upon as being complete or accurate. Indices are shown for comparison purpose only. While an investor may invest in vehicles designed to track certain indices, an investor cannot invest directly in an index. Indices are unmanaged, do not charge fees or expenses, and do not employ special investment techniques such as leverage or short selling.
Page 2 v. 2.7
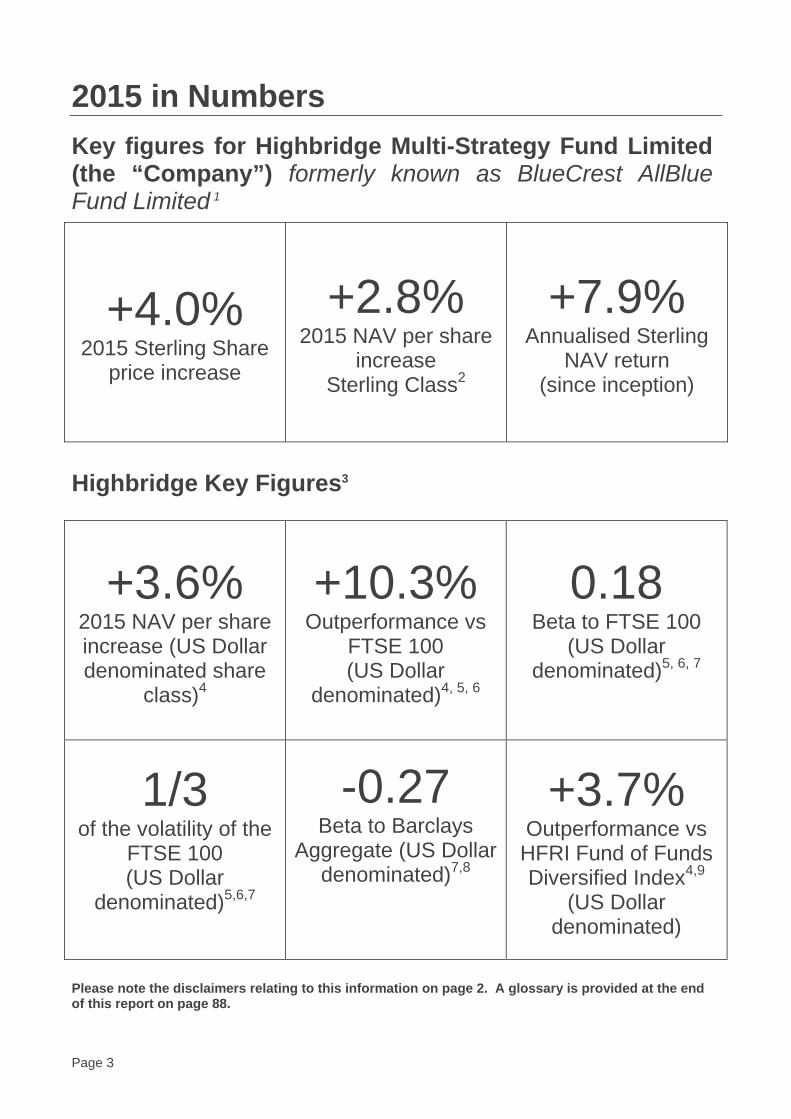
2015 in Numbers Key figures for Highbridge Multi-Strategy Fund Limited (the “Company”) formerly known as BlueCrest AllBlue Fund Limited 1
+4.0% 2015 Sterling Share
price increase
+2.8% 2015 NAV per share
increase Sterling Class2
+7.9% Annualised Sterling
NAV return (since inception)
Highbridge Key Figures3
+3.6% 2015 NAV per share increase (US Dollar denominated share
class)4
+10.3% Outperformance vs
FTSE 100 (US Dollar
denominated)4, 5, 6
0.18 Beta to FTSE 100
(US Dollar denominated)5, 6, 7
1/3 of the volatility of the
FTSE 100 (US Dollar
denominated)5,6,7
-0.27 Beta to Barclays
Aggregate (US Dollar denominated)7,8
+3.7% Outperformance vs HFRI Fund of Funds Diversified Index4,9
(US Dollar denominated)
Please note the disclaimers relating to this information on page 2. A glossary is provided at the end of this report on page 88.
Page 3 v. 2.7

Chairman’s Statement RETURN OF CAPITAL AND CHANGE OF INVESTMENT POLICY
The most significant event for your Company during 2015 occurred on 1 December 2015 when BlueCrest,
and the Boards of Directors of each of the relevant BlueCrest Funds (or General Partner, where appropriate),
announced that the BlueCrest Funds would embark upon a programme to return the capital managed in
those funds to external investors. The effective date on which this return of capital began was 4 January
2016, and so your Board had little time in which to consider the best way to shape the future of the
Company.
However, we did act quickly, immediately seeking feedback from investors on the options for the future of the
Company. It became apparent that there was appetite for a continuation of the Company or a rollover into a
listed, vehicle. Accordingly, we sought expressions of interest from potential investment managers to take
over the management of the Company’s assets. 30 expressions of interest were reviewed by your Board.
Two directors met with thirteen potential new managers in London in mid December, with five presenting to
the whole Board prior to the end of the year.
Highbridge Capital Management, LLC (“Highbridge”) was identified as our preferred option, and, it was
decided that the Company should, if possible, continue in order to avoid the costs associated with forming
and listing a new vehicle. A specialist firm was engaged to carry out operational due diligence on Highbridge
whilst in parallel a proposed new investment management agreement was negotiated. After receiving and
reviewing the operational due diligence report, we were able to announce Highbridge as the proposed
manager for the continuing company on 14 January 2016, only six weeks after the announcement from
BlueCrest.
Detailed proposals setting out the proposed change of the Company’s investment policy, the option for
investors to receive cash for their shares and the appointment of Highbridge were sent to shareholders in a
circular dated 8 February 2016. These proposals were passed by a very large majority and Highbridge was
appointed on 29 February 2016, with the Company’s first investment into the sterling share class of
Highbridge Capital Corporation (“HCC”) being made with effect from 1 March 2016. On the same date, the
Company made its first distribution of cash (£1.54 per Sterling share and $1.51 per US Dollar share) to
shareholders who had elected to redeem.
Taking account of the provision for exiting shareholders’ entitlements, the continuing Company had a net
asset value of approximately £260 million. As detailed in Note 16, the Company has to date received
approximately £557m and US$34m from the BlueCrest funds, substantially all of which has been distributed
to exiting shareholders or invested into HCC.
Page 4 v. 2.7

The proposals, once voted upon, also gave the Directors the power to compulsorily convert US Dollar shares
into Sterling Shares. Since the size of the US Dollar share class remaining after taking into account the
elections to redeem was sub-optimal in size, the Directors chose to exercise their power, contained in the
Company’s Articles, to convert the US Dollar shares remaining in issue on 29 February 2016 into Sterling
shares. Unfortunately, the calculation of the conversion ratio to be applied was erroneous, with too many
Sterling shares being notified to the relevant investors and to the UK Listing Authority and the London Stock
Exchange. When the Company identified and announced this error, dealings in the Company’s shares were
suspended on 7 March 2016, pending resolution of the error. The error was corrected to the UK Listing
Authority’s satisfaction on 11 March 2016 and the suspension lifted on 14 March. We deeply regret this
error and the inconvenience it has caused to investors, but wish to point out that the error and its correction
have not caused any loss to the Company or shareholders.
ADVANTAGES OF HIGHBRIDGE AS INVESTMENT MANAGER
The Board believes that the appointment of Highbridge as investment manager has many advantages to the
Company and its shareholders, as was more fully explained in the circular to shareholders on 8 February
2016. These advantages may be summarised as being –
• Lower overall fees than have been incurred previously;
• The Highbridge multi strategy fund (the “Underlying Fund”), into which the Company invests has
historically achieved higher returns with lower volatility than the Company has previously achieved
(although of course past performance is no guide to that in the future);
• The structure of the Underlying Fund is simpler and more transparent.
• Highbridge has assumed the role of the Company’s Alternative Investment Fund Manager (“AIFM”)
for purposes of the EU’s AIFM Directive, thereby enabling the Company to possibly raise more
capital in the future, with the prospect of diluting the ongoing charges ratio for investors.
DISCOUNT MANAGEMENT
The new articles of association adopted by shareholders on 24 February, introduce a more flexible approach
to discount management. In addition to a quarterly tender offer to buy back shares, which is entirely at the
Directors’ discretion, a continuation resolution must be put to shareholders at the annual general meeting in
2021, and, subject to the passing of that resolution, every five years thereafter,
REVIEW OF 2015
I am pleased to report another year of positive performance for your Company, with the Sterling share price
and Net Asset Value per share rising by 3.8% and 2.8% respectively despite some challenging conditions.
Page 5 v. 2.7

This performance during 2015 was achieved in markets which endured very low, or even negative, interest
rates, very sharp shifts in the value of bond and equity markets caused by investors’ alternating “risk on” and
“risk off” attitudes, and some quite challenging conditions especially in the second half of the year.
Throughout the year the Company followed its previous investment policy of investing substantially all of its
assets into AllBlue Limited. More insight into how this policy performed is given in the AllBlue Investment
Management Report on page 79.
Since inception of the Company this, previous, investment policy has brought annualised net asset value
returns of 6.9%, at an annualised standard deviation of only 1% and a correlation to the FTSE 100 Total
Return Index of only 0.1.
Returning to look at 2015, the discount of the Company’s share price to its published NAV, for both share
classes, remained in the 4% to 4.5% range for the first half of the year, before declining steadily in the
second half of the year to just above 5%. Under the previous discount management provisions, a
continuation vote for the Sterling share class was triggered in November 2015, and in December for the US
Dollar share class. However, the news of BlueCrest’s planned return of capital arrived before any
continuation votes could be organised and, instead, suitable resolutions were passed at the class meetings
held on 24 February 2016 to remove the need for them.
During 2015, the Company continued its policy of carrying out market purchases of its own shares in order to
reduce the discount which might otherwise arise and to enhance the net asset value for remaining
shareholders. In total the Company purchased Sterling shares with a value of approximately £46m and US
Dollar shares worth some $5m, resulting in gains of approximately £2.6m (0.7 pence per share) and
$270,000 (0.9 cents per share) for the Sterling and US Dollar classes respectively.
SUCCESSION
As indicated in my Chairman’s statement last year, the Board has given considerable thought to succession
planning. The appointment of Miss Sarita Keen to the Board on 3 June 2015 was the first step in a planned
orderly refreshing of the Board which was to see John Le Prevost leave in 2015, followed by myself in 2016
and Paul Meader in 2017.
The news from BlueCrest and the subsequent work required to change the Company’s investment policy and
Manager, resulted in your Board asking Mr Le Prevost to stay on a little longer, until the
Company had stabilised under its new mandate. I am delighted to say that he agreed to stay on, and his
contribution and insight has been invaluable throughout the process. He stepped down from the Board on
27 April 2016, and we wish him well for the future.
He has of course effectively been replaced on the Board by Miss Keen, but the search for a replacement
Chairman has recently been restarted after being suspended whilst the Company was restructured. I am
hopeful that a new Chair will be found in time for his, or her, election to be put to shareholders at the
Page 6 v. 2.7

forthcoming Annual General Meeting in July 2016, and if so I will step down at that time. Otherwise I will
continue to serve until a suitable replacement is found later in the year.
Next year, Mr Meader plans to step down, again most probably at the time of the 2017 AGM, and this will
complete the succession plan I originally outlined last year, on time. Your Board will then comprise
individuals appointed in each of the calendar years 2014 to 2017, inclusive, ensuring that appropriate levels
of corporate knowledge and history remain on the Board whilst avoiding the possibility of incumbents
reaching their time limits simultaneously.
In addition to the succession plans detailed above, as a result of the decision by BlueCrest to return capital
to third party investors, including the Company, Andrew Dodd, who sat on the Board of Directors of the
Company as an employee of BlueCrest chose to resign as a director of the Company on 3 February 2016 in
advance of the proposed change of investment policy. I would like to thank Mr Dodd for his contribution to
the Company over the last eight years.
LOOKING FORWARD
The uncertainties in the global economic and political backdrop persist and investment markets remain both
cautious and volatile. In such an environment, the need for a solid and reliable cornerstone to investment
portfolios remains as important as ever. Further, with the outlook for all asset classes remaining uncertain,
that cornerstone needs to be able to generate returns regardless of the direction of movement in both bonds
and equity markets. Following a very thorough search, your Board believes that Highbridge Capital
Management has the credentials and the proven capability to achieve these goals. Their track record
speaks for itself and we look forward to a long and fruitful relationship with Highbridge on your behalf.
Richard Crowder
Chairman
Page 7 v. 2.7
Company & Investment Overview The Company is a Guernsey closed-ended investment company listed and traded on the Premium Segment
of the Official List of the United Kingdom Listing Authority and traded on the Main Market of the London
Stock Exchange with assets of approximately £263m1.
Following the notification received from BlueCrest Capital Management Limited that all third party investors
in AllBlue and AllBlue Leveraged would be redeemed effective 4 January 2016, an Extraordinary General
Meeting was held on 24 February 2016, at which the investment objective of the Company was changed to
seek to provide consistent returns with low volatility through an investment policy of investing substantially all
of its assets in the Highbridge multi strategy fund (“the Underlying Fund”) or any successor vehicle of the
Underlying Fund.
Prior to the Extraordinary General Meeting held 24 February 2016, the investment objective of the Company
was to seek to provide consistent long-term capital growth through an investment policy of investing
substantially all of its assets in AllBlue or any successor vehicle of AllBlue.
THE COMPANY
The Company has one share class, Sterling (the Dollar class was closed in February 2016,) and seeks to
provide shareholders with the following key benefits:
• Attractive returns which are not beholden to the direction of asset markets, created by skilled portfolio
management and a non-correlated, multi-strategy approach.
• Strong capital preservation characteristics reflecting robust risk management and expert blending of
various assets across discretionary and systematic funds.
• Good liquidity occasioned by active trading in the Company’s shares as the turnover on the London
Stock Exchange typically exceeds 0.5% of the total shares each week2.
ABOUT HIGHBRIDGE MULTI-STRATEGY FUND
The Company invests into the Underlying Fund through HCC, a limited liability company incorporated in the
Cayman Islands.
The Underlying Fund is a global multi-strategy hedge fund focused on relative value strategies with
idiosyncratic sources of return. The Underlying Fund allocates to a number of distinct strategies pursuing
equity, credit, convertible bond, volatility, capital structure arbitrage and macro opportunities across the
globe, as further described below.
1 As at 15 April 2016. 2 As at 26 April 2016.
Page 8 v. 2.7

Since its inception on 1 January 1993, the Underlying Fund has achieved 10.67 per cent. annualised net
returns, 6.89 per cent. annualised volatility and low beta relative to equity and credit indices3.
Key Features of the Underlying Fund
• Consistent Returns: The Underlying Fund targets attractive risk-adjusted returns with low volatility
and low beta to broad markets. It has a track record of delivering consistent risk-adjusted returns
over market cycles for more than 20 years.
• Diversified Global Exposure: Underlying investment strategies are diversified across asset
classes, investment styles and geographies. Highbridge employs dedicated teams on the ground in
London, New York and Hong Kong that seek to capture global investment opportunities.
• Relative Value Focus: The Underlying Fund focuses on relative value strategies with idiosyncratic
sources of return.
• Dynamic Capital Allocation: Within the Underlying Fund there is flexibility to allocate capital
dynamically across various asset classes and geographies.
• Capital Preservation: The investment process is focussed on robust risk management and
drawdown protection.
• Institutional Quality Infrastructure: Highbridge's world-class trading and investment platforms are
supported by infrastructure capabilities across risk management, compliance, client service,
operations, technology and finance.
About Highbridge
Highbridge was founded in 1992 as one of the industry’s first multi-strategy hedge fund managers. As of 1
January 2016, Highbridge had approximately US$29 billion in assets under management and a staff of over
390 employees, including approximately 150 investment professionals and has offices in London, New York
and Hong Kong4. Highbridge established a strategic partnership with J.P. Morgan Asset Management
(“JPMAM”) in 2004. Highbridge is a subsidiary of JPMAM, which is itself a subsidiary of JPMorgan Chase &
Co (together with its affiliates, "JPM”). JPMAM is a leading investment and wealth management firm,
operating across the Americas, EMEA (Europe, Middle East and Africa), and Asia in more than 30 countries,
with assets under management of $1.7 trillion5.
All investment, capital allocation and risk management decisions for the Underlying Fund are independent of
3 As of 31 December 2015 net of all applicable fees and expenses. Returns are estimated and unaudited for 2015. Shareholders should note that past performance is not necessarily indicative of future results and that there can be no assurance that the Company's and/or the Underlying Fund’s return objectives will be realised or that the Company and/or the Underlying Fund will not experience losses. 4 As of 1 January 2016. 5 As of 31 December 2015.
Page 9 v. 2.7
JPMAM. Highbridge is registered as an investment adviser under the U.S. Investment Advisers Act of 1940,
as amended.
In addition to managing the Underlying Fund, Highbridge has also been appointed as the investment
manager of the Company. As part of the new investment management arrangements, JPMAM provides
certain support services to the Company as delegate of Highbridge, including the provision of investor
relations, public relations and Board support.
Investment Objective and Strategy of the Underlying Fund
The Underlying Fund seeks to achieve annualised net returns of 7 to 12 per cent., with annualised volatility of 3 to 6 per cent., and a beta to the S&P 500 below 25 per cent6.
The Underlying Fund utilises a diversified, multi-strategy approach to investing across the following seven strategy groups and unique sub-strategies within those groups:
6 The annual target net return and other fund objectives have been established by Highbridge based on its assumptions and calculations using data available to it and in light of current market conditions and available investment opportunities and is subject to various risks including, without limitations, those set out in the circular published by the Company on 8 February 2016. These fund objectives are for illustrative purposes only and are subject to significant limitations. An investor should not expect to achieve actual returns similar to the annual target return shown above. Because of the inherent limitations of the target returns, investors should not rely on them when making any investment decision. These objectives cannot account for the impact that economic, market and other factors may have on the implementation of an actual investment program. Unlike actual performance, the target return and other fund objectives do not reflect actual trading, liquidity constraints and other factors that could impact the future returns of the portfolio. The Underlying Fund’s ability to achieve the target net return and fund objectives is subject to risk factors over which Highbridge may have no or limited control. There can be no assurance that the Underlying Fund will achieve its investment objective, the annual target net return or any other fund objectives. The actual returns achieved may be more or less than the annual target net return shown.
Page 10 v. 2.7
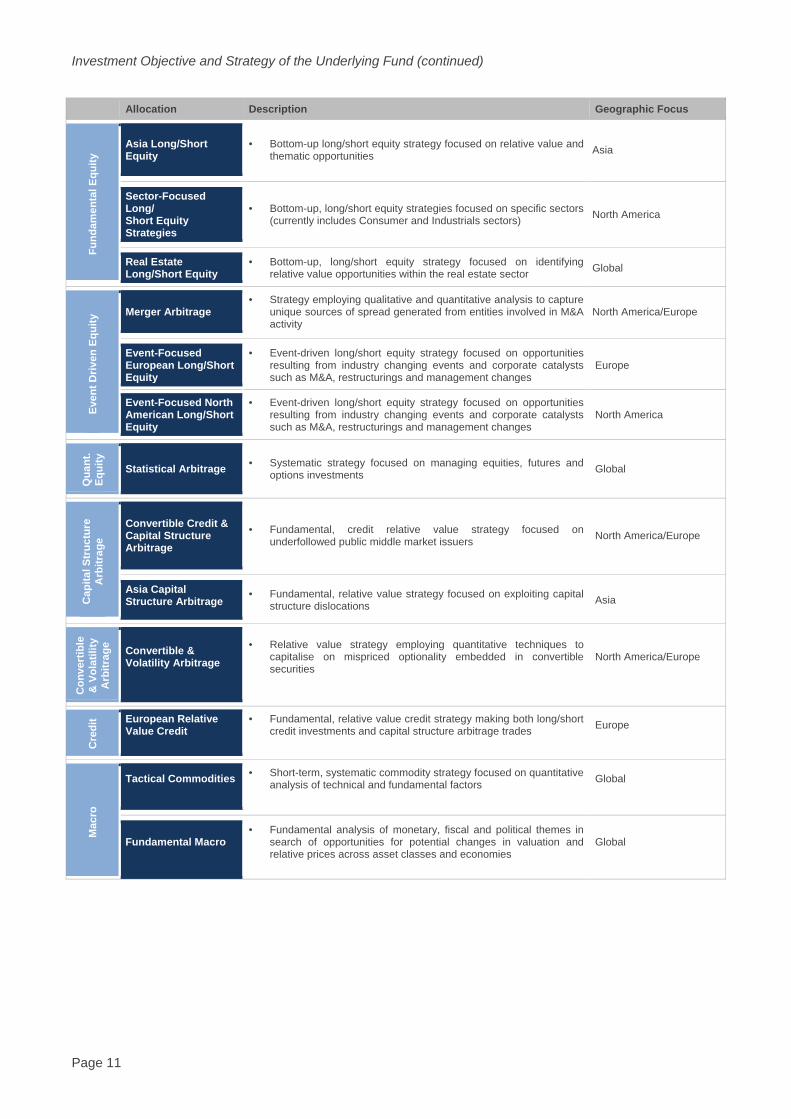
Investment Objective and Strategy of the Underlying Fund (continued)
Allocation Description Geographic Focus
Fund
amen
tal E
quity
Asia Long/Short Equity
• Bottom-up long/short equity strategy focused on relative value and thematic opportunities Asia
Sector-Focused Long/ Short Equity Strategies
• Bottom-up, long/short equity strategies focused on specific sectors (currently includes Consumer and Industrials sectors) North America
Real Estate Long/Short Equity
• Bottom-up, long/short equity strategy focused on identifying relative value opportunities within the real estate sector Global
Even
t Driv
en E
quity
Merger Arbitrage • Strategy employing qualitative and quantitative analysis to capture
unique sources of spread generated from entities involved in M&A activity
North America/Europe
Event-Focused European Long/Short Equity
• Event-driven long/short equity strategy focused on opportunities resulting from industry changing events and corporate catalysts such as M&A, restructurings and management changes
Europe
Event-Focused North American Long/Short Equity
• Event-driven long/short equity strategy focused on opportunities resulting from industry changing events and corporate catalysts such as M&A, restructurings and management changes
North America
Qua
nt.
Equi
ty
Statistical Arbitrage • Systematic strategy focused on managing equities, futures and options investments Global
Cap
ital S
truc
ture
A
rbitr
age
Convertible Credit & Capital Structure Arbitrage
• Fundamental, credit relative value strategy focused on underfollowed public middle market issuers North America/Europe
Asia Capital Structure Arbitrage
• Fundamental, relative value strategy focused on exploiting capital structure dislocations Asia
Con
vert
ible
&
Vol
atili
ty
Arb
itrag
e Convertible & Volatility Arbitrage
• Relative value strategy employing quantitative techniques to capitalise on mispriced optionality embedded in convertible securities
North America/Europe
Cre
dit European Relative
Value Credit • Fundamental, relative value credit strategy making both long/short
credit investments and capital structure arbitrage trades Europe
Mac
ro
Tactical Commodities • Short-term, systematic commodity strategy focused on quantitative analysis of technical and fundamental factors Global
Fundamental Macro • Fundamental analysis of monetary, fiscal and political themes in
search of opportunities for potential changes in valuation and relative prices across asset classes and economies
Global
Page 11 v. 2.7

ALLBLUE
As described in the Chairman’s statement on page 4, the Company was informed on 1 December 2015 that,
effective 4 January 2016, AllBlue and AllBlue Leveraged were being redeemed from the seven underlying
funds and were compulsorily redeeming the holdings of all investors, including the Company, on 4 January
2016. The Company retains a creditor interest equivalent to the value of its holding in AllBlue and AllBlue
Leveraged. This is measured by reference to the valuation statements received monthly from the
administrator of AllBlue and AllBlue Leveraged. Further information about the proceeds returned to the
Company is available in Note 16 to the Financial Statements.
Prior to this announcement, AllBlue was a multi-strategy fund of hedge funds investing in BlueCrest and
Systematica funds across AllBlue’s two core specialisations: discretionary and systematic trading. These two
complementary strategies were blended using seven underlying BlueCrest and Systematica funds.
Using robust risk management, AllBlue blended these seven non-correlated funds to produce attractive
returns with low volatility. AllBlue had full transparency into the seven funds aiding the sterling share class
return of 8.0%7 per annum since inception in 2006, combined with low volatility. A summary on each
underlying fund is provided at the end of the AllBlue Investment Manager report on page 79.
AllBlue and six of the underlying funds are managed by BlueCrest Capital Management Limited.
BlueTrend is managed by Systematica, an independent firm launched in January 2015 comprising the
systematic investment management business previously managed as part of BlueCrest Capital Management
Limited. Systematica is led by Leda Braga, formerly head of systematic trading at BlueCrest and manages
approximately $10.2bn8 across a number of futures and equity based strategies.
7 Net performance of AllBlue Limited (Class A GBP) to 31 December 2015. 8 As at 1 March 2016.
Page 12 v. 2.7

Highbridge 2016 Market Outlook On the invitation of the Directors of the Company, this commentary has been provided by Highbridge as
investment manager of both the Company and of Highbridge Multi-Strategy Fund and is provided without
any warranty as to its accuracy and without any liability incurred on the part of the Company. The
commentary is not intended to constitute, and should not be construed as, investment advice.
Potential investors in the Company should seek their own independent financial advice and may not rely on
this communication in evaluating the merits of investing in the Company. The commentary is provided as a
source of information for shareholders of the Company but is not attributable to the Company.
OUTLOOK FOR 2016
2016 has started with extreme volatility across asset classes around the globe. The first six weeks of the
year saw one of the most severe sell-offs in recent history with the unwind of the popular themes of 2015
such as long US dollar, long momentum and higher rates sending assets plummeting. Following this vicious
sell-off, the remainder of the quarter saw one of the sharpest bounce-backs on record, which caused its own
challenges for newly positioned, fragile markets but also has presented Highbridge with opportunities it
believes it can capitalise on during the rest of the year.
In equities, although the S&P 500 ended the first quarter up +0.8%, it was the first instance in over 80 years
that the S&P was down 10% during the quarter, yet finished in positive territory. Furthermore, the S&P
finished the quarter just 3% shy of its all-time highs. According to Morgan Stanley, Q1 was the worst quarter
of hedge fund alpha in seven years with style factors (momentum, growth, value, small vs. large cap, etc.)
accounting for most of the negative alpha. In an environment like this, Highbridge believes that its
quantitative equity strategies with mean-reverting qualities and tightly managed fundamental strategies
focused on short and medium term catalysts will be best positioned to perform in 2016.
In credit, the high yield market lost 5% amidst $4.5 billion of year to date outflows through February 11th,
netting the worst start to a year on record, but then staged the sharpest rebound from peak to trough in over
5 years. In the month and a half following February 11th, the high yield market returned a massive 9.1%
(more than the past three years combined) and tightened 220 bps amidst an unprecedented $12 billion in
retail flows over just 5 weeks. In the wake of this rollercoaster start to the year, Highbridge is seeing a
number of dislocations that are creating interesting investment opportunities including: the significant
bifurcation between where the widest 50% of the high yield market is trading versus the tightest 50%; the
$62 billion of “fallen angels” which have been downgraded from investment grade to high yield this year;
close to record-setting cheapness of non-investment grade versus investment grade convertible credit and
off-the-run versus on-the-run credit. Highbridge is therefore increasing the Underlying Fund’s allocations to
credit-oriented strategies that can seek to capitalise on the many opportunities Highbridge is seeing in the
space.
Page 13 v. 2.7

While markets have become increasingly unpredictable, Highbridge expects that elevated volatility is here to
stay and will continue carefully managing exposures. Throughout the challenging first quarter, the
Underlying Fund produced relatively steady performance with positive returns in two of the three months and
avoided the steep drawdowns experienced by many of Highbridge’s hedge fund peers. Highbridge’s ability
to preserve investor capital through this kind of volatility highlights not only the value of a multi-strategy fund,
but also the value of our investment philosophy of isolating idiosyncratic risk, focusing on relative value
opportunities and tightly managing exposures. Highbridge expects that strategies focused on opportunities
with asymmetric risk / reward and short to medium term catalysts will continue to offer the most compelling
opportunities in 2016. Looking ahead, Highbridge believes that it is in a strong position to capitalise on the
opportunities that are arising from recent market stress and is busy putting fresh capital to work.
Highbridge Capital Management, LLC
Page 14 v. 2.7

Directors and Secretary At 31 December 2015 the Company had six Directors, all of whom were non-executive. All directors, with the
exception of Sarita Keen, held office throughout the reporting year. All Directors, with the exception of John
Le Prevost, Andrew Dodd and his alternate, Robert Heaselgrave, held office at the date of this report.
Andrew Dodd resigned as a director of the Company on 3 February 2016 and John Le Prevost resigned as a
director on 27 April 2016.
Richard Crowder, Chairman (aged 66) holds a range of non-executive directorships and consultancy
appointments. Having worked as an Investment Manager with Ivory & Sime in Edinburgh and as a Head of
Investment Research with W.I. Carr in the Far East, he undertook a wide range of responsibilities for
Schroders in London and the Far East, culminating in the role of Managing Director for Schroders’ Singapore
associate. Having then worked as Chairman of Smith New Court International Agency and Director of Smith
New Court Plc, Mr Crowder was the founding Managing Director of Schroders’ Channel Islands subsidiary
from 1991 until he became a non-executive Director in 2000. He was appointed as a director of the Company
in April 2006 and is resident in Guernsey.
Andrew Dodd (aged 44) is a partner, executive committee member and board member of BlueCrest. He is
also a director of AllBlue Limited, BlueCrest BlueTrend Limited and several of the funds underlying AllBlue
and a member of the AllBlue Committee which is responsible for portfolio allocations within AllBlue Limited.
He joined BlueCrest in 2006 after a 13 year career at Goldman Sachs where he specialised in advising
insurance, banking and asset management clients with respect to mergers and acquisitions, capital markets,
structured finance and asset/liability management. He holds a BA in Philosophy, Politics and Economics
from Oxford University. He was appointed as a director of the Company in May 2008 and is resident in
Jersey. Mr Dodd resigned as a director on 3 February 2016.
Paul Meader, Senior Independent Director (aged 50) is an independent director of a number of investment
management companies, insurers and investment funds. Until 2013, he was Head of Portfolio Management
for Canaccord Genuity based in Guernsey, having previously held the role of Chief Executive of Corazon
Capital Group which was acquired by Collins Stewart in 2010. Prior to joining Corazon he was Managing
Director of Rothschild’s Swiss private-banking subsidiary in Guernsey. Mr. Meader has 30 years’ experience
in financial markets with particular expertise in fixed income investments. He is a Chartered Fellow of the
Chartered Institute of Securities & Investments and is past Chairman of the Guernsey International Business
Association. He was appointed as a director of the Company in April 2006 and is resident in Guernsey.
John Le Prevost (aged 64) is the Chief Executive Officer of Anson Group Limited and Chairman of Anson
Registrars Limited (the Company’s Registrar). He has spent over forty years working in offshore fund, trust
and investment businesses during which time he has been a managing director of subsidiaries in Guernsey
for County NatWest Investment Management, The Royal Bank of Canada and for Republic National Bank of
Page 15 v. 2.7

New York. He is a Full Member of the Society of Trust and Estate Practitioners and in 1991-2 read for a law
degree via distance learning and in 2009-11 read for an MBA from Southampton University via the Guernsey
Training Agency. He is a non-executive director of a number of London listed investment companies and is a
trustee of the Guernsey Sailing Trust. He was appointed as a director of the Company in April 2006 and is
resident in Guernsey. Mr Le Prevost resigned as a director on 27 April 2016.
Steve Le Page, Chairman of Audit Committee (aged 59), retired from partnership with PwC in the Channel
Islands in September 2013 and joined the board in June 2014 to succeed Jonathan Hooley who resigned on
25 April 2014. His career at PwC spanned 33 years, during which time he was partner in charge of their
Assurance and Advisory businesses for ten years and Senior Partner for five years. In these executive
positions he led considerable change and growth in that firm and also helped fund boards deal with
regulatory and reporting issues. His experience spans initial listings, ongoing governance and reporting,
continuation and going concern and even winding up of Listed and unlisted entities. He is a Chartered
Accountant and a Chartered Tax Advisor and he has a number of non-executive roles. He is resident in
Guernsey.
Sarita Keen (aged 48) brings significant experience of fund administration of Guernsey companies. She
was employed by Kleinwort Benson (Channel Islands) Fund Services (formerly Close Fund Services
Limited), for over 25 years and prior to that she worked for Hambros in Guernsey. She is an Approved
Person with the Guernsey Financial Services Commission and a Member of the Institute of Directors. Sarita
holds a number of non-executive positions for various companies and, as part of this, chairs or is a member
of those companies audit, risk and nominations committees. Miss Keen was appointed as a director on 3
June 2015 and is resident in Guernsey.
COMPANY SECRETARY AND ADMINISTRATOR
JTC is a Guernsey incorporated company and provides administration and secretarial services to the
Company pursuant to an Administration and Secretarial Agreement. In such capacity, JTC is responsible for
the general secretarial functions required by the Law and ensures that the Company complies with its
continuing obligations as well as advising on the corporate governance requirements and recommendations
applicable to a company listed on the premium segment of the Official List and admitted to trading on the
Main Market of the London Stock Exchange.
The Administrator is also responsible for the Company’s general administrative functions such as the
calculation of the NAV of Shares and the maintenance of accounting and statutory records.
Page 16 v. 2.7
Report of the Directors The Directors present their Annual Report and Audited Financial Statements for the year ended 31
December 2015.
A description of important events which have occurred during the Financial Year, their impact on the
performance of the Company as shown in the Financial Statements (on page 51) and a description of the
principal risks and uncertainties facing the Company, together with an indication of important events that
have occurred since the end of the Financial Year and the Company’s likely future development is given in
this Report, the Chairman’s Statement and the notes to the Financial Statements and are incorporated here
by reference.
THE COMPANY
Information on the Company including its Investment Objective and Policies can be found on page 8
onward.
SHAREHOLDER COMMUNICATION
All holders of Shares in the Company have the right to receive notice of, and attend, all general meetings of
the Company, during which the Directors are available to discuss issues affecting the Company, and the
Directors also meet periodically with major shareholders. The Directors are always available to enter into
dialogue with shareholders and make themselves available for such purpose whenever required. The Senior
Independent Director can also be contacted by shareholders via the Company Secretary if they have any
concerns and shareholders who wish to receive timely information by email can do so by sending a request
to the Company Secretary at [email protected].
The Annual General Meeting also provides a forum for shareholders to raise any queries or concerns directly
with the Board in person. Jefferies Hoare Govett and Fidante Capital plc (previously named Dexion Capital
plc), the Company’s Corporate Brokers, meet regularly with the Company’s major shareholders and reports
are provided at least quarterly to the Board of Directors on those shareholders’ views about the Company
and any issues or concerns they have raised. Additionally, in July 2014, the Board appointed Capital Access
group (previously Broker Profile) to enhance the dialogue between the Board and shareholders. Capital
Access work with the Board, to provide information and meetings with existing and prospective investors in
the Company. The Board regularly reviews the Company’s share register at its formal meetings to monitor
the shareholder profile and the Board has implemented measures to ensure that information is presented to
its shareholders in a fair, balanced and understandable manner.
The Company announces the confirmed net asset value of its shares on a monthly basis. During the year
under review a commentary on the investment performance of AllBlue was provided in the Company’s
Page 17 v. 2.7

monthly factsheet. In future, the Company’s monthly factsheets will provide a commentary from Highbridge
on the performance of the Underlying Fund. The estimated net asset value of the Company’s shares is, and
will continue to be announced weekly via a Regulatory Information Service. The daily market closing prices
of Shares are available on Reuters, Bloomberg, in the Financial Times and the Daily Telegraph. A copy of
the Registration Document, Summary Note and Securities Note of the Company can be found on the
Company’s website, https://www.highbridgemsfltd.co.uk/.
All Shares may be dealt in directly through a stockbroker or professional adviser acting on an investor’s
behalf. The buying and selling of Shares may be settled through CREST.
The Company’s register of shareholders is maintained by Anson Registrars Limited in Guernsey and they
can be contacted on +44 (0)1481 711301.
NET ASSET VALUE (“NAV”)
The NAV for accounting purposes of the Company’s Shares, including all distributable reserves as at 31
December 2015 was GBP 2.0099 (Sterling Shares) and USD 1.9133 (US Dollar Shares).
The Company’s NAV is based on valuations of unquoted investments. In calculating the NAV and the NAV
per Share of the Company, the Administrator relies on the valuations of interests in AllBlue and AllBlue
Leveraged and the Underlying Fund supplied by the administrator of each fund. Further to the
announcement on 1 December that the Company was being redeemed from AllBlue and AllBlue Leveraged,
with proceeds due to be received in line with the sale of the assets of the funds underlying AllBlue, the Board
chose to apply a discount to the valuation of these assets to reflect the estimated time delay to receive
redemption proceeds. The remaining amount owed to former shareholders of the Company who elected to
participate in the cash exit offer are recognised in the valuation as creditors.
On 18 February 2016, BlueCrest informed the Company that it anticipated that the BlueCrest Multi Strategy
Credit Master Fund and the BlueCrest Capital International Master Fund would benefit from an award from a
settlement of a U.S. civil litigation matter regarding the pricing transparency of certain credit default swaps.
These monies are anticipated by BlueCrest to be received in early 2017 however at present the valuations
supplied to the Company by the administrator of AllBlue and AllBlue Leveraged do not take these anticipated
proceeds into account.
RESULTS AND DIVIDENDS
The results for the year are set out in the Statement of Comprehensive Income on page 52. In accordance
with the Investment Objective the Directors did not declare any dividends during the year under review and
the Directors do not recommend the payment of a dividend as at the date of this report.
Page 18 v. 2.7

DIRECTORS
The Directors, all of whom are non-executive, are shown on pages 22 and 23. No Director has a contract of
service with the Company, nor are any such contracts proposed.
The following table details the interests of the Directors in the Shares of the Company, both as at 31
December 2016 and as at 29 April 2016.
Director Number and Class of Shares (29 April 2016)
Number and Class of Shares (31 December 2015)
Mr Richard Crowder 100,000 Sterling Shares 120,000 Sterling Shares
Mr John Le Prevost N/A 96,784 Sterling Shares
Mr Paul Meader 22,000 Sterling Shares 29,163 Sterling Shares
Mr Andrew Dodd N/A 329,165 Sterling Shares
INVESTMENT MANAGER
On 29 February 2016, Highbridge Capital Management LLC was appointed as Investment Manager to the
Company. Highbridge do not receive any fees (other than disbursable expenses) from their role as
Investment Manager to the Company, instead deriving their fees from the services provided to the
Underlying Fund.
The principal responsibilities of the Investment Manager under the Investment Management agreement are:
• To provide portfolio and risk management of the investments of the Company within the parameters
of the Company’s investment policy; and
• To effect or arrange and provide advice to the Company in relation to investments;
There is no compensation payable on termination of the Investment Management Agreement, which is
terminable on six months’ notice by either the Company of by the Investment Manager.
RELATED PARTY TRANSACTIONS
Anson Registrars Limited is the Registrar, Transfer Agent and Paying Agent of the Company. Mr Le Prevost
is a director and controller of Anson Registrars Limited and a former director and controller of Anson Fund
Managers Limited.
Andrew Dodd is a principal, executive committee member and board member of BlueCrest. He is also a
director of AllBlue Limited and several of the funds underlying AllBlue and a member of the AllBlue
Committee which is responsible for portfolio allocations within AllBlue Limited. Mr Dodd resigned as a
director of the Company on 3 February 2016.
Richard Crowder acts as a consultant to Thomas & Dessain International Search and Selection, who have
Page 19 v. 2.7

been engaged by the Company to assist in the appointment process of new directors to the Board. As a
result of Richard’s association with that company, the appointment process is being overseen by the Senior
Independent Director, Paul Meader.
Other than the above-mentioned interests, none of the Directors, nor any persons connected with them, had
a material interest in any of the Company’s transactions.
There were no material related party transactions which took place in the Financial Year, other than those
disclosed in the report of the Directors and at note 6 to the financial statements.
SUBSTANTIAL SHAREHOLDINGS
The Directors have been notified of the following substantial interests in the Company’s relevant share
capital as at 31 March 20169.
Name Date of Notification to Company
Number of Voting Rights
% of Voting Rights (as at 31 March 2016)
Rathbone Brothers Plc 18/03/2016 37,004,610 28.11%
Sarasin & Partners LLP 07/01/2015 21,004,556 15.96%
Legal & General Investment Management Limited (LGIM) 03/03/2016 9,942,090 7.55%
Smith and Williamson Holdings Limited 03/03/2016 9,133,838 6.94%
Legal & General Group PLC (L&G) 03/03/2016 8,579,411 6.52%
Investec Wealth & Investment Limited 03/03/2016 8,098,324 6.15%
9 Based on the register of TR1 announcements communicated by Shareholders to the Company and adjusted for participation in the cash exit and may differ from such Shareholders' current shareholding.
Page 20 v. 2.7

As at 31 December 2015, the Directors had been notified of the following substantial interests in the
Company’s relevant share capital10.
Name Date of Notification to Company
Number of Voting Rights
% of Voting Rights (as at 31 December 2015)
Rathbone Brothers Plc 03/12/2015 60,533,062 14.99%
Blackrock Inc 26/11/2015 41,747,450 10.34%
Schroder & Co. Limited 30/11/2015 41,512,860 10.28%
HSBC Holdings 05/06/2013 33,492,683 8.30%
Cazenove Capital Management Limited 12/10/2012 29,108,951 7.21%
BlueCrest Guernsey Purpose Trust and BlueInvestments GP Limited
10/06/2015 21,678,104 5.68%
Sarasin & Partners LLP 07/01/2015 21,004,556 5.20%
CORPORATE GOVERNANCE
Statement of Compliance with the AIC Code of Corporate Governance In accordance with Listing Rule 9.8.7 the Company is required to comply with the requirements of the UK
Corporate Governance Code. A copy of the UK Corporate Governance Code is available for download from
the Financial Reporting Council’s web-site (www.frc.org.uk).
The Board of the Company has considered the principles and recommendations of the AIC Code by
reference to the AIC Corporate Governance Guide for Investment Companies (the “AIC Guide”). The AIC
Code, as explained by the AIC Guide addresses all the principles set out in the UK Corporate Governance
Code, as well as setting out additional principles and recommendations on issues that are of specific
relevance to an investment company.
The Board considers that reporting against the principles and recommendations of the AIC Code, and
reference to the AIC Guide (which incorporates the UK Corporate Governance Code), will provide better
information to shareholders.
The Company is also required to comply with the GFSC Code. As the Company reports under the AIC Code
it is deemed to meet the requirements of the GFSC Code. The Board has undertaken to evaluate its
corporate governance compliance on an on-going basis.
The UK Corporate Governance Code includes provisions relating to:
• the role of the chief executive;
10 Based on the register of TR1 announcements communicated by Shareholders to the Company and may differ from such Shareholders' current shareholding.
Page 21 v. 2.7
• executive directors’ remuneration;
• the need for an internal audit function.
For the reasons set out in the AIC Guide, and as explained in the UK Corporate Governance Code, the
Board considers these provisions not relevant to the position of the Company, being a self-managed
investment company prior to the appointment of Highbridge as investment manager to the Company. The
Company has therefore not reported further in respect of these provisions. The Company has complied with
all Principles of the AIC Code and conforms with all detailed recommendations subject to the following
explanations.
THE BOARD
The Board comprises four non-executive Directors, all of whom are considered to be independent (with the
Chairman being independent on appointment) for the purposes of Principle Two of the AIC Code and Listing
Rule 15.2.12A. As part of their examination of the independence of the Board, the Board have considered
the following matters, amongst others:
• Mr Meader holds a cross directorship with Mr Le Page but the company is not advised by or in any
other way related to Highbridge or JPMorgan; Mr Meader sits on the Board of JPMorgan Global
Convertibles Income Fund Limited;
• Miss Keen sits on the Boards of a number of private Pantheon entities with Mr Crowder; and
• Mr Meader and Mr Crowder have served on the Board since April 2006.
The Board have concluded that Mr Meader, Miss Keen, Mr Crowder and Mr Le Page remain independent
under principle two of the AIC Code. Mr Le Prevost was considered independent throughout the year under
review and until his resignation on 27 April 2016.
Biographies of the Directors appear on pages 15 and 16, demonstrating the wide range of skills and
experience they bring to the Board and highlights of their specific key skills and experience are included on
page 24. In accordance with Principle Five of the AIC Code, below is a list of all other public company
directorships and employments held by each Director and shared directorships of any commercial company
held by two or more Directors at the date of this report:-
RICHARD CROWDER
Baring Vostok Investments PCC Limited
Better Capital PCC Limited
FF&P Global Property Fund PCC Limited
Page 22 v. 2.7

FF&P Enhanced Opportunities Fund PCC Limited
FF&P Venture Funds PCC Limited
Heritage Diversified Investments PCC Limited
Japan Residential Investment Company Limited
PAUL MEADER
Guaranteed Investment Products 1 PCC Limited ICG-Longbow Senior Secured UK Property Debt
Investments Ltd
JPMorgan Global Convertibles Income Fund Limited
Spitfire Funds (Bermuda) Limited
Spitfire British Property Recovery Fund
Spitfire International Property Recovery Fund
Volta Finance Limited – non-executive directorship with Steve Le Page
Schroder Oriental Income Fund Limited
STEVE LE PAGE
Apax Global Alpha Limited
MedicX Fund Limited
Volta Finance Limited – non-executive directorship with Paul Meader
BOARD MEETINGS
The Board meets at least four times a year to consider the business and affairs of the Company for the
previous quarter. Between these meetings the Board keeps in contact by email and telephone as well as
meeting to consider specific matters of a transactional nature. Directors have direct access to the Secretary
and the Secretary is responsible for ensuring that Board procedures are followed and that there are good
information flows both within the Board and between Committees and the Board. Additionally the Board
holds an annual strategy meeting with its relevant advisors in attendance as appropriate. The Directors are
kept fully informed of investment and financial controls and other matters that are relevant to the business of
the Company and should be brought to the attention of the Directors. The Directors also have access, where
necessary in the furtherance of their duties, to professional advice at the expense of the Company.
Page 23 v. 2.7

During the year under review the Board met fifteen times. Of those meetings, three were quarterly Board
meetings and the remainder were ad hoc meetings held at short notice to deal with specific matters including
the Company’s buy-back programme, developments relating to the underlying investments and the selection
of an investment manager. Required director attendance (which includes attendance by alternates) is
summarised below:-
Director Quarterly Board Meetings
Ad-Hoc Board Meetings
Audit Committee Meetings
Management and Remuneration Committee Meetings
Nomination Committee Meetings
Risk Committee Meetings
Richard Crowder 3 of 3 11 of 12 N/A 1 of 1 9 of 9 4 of 5 Andrew Dodd 1 of 3 2 of 12 1 of 5 0 of 1 3 of 9 0 of 5 Paul Meader 3 of 3 11 of 12 5 of 5 1 of 1 9 of 9 5 of 5 John Le Prevost 3 of 3 8 of 12 3 of 5 1 of 1 8 of 9 5 of 5 Steve Le Page 2 of 3 9 of 12 5 of 5 1 of 1 8 of 9 N/A
Sarita Keen* 1 of 1 4 of 6 2 of 2 1 of 1 2 of 3 0 of 1 * Sarita Keen was appointed a director on 3 June 2015. Accordingly, her attendance at meetings is shown
against the meetings held during her appointment during the year.
Letters of appointment for non-executive Directors do not set out a fixed time commitment for Board duties
as the Board considers that the time required by Directors may fluctuate depending on the demands of the
Company and other events. Therefore it is required that each Director will allocate sufficient time to the
Company to perform their duties effectively and it is also expected that each Director will attend all quarterly
Board meetings and meetings of committees of which they are a member. The Chairman has confirmed that
he considers the performance of each director to be effective and that each director demonstrates continued
commitment to their role.
KEY SKILLS AND EXPERIENCE
A review of the skills and experience of the existing Board members is outlined below. All Board members in
the below table held office throughout the Financial Year, except for Sarita Keen, who was appointed on 3
June 2015.
Director Key Skills and Experience
Richard Crowder Chairman
Wide knowledge of investment management as well
as broad experience of non-executive directorship,
chairmanship and executive directorship in quoted
and unquoted companies.
Paul Meader Senior Independent Director
An experienced portfolio manager with in-depth
Page 24 v. 2.7

knowledge of private wealth management and
institutional asset management. Long term
experience of asset allocation, fixed income and
hedge funds. Significant financial services, fund
management, regulatory and non-executive director
experience.
Steve Le Page Chairman of the Audit Committee
Wide-ranging knowledge of audit, financial
reporting, corporate governance and internal
controls in the context of listed investment
companies.
Sarita Keen Extensive experience of Guernsey investment
company administration and regulation.
The Board approves the nomination for re-election of all directors on an annual basis. The above table
summarises the rationale for re-election of directors. All Directors seeking to continue on the Board after the
AGM will put themselves forward for re-election at each Annual General Meeting. On 30 July 2015, the most
recent AGM, shareholders re-elected Richard Crowder, Andrew Dodd, John Le Prevost, Steve Le Page and
Paul Meader. Due to the timing of the appointment there was no opportunity to elect Sarita Keen at the July
2015 General Meeting. Miss Keen will put herself forward for election at the 2016 Annual General Meeting.
The Board believes that changes to its composition, including succession planning for the Chairman or other
directors, can be managed without undue disruption to the Company’s operations. Directors are able and
encouraged to provide statements to the Board of their concerns and ensure that any items of concern are
recorded in the Board minutes and the Chairman encourages all Directors to present their views on matters
in an open forum. The Board is also scheduled to consider the tenure of Directors once any Director has
been appointed to the Board for a continuous period of nine years. This occurred in 2015 for Messrs
Crowder, Meader and Le Prevost. Whilst the Board is of the view that directors can continue in certain
circumstances beyond a tenure of nine years, thereafter such Directors will be subject to increasing scrutiny
as to their effectiveness and independence.
In order to achieve orderly succession and to retain ‘corporate memory’, it was the intention of the Board that
one of each of the above three directors should step aside in each calendar year starting with Mr Le Prevost.
As part of this succession plan, Sarita Keen was appointed to the Board in June 2015. As a result of the
changes to the underlying investment, the resignation of Mr Le Prevost and the search for a new chairman
were deferred until after the appointment of a new investment manager of the Company on 29 February
2016. Subsequent to the appointment of the new investment manager, Mr Le Prevost resigned on 27 April
Page 25 v. 2.7
2016. Under the supervision of the Nomination Committee, the Company continues to work with Thomas &
Dessain International Search and Selection to manage a structured and thorough search process.
AUDIT COMMITTEE
In accordance with the AIC Code, an Audit Committee has been established and its membership and Terms
of Reference are available on the Company’s website. In the opinion of the Board, the constitution, terms of
reference and activities of the Audit Committee fulfil all the requirements of the AIC Code, save that the
Company does not maintain an internal audit function.
The report of the chairman of the Risk Committee can be found on page 37. The Board continue to seek to
ensure that all areas of risk and control were addressed by either that committee or the Audit Committee.
Consequently the terms of reference of each committee make the division of responsibilities between them
clear. The Audit Committee is responsible for monitoring the effectiveness of the controls and systems in
place to address, inter alia, the risks of loss or misappropriation of assets, mis-statement of liabilities or
failure of financial reporting systems or processes, including valuation reporting and processes.
The Audit Committee also examines the auditor’s, Ernst & Young LLP (or “EY”), remuneration and
engagement, as well as their independence and any non-audit services provided by them. The Audit
Committee monitors the performance of the auditor and may, if deemed appropriate, consider arranging for
the external audit contract to be tendered in 2016 (being ten years from the initial appointment) with the aim
of ensuring a high quality and effective audit.
Each year the Board examines the Audit Committee’s performance and effectiveness, and ensures that its
tasks and processes remain appropriate. Key areas covered included the clarity of the Audit Committee’s
role and responsibilities, the balance of skills among its members and the effectiveness of reporting of its
work to the Board. The Board is satisfied that all members of the Audit Committee have relevant financial
experience and knowledge and ensure that such knowledge remains up to date. Overall the Board
considered the Audit Committee had the right composition in terms of expertise and has effectively
undertaken its activities and reported them to the Board during the year.
MANAGEMENT AND REMUNERATION COMMITTEE
In accordance with the AIC Code, a Management and Remuneration Committee has been established and
its membership and Terms of Reference are available on the Company’s website. The function of the
Management and Remuneration Committee is:
(a) to ensure that the Company’s contracts of engagement with the Administrator, the Investment
Manager and other service providers are operating satisfactorily so as to ensure the safe and accurate
management and administration of the Company’s affairs and business and are competitive and reasonable
for the shareholders and to make appropriate recommendations to the Board;
Page 26 v. 2.7
(b) to monitor and assess the appropriate levels of remuneration for all Directors; and
(c) to ensure that the Company complies to the best of its ability with applicable laws and regulations
and adheres to the tenet of generally accepted codes of conduct.
During the year under review the Management and Remuneration Committee met once.
The chairmanship of the Audit and the Management and Remuneration committees is reviewed annually by
the Chairman. In addition, each Director’s performance is assessed annually by the Chairman and the
performance of the Chairman is assessed by the Senior Independent Director together with the remaining
Directors.
The remuneration of the Directors is reviewed on an annual basis and compared with the level of
remuneration for directorships of other similar investment companies. All Directors receive an annual fee
(apart from Mr Dodd who waived all fees in connection with his appointment to the Company) and there are
no share options or other performance related benefits available to them.
The Board is committed to an evaluation of its performance being carried out every year. In accordance with
Principle Seven of the AIC Code the Board has undertaken its second, externally facilitated evaluation by
Optimus Group Limited in 2014, Optimus having previously appraised the Board in 2011. The 2014 external
evaluation confirmed that the Company observes high standards of corporate governance and the Board
confirms that there are no outstanding recommendations from this evaluation.
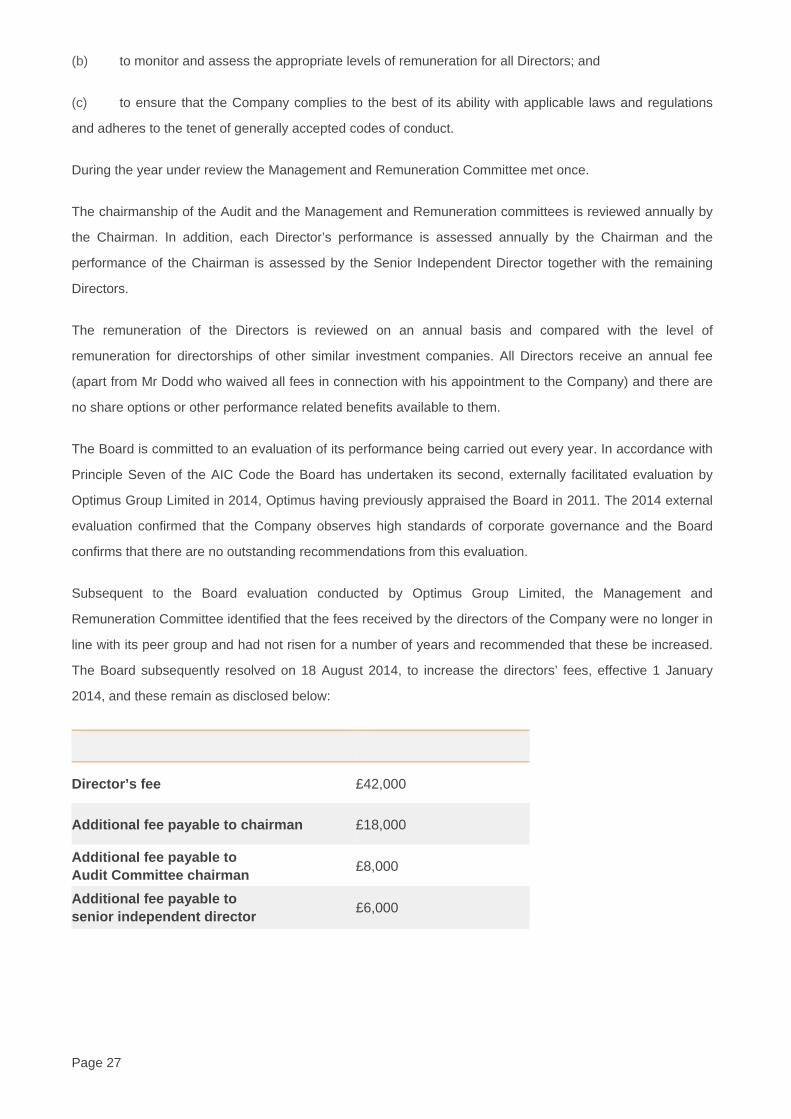
Subsequent to the Board evaluation conducted by Optimus Group Limited, the Management and
Remuneration Committee identified that the fees received by the directors of the Company were no longer in
line with its peer group and had not risen for a number of years and recommended that these be increased.
The Board subsequently resolved on 18 August 2014, to increase the directors’ fees, effective 1 January
2014, and these remain as disclosed below:
Director’s fee
£42,000
Additional fee payable to chairman
£18,000
Additional fee payable to Audit Committee chairman
£8,000
Additional fee payable to senior independent director
£6,000
Page 27 v. 2.7

NOMINATION COMMITTEE
In accordance with the AIC Code, a Nomination Committee has been established and its membership and
Terms of Reference are available on the Company’s website. Mr Crowder has been appointed as Chairman
of this Committee, except when the Committee considers any matter in connection with the Chairmanship in
which case the Committee will elect another Chairman. Given that the Board consists solely of non-executive
directors, each of whom are members of the Committee, the Board does not consider the Chairman being a
member of the Committee to be inappropriate.
The function of the Nomination Committee is to ensure that the Company goes through a formal process of
reviewing the balance, independence and effectiveness of the Board, identifying the experience and skills
which may be needed and those individuals who might best provide them and to ensure that the individual
has sufficient available time to undertake the tasks required. When considering the composition of the Board,
Directors will be mindful of diversity, inclusiveness and meritocracy. The outside directorships and broader
commitments of Directors are also monitored by the Nomination Committee.
The Board had undertaken the aforementioned formal review of the balance, independence and
effectiveness of the Board therefore the Nomination Committee did not meet to consider this. The Board
concluded it did not have any objection to the current commitments of its members, including the shared
directorships listed above and that no changes to the composition of the Board were required.
The Company supports the AIC Code provision that Boards should consider the benefits of diversity,
including gender, when making appointments and is committed to ensuring it receives information from the
widest range of perspectives and backgrounds. The Company’s aim as regards the composition of the Board
is that it should have a balance of experience, skills and knowledge to enable each Director and the Board
as a whole to discharge their duties effectively. Whilst the Company agrees that it is entirely appropriate that
it should seek to have diversity on its Board, it does not consider that this can be best achieved by
establishing specific quotas and targets and appointments will continue to be made based wholly on merit.
Accordingly should changes to the Board be required, the Nomination Committee would have regard to the
Board’s Diversity Policy that when recruiting Directors, a comparative analysis of candidates’ qualifications
and experience, applying pre-established clear, neutrally formulated and unambiguous criteria will be utilised
to determine the most suitable candidate for the specific position sought.
The Company has engaged Thomas & Dessain International Search and Selection to manage the orderly
succession of each director who has served longer than nine years under the oversight of the Nomination
Committee, in line with objective criteria set by the committee, mindful of the diversity policy of the Company.
RISK COMMITTEE
A Risk Committee was established in 2014 and its membership and Terms of Reference are available on the
Company’s website.
Page 28 v. 2.7
The Committee’s primary focus is around investment risk in its broadest sense, including elements such as
counterparty risk and credit risk.
The Committee’s work has focused on two levels:
1) the direct exposures of the Company itself, for instance to AllBlue, AllBlue Leveraged and cash
counterparts; and
2) the exposures embedded within AllBlue, its investment characteristics and the risks associated with
owning AllBlue
The Committee meets regularly and has, over the course of the year under review has, spent time
considering the scope and mandate of its operations, reviewing key documentation, regularly reviewing key
reporting and interacting with BlueCrest and JTC to examine and understand the risks that the Company is
exposed to at both levels. Following the investment into the Underlying Fund, this work will continue in
relation to that entity and to Highbridge.
Further information relating to the work of the Risk Committee is explained in the Risk Committee report on
page 37.
BRIBERY
The Directors have undertaken to operate the business in an honest and ethical manner and accordingly
take a zero-tolerance approach to bribery and corruption. The key components of this approach are
implemented as follows:
• The Board is committed to acting professionally, fairly and with integrity in all its business dealings and
relationships;
• The Company will implement and enforce effective procedures to counter bribery; and
• The Company requires all its service providers and advisors to adopt equivalent or similar principles.
INTERNAL CONTROLS & RISK MANAGEMENT REVIEW
The Board is responsible for the Company’s system of internal control and for reviewing its effectiveness.
The Board confirms that there is an on-going process for identifying, evaluating and monitoring the significant
risks faced by the Company.
The Audit Committee, on behalf of the Board, carries out an annual review of the internal financial controls of
the Company. In addition, ISAE 3402 (or equivalent) reports have been obtained from the relevant service
providers where available to verify these reviews. The Management and Remuneration Committee also
conducts regular reviews of the Company’s service providers. The internal controls are designed to meet the
Page 29 v. 2.7

Company’s particular needs and the foreseeable risks to which it is exposed. Accordingly, the internal control
systems are designed to manage rather than eliminate the risk of failure to achieve business objectives and
by their nature can only provide reasonable and not absolute assurance against misstatement and loss.
The Company has put in place arrangements with AllBlue, BlueCrest (as appropriate) and Highbridge for the
Company to receive monthly NAVs in relation to AllBlue and AllBlue Leveraged and the Underlying Fund and
estimated weekly NAVs in relation to the Underlying Fund electronically as soon as they are released,
together with certain factsheets produced on each fund and other administrative information and reports.
The purpose of these arrangements is to ensure that the Directors have sufficient timely information to
enable them to monitor the Company’s investments.
The Risk Committee of the Company meets regularly to review risk reporting information and consider the
Company’s risk management systems, including consideration of a risk matrix which covers various areas of
risk including corporate strategy, accuracy of published information, compliance with laws and regulations,
relationships with service providers and investment and business activities. The Board considers that the
Company has adequate and effective systems in place to identify, mitigate and manage the primary risks to
which the Company is exposed.
Highbridge Capital Management is the investment manager of HCC and acts as investment manager of the
Company, for which it is paid a fee from HCC. BlueCrest is the investment manager of AllBlue and AllBlue
Leveraged. Administration and Secretarial duties for the Company are performed by JTC. The Board
considers that the systems and procedures employed by the Administrator and other service providers
provide sufficient assurance that a sound system of internal controls is in place.
The Directors of the Company clearly define the duties and responsibilities of their agents and advisors. The
appointment of agents and advisors is conducted by the Board after consideration of the quality of the parties
involved and the Management and Remuneration Committee monitors their on-going performance and
contractual arrangements. The Board has also specified which matters are reserved for a decision by the
Board and which matters may be delegated to its agents and advisers.
Specific matters reserved exclusively for the decision of the Board include the variation of terms on which an
overdraft facility is used to finance operating costs and the invocation of any premium or discount control
mechanisms.
PRINCIPAL RISKS AND UNCERTAINTIES
The principal risks associated with the Company are:
• Operational risk. The Board is ultimately responsible for all operational facets of performance including
cash management, asset management, regulatory and listing obligations. The Company has no
employees and so enters into a series of contracts/legal agreements with a series of service providers
Page 30 v. 2.7

to ensure both operational performance and the regulatory obligations are met. The Company uses well
established, reputable and experienced service providers and their continued appointment is assessed
at least annually.
• Investment risk. The Board is responsible for the investment policy but, due to the nature of the
Company, the Board has little discretion in such management. The success of the Company depends
on the diligence and skill of the investment manager of the Company’s primary investment, the
Underlying Fund. There is a risk that any underperformance of funds in which the Company’s capital is
invested would lead to a reduction of the net asset value or of the share price rating. The Board formally
monitors the investment performance each quarter, and intends to meet with the investment manager
on a regular basis and attend regular investment update calls to further supplement the Board’s
knowledge and understanding of the investment process and strategy.
• Share price discount risk. The share price is continually monitored and, if appropriate, the Board have
the discretion to make a quarterly tender offer to shareholders. Furthermore, the Board also consider
whether any additional control measures need to be implemented, including the commencement of a
buyback programme. The articles of the Company (adopted on 24 February 2016) also include a
provision that a continuation vote will be held in 2021.
• Concentration risk: The Company’s principal exposure is to the Underlying Fund, with additional
exposure to AllBlue and AllBlue Leveraged through its creditor interests in these funds and, therefore,
the Company is exposed to concentration risk through this fund. The Board considers that the Company
is highly diversified in its exposures, both to the funds underlying AllBlue, the Underlying Fund, and to
the range of individual positions and exposures of the Underlying Fund. The Board believes that this
mitigates the concentration risk. The Board actively monitors the exposures to the Underlying Fund,
AllBlue, and AllBlue Leveraged.
• Leverage risk: The Company does not undertake structural borrowings but will not maintain exactly 1:1
economic exposure to the Underlying Fund at all times because of factors including, but not limited to,
exposure to AllBlue and AllBlue Leveraged pending the distribution of all proceeds from the compulsory
redemption of all outside investors effective 4 January 2016, share issuance and buybacks and general
expenses. Neither HCC nor AllBlue undertake direct structural leverage. AllBlue Leveraged sought to
maintain a position which is approximately 2x leveraged to AllBlue. This leverage may not have been
constant because of changes to the leverage facility made available to AllBlue Leveraged. The Board
monitored the performance of the Company against the performance of AllBlue and will continue to do
so against the performance of the Underlying Fund. Leverage exists in the investments of the
Underlying Fund and AllBlue including through formal borrowing facilities, loans by the fund’s prime
brokers for the purchase or sale of securities or embedded in derivative positions. Some of the
investments will be exposed to significant gross leverage.
Page 31 v. 2.7
• Counterparty risk: The Company is exposed to counterparty risk directly and indirectly via the
Underlying Fund, AllBlue, AllBlue Leveraged and their investments. The Company seeks to ensure that
it does not have undue direct counterparty exposures in line with market practices. AllBlue Leveraged
had counterparty exposure to the leverage provider.
• Credit risk: The Company is exposed to credit risk directly through cash and cash equivalents and
applies controls accordingly. The Company is also exposed to credit risk more broadly through the
Underlying Fund, AllBlue, AllBlue Leveraged and the underlying investments. The Board believes that
credit risk is well diversified through the exposures taken by Highbridge as investment manager of HCC
and given the reduced size of the Company’s interest in AllBlue.
• Regulatory risk. The Company is required to comply with the listing rules and the disclosure and
transparency rules of the UK Listing Authority and the requirements imposed by the Guernsey Financial
Services Commission. Any failure to comply could lead to criminal or civil proceedings. Although
responsibility ultimately lies with the Board, the Secretary and Corporate Brokers also monitor
compliance with regulatory requirements.
AUDITOR
EY have been the Company’s auditor since its incorporation and the lead audit partner is currently Chris
Matthews. EY have expressed their willingness to continue in office as Auditor. A resolution proposing their
reappointment will be submitted at the Company’s forthcoming General Meeting.
Further to a review conducted by the Board of the continued need for German taxation information, in light of
the closure of the Euro class, this information is no longer being provided (from 13 March 2015). This
engagement did not require any consultation or advice to be provided by the Auditor.
The Company engaged EY in March 2016 to verify the conversion ratio for the compulsory conversion
between US Dollar Shares and Sterling Shares and paid a fee of £7,500 in respect of this. No other non-
audit services were provided by the Auditor during the year or to the date of this report.
VIABILITY STATEMENT
As stated on page 8, the investment objective of the Company is currently to seek to provide consistent
returns with low volatility through an investment policy of investing substantially all of its assets in the
Underlying Fund or any successor vehicle of the Underlying Fund. Prior to the Extraordinary General
Meeting (“EGM”) held on 24 February 2016, it was to seek to provide consistent long-term capital growth
through an investment policy of investing substantially all of its assets in AllBlue of any successor vehicle of
AllBlue. However, in considering the Company’s viability, the Directors have only given consideration to the
current objective.
The Company’s investment performance largely depends upon the performance of its underlying investment
Page 32 v. 2.7
into the Sterling Class of Highbridge Capital Corporation, (“HCC”) which is also managed by Highbridge
Capital Management, LLC (“Highbridge”), the Company’s investment manager since 29 February 2016. The
Directors, in assessing the viability of the Company have paid particular attention to the risks faced by the
Company in seeking to achieve its stated objective, which are set out on page 30. The Board has
established a risk management framework which is intended to identify, measure, monitor, report and where
appropriate, mitigate the risks to the Company’s investment objective. The Board does not consider any
other risks faced by the Company to be principal risks, as defined in the Corporate Governance Code.
The Directors confirm that their assessment of the principal risks facing the Company was robust and in
doing so they have considered models projecting future cash flows during the three years to 31 December
2018. This model assumes that the Company will be able to meet any requirements for cash either from
redemption proceeds from its investment into HCC or from further cash receipts from its creditor interests in
AllBlue and AllBlue Leveraged. The Board considers these assumptions to be reasonable, having regard to
the information received by the Company to date. The model also assumes that future performance will
reflect the actual performance of HCC during the last few years. These models have then been flexed to
reflect the impact of some plausible but severe scenarios similar to those experienced by investment markets
in the past. The viability assessment covers a period of three years because the Directors are of the opinion
that given the Company’s recent change of investment policy and investment manager it would be imprudent
for them to attempt to assess any longer period. The Directors consider this period to be sufficient given the
inherent uncertainty of the investment world.
At the time of writing, the Company’s assets exceed its liabilities by a considerable margin, since the
resolutions passed at the EGM on 24 February 2016 and the subsequent compulsory conversion of the
remaining US Dollar Shares had the effect, inter alia, of causing the Company’s issued shares to be treated
as equity, not current liabilities under IFRS. Further, the main requirement for cash is to meet the quarterly
tender facility and since this is entirely at the Directors’ discretion it could therefore be curtailed or
discontinued if necessary to manage cash needs. In making their viability assessment, the Directors have
included a quarterly tender of a reasonable level in their cash flow projections, albeit that as noted above any
resulting cash outflow is assumed to be matched by an inflow from HCC or the creditor interests. The actual
level of tender how it is to be funded will be determined upon on the basis of the performance of the
investment, anticipated investor demand and the level of the discount, if any, of the Company’s share price
to its Net Asset Value, and therefore cannot be estimated with accuracy in advance.
The continuation of the Company in its present form is dependent on the Investment Management
Agreement with Highbridge remaining in place. The Directors note that the Investment Management
Agreement with the Investment Manager is terminable on six months’ written notice by either party. The
Directors have no current reason to assume that either the Company or the Investment Manager would
serve notice of termination of the Investment Management Agreement during the three year period covered
by this viability statement. The Articles require that the Directors put a Continuation Resolution to the Annual
Page 33 v. 2.7

General Meeting of the Company to be held in 2021, but this is after the period of this assessment.
The Directors, having duly considered the risks facing the Company, their mitigation and the cash flow
modelling, have a reasonable expectation that the Company will be able to continue in operation and meet
its liabilities as they fall due over the three year period of their assessment.
GOING CONCERN
The Company now invests the majority of its assets into the Underlying Fund, and, as indicated in the
circular to Shareholders dated 8 February 2016, that fund has returned 10.67% annualised since inception.
Whilst this historic performance is no indication for the future, the Directors therefore have a reasonable
expectation that positive returns will be made in the future. In addition, at the date of publication of this
report, the Company holds a significant amount of cash pending investment into the Underlying fund. This
cash holding considerably exceeds normal operating expenditure anticipated during the next twelve months.
Finally, the Directors have reasonable grounds for believing that the quarterly tender offers, if any, during the
next twelve months will be funded by further receipts from its creditor interests or by redemptions from the
Underlying Fund.
The Company’s financial risk management objectives and policies, details of its financial instruments and its
exposures to market price risk, credit risk, liquidity risk and interest rate risk are set out at note 13 to the
Financial Statements. After making enquiries, and after updating the financial information set out in the
Annual Report to reflect the change of investment objective and the subsequent investment into the
Underlying Fund, the Directors have a reasonable expectation that the Company has adequate resources to
continue in operational existence for the next 12 months. Accordingly, they continue to adopt the going
concern basis in the preparation of this annual financial report.
The Financial Statements are prepared on the going concern basis in light of the Board’s assessment of:
• shareholders’ appetite to continue their investments in the Company; and
• the expectation of the Directors that the Company will continue for the 12 months from the date of
approval of the Financial Statements.
DISCLOSURE OF INFORMATION TO AUDITORS
The Directors who held office at the date of approval of this Directors’ Report confirm that, so far as they are
each aware, there is no relevant audit information of which the Company’s Auditors are unaware; and each
Director has taken all the steps that he ought to have taken as a Director to make himself aware of any
relevant audit information and to establish that the Company’s Auditors are aware of that information.
Page 34 v. 2.7

Page 35 v. 2.7
STATEMENT OF DIRECTORS’ RESPONSIBILITIES
The Directors are required to prepare financial statements for each Financial Year which give a true and fair
view of the state of affairs of the Company as at the end of the Financial Year and of the profit or loss for that
year. In preparing those financial statements, the Directors are required to:
• Ensure that the Annual Report and Audited Financial Statements, taken as a whole, are fair, balanced
and understandable and provide the information necessary for a shareholder to assess the Company’s
performance, business model and strategy;
• Select suitable accounting policies and apply them consistently;
• Make judgements and estimates that are reasonable and prudent;
• State whether applicable accounting standards have been followed subject to any material
departures discussed and explained in the Annual Report and Accounts; and
• Prepare the financial statements on the going concern basis unless it is inappropriate to presume that
the Company will continue in business.
The Directors are responsible for keeping proper accounting records which disclose with reasonable
accuracy at any time the financial position of the Company and to enable them to ensure that the financial
statements have been properly prepared in accordance with the Law. They are also responsible for
safeguarding the assets of the Company and hence for taking reasonable steps for the prevention and
detection of fraud and other irregularities.
The Directors are responsible for ensuring that the Annual Report and Audited Financial Statements include
the information required by the Listing Rules and the Disclosure and Transparency Rules of the UK Listing
Authority (together “the Rules”). They are also responsible for ensuring that the Company complies with the
provisions of the Rules which, with regard to corporate governance, require the Company to disclose how it
has applied the principles, and complied with the provisions, of the corporate governance code applicable to
the Company.
RESPONSIBILITY STATEMENT
The Board of Directors, as identified at pages 15 and 16, jointly and severally confirm that, to the best of their
knowledge:
This report includes a fair review of the development and performance of the business and the position of the
Company together with a description of the principal risks and uncertainties that the Company faces;
The Financial Statements, prepared in accordance with International Financial Reporting Standards as
adopted by the EU, give a true and fair view of the assets, liabilities, financial position and profits of the
Company;

Page 36 v. 2.7
The Annual Report and Audited Financial Statements taken as a whole is fair, balanced and understandable
and provides the information necessary for Shareholders to assess the Company’s performance, business
model and strategy; and
The Annual Report and Audited Financial Statements includes information required by the UK Listing
Authority for ensuring that the Company complies with the provisions of the Listing Rules and the Disclosure
Rules and Transparency Rules of the UK Listing Authority, with regard to corporate governance, require the
Company to disclose how it has applied the principles, and complied with the provisions, of the corporate
governance code applicable to the Company.
By order of the Board
Steve Le Page, Director 29 April 2016

Risk Committee Report MEMBERSHIP
The Risk Committee was established in April 2014 and comprises Paul Meader (Chairman), Richard
Crowder and Sarita Keen. Andrew Dodd and John Le Prevost served as Committee members during the
period and until their resignation as Directors. Steve Le Page, as the remaining director and Chairman of the
Audit Committee, has right of attendance and attended all the Committee meetings during the period.
THE COMMITTEE’S ACTIVITIES DURING 2015
The Committee’s activities relate to investment risk. Other risks, such as operational risk or regulatory risk,
are overseen by the Audit Committee. The Risk Committee focused on:
• the direct exposures of the Company itself, for instance to AllBlue, AllBlue Leveraged and cash
counterparts; and
• the exposures embedded within AllBlue, its investment characteristics and the risks associated with
owning AllBlue.
During 2015, the Committee utilised data from BlueCrest, JTC, GlobeOp (the administrator of AllBlue,
AllBlue Leveraged and the majority of the funds underlying AllBlue) and the Company’s Corporate Brokers to
review and monitor investment risk exposures and also engaged and challenged BlueCrest regarding AllBlue
and AllBlue Leveraged. The work of the Committee revolved primarily around:
• Market risk;
• Credit risk;
• Counterparty risk;
• Interest rate risk;
• Liquidity risk; and
• Leverage risk.
Utilising the Company’s risk matrix, the Committee sought to identify the principal pre-control investment
risks to which the Company was exposed and then monitored the controls that were used to mitigate these
risks. It also focused on the material post-control investment risks. Work was also undertaken during the
year, in conjunction with the Audit Committee and Board, to identify and, where possible, quantify the
Company’s risk appetite. This work fed into the development of internal tolerances for certain risks.
Page 37 v. 2.7

Clearly, the Company is in the business of taking investment risk and so the Committee does not seek to
eliminate investment risks. Rather, it seeks to ensure that the risks taken accord with the risk appetite of the
Company, that no undue or abnormal exposures are taken and that all relevant controls are operating
appropriately. The Company’s principal investment risks relate to its holdings of investment funds and the
Company’s ability to control the risks embedded in these funds is limited to its role as a shareholder in those
funds. Nonetheless, the Committee monitored underlying investment risks in some detail and had a
relationship of constructive engagement with BlueCrest, as detailed below. During the period, all investment
risks were considered by the Committee to lie within normal ranges.
On 1 December 2015, the Company was notified by BlueCrest of the intention to return capital to investors in
AllBlue. Subsequent to this announcement, the work of the Risk Committee was largely undertaken by the
full Board of the Company whilst the evaluation of the Company’s future and then the transition to Highbridge
Capital Corporation and Highbridge as AIFM took place. Detailed discussions continued with BlueCrest
during the early part of 2016.
ENGAGEMENT WITH BCML
The purpose of the Committee’s work in identifying risks is to seek to understand which risks can be
managed and mitigated and which cannot. The nature of the Company’s structure is that it did not have a
direct contractual relationship with BlueCrest as investment manager of AllBlue. This has always been the
case. The process with BlueCrest, therefore, was one of constructive engagement on both sides – the
Company challenging and probing on behalf of Shareholders because AllBlue was the majority investment of
the Company, and BlueCrest because the Company was the largest, and a material, investor in AllBlue.
This relationship operated successfully during 2015.
During the year, a due diligence visit was undertaken to BlueCrest in London, as in prior years. This
included meetings with key risk and related personnel and examination of risk controls and processes. It
also included work to validate the reliance of the Risk Committee on data from BlueCrest.
EXPOSURE MONITORING
As explained elsewhere, as well as owning shares in AllBlue, the Company maintained a cash balance and
exposure to AllBlue Leveraged. This facilitated, amongst other things, the Company’s repurchase of Shares
in the market but brought a number of additional risks. In particular, there was a risk that the buyback of
Shares would cause the Company’s economic exposure to AllBlue to vary from its objective of 1:1 over time.
This exposure was reset as frequently as possible (via monthly subscriptions and quarterly redemptions with
notice). During the year, the economic exposure of the Sterling Shares to AllBlue varied between 100.9%
and 103.90% and this was within the tolerances set by the Committee and the risk appetite of the Company.
Subsequent to the compulsory redemption of the Company’s investments in AllBlue and AllBlue Leveraged,
the Company retains a residual exposure to AllBlue and AllBlue Leveraged and this is monitored by the
Page 38 v. 2.7
Board and the risk committee.
Cash balances were maintained during the period in accordance with the Treasury Policy.
THE CHANGING ROLE OF THE RISK COMMITTEE IN 2016
Subsequent to the period end, the Company appointed Highbridge as AIFM and, since 1 March 2016, has
been invested in HCC alongside the residual interest in AllBlue. Previously, and during the period, the
Company was out of scope of the AIFMD. The Committee has now begun to engage with Highbridge to re-
examine the role of the Risk Committee, review the Committee’s terms of reference and also to review the
key risk metrics relevant to the Company’s investment in HCC. I look forward to reporting to you on this in
due course.
Paul Meader
Risk Committee Chairman
Page 39 v. 2.7

Audit Committee Report MEMBERSHIP
The current Chairman of the Audit Committee is Steve Le Page, who became Chairman on his appointment
to the Board on 3 June 2014. Paul Meader was a member of the Committee throughout 2014 and 2015.
Richard Crowder (Company Chairman) was a member of the Audit Committee throughout 2014 but resigned
from the Committee on 13 January 2015. John Le Prevost joined the Committee on 28 November 2014 and
served until the date of his resignation, and Sarita Keen joined the Committee on 3 June 2015 on her
appointment to the Board.
COMPLIANCE WITH THE AIC CODE
In the opinion of the Board, the Audit Committee of the Company complies with the recommendations and
requirements of the AIC code in all respects except as follows –
The Chairman of the Company was a member of the Committee as the Board considered that he was
independent on appointment.
The Company does not have an internal audit function, because it has no employees and operates no
systems of its own, relying instead on the employees and systems of its external service providers.
It should also be noted that the Company has established a Risk Committee to address the risks pertaining
to the investment performance of the Company, and therefore the scope of the Audit Committee does not
extend to consideration of those risks. The Board has reviewed the scope of both Committees and is
satisfied that all risks to which the Company is subject are appropriately managed.
The Audit Committee met on five occasions during 2015 (four in 2014). The auditor attended two of these
meetings, during which time the Committee and the auditor met privately, that is in the absence of any
service providers.
KEY ACTIVITIES OF THE AUDIT COMMITTEE
In the period since the last Audit Committee report, the key activities of the Committee have been –
• Monitoring and assessing the financial systems and controls operated by the Company’s key service
providers;
• Overseeing the preparation and publication of, and giving appropriate advice to the Board in respect of,
the interim report for the six months ended 30 June 2015 and the current annual report for the year
ended 31 December 2015;
Page 40 v. 2.7
• Discussing with the Auditors the review, by the Audit Quality Review Team (“AQRT”) of the Financial
Reporting Council, of the Auditors’ audit of the 31 December 2014 financial statements of the Company;
• Assessing the effectiveness of the external audit and the performance, independence and quality of the
auditors to the Company.
Each of these key activities is covered in more detail in the following sections.
FINANCIAL SYSTEMS AND CONTROLS OPERATED BY SERVICE PROVIDERS
In common with most investment funds, the Company is reliant on the systems, processes and controls
operated by its service providers. Throughout the year, the Committee is alert to any indication that service
providers may not be performing as expected, such as inaccurate or delayed information, shareholder
feedback and the level and standard of interaction between service providers. In so doing the Committee
uses its collective knowledge of how other entities are serviced as well as their own experience from
previous roles with other service providers. During November 2014 a Director visited the Company’s
Secretary and Administrator to carry out a detailed review of their processes under the direction of the
Management & Remuneration Committee, and the findings have been taken into account by the Committee.
Finally, in March 2015 the non-executive directors all visited BlueCrest, the investment manager of AllBlue
Limited and AllBlue Leveraged Feeder Fund Limited (“the BlueCrest Funds”), to discuss their processes and
activities and their possible impact on the Company.
In addition, the Committee has reviewed the third party controls reports (ISAE 3402 or equivalent reports)
provided by the following key service providers during 2015 –
ISAE 3402 Report from the administrator of AllBlue;
ISAE 3402 Report from the investment manager of AllBlue.
On 1 December 2015, BlueCrest, and the Board of Directors of each of the relevant BlueCrest Funds (or
General Partner, where appropriate) announced that the BlueCrest Funds would embark upon a programme
to return the capital managed in those funds to investors. The Board of the Company, as more fully
described in the Chairman’s Statement, after due process appointed Highbridge Capital Management, LLC
(“Highbridge”) as its investment manager. During the process of selecting Highbridge an operational due
diligence report was obtained from an independent agency experienced in carrying out such work. That
report did not identify any control or operational weaknesses at Highbridge which were of concern to the
Board or the Company.
On the basis of the activities described immediately above, the Committee identified some delays and
inaccuracies, none of which resulted in any financial loss. As a result, the Committee is satisfied that the
Company’s reliance on service providers during 2015 was not misplaced and that the systems of internal
Page 41 v. 2.7
control operated on the Company’s behalf, both during the calendar year 2015 and currently, should prevent
material error or misstatement of financial information.
PREPARATION OF INTERIM AND ANNUAL REPORTS
Prior to each reporting period end, the Committee met with the Secretary and Administrator, and also with
the auditor prior to the annual reporting date. As Chairman, I also met with each of these parties separately.
The primary purpose of all of these meetings was to consider the timetable for production of the reports, to
review the proposed scope of the external audit of the annual report, and the arrangements for cooperation
between the Company’s service providers. The Company’s key risks, principal accounting policies and
significant areas of judgment or estimation (all as disclosed elsewhere in this annual report) were also
considered for appropriateness and completeness. As a result of these meetings we were able to conclude
that the annual report production process had been properly planned and prepared for.
In August 2015 and April 2016 the Committee reviewed the draft interim and annual reports, respectively, for
compliance with International Financial Reporting Standards (as adopted by the European Union) and
applicable Law or regulation, and also reconsidered the key risks, principal accounting policies and
significant areas of judgment or estimation to ensure the disclosure of these items and their application in the
reports remained appropriate. This review and reconsideration included further meetings with the auditor and
Secretary and Administrator. It also included certain activities connected with the review of service providers,
as detailed above.
The significant issues which the Committee considered in relation to these Financial Statements, in addition
to those set out elsewhere in this section, were the existence and valuation of the Company’s investment
holdings. Existence was verified by obtaining direct confirmation from the administrators of AllBlue, AllBlue
Leveraged and ICS. The price at which each investment is valued was also confirmed directly in this way. In
addition, the Committee considered the results of the service provider monitoring referred to above (and
especially the ISAE 3402 report from the administrator of AllBlue), and also reviewed the cash and valuation
statements received post year end. The Committee concluded that the investments existed and were
properly valued in accordance with the accounting policy of the Company, set out on page 51
Having carried out the activities set out above the Committee concluded that the Financial Statements were
fairly stated. The Committee also read the entire annual report for consistency both internally and with their
detailed knowledge of the Company throughout the year, and also considered whether it was as clear and as
concise as possible. We then considered the information needs of the likely users of the annual report and
whether they were met. Our conclusion was that, taken as a whole, the annual report is fair, balanced and
understandable and provides the information necessary for shareholders to assess the Company’s
performance, business model and strategy.
Finally in respect of the annual report, in April the Committee considered the regular monitoring of the
Page 42 v. 2.7

Company’s cash position carried out by the Board, together with a detailed cash forecast for the period until
30 April 2017. The principal uncertainty involved in the forecasting of the Company’s cash requirements is
the level at which cash will be utilised in support of the Company’s quarterly tender offer to Shareholders.
The Committee is satisfied that with the level of cash held, the regular monitoring by the Board and the
liquidity of the Company’s investments, it is appropriate to prepare the Financial Statements on a going
concern basis.
AQRT REVIEW OF THE 2014 EXTERNAL AUDIT
The AQRT of the Financial Reporting Council carries out inspections of the audits of public interest entities in
the UK and Crown Dependencies, including Guernsey.
Each year the AQRT routinely selects a number of audits carried out by the large audit firms, including Ernst
& Young LLP, with a view to inspecting the audits of all FTSE 350 companies over a five year cycle. Ernst &
Young LLP’s audit of the Company’s 31 December 2014 Financial Statements was part of this routine
inspection programme in the 2014/2015 cycle. The inspection was carried out during the second half of 2015
and the results of the inspection were reported to Ernst & Young LLP and the Company in January 2016.
The AQRT reported findings in two areas from their work. These have been carefully considered by the Audit
Committee.
They have also been discussed between Ernst & Young LLP and the Audit Committee. The Audit Committee
is satisfied that Ernst & Young LLP has appropriately responded to these findings in the 2015 audit and that
the quality of the 2014 audit was not compromised.
AUDITORS
As noted above the Committee has met with the auditors on several occasions and this has given us the
opportunity to assess the quality of the people involved in our audit and of the content and relevance of their
presentations. We have also been able to take into account the results of the AQRT review of the 2014 audit,
as noted above. During our meetings with them we considered their risk assessment, planned responses
and general approach as well as their actual delivery against plan, and we separately discussed with our
Administrator the degree of challenge they experienced from the auditors. We concluded that the external
audit process was appropriate to the Company’s circumstances and likely to prove effective.
The auditors provide only minimal non-audit services to the Company, and it is the Committee’s expectation
that this situation will continue, as we do not anticipate the need to seek any services from them, other than
the verification of the conversion ratio as described on page 32. The Committee has a formal policy
concerning non-audit services, detailed on the company’s website, should the need arise.
The Committee has also considered all the aspects of auditor independence set out in the Code and in the
Ethical Standards applicable to our auditor, at both the planning and final delivery stages of the audit. We
Page 43 v. 2.7

note that Ernst & Young are also auditors to the significant investments held by the Company at the year end
and to other structures managed or advised by BlueCrest and its affiliates. We have carefully considered
whether these other audit relationships might impinge upon the independence of our auditors and have
concluded that any perceived risk in this respect is adequately safeguarded against.
The Committee having concluded that the external audit is effective and that the auditors are independent
and competent has recommended to the Board that a resolution to reappoint Ernst & Young LLP be put to
the forthcoming AGM of the Company.
Steve Le Page
Chairman of the Audit Committee
Page 44 v. 2.7

Independent Auditor’s Report INDEPENDENT AUDITOR’S REPORT TO THE MEMBERS OF HIGHBRIDGE MULTI-STRATEGY FUND LIMITED (FORMERLY BLUECREST ALLBLUE FUND LIMITED)
Our opinion on the financial statements In our opinion:
Highbridge Multi-Strategy Fund Limited’s (“the Company”) financial statements (the “financial statements”) give a true and fair view of the state of the Company’s affairs as at 31 December 2015 and of its profit for the year then ended;
the financial statements have been properly prepared in accordance with International Financial Reporting Standards (“IFRSs”) as adopted by the European Union;
the financial statements have been prepared in accordance with the requirements of the Companies (Guernsey) Law, 2008.
What we have audited
Highbridge Multi-Strategy Fund Limited’s financial statements comprise:
Statement of comprehensive income for the year ended 31 December 2015
Statement of financial position as at 31 December 2015
Statement of changes in net assets attributable to shareholders for the year ended 31 December 2015
Statement of cash flows for the year ended 31 December 2015
Related notes 1 to 16 to the financial statements
The financial reporting framework that has been applied in their preparation is applicable law and International Financial Reporting Standards (IFRSs) as adopted by the European Union. Overview of our audit approach
Risks of material misstatement
• Valuation of investments; and
• Existence and ownership of investments
Audit scope • We performed an audit of the complete financial statements of the Company for the year ended 31 December 2015.
Materiality • Overall materiality of £8.0m which represents 1% of net assets attributable to shareholders.
Page 45 v. 2.7

Our assessment of risk of material misstatement
We identified the risks of material misstatement described below (which are consistent with the risks we identified in the prior year) as those that had the greatest effect on our overall audit strategy, the allocation of resources in the audit and the direction of the efforts of the audit team. In addressing these risks, we have performed the procedures below which were designed in the context of the financial statements as a whole and, consequently, we do not express any opinion on these individual areas.
Risk Our response to the risk What we concluded to the
Audit Committee
Valuation of investments (£790,682,544, PY comparative £774,718,912)
Refer to the Audit Committee Report (page 40); Accounting policies (page 51); and Note 7 of the Financial Statements (page 76)
At 31 December 2015, the Company was invested in AllBlue Limited and AllBlue Leveraged Feeder Limited (“the underlying funds”) which are unquoted investments. The Company also holds an investment in Blackrock ICS Institutional Sterling Government Liquidity Fund (“the ICS Fund”) which is listed on the London Stock Exchange. The Company’s investments are measured at fair value through profit or loss. The fair value of the unquoted investments was determined by reference to the published NAV of the underlying funds as at 31 December 2015. Subsequently, on 4 January 2016, the Company’s shareholdings in the underlying funds were converted to ‘creditor interests’ as part of the process by which they are returning capital to investors, and hence their fair value post-year end is determined by reference to valuation reports provided to the Company by their independent administrator. The fair value of the ICS Fund is based on the publicly available, quoted price. The valuation of the Company’s
Our response comprised:
- Updating our understanding of the processes adopted by the Board and management in respect of investment valuation, including our understanding of the systems and controls implemented;
- We agreed the valuation of
the Company’s investments in the underlying funds to the net asset values published by the administrator of the underlying funds (GlobeOp) as at 31 December 2015;
- We formed an independent
view as to whether the fair value of the Company’s investments in the underlying funds is equivalent to the net asset value of the investee funds by obtaining post-year end valuation reports from GlobeOp and reviewing for significant pricing adjustments to the Company’s creditor interests in the underlying funds, and agreeing post-year end redemption proceeds received to redemption notices issued by GlobeOp; and
- We agreed the valuation of
the Company’s investment in the ICS Fund to publically available pricing sources.
We confirmed that there were no matters identified during our audit work on valuation of investments that we wanted to bring to the attention of the Audit Committee.
Page 46 v. 2.7

investments is a significant driver of the net asset value of the Company and the most significant component of the statement of financial position. Management may seek to overstate the valuation of investments to maximise reported performance and net asset value per share.
Existence and ownership of investments (£790,682,544, PY comparative £774,718,912)
Refer to the Audit Committee Report (page 40); Accounting policies (page 51); and Note 7 of the Financial Statements (page 64)
Risk that investments presented in the Statement of Financial Position do not exist or the Company does not have the rights to cash flows derived from them. Failure to obtain good title exposes the Company to significant risk of loss.
Our approach comprised:
- Updating our understanding of the processes adopted by the Board and management (including obtaining and reviewing the ISAE 3402 reports of GlobeOp and BlueCrest) in respect of the existence and ownership of investments, including our understanding of the systems and controls implemented; and
- We obtained confirmations, as at 31 December 2015, of the Company’s holdings (both directly held and those held in a nominee capacity by the Company’s administrator) in the underlying funds and the ICS Fund, from their respective administrators and agreed them to the records of the Company.
We confirmed that there were no matters identified during our audit work on valuation of investments that we wanted to bring to the attention of the Audit Committee.
The scope of our audit
Tailoring the scope Our assessment of audit risk, our evaluation of materiality and our allocation of performance materiality determine our audit scope. Taken together, this enables us to form an opinion on the financial statements.
There have been no changes in the scope of our audit in the current year. We performed an audit of the complete financial statements of the Company for the year ended 31 December 2015.
Our application of materiality
We apply the concept of materiality in planning and performing the audit, in evaluating the effect of identified misstatements on the audit and in forming our audit opinion.
Materiality The magnitude of an omission or misstatement that, individually or in the aggregate, could reasonably be expected to influence the economic decisions of the users of the financial statements. Materiality provides a basis for determining the nature and extent of our audit procedures.
Page 47 v. 2.7
We determined materiality for the Company to be £8.0 million (2014: £8.2 million), which is 1% (2014: 1%) of net assets attributable to shareholders.
It was considered inappropriate to determine materiality based on Company profit before tax as the primary focus of the Company is the overall performance of investments held which includes a significant asset revaluation component. In addition, profit is not a key metric reported upon by the Company.
We believe that net assets attributable to shareholders provides us with an appropriate basis for audit materiality as net asset value is a key published performance measure and is a key metric used by management in assessing and reporting on the overall performance of the Company.
During the course of our audit, we reassessed initial materiality and noted no factors leading us to amend materiality levels from those originally determined at the audit planning stage.
Performance materiality The application of materiality at the individual account or balance level. It is set at an amount to reduce to an appropriately low level the probability that the aggregate of uncorrected and undetected misstatements exceeds materiality.
On the basis of our risk assessments, together with our assessment of the Company’s overall control environment, our judgement was that performance materiality was 75% (2014: 75%) of our planning materiality, namely £6.0m (2014: £6.2m). We have set performance materiality at this percentage due to the investment strategy remaining consistent with our previous experience and limited identification of audit findings in previous periods.
Reporting threshold An amount below which identified misstatements are considered as being clearly trivial.
We agreed with the Audit Committee that we would report to them all uncorrected audit differences in excess of £0.4m (2014: £0.4m), which is set at 5% of planning materiality, as well as differences below that threshold that, in our view, warranted reporting on qualitative grounds.
We evaluate any uncorrected misstatements against both the quantitative measures of materiality discussed above and in light of other relevant qualitative considerations in forming our opinion.
Scope of the audit of the financial statements An audit involves obtaining evidence about the amounts and disclosures in the financial statements sufficient to give reasonable assurance that the financial statements are free from material misstatement, whether caused by fraud or error. This includes an assessment of: whether the accounting policies are appropriate to the Company’s circumstances and have been consistently applied and adequately disclosed; the reasonableness of significant accounting estimates made by the directors; and the overall presentation of the financial statements. In addition, we read all the financial and non-financial information in the annual report to identify material inconsistencies with the audited financial statements and to identify any information that is apparently materially incorrect based on, or materially inconsistent with, the knowledge acquired by us in the course of performing the audit. If we become aware of any apparent material misstatements or inconsistencies we consider the implications for our report.
Respective responsibilities of directors and auditor As explained more fully in the Directors’ Responsibilities Statement set out on page 35, the directors are responsible for the preparation of the financial statements and for being satisfied that they give a true and fair view. Our responsibility is to audit and express an opinion on the financial statements in accordance with applicable law and International Standards on Auditing (UK and Ireland). Those standards require us to comply with the Auditing Practices Board’s Ethical Standards for Auditors.
This report is made solely to the Company’s members, as a body, in accordance with Section 262 of the Companies (Guernsey) Law, 2008. Our audit work has been undertaken so that we might state to the Company’s members those matters we are required to state to them in an auditor’s report and for no other purpose. To the fullest extent permitted by law, we do not accept or assume responsibility to anyone other than the Company and the Company’s members as a body, for our audit work, for this report, or for the opinions we have formed.
Page 48 v. 2.7

Matters on which we are required to report by exception
ISAs (UK and Ireland) reporting
We are required to report to you if, in our opinion, financial and non-financial information in the annual report is: • materially inconsistent with the information in the
audited financial statements; or • apparently materially incorrect based on, or materially
inconsistent with, our knowledge of the Company acquired in the course of performing our audit; or
• otherwise misleading. In particular, we are required to report whether we have identified any inconsistencies between our knowledge acquired in the course of performing the audit and the directors’ statement that they consider the annual report and accounts taken as a whole is fair, balanced and understandable and provides the information necessary for shareholders to assess the entity’s performance, business model and strategy; and whether the annual report appropriately addresses those matters that we communicated to the Audit Committee that we consider should have been disclosed.
We have no exceptions to report.
Companies (Guernsey) Law 2008 reporting
We are required to report to you if, in our opinion: • proper accounting records have not been kept; or • the financial statements are not in agreement with the
accounting records and returns; or • we have not received all the information and
explanations we require for our audit.
We have no exceptions to report.
Listing Rules review requirements
We are required to review: • the directors’ statement in relation to going concern on
pages 34 and 34 and longer-term viability set out on pages 32 and 34.
• the part of the Corporate Governance Statement relating to the Company’s compliance with the provisions of the UK Corporate Governance Code specified for our review; and
We have no exceptions to report.
Statement on the Directors’ assessment of the principal risks that would threaten the solvency or liquidity of the entity ISAs (UK and Ireland) reporting
We are required to give a statement as to whether we have anything material to add or to draw attention to in relation to:
• the directors’ confirmation in the annual report that they have carried out a robust assessment of the principal risks facing the entity, including those that would threaten its business model, future performance, solvency or liquidity;
• the disclosures in the annual report that describe those risks and explain how they are being managed or mitigated;
• the directors’ statement in the financial statements about whether they considered it appropriate to adopt the going concern basis of accounting in preparing them, and their identification of any material uncertainties to the entity’s ability to continue to do so over a period of at least twelve months from the date of approval of the financial statements; and
• the directors’ explanation in the annual report as to how they have assessed the prospects of the entity, over what period they have done so and why they consider
We have nothing material to add or to draw attention to.
Page 49 v. 2.7

that period to be appropriate, and their statement as to whether they have a reasonable expectation that the entity will be able to continue in operation and meet its liabilities as they fall due over the period of their assessment, including any related disclosures drawing attention to any necessary qualifications or assumptions.
Christopher James Matthews, FCA for and on behalf of Ernst & Young LLP Guernsey, Channel Islands 29 April 2016 Notes: 1. The maintenance and integrity of the Company’s information published on the Company’s website is the responsibility of the
directors; the work carried out by the auditor does not involve consideration of these matters and, accordingly, the auditor accepts no responsibility for any changes that may have occurred to the financial statements since they were initially presented on the website.
2. Legislation in Guernsey governing the preparation and dissemination of financial statements may differ from legislation in other jurisdictions.
Page 50 v. 2.7

Audited Financial Statements Primary Accounting Policies KEY ACCOUNTING POLICY AND KEY ACCOUNTING JUDGMENT AND AREA OF ESTIMATION UNCERTAINTY FOR THE YEAR ENDED 31 DECEMBER 2015 The Company’s unquoted financial assets designated as at fair value through profit or loss are the most
significant element of its Statement of Financial Position and the most significant contributor to its
performance as set out in the Statement of Comprehensive Income. Consequently, the Board of the
Company wish to highlight here the Company’s accounting policy for unquoted financial assets designated
as at fair value through profit or loss and the accounting judgments and estimation uncertainties which apply
to them.
ACCOUNTING POLICY FOR UNQUOTED FINANCIAL ASSETS DESIGNATED AS AT FAIR VALUE THROUGH PROFIT OR LOSS All investments are designated upon initial recognition as financial assets at “fair value through profit or loss”.
Investments are initially recognised on the date of purchase (on 'trade date' basis) at cost, being the fair
value of the consideration given, excluding transaction costs associated with the investment.
Investments are subsequently re-measured at fair value at each reporting date. Unrealised gains and losses
on investments arising from change in the fair value from prior years is recognised in the Statement of
Comprehensive Income. Realised gains or losses on the disposal of investments are determined by
reference to average purchase cost. These are also recognised in the Statement of Comprehensive Income.
ACCOUNTING JUDGMENTS AND ESTIMATION UNCERTAINTIES APPLICABLE TO UNQUOTED FINANCIAL ASSETS DESIGNATED AS AT FAIR VALUE THROUGH PROFIT OR LOSS Valuation of current investments
In order to assess the fair value of the unquoted non-current and current investments, the NAV of the
underlying investments in Highbridge, AllBlue, AllBlue Leveraged and the ICS Funds is taken into
consideration. The Company's holdings in AllBlue and AllBlue Leveraged were realisable at their NAV on
quarterly dealing days until 1 December 2015 and the Company’s holdings in ICS were realisable at their
NAV on daily dealing days facilitated by the administrators of these funds. Having taken account of the
Company's history of successfully realising its holdings at NAV, and in the absence of gating or suspension
of redemptions of the ICS funds at the Company's year end, the Directors are satisfied that the reported NAV
is a fair estimation of fair value of the Company's holding in ICS. The Directors have considered the
circumstances surrounding the compulsory redemption of the Company’s investments in AllBlue and AllBlue
Leveraged and consider that the NAV supplied by the independent administrator of AllBlue and AllBlue
Leveraged remains a fair estimation of the fair value of the Company’s holdings in AllBlue and AllBlue
Leveraged as at 31 December 2015.
The Company's NAV is based on valuations of unquoted investments. As described above, in calculating the
NAV and the NAV per share of the Company, the Administrator relies on the NAVs of the shares supplied by
the Administrator of the Underlying Fund, AllBlue, AllBlue Leveraged and ICS Funds. Those NAVs are
themselves based on the NAV of the various investments held by the Underlying Fund, AllBlue, AllBlue
Leveraged and ICS Funds.
Page 51 v. 2.7

Financial Statements STATEMENT OF COMPREHENSIVE INCOME FOR THE YEAR ENDED 31 DECEMBER 2015
Ordinary Shares Sterling US Dollar Share Share Class Class Total £ $ £ Notes Net gain on current financial assets at fair value through profit or loss
7 20,775,843 1,806,344 22,312,758
Net gain on purchase of own shares 2,604,064 269,550 2,780,413
Bank interest received 60,639 1,345 61,519
Operating expenses 3 (990,834) (39,001) (1,016,350)
Other Comprehensive Income that will be reclassified to profit or loss in future periods
Currency aggregation adjustment 1(g) - - 1,709,374
Increase in net assets attributable to shareholders after other comprehensive income 22,449,712 2,038,238 25,847,714 Earnings per share for the year -
Pence (£)
Cents ($) Basic and Diluted 5 5.75 6.67
In arriving at the results for the financial year, all amounts above relate to continuing operations. The notes on pages 60 to 78 and the Primary Accounting Policies on page 51 form an integral part of these Financial Statements.
Page 52 v. 2.7

STATEMENT OF COMPREHENSIVE INCOME FOR THE YEAR ENDED 31 DECEMBER 2014
Ordinary Shares Sterling Euro US Dollar Share Share Share Class Class Class Total £ € $ £ Notes
Net gain on non current financial assets at fair value through profit or loss 7 49,450,769 794,394 4,460,387 53,015,225
Net gain on current financial assets at fair value through profit or loss 7 2,387 - - 2,387
Net gain on purchase of own shares 3,123,107 - 256,678 3,278,896
Bank interest received 102,451 1,318 9,967 109,562
Operating expenses 3 (719,832) (52,588) (78,464) (809,831)
Other Comprehensive Income that will be reclassified to profit or loss in future periods
Currency aggregation adjustment 1(g) - - - 1,944,229
Increase in net assets attributable to shareholders after other comprehensive income 51,958,882 743,124 4,648,568 57,540,468 Earnings per share for the year -
Pence (£)
Cent (€)
Cents ($)
Basic and Diluted 5 12.67 12.03 11.47 In arriving at the results for the financial year, all amounts above relate to continuing operations. The notes on pages 60 to 78 and the Primary Accounting Policies on page 51 form an integral part of these Financial Statements.
Page 53 v. 2.7
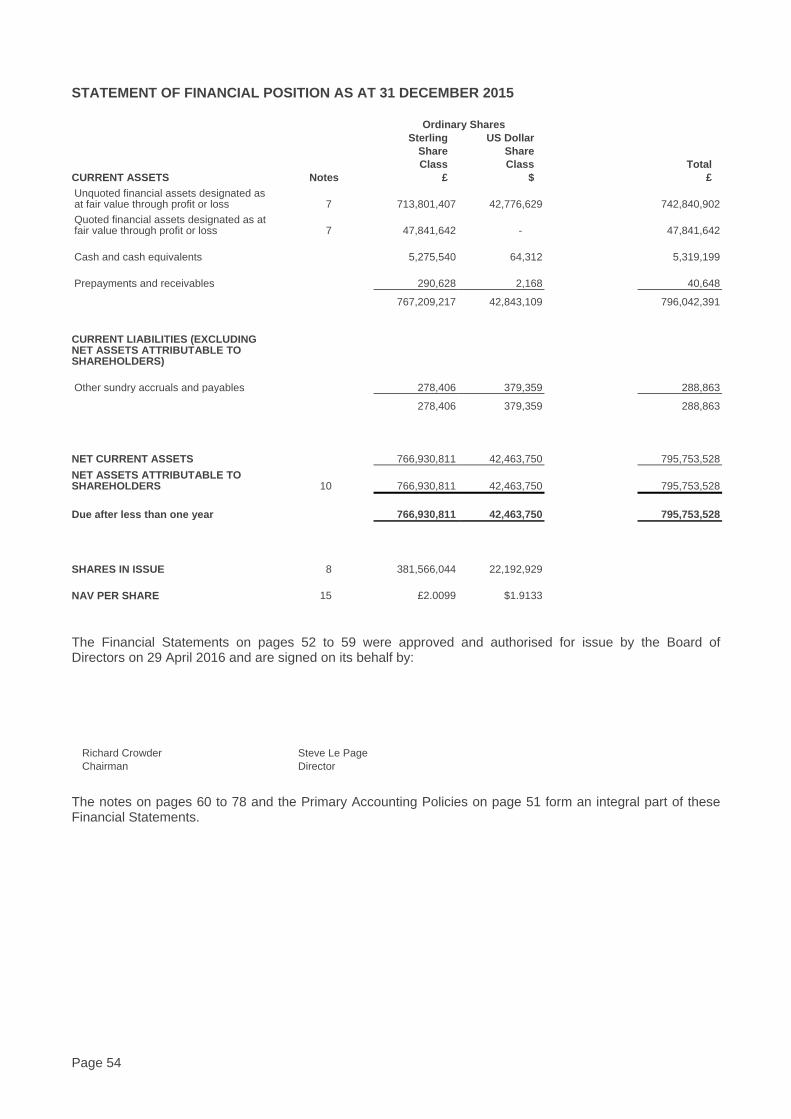
STATEMENT OF FINANCIAL POSITION AS AT 31 DECEMBER 2015
Ordinary Shares CURRENT ASSETS
Notes
Sterling Share Class
£
US Dollar Share Class
$ Total
£ Unquoted financial assets designated as at fair value through profit or loss 7 713,801,407 42,776,629 742,840,902 Quoted financial assets designated as at fair value through profit or loss 7 47,841,642 - 47,841,642
Cash and cash equivalents 5,275,540 64,312 5,319,199
Prepayments and receivables 290,628 2,168 40,648
767,209,217 42,843,109 796,042,391
CURRENT LIABILITIES (EXCLUDING NET ASSETS ATTRIBUTABLE TO SHAREHOLDERS)
Other sundry accruals and payables 278,406 379,359 288,863
278,406 379,359 288,863
NET CURRENT ASSETS 766,930,811 42,463,750 795,753,528 NET ASSETS ATTRIBUTABLE TO SHAREHOLDERS 10 766,930,811 42,463,750 795,753,528
Due after less than one year 766,930,811 42,463,750 795,753,528
SHARES IN ISSUE 8 381,566,044 22,192,929
NAV PER SHARE 15 £2.0099 $1.9133
The Financial Statements on pages 52 to 59 were approved and authorised for issue by the Board of Directors on 29 April 2016 and are signed on its behalf by:
Richard Crowder Steve Le Page Chairman Director
The notes on pages 60 to 78 and the Primary Accounting Policies on page 51 form an integral part of these Financial Statements.
Page 54 v. 2.7

STATEMENT OF FINANCIAL POSITION AS AT 31 DECEMBER 2014
Ordinary Shares
Notes
Sterling Share Class
£
Euro Share Class
€
US Dollar Share Class
$
Total £
NON CURRENT ASSETS Unquoted financial assets designated as at fair value through profit or loss 7 725,358,328 - 75,055,765 773,542,038
CURRENT ASSETS Quoted financial assets designated as at fair value through profit or loss 7 1,176,874 - - 1,176,874
Cash and cash equivalents 45,083,160 34,132 69,347 45,154,187
Prepayments and receivables 2,557,439 - 3,797 43,746
48,817,473 34,132 73,144 46,374,806 CURRENT LIABILITIES (EXCLUDING NET ASSETS ATTRIBUTABLE TO SHAREHOLDERS) Other sundry accruals and payables 69,201 34,132 3,925,739 99,793
69,201 34,132 3,925,739 99,793
NET CURRENT ASSETS (LIABILITIES) 48,748,272 - (3,852,595) 46,275,013 NET ASSETS ATTRIBUTABLE TO SHAREHOLDERS 10 774,106,600 - 71,203,170 819,817,051
Due after less than one year 774,106,600 - 71,203,170 819,817,051
SHARES IN ISSUE 8 396,504,386 - 38,229,946
NAV PER SHARE £1.9523 €0.0000 $1.8624 The notes on pages 60 to 78 and the Primary Accounting Policies on page 51 form an integral part of these Financial Statements.
Page 55 v. 2.7

STATEMENT OF CHANGES IN NET ASSETS ATTRIBUTABLE TO SHAREHOLDERS FOR THE YEAR ENDED 31 DECEMBER 2015
Notes
Sterling Share Class
£
US Dollar Share Class
$ Total
£
Opening Balance 774,106,600 71,203,170 819,817,051 Adjustment to allocation of reserves brought forward 338,972 (417,356) - Accretive gain transfer between share classes (206,348) 215,756 - Increase in net assets attributable to shareholders 22,449,712 2,038,238 25,847,714 On-market purchases of Ordinary Shares 10 (46,443,652) (5,107,925) (49,911,237)
Share conversions 11 16,685,526
(25,468,133) -
Closing balance 766,930,811
42,463,750 795,753,528
The notes on pages 60 to 78 and the Primary Accounting Policies on page 51 form an integral part of these Financial Statements.
Page 56 v. 2.7
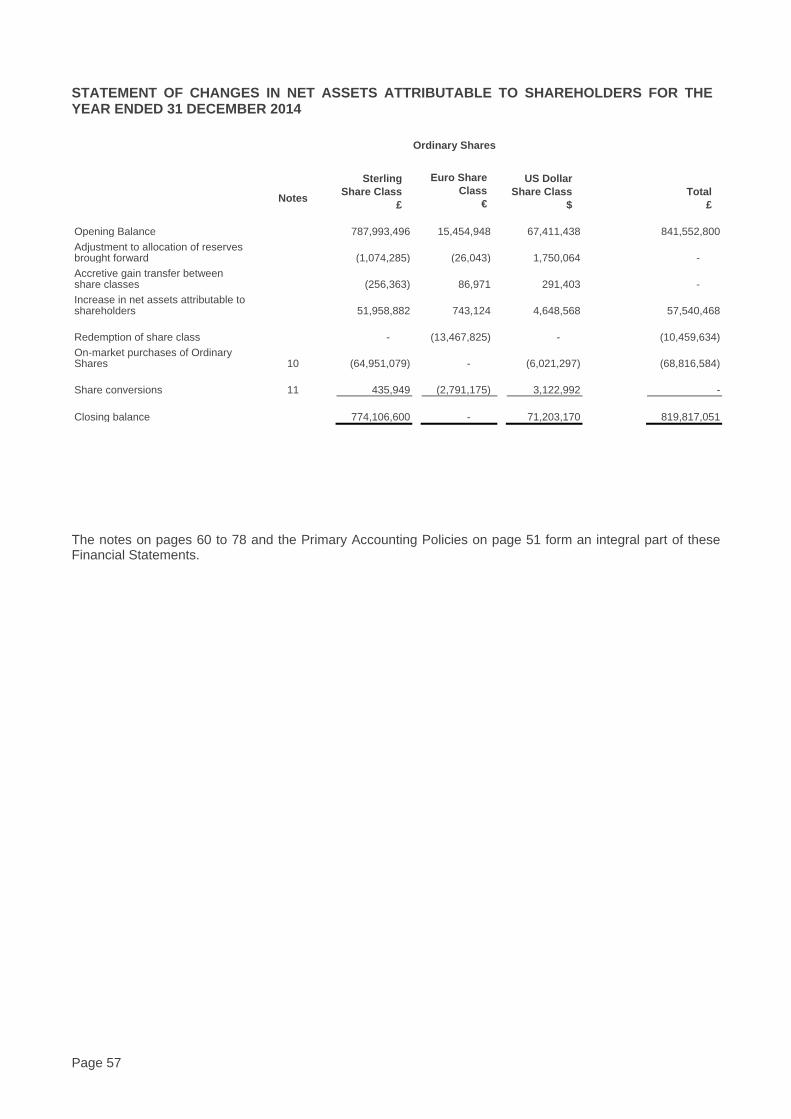
STATEMENT OF CHANGES IN NET ASSETS ATTRIBUTABLE TO SHAREHOLDERS FOR THE YEAR ENDED 31 DECEMBER 2014
Ordinary Shares
Notes
Sterling Share Class
£
Euro Share Class
€
US Dollar Share Class
$ Total
£
Opening Balance 787,993,496 15,454,948 67,411,438 841,552,800 Adjustment to allocation of reserves brought forward (1,074,285) (26,043) 1,750,064 - Accretive gain transfer between share classes (256,363) 86,971 291,403 - Increase in net assets attributable to shareholders 51,958,882 743,124 4,648,568 57,540,468
Redemption of share class - (13,467,825) - (10,459,634) On-market purchases of Ordinary Shares 10 (64,951,079) - (6,021,297) (68,816,584)
Share conversions 11 435,949
(2,791,175)
3,122,992 -
Closing balance 774,106,600
-
71,203,170 819,817,051 The notes on pages 60 to 78 and the Primary Accounting Policies on page 51 form an integral part of these Financial Statements.
Page 57 v. 2.7

STATEMENT OF CASH FLOWS FOR THE YEAR ENDED 31 DECEMBER 2015
Ordinary Shares
Sterling Share Class
£
Euro Share Class
€
US Dollar Share Class
$ Total
£
Operating activities Increase in net assets attributable to shareholders after other comprehensive income 22,449,712 - 2,038,238 25,847,714 Increase in unrealised appreciation on financial assets at fair value through profit or loss 1,092,841 - 2,841,115 2,788,254
Realised gains on sales of financial assets (21,501,565) - - (21,501,565)
Realised gains on conversions (367,119) - (4,647,459) (3,522,110)
Gain on purchase of own shares (2,604,064) - (269,550) (2,780,413)
Interest income (60,639) - (1,345) (61,519)
Currency aggregation adjustment - - - (1,709,374)
Adjustment to allocation of reserves brought forward 338,972 - (417,356) -
Adjustment to share conversions (5,667,997) - 8,617,347 -
Accretive gain transfer between share classes (206,348) - 215,756 -
Increase/(decrease) in payables 209,205 (34,132) (3,546,380) 189,070
Decrease in receivables 2,266,809 - 1,630 3,098
Net cashflow (used in)/from operating activities (4,050,193) (34,132) 4,831,995 (746,845)
Investing activities
Interest received 60,639 - 1,345 61,519
Purchase of financial assets (122,968,481) - - (122,968,481)
Proceeds from sale of financial assets 130,990,000 - - 130,990,000
Net cashflow from/(used in) investing activities 8,082,159 - 1,345 8,083,038
Financing activities
Purchase of own shares (43,839,588) - (4,838,375) (47,130,824)
Net cashflow from/(used in) financing activities (43,839,588) (4,838,375) (47,130,824)
Cash and cash equivalents at beginning of year 45,083,160 34,132 69,347 45,154,187
Currency aggregation adjustment - - - (40,357)
Decrease in cash and cash equivalents (39,807,620) (34,132) (5,035) (39,794,631)
Cash and cash equivalents at end of year 5,275,540 - 64,312 5,319,199 The notes on pages 60 to 78 and the Primary Accounting Policies on page 51 form an integral part of these Financial Statements.
Page 58 v. 2.7

STATEMENT OF CASH FLOWS FOR THE YEAR ENDED 31 DECEMBER 2014
Ordinary Shares
Sterling Share Class
£
Euro Share Class
€
US Dollar Share Class
$ Total
£
Operating activities Increase in net assets attributable to shareholders after other comprehensive income 51,958,882 743,124 4,648,568 57,540,468 (Decrease)/increase in unrealised appreciation on financial assets at fair value through profit or loss (27,971,936) 1,780,001 (3,685,755) (29,037,338)
Realised gains on sales of financial assets (19,766,892) (2,067,466) - (21,372,566)
Realised gains on conversions (1,714,328) (506,929) (774,632) (2,605,321)
Gain on purchase of own shares (3,123,107) - (256,678) (3,278,896)
Interest income (102,451) (1,318) (9,967) (109,562)
Currency aggregation adjustment - - - (1,944,229)
Adjustment to allocation of reserves brought forward (1,074,285) (26,043) 1,750,064 -
Accretive gain transfer between share classes (256,363) 86,971 291,403 -
(Decrease)/increase in payables (267,949) 32,007 3,916,460 (6,968)
(Increase)/decrease in receivables (2,510,216) 36,125 330,154 6,689
Net cashflow (used in)/from operating activities (4,828,645) 76,472 6,209,617 (807,723)
Investing activities
Interest received 102,451 1,318 9,967 109,562
Purchase of financial assets - (50,000) (440,000) (321,300)
Proceeds from sale of financial assets 85,000,001 13,468,690 - 95,460,307
Net cashflow from/(used in) investing activities 85,102,452 13,420,008 (430,033) 95,248,569
Financing activities
Purchase of own shares (61,827,972) - (5,764,619) (65,537,688)
Redemption of share class - (13,467,825) - (10,459,634)
Net cashflow used in financing activities (61,827,972) (13,467,825) (5,764,619) (75,997,322)
Cash and cash equivalents at beginning of year 26,637,325 5,477 54,382 26,674,719
Currency aggregation adjustment - - - 35,944
Increase in cash and cash equivalents 18,445,835 28,655 14,965 18,443,524
Cash and cash equivalents at end of year 45,083,160 34,132 69,347 45,154,187 The notes on pages 60 to 78 and the Primary Accounting Policies on page 51 form an integral part of these Financial Statements.
Page 59 v. 2.7
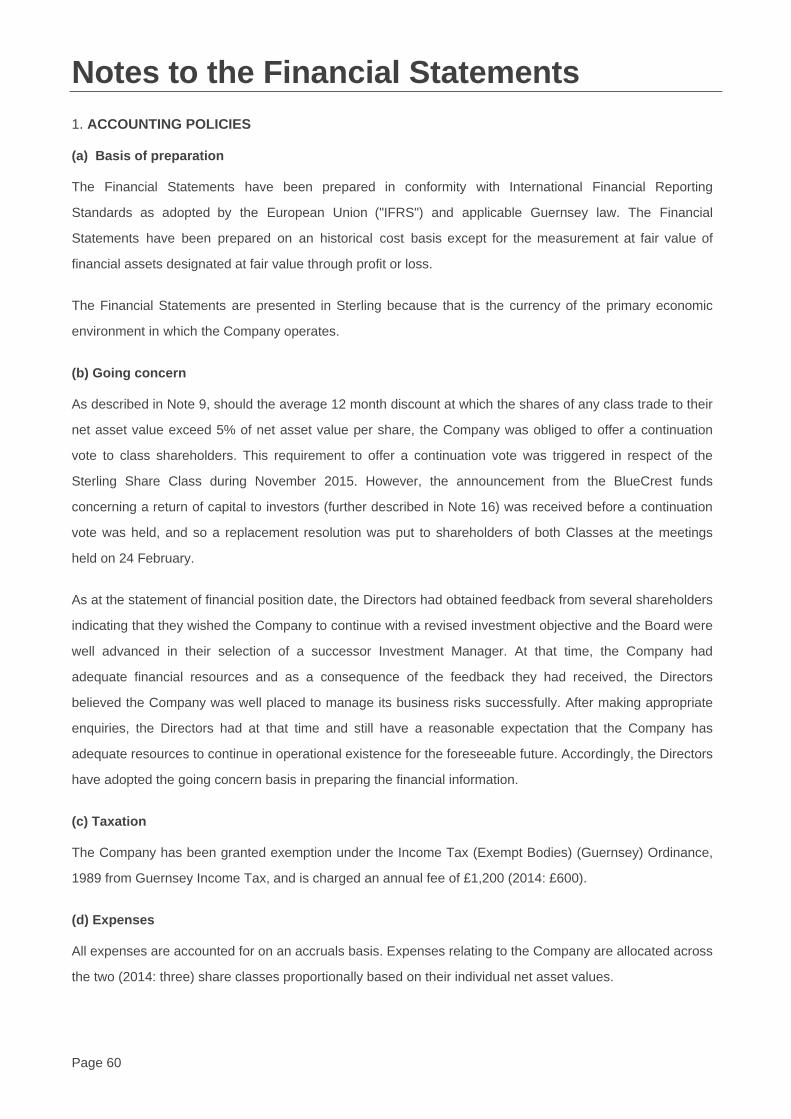
Notes to the Financial Statements 1. ACCOUNTING POLICIES
(a) Basis of preparation
The Financial Statements have been prepared in conformity with International Financial Reporting
Standards as adopted by the European Union ("IFRS") and applicable Guernsey law. The Financial
Statements have been prepared on an historical cost basis except for the measurement at fair value of
financial assets designated at fair value through profit or loss.
The Financial Statements are presented in Sterling because that is the currency of the primary economic
environment in which the Company operates.
(b) Going concern
As described in Note 9, should the average 12 month discount at which the shares of any class trade to their
net asset value exceed 5% of net asset value per share, the Company was obliged to offer a continuation
vote to class shareholders. This requirement to offer a continuation vote was triggered in respect of the
Sterling Share Class during November 2015. However, the announcement from the BlueCrest funds
concerning a return of capital to investors (further described in Note 16) was received before a continuation
vote was held, and so a replacement resolution was put to shareholders of both Classes at the meetings
held on 24 February.
As at the statement of financial position date, the Directors had obtained feedback from several shareholders
indicating that they wished the Company to continue with a revised investment objective and the Board were
well advanced in their selection of a successor Investment Manager. At that time, the Company had
adequate financial resources and as a consequence of the feedback they had received, the Directors
believed the Company was well placed to manage its business risks successfully. After making appropriate
enquiries, the Directors had at that time and still have a reasonable expectation that the Company has
adequate resources to continue in operational existence for the foreseeable future. Accordingly, the Directors
have adopted the going concern basis in preparing the financial information.
(c) Taxation
The Company has been granted exemption under the Income Tax (Exempt Bodies) (Guernsey) Ordinance,
1989 from Guernsey Income Tax, and is charged an annual fee of £1,200 (2014: £600).
(d) Expenses
All expenses are accounted for on an accruals basis. Expenses relating to the Company are allocated across
the two (2014: three) share classes proportionally based on their individual net asset values.
Page 60 v. 2.7

(e) Interest income
Interest income is accounted for on an accruals basis.
(f) Cash and cash equivalents
Cash and cash equivalents are defined as call deposits and short term deposits readily convertible to known
amounts of cash and subject to insignificant risk of changes in value, together with bank overdrafts. For the
purposes of the Statement of Cash Flows, cash and cash equivalents consist of cash and deposits at bank,
together with bank overdrafts.
(g) Foreign currency translation
The Financial Statements are presented in Sterling, which is the Company's functional and presentation
currency. Operating expenses in foreign currencies are initially recorded at the functional currency rate ruling
at the date of the transaction. Monetary assets and liabilities denominated in foreign currencies are
translated at the functional currency rate of exchange ruling at the reporting date. Investments in US Dollars
and Euro share classes were initially recorded in their respective currencies and translated into the
Company's functional currency at the reporting date. All differences on these foreign currency translations
are taken to the Statement of Comprehensive Income.
At the reporting date the results of the Share Classes are shown on the Statement of Comprehensive
Income in their respective currencies. These are then converted using the average exchange rate for the
year and the Sterling total presented. Any exchange difference arising on the aggregation of share classes is
presented on the Statement of Comprehensive Income as Other Comprehensive Income.
(h) Segment information
For management purposes, the Company is organised into one business unit, and hence no separate
segment information has been presented.
(i) Shares
The Shares are initially recognised on the date of issue at the net of issue proceeds and share issue costs.
The carrying value of the shares is subsequently re-measured as equal and opposite to the other net assets
of the Company.
Net gain on purchase of own shares is presented on the Statement of Comprehensive Income. The net
gain/(loss) of purchased Shares by the Company derives from the difference between the NAV and the
purchase cost at purchase date.
During 2015, a continuation vote was triggered and consequently all the shares have been classified as
current liabilities.
Page 61 v. 2.7
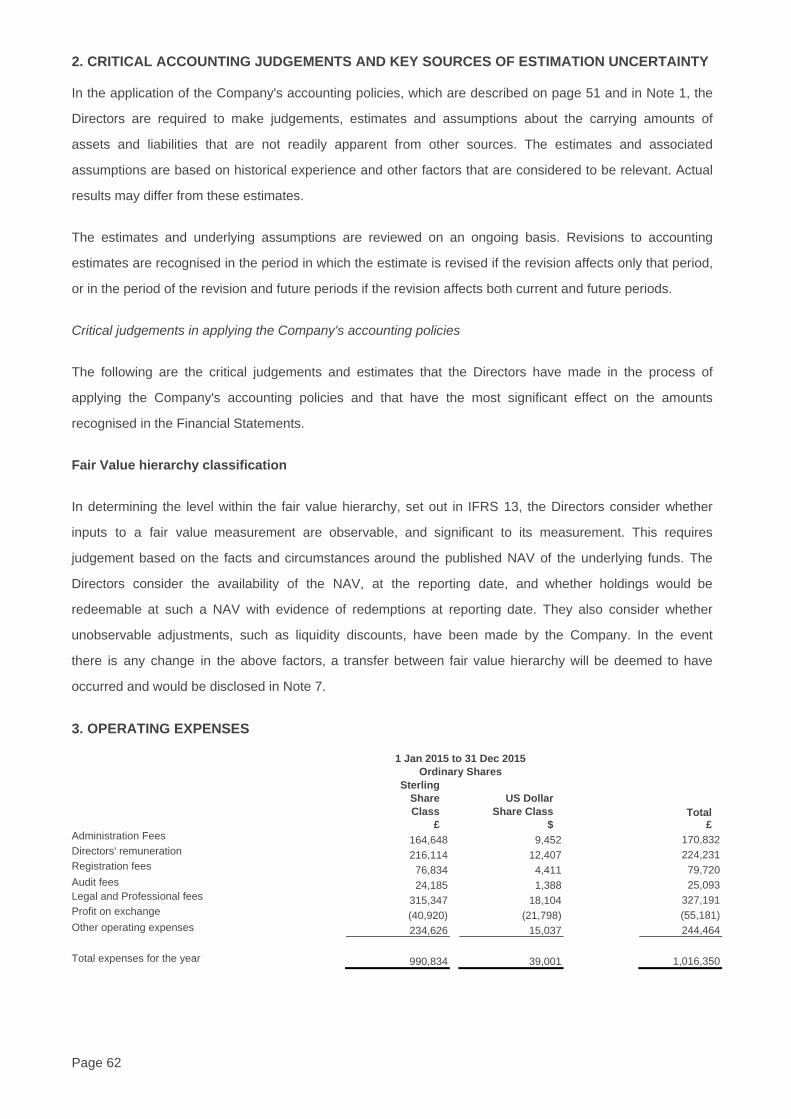
2. CRITICAL ACCOUNTING JUDGEMENTS AND KEY SOURCES OF ESTIMATION UNCERTAINTY
In the application of the Company's accounting policies, which are described on page 51 and in Note 1, the
Directors are required to make judgements, estimates and assumptions about the carrying amounts of
assets and liabilities that are not readily apparent from other sources. The estimates and associated
assumptions are based on historical experience and other factors that are considered to be relevant. Actual
results may differ from these estimates.
The estimates and underlying assumptions are reviewed on an ongoing basis. Revisions to accounting
estimates are recognised in the period in which the estimate is revised if the revision affects only that period,
or in the period of the revision and future periods if the revision affects both current and future periods.
Critical judgements in applying the Company's accounting policies
The following are the critical judgements and estimates that the Directors have made in the process of
applying the Company's accounting policies and that have the most significant effect on the amounts
recognised in the Financial Statements.
Fair Value hierarchy classification
In determining the level within the fair value hierarchy, set out in IFRS 13, the Directors consider whether
inputs to a fair value measurement are observable, and significant to its measurement. This requires
judgement based on the facts and circumstances around the published NAV of the underlying funds. The
Directors consider the availability of the NAV, at the reporting date, and whether holdings would be
redeemable at such a NAV with evidence of redemptions at reporting date. They also consider whether
unobservable adjustments, such as liquidity discounts, have been made by the Company. In the event
there is any change in the above factors, a transfer between fair value hierarchy will be deemed to have
occurred and would be disclosed in Note 7.
3. OPERATING EXPENSES
1 Jan 2015 to 31 Dec 2015 Ordinary Shares
Sterling Share Class
£
US Dollar
Share Class $
Total £
Administration Fees 164,648 9,452 170,832 Directors' remuneration 216,114 12,407 224,231 Registration fees 76,834 4,411 79,720 Audit fees 24,185 1,388 25,093 Legal and Professional fees 315,347 18,104 327,191 Profit on exchange (40,920) (21,798) (55,181) Other operating expenses 234,626 15,037 244,464 Total expenses for the year 990,834 39,001 1,016,350
Page 62 v. 2.7

1 Jan 2014 to 31 Dec 2014 Ordinary Shares
Sterling Share Class
£
Euro
Share Class
€
US Dollar Share Class
$
Total £
Administration Fees 173,880 2,237 16,916 185,950 Directors' remuneration 182,148 2,341 17,704 194,780 Registration fees 84,959 1,093 8,265 90,856 Audit fees 24,032 309 2,338 25,700 Legal and Professional fees 70,267 41,460 6,836 107,824 Profit on exchange (68,144) 2,482 2,153 (64,837) Other operating expenses 252,690 2,666 24,252 269,558 Total expenses for the year 719,832 52,588 78,464 809,831
4. DIRECTORS' REMUNERATION
1 Jan 2015 to 31 Dec 2015
£
1 Jan 2014 to 31
Dec 2014 £
Richard Crowder, Chairman 60,000 60,000
Steve Le Page, Chairman Audit Committee (appointed 3.6.14) 50,000 28,846
Jonathan Hooley, Chairman Audit Committee (resigned 25.4.14) - 15,934
Paul Meader, Senior Independent Director 48,000 48,000
John Le Prevost (resigned 27.4.16) 42,000 42,000
Sarita Keen (appointed 3.6.15) 24,231 -
Andrew Dodd (resigned 3.2.16) Waived Waived 224,231 194,780
The agreed annual directors fees are Richard Crowder £60,000 (2014: £60,000), Steve Le Page £50,000
(2014: £50,000), Jonathan Hooley £nil (2014: £50,000), Paul Meader £48,000 (2014: £48,000), John Le
Prevost £42,000 (2014: £42,000) and Sarita Keen £42,000 (2014: £nil). Where applicable, pro rata fees have
been paid on resignation and from appointment date.
During the year, Paul Meader undertook additional duties involving a liaison with the Company's principal
individual shareholders. Mr Meader received an additional fee of £35,783 (31 December 2014: £17,680) for
these duties which is included within Legal and Professional fees.
5. EARNINGS PER SHARE
1 Jan 2015 to 31 Dec 2015 Ordinary Shares
Sterling
Share Class
US Dollar
Share Class
The net gain for the year £22,449,712 $2,038,238 The weighted average number of shares in issue during the year 389,791,806 30,540,760 Pence (£) Cents ($) Earnings per share 5.75 6.67
Page 63 v. 2.7

1 Jan 2014 to 31 Dec 2014 Ordinary Shares
Sterling Share Class
£
Euro Share Class
€
US Dollar
Share Class $
The net gain for the year £51,958,882 €743,124 $4,648,568 The weighted average number of shares in issue during the year 410,011,172 6,175,984 40,496,798 Pence (£) Cent(€) Cents ($) Earnings per share 12.67 12.03 11.47
6. RELATED PARTY TRANSACTIONS
Transactions with related parties are made on terms equivalent to those that prevail in an arm's length
transaction.
Anson Registrars Limited is the Company’s registrar, transfer agent and paying agent. John R Le Prevost is
a Director and controller of Anson Registrars Limited. £79,720 (2014: £90,856) of costs were incurred by the
Company with this related party in the year, of which £7,862 (2014: £8,398) was payable at 31 December
2015.
JTC (Guernsey) Limited is the Company’s administrator and secretary. £170,832 (2014: £185,950) of costs
were incurred by the Company with this related party in the year, of which £14,868 (2014: £17,000) was
payable at 31 December 2015.
John R Le Prevost is a Director and controller of Anson Custody Limited. Until November 2014, Anson
Custody Limited acted as nominee for a proportion of the GBP shares (265,000 shares). JTC (Guernsey)
Limited acted as nominee for these shares from this date.
7. INVESTMENTS DESIGNATED AT FAIR VALUE THROUGH PROFIT OR LOSS
As at 31 December 2015 Ordinary Shares
Sterling Share Class
£
Euro Share Class
€
US Dollar Share Class
$ Total
£
UNQUOTED FINANCIAL ASSETS
Portfolio cost carried forward 537,715,020 - 37,197,008 562,966,713
Unrealised appreciation on valuation carried forward 176,086,387 - 5,579,621 179,874,189
Valuation carried forward 713,801,407 - 42,776,629 742,840,902
Realised gains on sales and conversions 21,849,734 - 4,647,459 25,004,725
Decrease in unrealised appreciation (1,170,178) - (2,841,115) (2,788,254)
Net gains on financial assets at fair value through profit or loss 20,679,556 - 1,806,344 22,216,471
As at 31 December 2014 Ordinary Shares
Sterling Share Euro Share US Dollar Share Total
Page 64 v. 2.7

Class £
Class €
Class $
£
UNQUOTED FINANCIAL ASSETS
Portfolio cost carried forward 548,101,763 - 66,635,029 590,879,595
Unrealised appreciation on valuation carried forward 177,256,565 - 8,420,736 182,662,443
Valuation carried forward 725,358,328 - 75,055,765 773,542,038
Realised gains on sales and conversions 21,481,220 2,574,395 774,632 23,977,887
(Increase)/Decrease in unrealised appreciation 27,969,549 (1,780,001) 3,685,755 29,037,338
Net gains on financial assets at fair value through profit or loss 49,450,769 794,394 4,460,387 53,015,225
As at 31 December 2015 Ordinary Shares
Sterling Share Class
£
Euro Share Class
€
US Dollar Share Class
$ Total
£
QUOTED FINANCIAL ASSETS
Portfolio cost carried forward 47,758,312 - - 47,758,312
Unrealised appreciation on valuation carried forward 83,330 - - 83,330
Valuation carried forward 47,841,642 - - 47,841,642
Realised gains on sales and conversions 18,950 - - 18,950
Increase in unrealised appreciation 77,337 - - 77,337
Net gains on financial assets at fair value through profit or loss 96,287 - - 96,287
As at 31 December 2014 Ordinary Shares
Sterling Share Class
£
Euro Share Class
€
US Dollar Share Class
$ Total
£
QUOTED FINANCIAL ASSETS
Portfolio cost carried forward 1,170,881 - - 1,170,881
Unrealised appreciation on valuation carried forward 5,993 - - 5,993
Valuation carried forward 1,176,874 - - 1,176,874
Realised gains on sales and conversions - - - -
Increase in unrealised appreciation 2,387 - - 2,387
- - Net gains on financial assets at fair value through profit or loss 2,387 - - 2,387
IFRS 13 requires fair value to be disclosed by the source of inputs, using a three-level hierarchy:
● Quoted prices (unadjusted) in active markets for identical assets or liabilities (Level 1);
● Inputs other than quoted prices included in Level 1 that are observable for the asset or liability, either
Page 65 v. 2.7

directly (as prices) or indirectly (derived from prices) (Level 2); and
● Inputs for the asset or liability that are not based on observable market data (unobservable inputs)
(Level 3).
The fair value of the unquoted investments held by the Company are based on the published NAV of the
underlying investments in AllBlue Limited and AllBlue Leveraged Feeder Limited. Following the
announcement from BlueCrest on 1 December 2015 that AllBlue Limited and AllBlue Leveraged Fund
Limited were closed to redemptions, the unquoted financial assets transferred from level 2 to level 3, on the
basis that the NAV is no longer observable due to the return of capital programme (see Note 16). In the prior
year the significant input to the fair value was observable and no significant unobservable adjustments were
made to the valuations and so the Company categorised all the unquoted investments as Level 2. The
quoted investments held by the Company, the ICS Funds, are in an active market with a directly observable
price. The Company therefore classifies the investment as Level 1 in accordance with the fair value
hierarchy.
Details of the value of the classifications are listed in the table below. Values are based on the fair value of
the investments as at the reporting date:
Fair Value as at 31 Dec 2015
GBP Fair Value as at
31 Dec 2014 GBP
Level 1 47,841,642 1,176,874
Level 2 - 773,542,038
Level 3 742,840,902 -
Level 3 reconciliation
The following table shows a reconciliation of all movements in the fair value of investments categorised
within Level 3 between the beginning and the end of the reporting period:
2015 GBP 2014
GBP Balance at beginning of year - -
Transfer from Level 2 742,840,902 -
Balance at end of year 742,840,902 -
Page 66 v. 2.7

8. STATED CAPITAL
Authorised Share Capital An unlimited number of Unclassified shares of no par value each. Ordinary Shares
Issued Sterling Share Class
Euro Share Class
US Dollar Share Class
Total
Number of shares in issue at 1 January 2014 431,526,962 8,772,064 38,596,617 478,895,643
Conversions (476,592) (1,521,979) 2,899,179 900,608
Purchase of own shares (34,545,984) - (3,265,850) (37,811,834)
Redemption 30 September 2014 - (7,250,085) - (7,250,085)
Number of shares in issue at 31 December 2014 396,504,386 - 38,229,946 434,734,332
Conversions 8,324,658 - (13,337,017) (5,012,359)
Purchase of own shares (23,263,000) - (2,700,000) (25,963,000)
Number of shares in issue at 31 December 2015 381,566,044 - 22,192,929 403,758,973
As explained in Note 1(i) above the share classes have been recognised as liabilities.
In the event of a return of capital on a winding-up or otherwise, the holders of Shares are entitled to
participate in the distribution of capital after paying all the debts and satisfying all the liabilities attributable to
the relevant Share class.
The holders of Shares of the relevant Share class shall be entitled to receive by way of capital any surplus
assets of the Share class in proportion to their holdings. In the event that the Share class has insufficient
funds or assets to meet all the debt and liabilities attributable to that Share class, any such shortfall shall be
paid out of funds or assets attributable to the other Share classes in proportion to the respective net assets
of the relevant Share classes as at the date of winding-up.
Pursuant to Section 276 of the Law, a share in the Company confers on the shareholder the right to vote on
resolutions of the Company, the right to an equal share in dividends authorised by the Board of Directors,
and the right to an equal share in the distribution of the surplus assets of the Company.
9. DISCOUNT MANAGEMENT PROVISION
On 24 February 2016, the Company's Articles were amended by special resolution to remove the previous
discount management provision, and to insert the following provision:
The Directors shall at the Annual General Meeting of the Company to be held in 2021 propose an Ordinary
Resolution that the Company continues its business as a closed-ended collective investment scheme (a
“Continuation Resolution”). If a Continuation Resolution is passed at such Annual General Meeting then the
Directors shall be required to propose a further Continuation Resolution at every fifth Annual General
Meeting thereafter.
Page 67 v. 2.7

If a Continuation Resolution is not passed, then the Directors shall, within six months of such Continuation
Resolution not being passed, put proposals to Shareholders for the reconstruction, reorganisation or winding
up of the Company.
Until 24 February 2016 the Company’s Articles incorporated a discount management provision (which
applied to each class of Ordinary Shares individually), requiring a continuation vote to be proposed in respect
of the particular class of Ordinary Shares at a class meeting of the relevant shareholders (by way of ordinary
resolution) if, over the previous 12 month rolling period commencing from 1 January 2008, the relevant class
of Ordinary Shares has traded, on average (calculated by averaging the closing mid-market share price on
the dates which are 5 Business Days after the date on which each estimated Published NAV announcement
is made for each NAV Calculation date over the period) at a discount in excess of 5 per cent to the average
NAV per Ordinary Share of that class (calculated by averaging the NAV per Ordinary Share of that class as
at the NAV Calculation Date at the end of each month during the period).
In the event that a vote to continue was proposed and passed for any class of Ordinary Shares as a result of
the operation of such mechanism, no further continuation vote was capable of being proposed for that class
for a further 12 months from the date of the passing of the continuation resolution.
If such continuation vote was not passed, the Directors were to be required to formulate redemption
proposals to be put to the Shareholders of that class offering to redeem their Ordinary Shares at the relevant
published NAV on the NAV Calculation Date immediately preceding such redemption (less the costs of all
such redemptions). However, where one or more such resolutions in respect of the same period is/are not
passed and the class(es) of Ordinary Shares involved represent 75 per cent., or more of the Company’s net
assets attributable to all Ordinary Shares at the last NAV Calculation Date on or immediately preceding the
date of the latest continuation resolution being defeated, the Directors may first (at their discretion) put
forward alternative proposals to all Shareholders to offer to repurchase their shares or to reorganise,
reconstruct or wind up the Company. If, however, such alternative proposals are not passed by the
necessary majority of shareholders of the relevant class, the Directors must proceed to offer to redeem the
relevant class(es) of Ordinary Shares on the terms described above.
Where following redemption of any class of Ordinary Shares under the discount management provision in
place prior to 24 February 2016, the number of Ordinary Shares of that class remaining in issue represent
less than 25 per cent., of the Ordinary Shares of that class in issue immediately before such redemption or
the listing for such class of Ordinary Shares on the Official List is withdrawn or threatened to be withdrawn or
the Directors determine that the conditions for the continued listing of that class are not (or they believe will
not be) met, then the Company may redeem the remaining issued Ordinary Shares of that class within three
months of such determination at a redemption price equal to the NAV of the Ordinary Shares of that class on
the NAV Calculation Date selected by the Directors for such purpose (less the costs of such redemption).
Page 68 v. 2.7

On 30 October 2015, the Company’s rolling 12 month discount floor provision was triggered for the Sterling
class of the Company’s shares by reference to the final NAV as at 30 October 2015. In accordance with the
Company’s articles of association, a continuation vote was proposed for this class by way of ordinary
resolution. As a result, the unquoted financial assets are disclosed as current rather than non current assets.
10. TREASURY SHARES
The Capital and Reserves disclosure below is intended to highlight the legal nature, under applicable
Company Law, of the amounts attributable to shareholders and also the existence and effect of the Treasury
shares held by the Company. This is supplemental disclosure and not required under IFRS.
Ordinary Shares
As at 31 December 2015 Notes Sterling
Share Class £
Euro Share Class
€
US Dollar Share Class
$ Total
£
Stated capital 8 - - - -
Treasury shares (79,026,334) - (4,114,619) (81,317,613)
Reserves 11 845,957,145 - 46,578,369 877,071,141
766,930,811 - 42,463,750 795,753,528
Ordinary Shares
As at 31 December 2014 Notes Sterling
Share Class £
Euro Share Class
€
US Dollar Share Class
$ Total
£
Stated capital 8 - - - -
Treasury shares (86,173,604) - (6,021,297) (89,759,256)
Reserves 11 860,280,204 - 77,224,467 909,576,307
774,106,600 - 71,203,170 819,817,051
Ordinary Shares
TREASURY SHARES As at 31 December 2015
Sterling Share Class
£
Euro Share Class
€
US Dollar Share Class
$ Total
£
Balance as at 1 January 2015 86,173,604 - 6,021,297 89,759,256
Acquired during year 46,443,652 - 5,107,925 49,911,237
Cancelled during the period (53,590,922) - (7,014,603) (58,352,880)
79,026,334 - 4,114,619 81,317,613
Ordinary Shares
As at 31 December 2014
Sterling Share Class
£
Euro Share Class
€
US Dollar Share Class
$ Total
£
Balance as at 1 January 2014 82,314,408 - 7,364,937 86,762,640
Acquired during year 64,951,079 - 6,021,297 68,816,584
Cancelled during the period (61,091,884) - (7,364,937) (65,819,968)
86,173,604 - 6,021,297 89,759,256
The treasury shares reserve represents 40,326,746 (2014: 43,911,473) Sterling Shares and 2,156,861
(2014: 3,265,845) Dollar Shares purchased in the market at various prices per share ranging from £1.86 to
Page 69 v. 2.7

£1.9199 (2014: £1.752 to £1.8648) for Sterling Shares and $1.775 to $1.8125 (2014: $1.7525 to $1.775) for
Dollar shares, and held by the Company in treasury.
Cancellation of 26,847,727 (2014: 36,910,863) Sterling Shares and 3,808,984 (2014: 4,310,945) Dollar
Shares took place during the year. Following the EGM held on 24 February 2016, all remaining treasury
shares in the Company were cancelled.
During the year, the Company bought back 23,263,000 (2014: 34,545,984) Sterling shares with an average
price of £1.8861 (2014:£1.8084) pence and discount of 5.62% (2014: 4.62%) to NAV.
During the year, the Company bought back 2,700,000 (2014: 3,265,850) Dollar Shares with an average price
of $1.7948 (2014:$1.7638) pence and discount of 5.32% (2014: 4.15%) to NAV.
11. RESERVES
31 Dec 2015 Ordinary Shares
Sterling
Share Class £
Euro Share Class
€
US Dollar Share Class
$ Total
£
Balance as at 1 January 2015 860,280,204 - 77,224,467 909,576,307 Increase in net assets attributable to shareholders after other comprehensive income 22,449,712 - 2,038,238 25,847,714 Adjustment to allocation of reserves brought forward 338,972 - (417,356) -
Accretive gain transfer between share classes (206,348) - 215,756 -
Treasury shares cancelled during the period (53,590,922) - (7,014,603) (58,352,880) Share conversions 16,685,526 - (25,468,133) -
- -
Balance as at 31 December 2015 845,957,145 - 46,578,369 877,071,141
31 Dec 2014 Ordinary Shares
Sterling
Share Class £
Euro Share Class
€
US Dollar Share Class
$ Total
£
Balance as at 1 January 2014 870,307,904 15,454,948 74,776,376 928,315,440 Increase in net assets attributable to shareholders after other comprehensive income 51,958,882 743,124 4,648,568 57,540,468 Adjustment to allocation of reserves brought forward (1,074,285) (26,043) 1,750,064 -
Accretive gain transfer between share classes (256,363) 86,971 291,403 -
Redemption of share class - (13,467,825) - (10,459,634)
Treasury shares cancelled during the period (61,091,884) - (7,364,937) (65,819,968)
Share conversions 435,949 (2,791,175) 3,122,992 -
Balance as at 31 December 2014 860,280,204 - 77,224,467 909,576,307
12. FINANCIAL INSTRUMENTS
The Company’s main financial instruments at the year end, and the prior year end comprise:
(a) Cash and cash equivalents that arise directly from the Company’s operations;
Page 70 v. 2.7

(b) Shares held in AllBlue and AllBlue Leveraged; and
(c) Shares held in ICS.
13. FINANCIAL RISK MANAGEMENT OBJECTIVES AND POLICIES
The main risks in 2015 which arose from the Company’s financial instruments concerned its holding of
shares in AllBlue and AllBlue Leveraged. The risks attached to those shares were market price risk, credit
risk, liquidity risk and interest rate risk and also increased volatility due to leverage employed by the funds
underlying AllBlue as explained below.
As at the year end the Company was not exposed directly to material foreign exchange risk as each class of
shares in the Company was directly invested in shares of AllBlue, AllBlue Leveraged and ICS denominated
in the same corresponding currency. This is still the case as the Sterling share class is now invested into the
Sterling share class of Highbridge.
So far as the Company is concerned the only risk over which the Board was and is able to exercise direct
control is the liquidity risk attaching to its ability to realise shares in AllBlue, AllBlue Leveraged, ICS and now
Highbridge for the purpose of meeting share buy backs and ongoing expenses of the Company. For this
purpose the Board created a Cash Reserve to provide funds to enable the Company to settle share buy
backs and meet its expenses in the ordinary course of the business. Since the change of investment policy
and the appointment of Highbridge as Investment Manager, the Company has not held any Cash reserve,
relying instead on cash proceeds due on its creditor interests and the possibility of redeeming from HMSF to
enable it to meet its liabilities as they fall due.
Thereafter indirectly the Board recognises that the Company had via its holding of shares in AllBlue, AllBlue
Leveraged and ICS and has now, via its holding of shares in HMSF, an indirect exposure to the risks
summarised below.
For the shares held in ICS the Board notes that such shares may be realised on short notice on any
business day. The proceeds in respect of thereof usually being transmitted by telegraphic transfer on the
business day following receipt of the redemption notice by the ICS fund, subject to cut-off times depending
on the specific ICS fund in which shares are being redeemed.
It must also be noted that there was little or nothing which the Board could do to manage each of the other
risks within AllBlue, AllBlue Leveraged or the funds underlying AllBlue in which AllBlue and AllBlue
Leveraged invested under the investment objective of the Company prior to 25 February 2016. The same is
now true in respect of the risks within HMSF under the current investment objective of the Company.
Page 71 v. 2.7

(a) Price Risk
The success of the Company's activities will be affected by general economic and market conditions, such
as interest rates, availability of credit, inflation rates, economic uncertainty, changes in laws, trade barriers,
currency exchange controls and national and international political circumstances. These factors may affect
the level and volatility of securities’ prices and the liquidity of the underlying funds’ investments. Volatility or
illiquidity could impair the profitability of, or result in losses in, the underlying funds’ investments.
Details of the Company’s Investment Objective and Policy are given on page 8.
Price sensitivity The Company invested substantially all its assets in AllBlue, AllBlue Leveraged and ICS and now invests in
HMSF (hereafter referred to collectively as “Investees” and individually as an “Investee” of the Company”). It
does not undertake any structural borrowing or hedging activity at the Company level. Its performance was
therefore directly linked to the NAV of the Investees of the Company, which themselves are driven by the
prices of a large number of positions in listed and unlisted securities.
At 31 December 2015, if the NAV of AllBlue, AllBlue Leveraged and ICS had been 10% higher/lower with all
the other variables held constant, the net assets attributable to Shareholders for the year would have
increased/decreased by £76,164,305 (2014: £72,653,520) for the Sterling Class and $4,277,663 (2014:
7,505,576) for the Dollar Class. This change arises due to the increase/ decrease in the fair value of financial
assets at fair value through profit or loss.
(b) Credit Risk
The nature of commercial arrangements made in the normal course of business between many prime
brokers and custodians means that in the case of any one prime broker or custodian defaulting on its
obligations to an Investee of the Company, the effects of such a default may have negative effects on other
prime brokers with whom other Investees of the Company deal. The investments underlying the Company
may, therefore, be exposed to systemic risk when Investees deal with prime brokers and custodians whose
creditworthiness may be interlinked.
The assets underlying Investees may be pledged as margin with prime brokers or other counterparties or
held with prime brokers or banks. In the event of the default of any of these prime brokers, banks or
counterparties, Investees, and therefore the Company, may not receive back all or any of the assets pledged
or held with the defaulting party.
Therefore the maximum credit risk to which the Company was exposed at the year end was £796,042,391
(2014: £819,916,844), that is the total assets.
The main concentration of risk for the Company related to its investments in AllBlue and AllBlue Leveraged,
although this was mitigated by the diversification offered by their investments into the funds underlying
Page 72 v. 2.7

AllBlue. The main concentration risk now arises form the Company’s investment into HMSF which is itself
also diversified through its holdings of many underlying investments.
(c) Liquidity Risk
In some circumstances, investments held by the Investees may be relatively illiquid making it difficult to
acquire or dispose of them at the prices quoted for them on the various exchanges. Accordingly, an
Investee’s ability to respond to market movements may be impaired and, consequently, the Investee may
experience adverse price movements upon liquidation of its investments which may in turn affect the value of
the Company’s investment. Settlement of transactions may be subject to delay and administrative formalities.
There can be no assurance that the liquidity of the Company’s investments will always be sufficient to meet
redemption requests as, and when, made. Any such lack of liquidity may affect the ability of the Company to
realise its shares in its investments and the value of Shares in the Company. For such reasons the treatment
by the managers of the Company’s investments of redemption requests may be deferred in exceptional
circumstances including if a lack of liquidity may result in difficulties in determining their NAV and their NAV
per share. This in turn would limit the ability of the Directors to realise the Company’s investments should
they consider it appropriate to do so and may result in difficulties in determining the NAV of a Share in the
Company.
The market prices, if any, for such illiquid investments tend to be volatile and may not be readily
ascertainable and the relevant underlying fund may not be able to sell them when it desires to do so or to
realise what it perceives to be their fair value in the event of a sale. The size of the positions of the funds
underlying AllBlue an Investee may magnify the effect of a decrease in market liquidity for such instruments.
Changes in overall market leverage, deleveraging as a consequence of a decision by the counterparties with
which the Investees enter into repurchase/reverse repurchase agreements or derivative transactions, to
reduce the level of leveraging, or the liquidation by other market participants of the same or similar positions,
may also adversely affect the portfolios of the Investees.
The sale of restricted and illiquid securities often requires more time and results in higher brokerage charges
or dealer discounts and other selling expenses than does the sale of securities eligible for trading on national
securities exchanges or in the over-the-counter markets.
The Investees and the Underlying Fund may not be able readily to dispose of such illiquid investments and,
in some cases, may be contractually prohibited from disposing of such investments for a specified period of
time. Restricted securities may sell at a price lower than similar securities that are not subject to restrictions
on resale. Shareholders should note that the Company is currently awaiting redemption proceeds from
AllBlue and AllBlue Leveraged. Further information is provided in Note 16 to the Financial Statements.
1-3 Months £
Payable if a shareholder
Total £
Page 73 v. 2.7
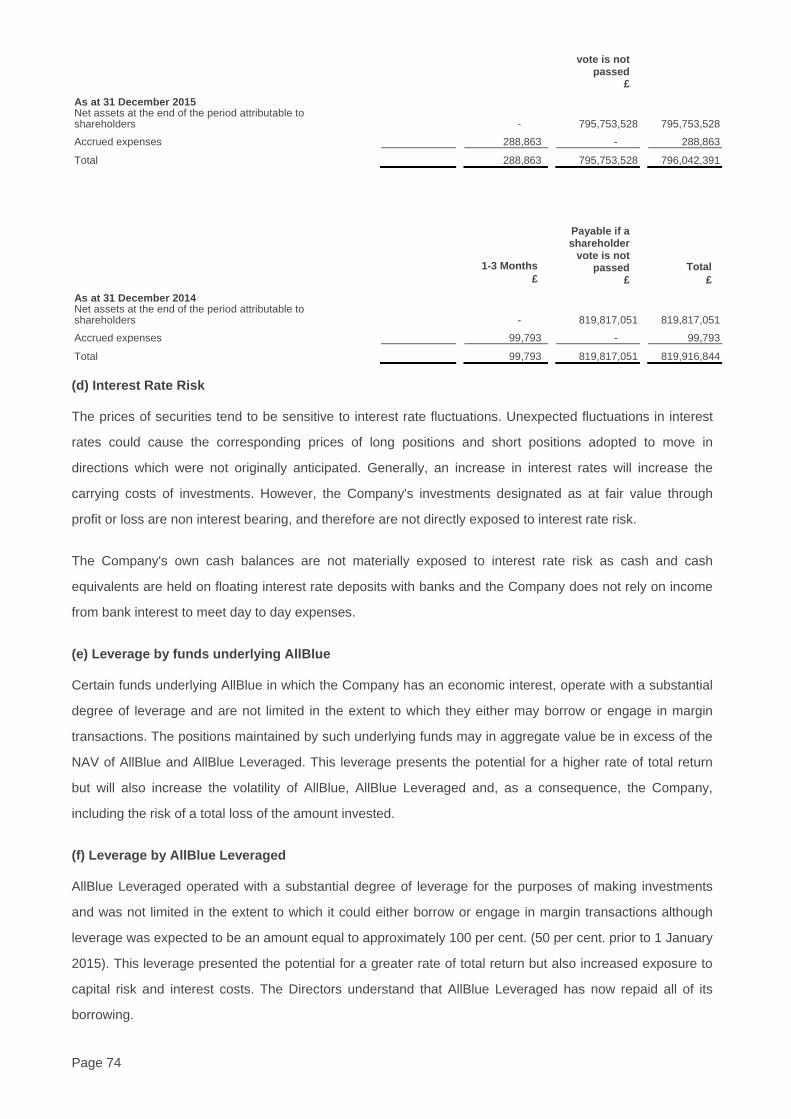
vote is not passed
£ As at 31 December 2015 Net assets at the end of the period attributable to shareholders - 795,753,528 795,753,528
Accrued expenses 288,863 - 288,863
Total 288,863 795,753,528 796,042,391
1-3 Months
£
Payable if a shareholder
vote is not passed
£ Total
£ As at 31 December 2014 Net assets at the end of the period attributable to shareholders - 819,817,051 819,817,051
Accrued expenses 99,793 - 99,793
Total 99,793 819,817,051 819,916,844
(d) Interest Rate Risk
The prices of securities tend to be sensitive to interest rate fluctuations. Unexpected fluctuations in interest
rates could cause the corresponding prices of long positions and short positions adopted to move in
directions which were not originally anticipated. Generally, an increase in interest rates will increase the
carrying costs of investments. However, the Company's investments designated as at fair value through
profit or loss are non interest bearing, and therefore are not directly exposed to interest rate risk.
The Company's own cash balances are not materially exposed to interest rate risk as cash and cash
equivalents are held on floating interest rate deposits with banks and the Company does not rely on income
from bank interest to meet day to day expenses.
(e) Leverage by funds underlying AllBlue
Certain funds underlying AllBlue in which the Company has an economic interest, operate with a substantial
degree of leverage and are not limited in the extent to which they either may borrow or engage in margin
transactions. The positions maintained by such underlying funds may in aggregate value be in excess of the
NAV of AllBlue and AllBlue Leveraged. This leverage presents the potential for a higher rate of total return
but will also increase the volatility of AllBlue, AllBlue Leveraged and, as a consequence, the Company,
including the risk of a total loss of the amount invested.
(f) Leverage by AllBlue Leveraged
AllBlue Leveraged operated with a substantial degree of leverage for the purposes of making investments
and was not limited in the extent to which it could either borrow or engage in margin transactions although
leverage was expected to be an amount equal to approximately 100 per cent. (50 per cent. prior to 1 January
2015). This leverage presented the potential for a greater rate of total return but also increased exposure to
capital risk and interest costs. The Directors understand that AllBlue Leveraged has now repaid all of its
borrowing.
Page 74 v. 2.7

(g) Capital Management
The investment objective of the Company prior to 25 February 2016 was to provide Shareholders with
consistent long-term capital growth through an investment policy of investing substantially all of its assets in
AllBlue or any successor vehicle to AllBlue. Since 25 February it is to seek to provide consistent returns with
low volatility through an investment policy of investing substantially all of its assets in Highbridge Multi-
Strategy fund (“the Underlying Fund”) or any successor vehicle of the Underlying Fund. The Company does
not intend to pay any distributions to shareholders.
As the Company’s Ordinary Shares are of no par value, distributions are not paid and Guernsey Company
law does not require the maintenance of a Share premium account, the Directors regard the otherwise
distributable reserves of the Company to be its capital for the purposes of this disclosure. Capital for the
reporting year under review is summarised in Note 866 to these financial statements.
At the last Annual General Meeting held pursuant to section 199 of the 2008 Law, the Directors were granted
authority to buy back up to 14.99 per cent. of the Ordinary Shares in issue. The Company's authority to make
purchases of its own issued Ordinary Shares will expire at the conclusion of the next general meeting of the
Company to be held pursuant to section 199 of the 2008 Law and renewal of such authority will be sought at
the next general meeting. The timing of any purchases will be decided by the Board.
The Directors intend that purchases will only be made pursuant to this authority through the market, for cash,
at prices below the prevailing NAV per Share where the Directors reasonably believe such purchases will be
of material benefit to the Company.
The Company’s authorised Share capital is such that further issues of new Ordinary Shares could be made,
subject to waiver of pre-emption rights. Subject to prevailing market conditions, the Board may decide to
make one or more further such issues or reissues of Ordinary Shares for cash from time to time. Any further
issues of new Ordinary Shares or reissues of Ordinary Shares held in treasury will rank pari passu with
Ordinary Shares in issue.
There are no provisions of the Law which confer rights of pre-emption in respect of the allotment of Shares
but there are pre-emption rights contained in the Articles. The Directors have, however, been granted the
power to issue 48 million further Shares on a non pre-emptive basis for a period concluding on 31 December
2016, by a special resolution of Shareholders passed on 30 July 2015, unless such power is previously
revoked by the Company's Shareholders in a general meeting pursuant to section 199 of the Law. The
Directors intend to request that the authority to allot Shares on a non-pre-emptive basis is renewed at each
general meeting of the Company.
Unless authorised by Shareholders, the Company will not issue further Ordinary Shares or reissue Ordinary
Shares out of treasury for cash at a price below the prevailing NAV per Share unless they are first offered
pro rata to existing shareholders.
Page 75 v. 2.7

14. CHANGES IN ACCOUNTING POLICIES AND DISCLOSURES
The following Standards or Interpretations have been adopted in the current year. Their adoption has not had
any impact on the amounts reported in these Financial Statements.
IFRS 13 Fair value measurement - Amendments from Annual improvements cycle effective for annual
periods beginning on or after 1 July 2014.
The following Standards or Interpretations that are expected to be applicable to the Company have been
issued but not yet adopted. Other Standards or Interpretations issued by the IASB or IFRIC are not expected
to be applicable to the Company. The Board have reviewed the impact of the standards below on the
Company and they do not expect there to be any changes to the measurement of items in the Financial
Statements but recognise additional disclosure may be required.
IFRS 7 Financial Instruments: Disclosures - Deferral of mandatory effective date of IFRS 9 and amendments
relating to additional hedge accounting disclosures (and consequential amendments). Applies only when
IFRS 9 is adopted, which is effective for annual periods beginning on or after 1 January 2018.
IFRS 7 Financial Instruments: Amendments resulting from September 2014 Annual Improvements to IFRSs,
effective for annual periods beginning on or after 1 January 2016.
IFRS 9 Financial Instruments - Finalised version, incorporating requirements for classification and
measurement, impairment, general hedge accounting and derecognition, effective for accounting periods
commencing on or after 1 January 2018 (EU endorsement is outstanding).
IAS 1 Presentation of Financial Statements - Amendments from the disclosure initiative effective for annual
periods beginning on or after 1 January 2016.
15. NET ASSET VALUE PER SHARE
The NAV per share per the Financial Statements is not equal to the published NAV per share. The published
NAV per share for Sterling share class was £2.0067 and US Dollar share class $1.9103 which represents the
NAV per share attributable to shareholders in accordance with the Prospectus, amended using a discounted
cashflow methodology. The Financial Statements do not allow for this discount and show a NAV per share
for Sterling share class as £2.0099 and US Dollar share class $1.9133.
16. EVENTS AFTER THE REPORTING PERIOD
On 1 December 2015, BlueCrest, the Investment Manager to the BlueCrest suite of funds, and the Board of
Directors of each of the relevant BlueCrest funds (or General Partner, where appropriate) announced that
the BlueCrest funds would embark upon a programme to return the capital managed in these funds to
investors.
Page 76 v. 2.7

The AllBlue suite of funds have been fully redeemed from three of the underlying funds, being BlueCrest
Emerging Markets, BlueTrend 2x and BlueCrest Equity Strategies funds and partially redeemed from four of
the underlying funds, being BlueCrest Capital International, BlueCrest Multi-Strategy Credit, BlueCrest
Mercantile and BlueCrest Quantitative Equity funds. All third party AllBlue investors have redeemed or
withdrawn in full, in respect of the redemption/withdrawal day on 4 January 2016. It was expected that
approximately 75% of redemption proceeds was to be paid to investors before the end of January 2016, with
the remainder as soon as practicable thereafter.
To date (27 April 2016) the Company has received redemption proceeds as follows:
Sterling Share Class
06/01/2016 £ 332,678,288
12/01/2016 £ 2,804,217
28/01/2016 £ 165,354,783
24/02/2016 £ 7,668,573
25/02/2016 £ 31,646,298
29/03/2016 £ 16,434,016
TOTAL: £ 556,586,175 79% returned (estimated*)
US Dollar Share Class
12/01/2016 $ 22,400,077
29/01/2016 $ 9,063,077
25/02/2016 $ 2,118,038
30/03/2016 $ 891,737
TOTAL: $ 34,472,928 79% returned (estimated*) *Estimated as a result of the fact that the final payment values from AllBlue cannot be known with certainty.
All the Company's shareholders were offered the opportunity to redeem up to 100 per cent of their Shares in
the Company as at the Record Date. This Cash Exit Offer closed at 5pm on 22 February 2016. The final
number of Shares to be redeemed pursuant to the Cash Exit Offer was as follows:
Sterling Share Class 254,398,888 (67% of total share class)
US Dollar Share Class 15,655,071 (71% of total share class)
On 24 February 2016 the Company's investment policy was changed to permit investment into the
Underlying Fund. The Company's investment into the Underlying Fund took effect from 1 March 2016. The
Company's name was also changed to Highbridge Multi-Strategy Fund Limited.
On 26 February 2016 6,537,858 US$ Shares remaining following completion of the Cash Exit Offer were
compulsory converted into 4,460,577 Sterling Shares using the net asset value as at 19 February 2016. As a
result of this, the Company’s assets exceeded its liabilities by a considerable margin as a result of the
Company’s issued shares being treated as equity, not current liabilities.
On 1 March 2016 Sterling Share Class investors participating in the cash exit opportunity received £1.54 per
Sterling share totalling £391,774,288.
Page 77 v. 2.7
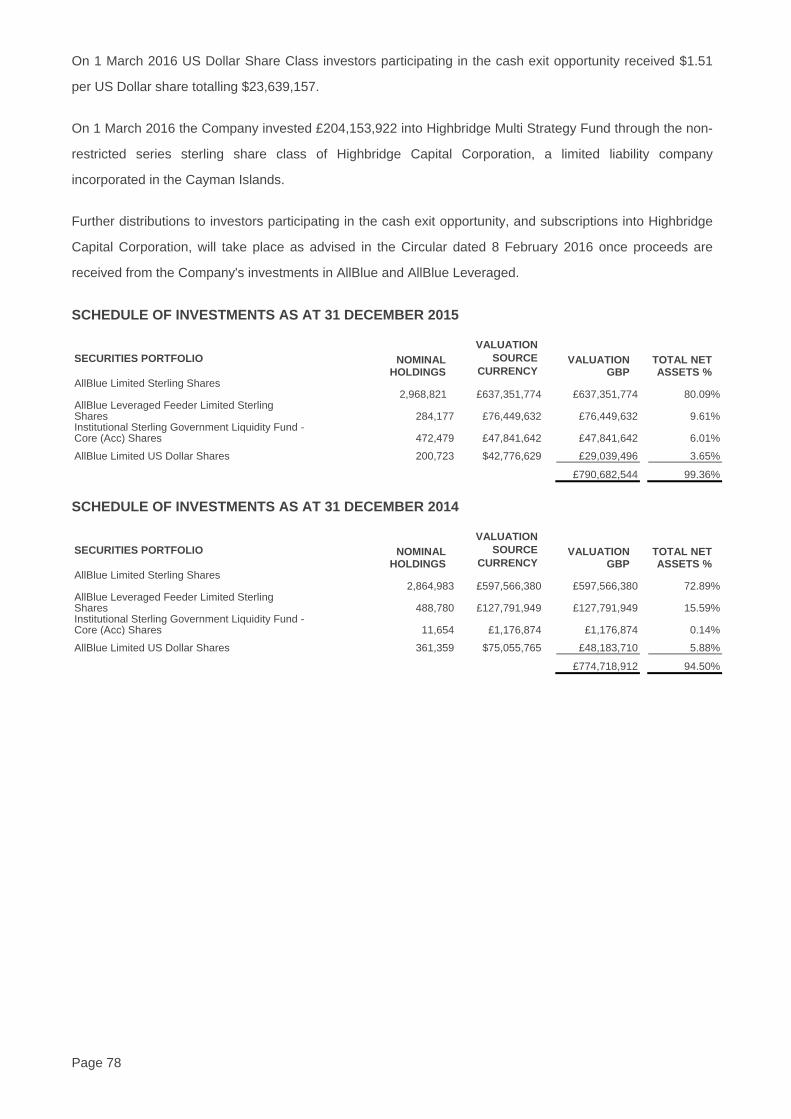
On 1 March 2016 US Dollar Share Class investors participating in the cash exit opportunity received $1.51
per US Dollar share totalling $23,639,157.
On 1 March 2016 the Company invested £204,153,922 into Highbridge Multi Strategy Fund through the non-
restricted series sterling share class of Highbridge Capital Corporation, a limited liability company
incorporated in the Cayman Islands.
Further distributions to investors participating in the cash exit opportunity, and subscriptions into Highbridge
Capital Corporation, will take place as advised in the Circular dated 8 February 2016 once proceeds are
received from the Company's investments in AllBlue and AllBlue Leveraged.
SCHEDULE OF INVESTMENTS AS AT 31 DECEMBER 2015
SECURITIES PORTFOLIO NOMINAL HOLDINGS
VALUATION SOURCE
CURRENCY VALUATION
GBP TOTAL NET ASSETS %
AllBlue Limited Sterling Shares 2,968,821 £637,351,774 £637,351,774 80.09% AllBlue Leveraged Feeder Limited Sterling Shares 284,177 £76,449,632 £76,449,632 9.61% Institutional Sterling Government Liquidity Fund - Core (Acc) Shares 472,479 £47,841,642 £47,841,642 6.01%
AllBlue Limited US Dollar Shares 200,723 $42,776,629 £29,039,496 3.65%
£790,682,544 99.36%
SCHEDULE OF INVESTMENTS AS AT 31 DECEMBER 2014
SECURITIES PORTFOLIO NOMINAL HOLDINGS
VALUATION SOURCE
CURRENCY VALUATION
GBP TOTAL NET ASSETS %
AllBlue Limited Sterling Shares 2,864,983 £597,566,380 £597,566,380 72.89% AllBlue Leveraged Feeder Limited Sterling Shares 488,780 £127,791,949 £127,791,949 15.59% Institutional Sterling Government Liquidity Fund - Core (Acc) Shares 11,654 £1,176,874 £1,176,874 0.14%
AllBlue Limited US Dollar Shares 361,359 $75,055,765 £48,183,710 5.88%
£774,718,912 94.50%
Page 78 v. 2.7

AllBlue Report On the invitation of the Directors of the Company, this commentary has been provided by BlueCrest as investment manager of AllBlue Limited and is provided without any warranty as to its accuracy and without any liability incurred on the part of the Company, BlueCrest or AllBlue Limited. The commentary is not intended to constitute, and should not be construed as, investment advice. Potential investors in the Company should seek their own independent financial advice and may not rely on this communication in evaluating the merits of investing in the Company. The commentary is provided as a source of information for shareholders of the Company but is not attributable to the Company.
INVESTMENT MANAGER REPORT ON ALLBLUE FOR 2015
The Class A US$ shares of AllBlue Limited (“AllBlue”) provided a net return of 2.60% for the year ended
December 31, 2015. The return was delivered with low volatility, which came in at 3.2% for the year based
on monthly returns, and a low correlation to equity markets.
During 2015, five of the seven underlying strategies provided a positive contribution, with the largest
contribution coming from BlueCrest Equity Strategies. In combination, AllBlue retained its record of continual
positive annual returns, and has been positive over every rolling 12 month period since inception.
The first quarter of 2015 saw gains generated by six of the seven strategies, led by BlueCrest Multi Strategy
Credit, and with only BlueCrest Capital International detracting. The second quarter saw a more challenging
environment for systematic strategies, with losses driven by BlueTrend and BlueCrest Quantitative Equity
(BlueCrest Multi Strategy Credit was also modestly negative) offsetting the modest contributions from the
remaining four strategies. BlueTrend led the contributions for the third quarter, by this stage through the
exposure to BlueTrend 2x Leveraged as described below, and only BlueCrest Multi Strategy Credit posted a
slight detraction for the quarter. The final quarter of 2015 saw more modest gains and losses, with the
greatest contribution coming from BlueCrest Equity Strategies and the largest detractor being BlueCrest
Multi Strategy Credit.
The year saw a number of changes within the AllBlue portfolio including:
As of 1 January 2015, Systematica Investments became the investment manager for BlueTrend. Systematica
Investments was spun out of BlueCrest to manage several systematic strategies. This migration was
completed successfully, without any significant impact to the AllBlue portfolio.
As of 1 June, the BlueCrest Mercantile management fee was reduced from 2% per annum to 1.5% per
annum.
As of 1 July, AllBlue changed the vehicle through which it accesses BlueTrend’s trend-following strategy to
BlueTrend 2x Leveraged. This enabled AllBlue to gain similar exposure with greater cash efficiency, enabling
AllBlue to make additional allocations to its other underlying funds.
Page 79 v. 2.7

As of 1 July, AllBlue allocated to a new share class in BlueCrest Capital International, which carried a
1%/25% fee structure compared to 2%/20% in the previous class.
During the year, the allocations to BlueCrest Capital International and BlueCrest Equity Strategies were
increased by approx. 5% and 7% respectively. In the case of BlueCrest Capital International this increase
followed a reduction in the allocation over Q1, and reflected increasing volatility within developed fixed
income markets as investors anticipated the first hike in US interest rates. The increased allocation to
BlueCrest Equity Strategies reflected the committees continued conviction that dispersion within equity
markets would continue to present opportunities for portfolio managers. The allocations that were reduced
over the year were BlueCrest Multi Strategy Credit, BlueCrest Quantitative Equity, BlueTrend and BlueCrest
Mercantile which saw reductions of approximately -5%, -3%, -3% and -1% respectively. It should be noted
that the reduction in allocation to BlueTrend coincided with a switch to access the “twice leveraged” vehicle
as detailed above, so whilst the capital allocation was reduced risk exposure to the strategy marginally
increased. The allocation to Emerging Markets finished the year in line with where it was at the end of the
previous year.
Throughout the course of 2015 AllBlue’s Value at Risk (“VaR”) (Historic Simulation, 95% confidence, 1 day
VaR) averaged 0.21%, slightly lower than the average for 2014, with a low of 0.06% being seen in December
(following the announcement that AllBlue would return capital to its investors) and a high of 0.29% being
observed in July. The underlying funds continued to hold significant levels of unencumbered cash, with the
imputed cash level for AllBlue being around 65% at year-end (having averaged 48% over the course of
2015).
A high level of diversification was seen between the underlying funds, with the average correlation,
measured on weekly data, being 6%. The highest correlation over 2015 was between BlueCrest Equity
Strategies and BlueCrest Quantitative Equity (37%), whilst the lowest correlation was observed between
BlueCrest Capital International and BlueCrest Multi Strategy Credit (-28%).
On 1 December BlueCrest notified investors within AllBlue of the intention to return capital to investors, and
consequently through December several underlying funds began a disinvestment process, with others that
were continuing as going concerns facilitating AllBlue’s exit via redemptions. The progress of the
disinvestment is evident from the reduction in risk (VaR) and increase in unencumbered cash detailed above.
At the end of 2015 AllBlue’s exposure to BlueTrend 2x Leveraged, BlueCrest Emerging Markets and
BlueCrest Equity Strategies ceased. Each of the remaining four underlying funds entered a disinvestment
process, and remaining positions will continue to be unwound in 2016 with proceeds returned to investors in
due course.
ALLBLUE ALLOCATION
Page 80 v. 2.7
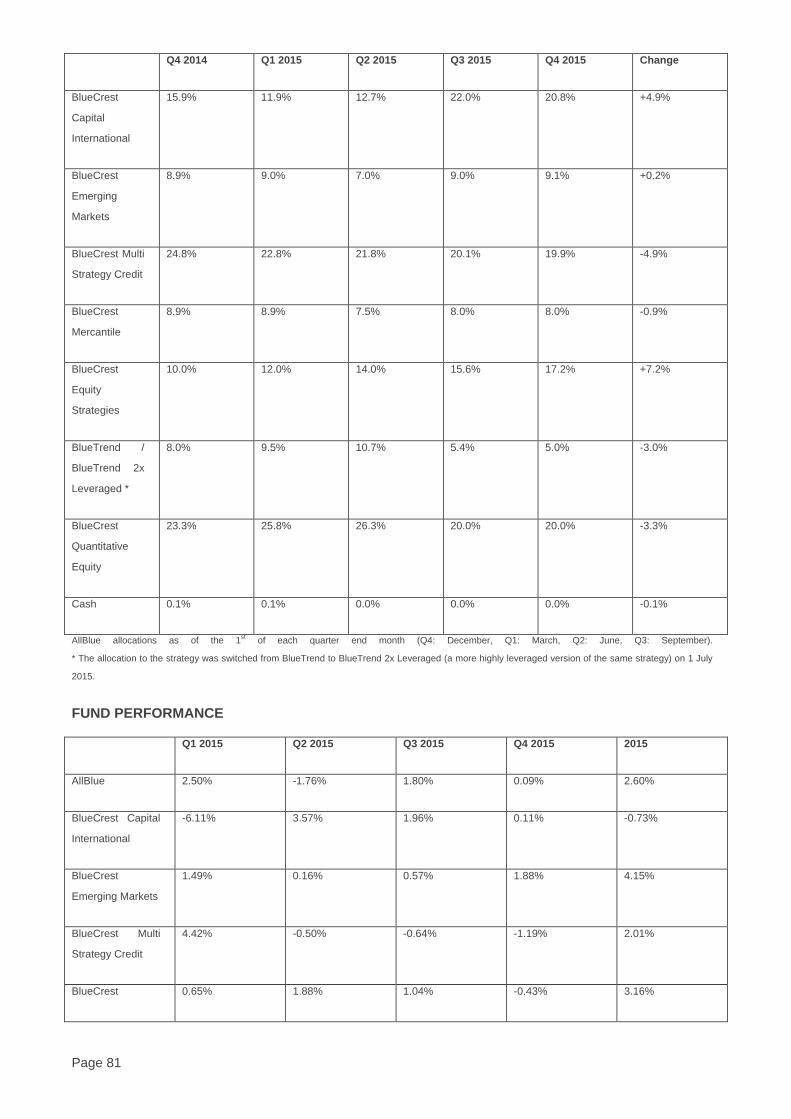
Q4 2014 Q1 2015 Q2 2015 Q3 2015 Q4 2015 Change
BlueCrest
Capital
International
15.9% 11.9% 12.7% 22.0% 20.8% +4.9%
BlueCrest
Emerging
Markets
8.9% 9.0% 7.0% 9.0% 9.1% +0.2%
BlueCrest Multi
Strategy Credit
24.8% 22.8% 21.8% 20.1% 19.9% -4.9%
BlueCrest
Mercantile
8.9% 8.9% 7.5% 8.0% 8.0% -0.9%
BlueCrest
Equity
Strategies
10.0% 12.0% 14.0% 15.6% 17.2% +7.2%
BlueTrend /
BlueTrend 2x
Leveraged *
8.0% 9.5% 10.7% 5.4% 5.0% -3.0%
BlueCrest
Quantitative
Equity
23.3% 25.8% 26.3% 20.0% 20.0% -3.3%
Cash 0.1% 0.1% 0.0% 0.0% 0.0% -0.1%
AllBlue allocations as of the 1st of each quarter end month (Q4: December, Q1: March, Q2: June, Q3: September).
* The allocation to the strategy was switched from BlueTrend to BlueTrend 2x Leveraged (a more highly leveraged version of the same strategy) on 1 July
2015.
FUND PERFORMANCE
Q1 2015 Q2 2015 Q3 2015 Q4 2015 2015
AllBlue 2.50% -1.76% 1.80% 0.09% 2.60%
BlueCrest Capital
International
-6.11% 3.57% 1.96% 0.11% -0.73%
BlueCrest
Emerging Markets
1.49% 0.16% 0.57% 1.88% 4.15%
BlueCrest Multi
Strategy Credit
4.42% -0.50% -0.64% -1.19% 2.01%
BlueCrest 0.65% 1.88% 1.04% -0.43% 3.16%
Page 81 v. 2.7

Mercantile
BlueCrest Equity
Strategies
5.63% 2.08% 1.97% 2.05% 12.21%
BlueTrend /
BlueTrend 2x
Leveraged *
11.70% -13.11% 9.16% -2.37% 3.43%
BlueCrest
Quantitative
Equity
2.96% -4.05% 0.46% -0.39% -1.15%
The figures shown are for Class A USD of each fund, with the exception of BlueCrest Equity Strategies which is for BlueCrest Equity Strategies Fund
Limited (Class B USD). These share classes are shown for representative performance and may differ to the share class held by AllBlue during 2015.
* The allocation to the strategy was switched from BlueTrend to BlueTrend 2x Leveraged (a more highly leveraged version of the same strategy) on 1 July
2015, for consistency in reporting fund performance BlueTrend Fund Limited figures have been used for the full year above.
PAST PERFORMANCE IS NOT NECESSARILY INDICATIVE OF FUTURE RESULTS.
ALLBLUE ATTRIBUTION
Q1 2015 Q2 2015 Q3 2015 Q4 2015 2015
BlueCrest Capital
International
-0.96% 0.36% 0.37% 0.06% -0.16%
BlueCrest
Emerging Markets
0.13% 0.07% 0.05% 0.17% 0.42%
BlueCrest Multi
Strategy Credit
1.07% -0.10% -0.13% -0.23% 0.60%
BlueCrest
Mercantile
0.06% 0.14% 0.08% -0.03% 0.25%
BlueCrest Equity
Strategies
0.60% 0.28% 0.31% 0.35% 1.54%
BlueTrend /
BlueTrend 2x
Leveraged *
0.88% -1.44% 0.96% -0.13% 0.24%
BlueCrest
Quantitative
Equity
0.71% -1.05% 0.17% -0.08% -0.25%
Attribution is for AllBlue Limited (Class A USD). *The allocation to the strategy was switched from BlueTrend to BlueTrend 2x Leveraged (a more highly
leveraged version of the same strategy) on 1 July 2015.
2015 KEY PERFORMANCE DRIVERS BY STRATEGY
Page 82 v. 2.7
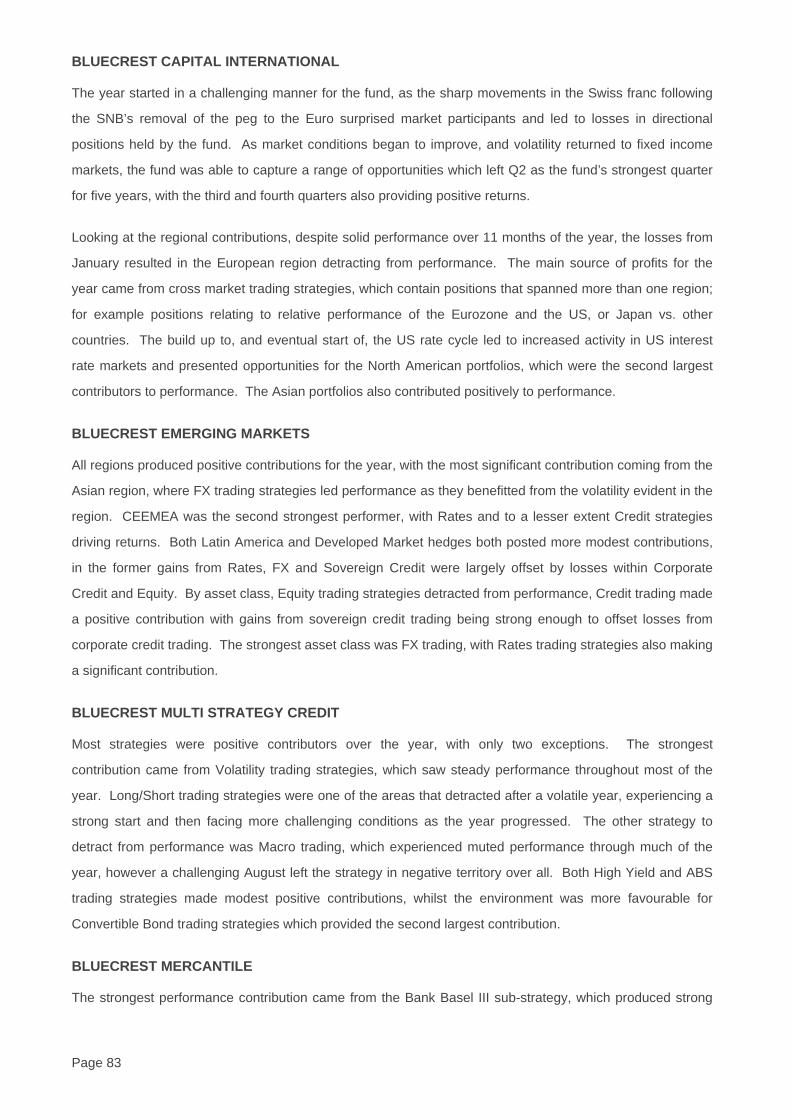
BLUECREST CAPITAL INTERNATIONAL
The year started in a challenging manner for the fund, as the sharp movements in the Swiss franc following
the SNB’s removal of the peg to the Euro surprised market participants and led to losses in directional
positions held by the fund. As market conditions began to improve, and volatility returned to fixed income
markets, the fund was able to capture a range of opportunities which left Q2 as the fund’s strongest quarter
for five years, with the third and fourth quarters also providing positive returns.
Looking at the regional contributions, despite solid performance over 11 months of the year, the losses from
January resulted in the European region detracting from performance. The main source of profits for the
year came from cross market trading strategies, which contain positions that spanned more than one region;
for example positions relating to relative performance of the Eurozone and the US, or Japan vs. other
countries. The build up to, and eventual start of, the US rate cycle led to increased activity in US interest
rate markets and presented opportunities for the North American portfolios, which were the second largest
contributors to performance. The Asian portfolios also contributed positively to performance.
BLUECREST EMERGING MARKETS
All regions produced positive contributions for the year, with the most significant contribution coming from the
Asian region, where FX trading strategies led performance as they benefitted from the volatility evident in the
region. CEEMEA was the second strongest performer, with Rates and to a lesser extent Credit strategies
driving returns. Both Latin America and Developed Market hedges both posted more modest contributions,
in the former gains from Rates, FX and Sovereign Credit were largely offset by losses within Corporate
Credit and Equity. By asset class, Equity trading strategies detracted from performance, Credit trading made
a positive contribution with gains from sovereign credit trading being strong enough to offset losses from
corporate credit trading. The strongest asset class was FX trading, with Rates trading strategies also making
a significant contribution.
BLUECREST MULTI STRATEGY CREDIT
Most strategies were positive contributors over the year, with only two exceptions. The strongest
contribution came from Volatility trading strategies, which saw steady performance throughout most of the
year. Long/Short trading strategies were one of the areas that detracted after a volatile year, experiencing a
strong start and then facing more challenging conditions as the year progressed. The other strategy to
detract from performance was Macro trading, which experienced muted performance through much of the
year, however a challenging August left the strategy in negative territory over all. Both High Yield and ABS
trading strategies made modest positive contributions, whilst the environment was more favourable for
Convertible Bond trading strategies which provided the second largest contribution.
BLUECREST MERCANTILE
The strongest performance contribution came from the Bank Basel III sub-strategy, which produced strong
Page 83 v. 2.7

positive returns each quarter. The strategy captured the net carry, and additionally successful trading and
rotation of hedges helped to both mitigate mark-to-market movements of the underlying asset and contribute
to performance. The Trade Credit Opportunities sub-strategy also contributed positively, with solid returns
coming in the first and third quarter. The Commodity Finance sub-strategy detracted from performance as
mining related assets were negatively impacted by declining gold prices.
Over the course of 2015 the fund reduced its exposure to the Trade Credit Opportunities sub-strategy in
favour of the Bank Basel III sub-strategy. The Bank Basel III sub-strategy saw increased opportunities amid
continued pressure on bank balance sheets and more active promotion of securitisation by authorities as a
mechanism to stimulate credit provision to the real economy. The exposure to the Commodity Finance sub-
strategy remained low as it continues to be wound down as opportunities present themselves.
BLUECREST EQUITY STRATEGIES
Solid performance in 2015 saw gains delivered across both the Equity Long/Short and Event Driven &
Relative Value strategies, with the latter producing the slightly higher performance. Regionally it was the
European portfolios that led performance, accounting for just over half of the gross returns, with North
American portfolios contributing just almost 40% and Asia Pacific a little under 10%. The large volumes of
corporate activity provided a good environment for the Event Driven & Relative Value strategies, with all
regions delivering positive performance. Within the Long/Short strategies, Europe and North America
contributed positively, whilst Asia Pacific detracted modestly. Sector performance saw most sectors
contribute to the Long/Short portfolio performance, with only the Technology, Media and
Telecommunications sector detracting modestly; the strongest contributions to Long/Short performance
came from the Financials sector, and also generalist portfolios trading across sectors.
BLUETREND / BLUETREND 2X LEVERAGED
AllBlue’s exposure to the BlueTrend strategy was originally obtained via the standard fund, however was
switched to the twice leveraged vehicle as of 1 July 2015. The comments below capture aggregate
contributions for AllBlue’s exposure through these two vehicles.
Over the period, four sectors contributed positively to performance and three detracted. The strongest
contribution came from the energy sector, which had an incredibly strong second half of the year; short
positions benefitted as prices fell in response to increased supply and falling demand. The metal sector also
contributed well, once again driven by performance in the second half of the year. The third sector within the
commodity complex, the agricultural commodities, detracted after seeing challenging performance
throughout most of the year.
Performance of the FX sector oscillated over the year, and produced a negative contribution in total. The
Equity sector also experienced volatility, with a very strong February, a tough June and then December’s
detraction turning the sector negative for the year. The two fixed income sectors, of Bonds and Short Term
Page 84 v. 2.7

Interest Rates both contributed positively, with most of their return coming in the first half of the year.
BLUECREST QUANTITATIVE EQUITY
At the regional level the strongest performance came from the European and North American portfolios,
whilst the Asia Pacific and Emerging Markets region detracted. The contribution across all signal families
was similar, with Alternative signals providing slightly stronger contributions and Traditional signals slightly
weaker at the global level. Within the Traditional family, the Value signal was the worst performer with
negative contributions in all regions, whilst the Analyst Estimates signal was the best performer in each
region. Within the Alternative family, the Company Linkages signal was the strongest performer in North
America but was weaker in Asia Pacific and Emerging Markets; the News and Events signal was strongest in
both Europe and Asia Pacific and Emerging Markets. Alpha Capture was a solid performer within the
Proprietary family for all regions, although the Anti Noise Trader signal was strongest in both Europe and
Asia Pacific and Emerging Markets. The portfolio maintained its neutral exposure throughout the year, and
gross exposure averaged approx. 600%.
THE SEVEN FUNDS UNDERLYING ALLBLUE
BlueCrest Capital International
A global macro strategy, with a strong fixed income focus. Strategies include directional and curve trading, driven by macro views around central bank activities, their likely actions and market reactions that will impact the level of rates and the shape of the yield curve. Also relative value which looks to identify anomalies across the fixed income markets.
BlueCrest Emerging Markets
A macro strategy that looks to identify opportunities across currency, local interest rates, sovereign and quasi-sovereign credit markets, with a focus on liquidity. The strategy trades throughout Latin America, the Middle East, Central and Eastern Europe, Africa and Asia.
BlueCrest Multi Strategy Credit
Engages in opportunities across the full credit spectrum of corporate and sovereign debt markets, implementing strategies such as long / short credit, credit volatility and capital structure arbitrage.
BlueCrest Mercantile
Invests in bonds and loans associated with the production and trade of commercial goods and commodities and then hedges out the associated risks. The credits are purchased from commercial banks who are under pressure to remove them from their balance sheets in order to manage risk concentration and to adhere to regulatory requirements.
BlueCrest Equity Strategies
Engages in long/short and event driven strategies across global equity markets by taking a multi-trader, multi strategy approach. Primarily non-directional.
BlueTrend A global systematic trend following strategy that trades in excess of 150 liquid markets covering asset classes including equities, fixed income, foreign exchange, energy, metals and agricultural commodities.
BlueCrest Quantitative Equity
A global systematic equity market neutral strategy that draws upon a wide variety of fundamental and technical inputs, as well as other sources. The portfolio construction process incorporates a sophisticated in-house risk model which seeks to maintain market neutrality at the regional level, as well as limiting exposures to other factors such as size or liquidity.
Page 85 v. 2.7

DISCLAIMER This document is issued: (i) for all purposes, except for issue into the United States or issue to U.S. persons, by BlueCrest Capital Management (UK) LLP (“BCM (UK) LLP”); and (ii) only for the purposes of issue into the United States or issue to U.S. persons, by BlueCrest Capital Management Limited (“BCML”) acting solely in its capacity as general partner of BlueCrest Capital Management LP (“BCMLP”). BCM (UK) LLP is authorised and regulated by the Financial Conduct Authority of the United Kingdom (the “FCA”). BCML is registered with the U.S. Securities and Exchange Commission (the “SEC”) as an investment adviser under the U.S. Investment Advisers Act of 1940, as amended, and with the U.S. Commodity Futures Trading Commission as a commodity trading advisor and a commodity pool operator and is a member of the U.S. National Futures Association in such capacity. BCML as general partner of BCMLP is licensed and regulated by the Jersey Financial Services Commission (the “JFSC”) under the Financial Services (Jersey) Law 1998 (the “FSJL”) to conduct fund services business in and from within Jersey. The JFSC does not take any responsibility for the financial soundness of the Funds (as defined below) or for the correctness of any statements made or expressed herein. The JFSC is protected by the FSJL against liability arising from the discharge of its functions under that law. This document is not intended to constitute, and should not be construed as, investment advice, investment recommendations or investment research. Potential investors in the Funds should seek their own independent financial, tax, legal and other advice. This document has been provided to you for informational purposes only and may not be relied upon by you in evaluating the merits of investing in any securities or interests referred to herein or for any other purpose. This document is not intended as and is not to be taken as an offer or solicitation with respect to the purchase or sale of any security or interest, nor does it constitute an offer or solicitation in any jurisdiction, including those in which such an offer or solicitation is not authorised or to any person to whom it is unlawful to make such a solicitation or offer. Before making any investment decision you should obtain independent legal, tax, accounting or other professional advice, as appropriate, none of which is offered to you by BCML, BCM (UK) LLP or any of their affiliates. None of BCML, BCM (UK) LLP or any of their affiliates accepts any duty of care to you in relation to any investment in the Funds. The terms of investment in any of the funds described herein or any other fund in respect of which BCML acts as investment manager (each, a “Fund” and together the “Funds”) are solely as set out in the Fund's prospectus or private placement memorandum (including any supplements thereto), as the case may be, application forms and/or memorandum and articles of association or limited partnership agreement, as the case may be (collectively, the “Fund Documents“). Before acquiring an interest in any Fund, each prospective investor is required to confirm that it has carefully reviewed the various risks of an investment in the Fund, as set out in the Fund Documents, and is required to acknowledge and agree to the existence of any actual and potential conflicts of interests described in the Fund Documents and waive, to the fullest extent permitted by any applicable law, any claim with respect to the existence of any such conflicts. To the extent that this document is issued by BCM (UK) LLP, it is being issued inside and outside the United Kingdom only to and/or is directed only at persons who are professional clients or eligible counterparties for the purposes of the FCA’s Conduct of Business Sourcebook. To the extent that this document is issued by BCML, this document is directed exclusively at persons who are professional clients or eligible counterparties for the purposes of the FSJL and any other legislation, regulations and orders which may be applicable from time to time, together with the requirements of any relevant codes of practice and guidance issued by the JFSC from time to time (the “JFSC Regulatory Requirements”), or, if to U.S. persons (as defined under Regulation S promulgated under the U.S. Securities Act of 1933, as amended (the “Securities Act”)), to U.S. persons who are both accredited investors (as defined under Regulation D promulgated under the Securities Act) and qualified purchasers (as defined in the U.S. Investment Company Act of 1940, as amended). The interests in the Funds have not been filed with or approved or disapproved by any regulatory authority of the United States or any state thereof, nor has any such regulatory authority passed upon or endorsed the merits of an offering of a Fund or the accuracy or adequacy of this document. Any representation to the contrary is unlawful. PURSUANT TO AN EXEMPTION FROM THE COMMODITY FUTURES TRADING COMMISSION IN CONNECTION WITH ACCOUNTS OF QUALIFIED ELIGIBLE PERSONS, THIS BROCHURE OR ACCOUNT DOCUMENT IS NOT REQUIRED TO BE, AND HAS NOT BEEN, FILED WITH THE COMMISSION. THE COMMODITY FUTURES TRADING COMMISSION DOES NOT PASS UPON THE MERITS OF PARTICIPATING IN A TRADING PROGRAM OR UPON THE ADEQUACY OR ACCURACY OF COMMODITY TRADING ADVISOR DISCLOSURE. CONSEQUENTLY, THE COMMODITY FUTURES TRADING COMMISSION HAS NOT REVIEWED OR APPROVED THIS TRADING PROGRAM OR THIS BROCHURE OR ACCOUNT DOCUMENT. RECIPIENTS SHOULD NOTE THAT ANY FUNDS WHICH ARE DELAWARE LIMITED PARTNERSHIPS ARE ONLY AVAILABLE FOR INVESTMENT BY U.S. PERSONS, AS DEFINED UNDER REGULATION S PROMULGATED UNDER THE SECURITIES ACT; SUCH FUNDS ARE NOT BEING DISTRIBUTED, PROMOTED OR MARKETED IN ANY JURISDICTION OTHER THAN THE UNITED STATES. Information for investors in the European Economic Area (the “EEA”): In relation to each member state of the EEA (each an “EEA Member State”) which has implemented the Alternative Investment Fund Managers Directive (“AIFMD”), this document may only be distributed and the interests in the Funds may only be offered or placed in an EEA Member State to the extent that: (1) the Fund is permitted to be marketed to professional investors in the relevant EEA Member State in accordance with AIFMD (as implemented into the local law/regulation of the relevant EEA Member State); or (2) this document may be otherwise lawfully distributed and the interests in the Funds may lawfully be offered or placed in that EEA Member State (including at the initiative of the potential investor). In relation to each EEA Member State which, at the date of this document, has not implemented AIFMD, this document may only be distributed and the interests in the Funds may only be offered or placed to the extent that this document may be lawfully distributed and the interests in the Funds may lawfully be offered or placed in that EEA Member State (including at the initiative of the potential investor). Information for investors in Switzerland: Any distribution of interests in the Funds in Switzerland is exclusively made to, and directed at, qualified investors (“Qualified Investors”), as defined in the Swiss Collective Investment Schemes Act of 23 June 2006, as amended, and its implementing ordinance. Any Funds which are Delaware limited partnerships are not being distributed in Switzerland and are not available for subscription by investors in Switzerland. Accordingly, the Funds have not been and will not be registered with the Swiss Financial Market Supervisory Authority. If a Swiss representative has been appointed in respect of a Fund, offering materials relating to interests in that Fund may be made available to Qualified Investors in Switzerland solely by the Swiss representative and/or authorised distributors. Swiss representative (where appointed): Mont-Fort Funds AG, 63 Chemin Plan-Pra, 1936 Verbier, Switzerland. Swiss paying agent (where appointed): Neue Helvetische Bank AG, Seefeldstrasse 215, CH-8008 Zurich. In respect of the distribution of interests in the Funds in and from Switzerland, the place of performance and jurisdiction is the registered office of the Swiss representative.
Page 86 v. 2.7
Information for investors in Singapore: This document has not been registered as a prospectus with the Monetary Authority of Singapore and the Funds are not authorised or recognised by the Monetary Authority of Singapore. Accordingly, this document and any other document or material in connection with the offer, sale, invitation for subscription or purchase of interests in any Fund may not be circulated or distributed, nor may interests in any Fund be offered, sold or be made the subject of an invitation for subscription or purchase, whether directly or indirectly, to the public or any member of the public in Singapore other than a person who is an accredited investor or an institutional investor (each as defined under the Securities and Futures Act (Chapter 289) of Singapore) or unless otherwise permitted under any applicable exemption. The information contained herein is intended only for the person or entity to which it is addressed and may contain confidential and/or privileged material. Any dissemination or other unauthorised use of this information by any person or entity is strictly prohibited. The distribution of this document may be further restricted by law. No action has been or will be taken by any of BCM (UK) LLP, BCML, or any Fund to permit the possession or distribution of this document in any jurisdiction (other than as expressly described herein) where action for that purpose may be required. Accordingly, this document may not be used in any jurisdiction except under circumstances that will result in compliance with any applicable laws and regulations. Persons to whom this document is communicated should inform themselves about and observe any such restrictions. This document may contain simulated performance results achieved by means of the retroactive application of the adviser’s investment methodology, or the real-time application of a hypothetical capital allocation to such strategy. Hypothetical performance results have many inherent limitations, some of which are described below. No representation is being made that any particular trading program will or is likely to achieve profits or losses similar to those shown. In fact, there are frequently sharp differences between hypothetical performance results and the actual results subsequently achieved by any particular trading program. One of the limitations of hypothetical performance results is that they are generally prepared with the benefit of hindsight. In addition, hypothetical trading does not involve financial risk, and no hypothetical trading record can completely account for the impact of financial risk in actual trading. For example, the ability to withstand losses or to adhere to a particular trading program in spite of trading losses are material points which can also adversely affect actual trading results. There are numerous other factors related to the markets in general or to the implementation of any specific trading program which cannot be fully accounted for in the preparation of hypothetical performance results and all of which can adversely affect actual trading results. Although the information in this document is believed to be materially correct as at the date of issue, no representation or warranty is given as to the accuracy of any of the information provided. Furthermore no representation or warranty is given in respect of the correctness of the information contained herein as at any future date. Certain information included in this document is based on information obtained from third-party sources considered to be reliable. Any projections or analysis provided to assist the recipient of this document in evaluating the matters described herein may be based on subjective assessments and assumptions and may use one among alternative methodologies that produce different results. Accordingly, any projections or analysis should not be viewed as factual and should not be relied upon as an accurate prediction of future results. Furthermore, to the extent permitted by law, BCM (UK) LLP, BCML, BCMLP, the Funds, and their affiliates, agents, service providers and professional advisers assume no liability or responsibility and owe no duty of care for any consequences of any person acting or refraining to act in reliance on the information contained in this document or for any decision based on it. PAST PERFORMANCE IS NOT NECESSARILY INDICATIVE OF FUTURE RESULTS. The actual performance realised by any given investor will depend on numerous factors and circumstances. This document may include returns for various indices. These indices are not intended to be direct benchmarks for a particular Fund, nor are they intended to be indicative of the type of assets in which a particular Fund may invest. The assets invested in by any of the Funds will likely be materially different from the assets underlying these indices, and will likely have a significantly different risk profile. Target returns, volatility and Sharpe ratio figures quoted are targets only and are based over the long term on the performance projections of the investment strategy and market interest rates at time of modelling and therefore may change.
Page 87 v. 2.7
Glossary Unless the context suggests otherwise, references within this report to:
“AIFM” means Alternative Investment Fund Manager.
“AIFMD” means the Alternative Investment Fund Managers Directive.
“AIC” means the Association of Investment Companies, of which the Company is a member.
“AIC Code” means the AIC Code of Corporate Governance.
“AllBlue Leveraged” means AllBlue Leveraged Feeder Limited.
“AllBlue” means AllBlue Limited.
“Articles” means the Articles of Association of the Company.
the “Company” means Highbridge Multi-Strategy Fund Limited.
“BlueCrest” means BlueCrest Capital Management Limited.
“Board” means the Board of Directors of the Company.
“Business Day” means any day on which banks are open for business in the Cayman Islands, United Kingdom and/or Guernsey and/or such other place or places as the Directors may from time to time determine.
“funds underlying AllBlue” means the seven underlying funds of AllBlue comprising BlueCrest Capital International Limited, BlueTrend 2x Leveraged Fund Limited (with effect from 1 July 2015, BlueTrend Fund Limited prior to 1 July 2015), BlueCrest Multi Strategy Credit Fund Limited, BlueCrest Emerging Markets Fund Limited, BlueCrest Mercantile Fund Limited, BlueCrest Equity Strategies Fund Limited and BlueCrest Quantitative Equity Fund Limited (together, including the master funds into which such funds invest).
“GFSC Code” means the Guernsey Financial Services Commission Financial Sector Code of Corporate Governance.
“Highbridge” means Highbridge Capital Management LLC.
“HCC” means Highbridge Capital Corporation, a limited liability company incorporated in the Cayman Islands through which the Company invests into the Highbridge multi-strategy fund.
“ICS” means the Institutional Cash Series plc (“ICS”) (an umbrella investment company with variable capital and having segregated liability between its funds).
“IFRS” means the International Financial Reporting Standards as adopted by the European Union.
“JTC” or the “Administrator” means JTC (Guernsey) Limited.
“Law” means the Companies (Guernsey) Law 2008 (as amended).
“Shares” means the Sterling Shares and US Dollar Shares of the Company in issue.
“Underlying Fund” means the fund ultimately underlying Highbridge Capital Corporation, Highbridge multi strategy fund.
“UKLA” means United Kingdom Listing Authority.
“VaR” means Value at Risk.
“Website” means the Company’s website, https://www.highbridgemsfltd.co.uk.
Page 88 v. 2.7

Directors and Service Providers Directors Richard Crowder Steve Le Page Paul Meader Sarita Keen
Registered Office of the Company Ground Floor, Dorey Court Admiral Park St Peter Port Guernsey GY1 2HT Telephone +44 (0)1481 702400
Administrator and Company Secretary JTC (Guernsey) Limited Ground Floor Dorey Court St Peter Port Guernsey GY1 2HT Telephone +44 (0)1481 702400
Registrar, Paying Agent and Transfer Agent Anson Registrars Limited PO Box 426 Anson House, Havilland Street, St Peter Port, Guernsey GY1 3WX
UK Transfer Agent Anson Registrars (UK) Limited 3500 Parkway Whiteley, Hampshire England PO15 7AL
Auditor Ernst & Young LLP Royal Chambers St Julian’s Avenue St Peter Port Guernsey GY1 4AF
Investment Manager and AIFM Highbridge Capital Management LLC 40 West 57th Street – 32nd Floor New York NY10019
Investor and Public Relations J.P. Morgan Asset Management 60 Victoria Embankment London EC4Y 0JP
Corporate Brokers Jefferies Hoare Govett Vintners Place, 68 Upper Thames Street London England EC4V 3BJ
Corporate Brokers Fidante Capital plc (previously named Dexion Capital plc) 1 Tudor Street London England EC4Y 0AH
Advocates to the Company as to Guernsey Law Mourant Ozannes PO Box 186 1 Le Marchant Street St Peter Port Guernsey GY1 4HP
Carey Olsen P.O. Box 98 Carey House, Les Banques St Peter Port Guernsey GY1 4BZ
Solicitors to the Company as to English Law Herbert Smith Freehills LLP Exchange House Primrose Street London England EC2A 2EG
Investor Liaison Capital Access Group (previously named Broker Profile) Sky Light City Tower 50 Basinghall Street London England EC2V 5DE
Page 89 v. 2.7