Embed Size (px)
Citation preview

494Am. J. Enol. Vitic. 63:4 (2012)
Haloanisoles (e.g., 2,4,6-trichloroanisole, TCA; 2,3,4,6-tet-rachloroanisole, TeCA; 2,3,4,5,6-pentachloroanisole, PCA; 2,4,6-tribromoanisole, TBA) are responsible for musty off-aromas in many foods and beverages when present in trace levels (reviewed by Collins et al. 2012). TCA contamination results in an off-aroma in water, grains, potatoes, broiler chickens, essential oils, raisins, and sake (Stoffelsma and De Roos 1973, Curtis et al. 1974, Buser et al. 1982, Hodin et al. 1991, Nyström et al. 1992, Aung et al. 1996, Seitz et al. 1999, Miki et al. 2005, Daniels-Lake et al. 2007). TeCA has also been identified as a contaminant in broiler chickens as well as pharmaceuticals (Engel et al. 1966, Ramstad and Walker 1992, Chatonnet et al. 1994). TBA has been identified in ma-rine products and was the source of the musty off-aroma in Tylenol, causing a nationwide recall of the medication (Whit-field et al. 1997, McCoy 2010).
TCA, TeCA, PCA, and TBA also contribute to the musty off-aroma of wines called “cork taint” (Buser et al. 1982, Cha-tonnet et al. 1994, 2004). Approximately 1 to 5% of corks on
the market are tainted, resulting in significant losses in rev-enues (Fox 2009). The major source of haloanisole contami-nation in wine is contaminated corks, although oak barrels and other winery-related sources are sometimes implicated (Chatonnet et al. 2004, Simpson and Sefton 2007). Knowledge of which haloanisoles are present in the corks or the resulting wine gives insight into how the taint is formed. For example, the presence of TCA and DCA and the absence of PCA and TeCA implicate hypochlorite washing as opposed to bio-meth-ylation (Peña-Neira et al. 2000, Simpson and Sefton 2007).
Haloanisole sensory thresholds are in the low ng/L range. In wine, TCA detection thresholds from 1.4 to 4.0 ng/L have been reported (Duerr 1985, Amon et al. 1989, Liacopoulos et al. 1999). In a recent study, a consumer rejection threshold of 3.1 ng/L and a detection threshold of 2.1 ng/L were re-ported in Chardonnay wine (Prescott et al. 2005). Given these very low sensory thresholds, sensitive and specific analytical methods for the quantitative analysis of haloanisoles in wines are needed. Most wineries have established detailed quality-control analysis procedures where cork lots and wine samples are routinely monitored for haloanisole levels throughout pro-cessing and storage.
Most reported methods for analysis of haloanisoles in wine use gas chromatography combined with mass spectrom-etry (GC-MS), although gas chromatography coupled with electron capture detection (GC-ECD) has been used as well, as recently reviewed by Collins et al. (2012). A wide range of sample preparation techniques, including headspace sol-id-phase microextraction (HS-SPME), have also been used. For example, Evans et al. (1997) and Fischer and Fischer (1997) were among the first to report application of HS-SPME combined with GC-single quadrupole MS analysis in the selected ion monitoring (SIM) mode for analysis of
1Department of Viticulture and Enology, 2Department of Food Science and Technology, 3Agricultural and Environmental Chemistry Graduate Group, and 4Food Safety and Measurement Facility, University of California, Davis, CA 95616; 5Treasury Wine Estates, 600 Airpark Road, Napa, CA 94558; and 6Agilent Technologies, Inc., 2850 Centerville Road, Wilmington, DE 19808.*Corresponding author (email: [email protected]; tel: 530-752-0696; fax: 530-752-0382)Acknowledgments: The authors gratefully acknowledge Agilent Technologies for the loan of the GC-triple quadrupole MS and Gerstel, Inc., for the loan of the autosampler.Manuscript submitted Mar 2012, revised May 2012, accepted May 2012Copyright © 2012 by the American Society for Enology and Viticulture. All rights reserved.doi: 10.5344/ajev.2012.12043
High-Throughput, Sub ng/L Analysis of Haloanisoles in Wines Using HS-SPME with GC-Triple Quadrupole MS
Anna K. Hjelmeland,1,3,4 Thomas S. Collins,1,3,4,5 Joshua L. Miles,5 Philip L. Wylie,6 Alyson E. Mitchell,2,3,4 and Susan E. Ebeler1,3,4*
Abstract: Haloanisole contamination causes development of “cork taint,” a musty off-aroma in affected wines. Cork taint results in significant economic loss for the wine and allied industries every year, therefore extensive quality-control procedures have been established at wineries and cork production facilities to monitor levels of haloanisoles in cork products. Because of the extremely low human sensory thresholds for these compounds (~1 to 4 ng/L for 2,4,6-trichloroanisole in wine), highly sensitive analytical methods are needed to detect the haloanisoles at threshold concentrations or lower. We present a method for the simultaneous analysis of four haloanisoles in wine—2,4,6-trichloroanisole (TCA); 2,3,4,6-tetrachloroanisole (TeCA); 2,3,4,5,6-pentachloroanisole (PCA); and 2,4,6-tribromoanisole (TBA)—that have been frequently associated with cork taint aromas in wines. Headspace solid-phase microextraction (HS-SPME) coupled to a GC-triple quadrupole MS was used to obtain limits of quanti-fication that were ≤1.0 ng/L and below sensory threshold levels. The method is fully automated, requires no sample preparation other than the addition of internal standards, and is high throughput, with a 10-min extraction time and a 5-min incubation prior to extraction. This method can be readily adapted to screen for haloanisoles in cork extracts.
Key words: cork taint, haloanisoles, HS-SPME, GC-tandem MS

Haloanisole Analysis in Wines – 495
Am. J. Enol. Vitic. 63:4 (2012)
TCA in wines. The reported limit of quantification was 5 ng/L (Evans et al. 1997) and limit of detection was ~3 ng/L (Fischer and Fischer 1997). More recently, HS-SPME com-bined with GC-ion trap tandem MS methods have also been described; limits of quantification were ~0.5 ng/L for TCA in a water matrix (Bianchi et al. 2003, Sung et al. 2005) and 2 ng/L in wine (ion trap MS scan mode) (Vieira Neto et al. 2007). Most reported methods use HS-SPME extraction times of >20 min (Collins et al. 2012). In addition, while stable isotope dilution methods are generally considered ideal for accurate, quantitative analysis of volatiles (Milo and Blank 1998, Polaskova et al. 2008), only a few studies have adopted stable isotope internal standards combined with MS detection for quantification of haloanisoles in wines and cork materials (reviewed by Collins et al. 2012).
The use of tandem MS (MS/MS) for targeted analysis of wine components, including haloanisoles, has become in-creasingly popular (Ebeler 2012). Tandem MS involves pro-duction of ions in the MS source followed by isolation (in “MS1”) of selected precursor ions associated with the analyt-es of interest. The selected precursor ions are then transferred to a collision cell where they are fragmented with a reaction gas (e.g., nitrogen or argon). Finally, selected fragmented ions specific for the analytes of interest are detected in a second mass detector (“MS2”). The gain in sensitivity using MS/MS is primarily due to reduction in noise, since background inter-ferences are removed as the desired precursor and fragment ions are sequentially selected. Two types of GC-tandem MS instruments are currently commercially available. GC-tandem MS instruments with ion traps store all of the precursor ions together and manipulate them over time to sequentially per-form the functions of MS1, the collision cell, and MS2. Linear quadrupole tandem MS instruments are now commercially available where the ions travel through the mass separators and the collision cell sequentially in space (MS1, collision cell, MS2). Linear triple quadrupole tandem MS instruments provide greater response range and mass spectra that are not as influenced by self-ionization compared with conventional ion trap instruments (Ebeler 2012). As recently reviewed, there are limited published methods combining the advan-tages of HS-SPME with GC-MS/MS and using stable isotope internal standards for trace quantification of haloanisoles.
Our objective was therefore to develop a rapid, high-throughput HS-SPME GC-triple quadrupole tandem MS method for the simultaneous analysis of TCA, TeCA, PCA, and TBA in wines. Using stable isotope internal standards, our goal was to obtain reproducible quantification with limits of detection in the sub ng/L range for these selected haloan-isoles known to be associated with cork taint.
Materials and MethodsReagents and materials. 2,4,6-Trichloroanisole (99.1%),
2,3,4,6-tetrachloroanisole (100.0%), pentachloroanisole (99.9%), and 2,4,6-tribromoanisole (99.9%) were purchased as a mixture diluted in methanol (Supelco, Bellefonte, PA). [2H5] TCA (98%, Cambridge Isotope Laboratories, Ando-ver, MA) was purchased as a methanol solution. [2H5] TBA
(99.0%; C/D/N Isotopes, Inc., Pointe-Claire, Quebec, Cana-da) and [13C6] PCA (99%; Cambridge Isotope Laboratories) were purchased in solid form. Stock solutions of analytes and internal standards were prepared in 100% ethanol (Gold Shield Chemical, Hayward, CA).
A model wine was used for initial evaluations and prepa-ration of calibration standards. The model wine was made with 18 MΩ water (prepared with an in-house filtration sys-tem; Millipore, Bedford, MA) and contained 12% ethanol (v/v) and saturated potassium hydrogen tartrate (KHT; 5 g/L), adjusted to pH 3.3 with HCl.
Five commercial wines (two reds and three whites), ob-tained locally, were used for the analyte recovery experi-ments: Petite Syrah, 2007; Cabernet Sauvignon, 2009; Sau-vignon blanc, 2009; Gewürtztraminer, 2008; and semidry Riesling, 2008. In addition, five tainted wines reported by consumers to have taint aromas were obtained from a local testing laboratory.
HS-SPME GC-triple quadrupole MS analysis. HS-SPME sampling. SPME fibers with differing phases were evaluated, including 1 cm polydimethylsiloxane (PDMS), 1 cm PDMS/divinylbenzene (PDMS/DVB), and 2 cm car-boxen/PDMS/DVB (Supelco). All fibers were stable flex, 23 gauge. The signal-to-noise ratio for each of the analytes at a concentration of 10 ng/L was used to select the fiber that gave the best response. After selecting the PDMS fiber type, film thicknesses of 7 µm, 30 µm, and 100 µm were evaluated to identify the thickness that also provided the greatest signal-to-noise response. Additional extraction vari-ables were then optimized, including extraction temperature (30°C, 40°C, 50°C, and 60°C) and time (5, 10, 15, 20, 30, 40, and 50 min). Agitation speed prior to extraction was tested at 250 and 500 rpm; agitation speed during SPME extrac-tion is only allowed at 250 rpm to protect the SPME fiber. Finally, sample extraction was evaluated with and without salt (NaCl) addition.
Final HS-SPME conditions were as follows. Wine samples (10 mL) were aliquotted into 20 mL amber glass sample vials (Agilent Technologies, Santa Clara, CA). 50 µL of the stock internal standard solution was added to each vial and then the vial was sealed with a 3 mm thick PFTE-lined septum and crimp-cap closure (Supelco). The final concentration of internal standards was 5.0 ng/L for [2H5] TCA and [13C6] PCA and 10 ng/L for [2H5] TBA in the sample. Samples were initially agitated at 40°C and 500 rpm for 5 min prior to extraction. Samples were then immediately extracted by inserting a preconditioned, 100 µm, PDMS SPME fiber into the headspace of the vial for 10 min while agitating at 250 rpm. Following headspace extraction, the fiber remained in the GC inlet for 11 min, the entire oven cycle time. This time was necessary to prevent TBA carryover between samples; 3 min in the inlet is sufficient for the other analytes. The fiber was always either in the inlet or extracting a sample to prohibit contamination and loss of sample. All analyses were replicated a minimum of three times.
GC-triple quadrupole MS conditions. The analytical sys-tem was comprised of a Gerstel MPS2 autosampler (Gerstel,

496 – Hjelmeland et al.
Am. J. Enol. Vitic. 63:4 (2012)
Inc., Linthicum, MD) mounted to an Agilent 7890A gas chromatograph paired with an Agilent 7000B triple quad-rupole mass spectrometer. MassHunter Qualitative Analysis software was used for data analysis (ver. B.03.01; Agilent Technologies).
The gas chromatograph was fitted with a DB-5 (5% phenyl-polydimethylsiloxane stationary phase) fused-silica capillary column with dimensions of 30 m x 0.25 mm i.d., 0.25 µm film thickness (Agilent Technologies). The GC inlet was equipped with a SPME injection sleeve (0.75 mm i.d.; Supelco). The oven was held at an initial temperature of 40°C for 0 min followed by an increase of 30°C/min to a final temperature of 280°C, with a final hold at 280°C for 3 min. The MS transfer line temperature was held at 280°C. The injections were split-less with the split flow opening at 1.2 min at a flow rate of 50 mL/min for 3 min when the flow was changed to 20 mL/min. The GC inlet was held at 280°C. The helium carrier gas was operated at a constant flow of 1.2 mL/min.
The detector was fitted with an electron impact ioniza-tion source set to 230°C. The solvent delay was set to 5 min and the detector was turned off at 7.1 min. The gain value was set to 15 for the multiple reaction monitoring (MRM) acquisitions. MRM transitions and collision energies were optimized to identify ions unique to the analytes of interest while providing optimal ion abundances for quantification. Dwell times were optimized to provide ~15 scans over the entire peak. Helium quench gas and nitrogen collision gas flow rates to the collision cell were set to 2.25 mL/min and 1.5 mL/min, respectively.
Linearity, LOQ, and LOD. Calibration curves containing a minimum of 10 concentrations for each of the analytes were generated using model wine as the matrix and in concentra-tions ranging from 0.10 to 50 ng/L. Dilutions of the stan-dards and internal standards were prepared in 100% ethanol. Model wine blanks contained no detectable levels of any of the analytes. The response ratio of the analyte quantifier ion to the internal standard quantifier ion was plotted as a func-tion of analyte concentration; linear regression calculations were used to determine the slope and intercepts. For each analyte, the stable isotope analog was used as the internal standard for calibration, except for TeCA, where [13C6] PCA was used as the internal standard. Limits of quantification (LOQ) were determined using a signal-to-noise ratio of 10:1. Limits of detection (LOD) were determined using a signal-to-noise ratio of 3:1.
Spiked recovery and reproducibility. Commercial wines were spiked with each of the haloanisoles to give final con-centrations of 1.0 ng/L and 5.0 ng/L. Concentrations in the wines before and after spiking were determined using the optimized analysis method. Analyte recovery was determined from the measured concentration (minus any analyte found in the wine prior to spiking) and was reported as a percentage of the theoretical value. All samples were analyzed in triplicate. Relative standard deviations for the replicate analyses were used to evaluate reproducibility.
Analysis of tainted wines and comparison to GC-ion trap tandem MS. Five commercial wines reported by con-
sumers to be tainted were analyzed in triplicate using the optimized method. Results for two tainted wines were com-pared to those obtained by a commercial laboratory using a GC-ion trap tandem MS procedure (Wang and Viven 2010).
Results and DiscussionHS-SPME conditions. Several SPME fiber types were
evaluated for optimal extraction of the haloanisoles. The PDMS coating (100 µm) provided the best overall extrac-tion efficiency (data not shown) consistent with previously reported methods (Vieira Neto et al. 2007, Collins et al. 2012). Further optimization of extraction temperature, time, and agitation speed prior to extraction indicated that higher extraction temperatures and longer extraction times were best for the larger molecular weight haloanisoles (PCA and TBA) compared to lower temperatures and shorter times for TCA and TeCA (Table 1). In order to maximize the response for all analytes while maintaining a rapid throughput, final extrac-tion conditions of 40°C for 10 min were selected while agitat-ing at 250 rpm during extraction, with a 5-min preextraction agitation at 40°C and 500 rpm. This extraction temperature is consistent with that used in previous studies; however, the extraction time is significantly shorter than previous reports where extraction times of ≥20 min are typically used (Vieira Neto et al. 2007, Bianco et al. 2009). Salt did not appreciably increase analyte response (data not shown) and was therefore not added to the samples prior to extraction in order to further minimize sample preparation time.
GC-triple quadrupole MS MRM optimization. Tandem MS conditions were optimized to identify unique precursor and product ions for each of the analytes and internal stan-dards (Table 2). Ions and collision energies were selected to provide maximum ion abundances for precursor and product ions without interference or overlap in signals for each peak. Both quantifier and qualifier transitions were identified.
Linearity, LOD, and LOQ. Linear responses for each of the haloanisoles were obtained in a model wine matrix (Table 3). Limits of detection and quantification were well below sensory thresholds (Table 3). TBA, the least volatile analyte, had the highest LOD and LOQ under these analysis conditions. As previously discussed, these conditions provide a trade-off between optimal sensitivity and rapid throughput (i.e., short extraction times); while longer extraction times could enhance the response significantly, they were not sys-tematically tested here.
In comparison with previous studies, the LODs and LOQs obtained here were lower than those typically reported for HS-SPME analysis of haloanisoles in water, wine, and cork extracts using single quadrupole selected ion monitoring de-tection combined with HS-SPME extraction times of ≥25 min (Evans et al. 1997, Fischer and Fischer 1997). Our reported limits were also lower than, or equivalent to, previous reports using ion trap detection combined with HS-SPME extraction times of ≥30 min and either electron impact (EI) or chemical ionization (CI) MS sources (Bianchi et al. 2003, Sung et al. 2005, Vieira Neto et al. 2007). Jönsson et al. (2006) reported an LOQ of 0.2 to 0.3 ng/L for TCA and TBA in wine; however,
Haloanisole Analysis in Wines – 497
Am. J. Enol. Vitic. 63:4 (2012)
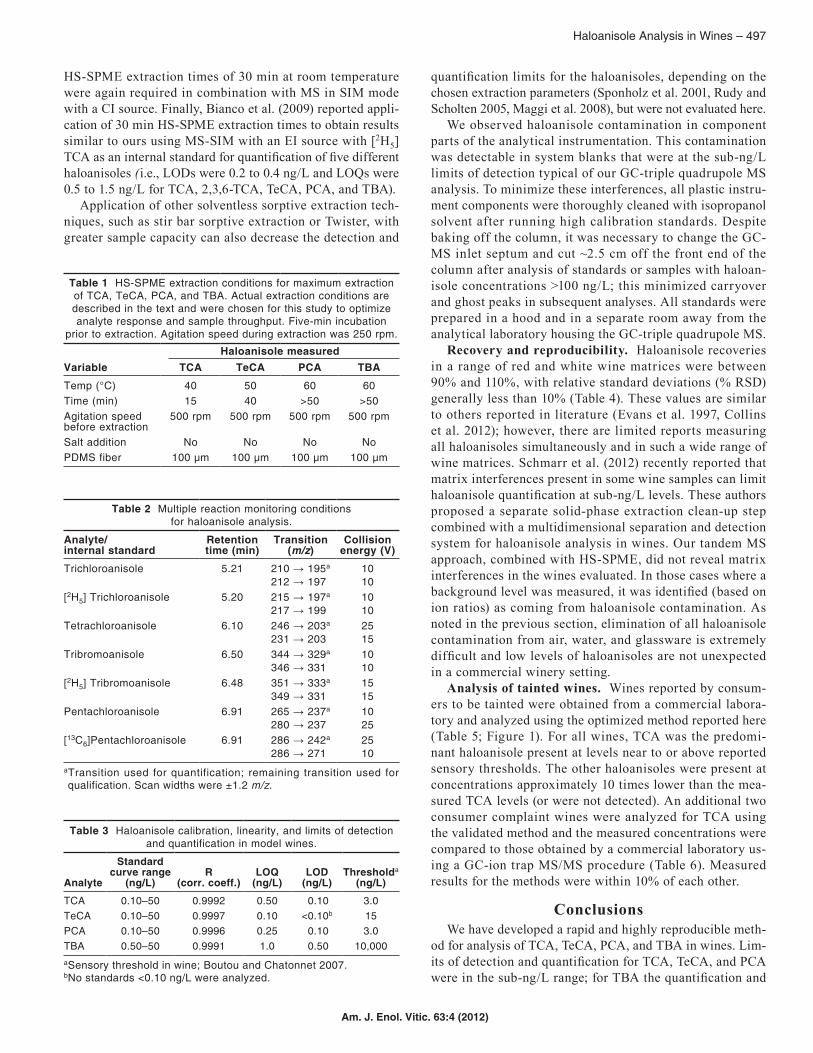
HS-SPME extraction times of 30 min at room temperature were again required in combination with MS in SIM mode with a CI source. Finally, Bianco et al. (2009) reported appli-cation of 30 min HS-SPME extraction times to obtain results similar to ours using MS-SIM with an EI source with [2H5] TCA as an internal standard for quantification of five different haloanisoles (i.e., LODs were 0.2 to 0.4 ng/L and LOQs were 0.5 to 1.5 ng/L for TCA, 2,3,6-TCA, TeCA, PCA, and TBA).
Application of other solventless sorptive extraction tech-niques, such as stir bar sorptive extraction or Twister, with greater sample capacity can also decrease the detection and
quantification limits for the haloanisoles, depending on the chosen extraction parameters (Sponholz et al. 2001, Rudy and Scholten 2005, Maggi et al. 2008), but were not evaluated here.
We observed haloanisole contamination in component parts of the analytical instrumentation. This contamination was detectable in system blanks that were at the sub-ng/L limits of detection typical of our GC-triple quadrupole MS analysis. To minimize these interferences, all plastic instru-ment components were thoroughly cleaned with isopropanol solvent after running high calibration standards. Despite baking off the column, it was necessary to change the GC-MS inlet septum and cut ~2.5 cm off the front end of the column after analysis of standards or samples with haloan-isole concentrations >100 ng/L; this minimized carryover and ghost peaks in subsequent analyses. All standards were prepared in a hood and in a separate room away from the analytical laboratory housing the GC-triple quadrupole MS.
Recovery and reproducibility. Haloanisole recoveries in a range of red and white wine matrices were between 90% and 110%, with relative standard deviations (% RSD) generally less than 10% (Table 4). These values are similar to others reported in literature (Evans et al. 1997, Collins et al. 2012); however, there are limited reports measuring all haloanisoles simultaneously and in such a wide range of wine matrices. Schmarr et al. (2012) recently reported that matrix interferences present in some wine samples can limit haloanisole quantification at sub-ng/L levels. These authors proposed a separate solid-phase extraction clean-up step combined with a multidimensional separation and detection system for haloanisole analysis in wines. Our tandem MS approach, combined with HS-SPME, did not reveal matrix interferences in the wines evaluated. In those cases where a background level was measured, it was identified (based on ion ratios) as coming from haloanisole contamination. As noted in the previous section, elimination of all haloanisole contamination from air, water, and glassware is extremely difficult and low levels of haloanisoles are not unexpected in a commercial winery setting.
Analysis of tainted wines. Wines reported by consum-ers to be tainted were obtained from a commercial labora-tory and analyzed using the optimized method reported here (Table 5; Figure 1). For all wines, TCA was the predomi-nant haloanisole present at levels near to or above reported sensory thresholds. The other haloanisoles were present at concentrations approximately 10 times lower than the mea-sured TCA levels (or were not detected). An additional two consumer complaint wines were analyzed for TCA using the validated method and the measured concentrations were compared to those obtained by a commercial laboratory us-ing a GC-ion trap MS/MS procedure (Table 6). Measured results for the methods were within 10% of each other.
ConclusionsWe have developed a rapid and highly reproducible meth-
od for analysis of TCA, TeCA, PCA, and TBA in wines. Lim-its of detection and quantification for TCA, TeCA, and PCA were in the sub-ng/L range; for TBA the quantification and
Table 1 HS-SPME extraction conditions for maximum extraction of TCA, TeCA, PCA, and TBA. Actual extraction conditions are described in the text and were chosen for this study to optimize analyte response and sample throughput. Five-min incubation
prior to extraction. Agitation speed during extraction was 250 rpm.
Haloanisole measuredVariable TCA TeCA PCA TBA
Temp (°C) 40 50 60 60Time (min) 15 40 >50 >50Agitation speed before extraction
500 rpm 500 rpm 500 rpm 500 rpm
Salt addition No No No NoPDMS fiber 100 µm 100 µm 100 µm 100 µm
Table 2 Multiple reaction monitoring conditions for haloanisole analysis.
Analyte/internal standard
Retention time (min)
Transition (m/z)
Collision energy (V)
Trichloroanisole 5.21 210 → 195a
212 → 1971010
[2H5] Trichloroanisole 5.20 215 → 197a
217 → 1991010
Tetrachloroanisole 6.10 246 → 203a
231 → 2032515
Tribromoanisole 6.50 344 → 329a
346 → 3311010
[2H5] Tribromoanisole 6.48 351 → 333a
349 → 3311515
Pentachloroanisole 6.91 265 → 237a
280 → 2371025
[13C6]Pentachloroanisole 6.91 286 → 242a
286 → 2712510
aTransition used for quantification; remaining transition used for qualification. Scan widths were ±1.2 m/z.
Table 3 Haloanisole calibration, linearity, and limits of detection and quantification in model wines.
Analyte
Standard curve range
(ng/L)R
(corr. coeff.)LOQ
(ng/L)LOD
(ng/L)Thresholda
(ng/L)
TCA 0.10–50 0.9992 0.50 0.10 3.0TeCA 0.10–50 0.9997 0.10 <0.10b 15PCA 0.10–50 0.9996 0.25 0.10 3.0TBA 0.50–50 0.9991 1.0 0.50 10,000aSensory threshold in wine; Boutou and Chatonnet 2007.bNo standards <0.10 ng/L were analyzed.

498 – Hjelmeland et al.
Am. J. Enol. Vitic. 63:4 (2012)
detection limits were ≤1.0 ng/L. These levels are below the reported sensory thresholds; measurements at subthreshold levels may be important for monitoring winery processes over time to ensure that no sources of contamination ex-ist that could taint the wines during processing and stor-age. The total HS-SPME extraction time for the optimized method was 10 min (a 5-min preagitation was also applied) with a GC analysis time of 11 min. This extraction time is two to four times faster than previously reported methods; faster GC analysis times can also be used, compared to many previous methods, since some GC separation efficiency can be sacrificed when combined with tandem MS detection. Longer HS-SPME extraction times or application of SBSE (Twister) could further improve the sensitivity of the method,
if needed. This method can be readily applied to cork qual-ity control and to the monitoring of wines and other winery materials during processing and storage.
Literature CitedAmon, J., J. Vandepeer, and R. Simpson. 1989. Compounds responsible
for cork taint in wine. Wine Ind. J. 4:62-69.Aung, L.H., J.L. Smilanick, P.V. Vail, P.L. Hartsell, and E. Gomez.
1996. Investigations into the origin of chloroanisoles causing musty off-f lavor of raisins. J. Agric. Food Chem. 44:3294-3296.
Bianchi, F., M. Careri, A. Mangia, and M. Musci. 2003. Optimiza-tion of headspace sampling using solid-phase microextraction for chloroanisoles in cork stoppers and gas chromatography–ion-trap tandem mass spectrometric analysis. J. Sep. Sci. 26:369-375.
Bianco, G., G. Novario, R. Zianni, and T.R.I. Cataldi. 2009. Com-parison of two SPME fibers for the extraction of some off-f lavor cork-taint compounds in bottled wines investigated by GC-HRMS. Anal. Bioanal. Chem. 393:2019-2027.
Boutou, S., and P. Chatonnet. 2007. Rapid headspace solid-phase microextraction/gas chromatographic/mass spectrometric assay for the quantitative determination of some of the main odorants causing off-f lavours in wine. J. Chromatogr., A 1141:1-9.
Figure 1 Sample chromatogram of consumer complaint wine A (Table 5). Calculated TCA level 2.3 ng/L.
Table 6 Comparison of validated triple quadrupole tandem MS method with ion trap tandem MS method for two tainted wines.
Measured TCA concna (ng/L)Method Wine 1 Wine 2Ion trap 39.8 26.4Triple quadrupole MS/MSb 43.2 ± 0.9 24.7 ± 0.5aNo other haloanisoles were reported by the commercial lab. For wine 1, no other haloanisoles were detected using the quadrupole MS method. For wine 2, the quadrupole MS method detected TeCA and PCA at 0.48 and 0.73 ng/L, respectively. TBA was detected but the concentration was <LOQ.
bSamples analyzed in triplicate.
Table 5 Haloanisole concentrations in three tainted wines.
Measured concn in ng/L (% RSD)Analyte Wine A Wine B Wine CTCA 2.3 (4.5) 9.9 (3.4) 6.8 (5.6)TeCA 0.18 (6.9) 0.16 (0.7) 0.17 (3.5)PCA 0.41 (18) nda 0.26 (9.0)TBA nda 0.65 (1.8) 0.73 (1.8)and: not detected, below limit of detection.
Table 4 Haloanisole spiked recovery and reproducibility in wines.Measured value
Analyte/ wine
Amount spiked (ng/L)
In blank (ng/L)
After spike (ng/L)
Spiked recovery
(%)RSD (%)
TCAPetite Syrah 1.0
5.0nda 0.94
4.79494
2.54.7
Sauvignon blanc 1.05.0
nd 0.934.8
9397
112.2
Gewürztraminer 1.05.0
<LOQ 1.05.0
9799
174.8
Riesling 1.05.0
nd 1.04.9
10398
9.15.5
Cabernet Sauvignon
1.05.0
nd 1.15.1
106102
6.11.3
TeCAPetite Syrah 1.0
5.00.7 1.1
5.5109110
134.2
Sauvignon blanc 1.05.0
nd 1.04.6
9891
3.72.8
Gewürztraminer 1.05.0
nd 1.05.2
103104
5.59.9
Riesling 1.05.0
nd 1.05.2
100104
4.13.3
CabernetSauvignon
1.05.0
nd 1.05.4
102108
2.01.3
PCAPetite Syrah 1.0
5.0nd 1.0
5.196
1039.03.6
Sauvignon blanc 1.05.0
nd 1.05.2
105103
8.93.2
Gewürztraminer 1.05.0
nd 1.05.3
105106
2.72.6
Riesling 1.05.0
nd 1.14.8
10897
1.92.2
CabernetSauvignon
1.05.0
nd 1.15.3
109107
6.04.7
TBAPetite Syrah 1.0
5.0nd 1.1
5.3109107
159.7
Sauvignon blanc 1.05.0
nd 1.05.1
104102
114.1
Gewürztraminer 1.05.0
nd 1.05.1
103102
3.22.3
Riesling 1.05.0
nd 1.05.3
104106
9.70.4
Cabernet Sauvignon
1.05.0
nd 1.15.0
106101
7.77.3
and: not detected, below limit of detection.

Haloanisole Analysis in Wines – 499
Am. J. Enol. Vitic. 63:4 (2012)
Buser, H.R., C. Zanier, and H. Tanner. 1982. Identification of 2,4,6-tri-chloroanisole as a potent compound causing cork taint in wine. J. Agric. Food Chem. 30:359-362.
Chatonnet, P., S. Bonnet, S. Boutou, and M.D. Labadie. 2004. Identi-fication and responsibility of 2,4,6-tribromoanisole in musty, corked odors in wine. J. Agric. Food Chem. 52:1255-1262.
Chatonnet, P., G. Guimberteau, D. Dubourdieu, and J. Boidron. 1994. Nature et origine des odeurs de “moisi” dans les caves. Incidences sur la contamination des vins. J. Int. Sci. Vigne Vin 28:131-151.
Collins, T.S., A. Hjelmeland, and S.E. Ebeler. 2012. Analysis of haloanisoles in corks and wines. In Recent Advances in Analysis of Food and Flavors. S. Toth and C.J. Mussinan (eds.), pp. 109-127. Am. Chemical Society, Washington, DC.
Curtis, R.F., C. Dennis, J.M. Gee, M.G. Gee, N.M. Griffiths, D.G. Land, J.L. Peel, and D. Robinson. 1974. Chloroanisoles as a cause of musty taint in chickens and their microbiological formation from chlorophenols in broiler house litters. J. Sci. Food Agric. 25:811-828.
Daniels-Lake, B.J., R.K. Prange, S.O. Gaul, K.B. McRae, R. de Antueno, and D. McLachlan. 2007. A musty “off” f lavor in Nova Scotia potatoes is associated with 2,4,6-trichloroanisole released from pesticide-treated soils and high soil temperature. J. Am. Soc. Hort. Sci. 132:112-119.
Duerr, P. 1985. Wine quality evaluation. In Proceedings of the Inter-national Symposium on Cool Climate Viticulture and Enology. D.A. Heatherbell et al. (eds.), pp. 25-28. Oregon State University, Corvallis.
Ebeler, S.E. 2012. Gas chromatographic analysis of wines: Current ap-plications and future trends. In Handbooks in Separation Science: Gas Chromatography. C.F. Poole (ed.), pp 689-710. Elsevier, Amsterdam.
Engel, C., A. De Groot, and C. Weurman. 1966. Tetrachloroanisol: A source of musty taste in eggs and broilers. Science 154:270.
Evans, T.J., C.E. Butzke, and S.E. Ebeler. 1997. Analysis of 2,4,6-tri-chloroanisole in wines using solid-phase microextraction coupled to gas chromatography-mass spectrometry. J. Chromatogr., A 786:293-298.
Fischer, C., and U. Fischer. 1997. Analysis of cork taint in wine and cork material at olfactory subthreshold levels by solid phase micro-extraction. J. Agric. Food Chem. 45:1995-1997.
Fox, S. 2009. Report claims less than 1 percent of corks are noticeably tainted. Wine Spectator (www.winespectator.com/webfeature/show/id/40516; posted 20 Aug 2009).
Hodin, F., H. Boren, A. Grimvall, and S. Karlsson. 1991. Formation of chlorophenols and related compounds in natural and technical chlorination processes. Water Sci. Technol. 24:403-410.
Jönsson, S., T. Uusitalo, B. van Bavel, I.B. Gustafsson, and G. Lind-ström. 2006. Determination of 2,4,6-trichloroanisole and 2,4,6-tri-bromoanisole on ng L-1 to pg L-1 levels in wine by solid-phase microextraction and gas chromatography-high-resolution mass spectrometry. J. Chromatogr., A 1111:71-75.
Liacopoulos, D., D. Barker, P.R. Howland, D.C. Alcorso, A.P. Pollnitz, G.K. Skouroumounis, K.H. Pardon, H.J. McLean, R. Gawel, and M.A. Sefton. 1999. Chloroanisole taint in wines. In Proceedings of the Tenth Australian Wine Industry Technical Conference. Sydney, NSW, August 1998. R. J. Blair et al. (eds.), pp. 224-226. Australian Wine Industry Technical Conference, Urrbrae.
Maggi, L., A. Zalacain, V. Mazzoleni, G.L. Alonso, and M.R. Salinas. 2008. Comparison of stir bar sorptive extraction and solid-phase microextraction to determine halophenols and haloanisoles by gas chromatography-ion trap tandem mass spectrometry. Talanta 75:753-759.
McCoy, M. 2010. J&J recalls tainted Tylenol. Chem. Eng. News 88(4):18.Miki, A., A. Isogai, H. Utsunomiya, and H. Iwata. 2005. Identification
of 2,4,6-trichloroanisole (TCA) causing a musty/muddy off-f lavor in sake and its production in rice koji and moromi mash. J. Biosci. Bioeng. 100:178-183.
Milo, C., and I. Blank. 1998. Quantification of impact odorants in food by isotope dilution assay: Strengths and limitations. In Flavor Analysis. C.J. Mussinan and M.J. Morello (eds.), pp. 250-259. Am. Chemical Society, Washington, DC.
Nyström, A., A. Grimvall, C. Krantz-Rüilcker, R. Sävenhed, and K. Åerstrand. 1992. Drinking water off-f lavour caused by 2,4,6-tri-chloroanisole. Water Sci. Technol. 25:241-249.
Peña-Neira, A., B. Fernández de Simón, M.C. Garcia-Vallejo, T. Hernández, E. Cadahía, and J.A. Suarez. 2000. Presence of cork-taint responsible compounds in wines and their cork stoppers. Eur. Food Res. Technol. 211:257-261.
Polaskova, P., J. Herszage, and S.E. Ebeler 2008. Wine f lavor. Chem-istry in a glass. Chem. Soc. Rev. 37:2478-2489.
Prescott, J., L. Norris, M. Kunst, and S. Kim. 2005. Estimating a “consumer rejection threshold” for cork taint in white wine. Food Qual. Pref. 16:345-349.
Ramstad, T., and J.S. Walker. 1992. Investigation of musty odour in pharmaceutical products by dynamic headspace gas chromatography. Analyst 117:1361-1366.
Rudy, H., and G. Scholten. 2005. Neue Analytik schützt moderne Rieslingweine. Deutsche Weinbau 3 (11.2.2005):26-27.
Schmarr, H.G., S. Koschinski, W. Sang, and P. Slabizki. 2012. Trace level analysis of corky off-f lavor compounds: Development of an analytical method based on solid phase extraction and analysis by multidimensional gas chromatography with mass spectrometric detection. J. Chromatogr., A 1226:96-102.
Seitz, L.M., M. Ram, and R. Rengarajan. 1999. Volatiles obtained from whole and ground grain samples by supercritical carbon dioxide and direct helium purge methods: Observations on 2,3-butanediols and halogenated anisoles. J. Agric. Food Chem. 47:1051-1061.
Simpson, R.F., and M.A. Sefton. 2007. Origin and fate of 2,4,6-tri-chloroanisole in cork bark and wine corks. Aust. J. Grape Wine Res. 13:106-116.
Sponholz, W.R., A. Hoffman, F. David, and P. Sandra. 2001. Detec-tion of corkiness in wine by analysis of 2,4,6-trichloroanisole with stir bar sorptive extraction (SBSE) and thermal desorption GC/MS. Mitteilungen Klosterneuburg 51:248-253.
Stoffelsma, J., and K. De Roos. 1973. Identification of 2,4,6-trichlo-roanisole in several essential oils. J. Agric. Food Chem. 21:738-739.
Sung, Y.H., T.Y. Li, and S.D. Huang. 2005. Analysis of earthy and musty odors in water samples by solid-phase microextraction coupled with gas chromatography/ion trap mass spectrometry. Talanta 65:518-524.
Vieira Neto, P., S.M. Rocha, and A.J.D. Silvestre. 2007. Simultaneous headspace solid phase microextraction analysis off-f lavour com-pounds from Quercus suber L. cork. J. Sci. Food Agric. 87:632-640.
Wang, H., and A. Viven. 2010. Ultra-trace analysis of 2,4,6-trichloro-anisole in white wine using automated solid phase microextraction (SPME) and the Varian 240-MS ion trap mass spectrometer and V:Results GC/MS software. Note SI-02373. Agilent Technologies, Santa Clara, CA.
Whitfield, F.B., J.L. Hill, and K.J. Shaw. 1997. 2,4,6-Tribromoanisole: A potential cause of mustiness in packaged food. J. Agric. Food Chem. 45:889-893.