Embed Size (px)
Citation preview

ORIGINAL PAPER
High-throughput sequencing of African chikanda cakehighlights conservation challenges in orchids
Sarina Veldman1 • Barbara Gravendeel2,3 • Joseph N. Otieno4 •
Youri Lammers2 • Elza Duijm2• Aline Nieman2 •
Benny Bytebier5 • Grace Ngugi5 • Florent Martos5 •
Tinde R. van Andel2,6 • Hugo J. de Boer1,2,7
Received: 14 July 2016 / Revised: 18 March 2017 /Accepted: 30 March 2017 /Published online: 1 April 2017� The Author(s) 2017. This article is an open access publication
Abstract Chikanda is a traditional dish made with wild-harvested ground orchid tubers
belonging to three orchidioid genera, Disa, Satyrium and Habenaria, all of which are
CITES appendix II-listed. Identification of collected orchid tubers is very difficult and
documentation of constituent species in prepared chikanda has hitherto been impossible.
Here amplicon metabarcoding was used in samples of six prepared chikanda cakes to study
genetic sequence diversity and species diversity in this product. Molecular operational
taxonomic unit identification using similarity-matching reveals that species of all three
genera were present in the chikanda samples studied. Disa was present in all of the
samples, Satyrium in five out of six and Habenaria in one of the samples, as well as a
number of other plants. The fact that each sample contained orchids and the presence of a
wide variety of species from all genera in this traditional dish raise serious concerns about
the sustainability of this trade and the future of wild orchid populations in the main harvest
areas. This proof-of-concept study shows that Ion-Torrent PGM is a cost-effective scalable
platform for metabarcoding using the relatively long nrITS1 and nrITS2 regions.
Communicated by Daniel Sanchez Mata.
Electronic supplementary material The online version of this article (doi:10.1007/s10531-017-1343-7)contains supplementary material, which is available to authorized users.
& Hugo J. de [email protected]
1 Department of Organismal Biology, Uppsala University, Norbyvagen 18D, 75236 Uppsala, Sweden
2 Naturalis Biodiversity Center, Darwinweg 2, 2333 CR Leiden, The Netherlands
3 University of Applied Sciences Leiden, Leiden, The Netherlands
4 Institute for Traditional Medicine, Muhimbili University of Health and Allied Sciences,Dar es Salaam, Tanzania
5 School of Life Sciences, University of KwaZulu-Natal, Pr. Bag X01, Scottsville 3209, South Africa
6 Wageningen University and Research, Wageningen, The Netherlands
7 Natural History Museum, University of Oslo, P.O. Box 1172, Blindern, 0318 Oslo, Norway
123
Biodivers Conserv (2017) 26:2029–2046DOI 10.1007/s10531-017-1343-7

Furthermore, nrITS metabarcoding can be successfully used for the detection of specific
ingredients in a highly-processed food product at genus level, and this makes it a useful
tool in the detection of possible conservation issues arising from commercialized trade or
processed plant products.
Keywords CITES � Disa � Ethnobotany � Habenaria � Ion-Torrent PGM � Satyrium �Wildlife forensics
Introduction
Chikanda is a traditional dish that consists primarily of wild-harvested terrestrial orchid
tubers and peanuts (Davenport and Ndangalasi 2001). This meatloaf-like dish is prepared
by mixing ground orchid tubers with peanut flour, boiling and thickening the mixture in
water and subsequent baking (Veldman et al. 2014). For many years, ethnic groups in
northeastern Zambia and in adjacent provinces in Tanzania, the Democratic Republic of
Congo and Malawi have been known to consume chikanda in times of famine or as a
seasonal addition to their dietary staples (Richards 1939; Cribb and Leedal 1982; Bingham
and Smith 2002; Davenport and Ndangalasi 2003; Kasulo et al. 2009). Over the past
decades, however, chikanda has gained popularity throughout the country as a nutritious
snack. Whereas tubers used to be harvested on a household scale and presumably without
the sustainability of local orchid populations being affected, they are now commercially
harvested in large amounts to meet increasing demand (Davenport and Ndangalasi 2001;
Bingham 2004). As a result, Zambian orchid resources are declining rapidly, and traders
are driven to obtain their tubers from further afield (Davenport and Ndangalasi 2003;
Bingham 2004; Veldman et al. 2014). The majority of commercialized tubers in the main
market of Zambia’s Capital City Lusaka originate from the Southern Highlands of Tan-
zania (Bingham 2004). In addition to this, significant quantities of the tubers are now also
coming from Angola, the Democratic Republic of the Congo, Malawi and Mozambique
(Veldman et al. 2014). Despite the fact that all orchids are CITES appendix II listed (2014),
and thus their international trade is subject to specific rules and permits, an estimated
2.2–4.0 million orchid tubers are illegally exported from Tanzania to Zambia each year,
and a total of 85 terrestrial orchid species are identified to be at risk of overharvesting
(Davenport and Ndangalasi 2003; Veldman et al. 2014). Inevitably, this enormous pressure
on Tanzanian orchid populations is unsustainable, and Tanzanian collectors are increas-
ingly forced to look for alternative collection sites further away (Davenport and Ndangalasi
2003; Nyomora 2005; Challe and Price 2009).
The orchids used for chikanda are mainly species belonging to three terrestrial orchid
genera: Disa, Satyrium and Habenaria (Cribb and Leedal 1982; Bingham and Smith 2002;
Davenport and Ndangalasi 2003). Challe and Price (2009) show that chikanda collectors
preferentially collect Disa robusta, followed by Satyrium trinerve (syn: Satyrium ather-
stonei) and Habenaria xanthochlora. However, previous preferences for specific terrestrial
orchid species are no longer apparent since collectors have started to harvest tubers
indiscriminately (Bingham 2004). Other sources corroborate a preference for the genus
Disa and specifically for wetland species of this genus (Davenport and Ndangalasi 2001;
Nyomora 2005; Hamisy 2008; Challe and Price 2009). Habenaria and Satyrium species are
also mentioned, but they are considered to be of inferior quality (Richards 1939; Davenport
2030 Biodivers Conserv (2017) 26:2029–2046
123

and Ndangalasi 2001; Bingham 2004; Nyomora 2005; Hamisy 2008; Challe and Price
2009). Recent surveys, however, have shown that more rare, dryland and forest species are
now harvested because of local scarcity, as well as species from the genera Brachycorythis
(Hamisy 2008), Eulophia (Hamisy 2008) and Roeperocharis (Hamisy 2008; Challe and
Price 2009).
Species-level identification of the tubers that are being used for chikanda is a major
challenge, and it remains unclear exactly which species are collected. This is mainly
caused by a lack of distinctive morphological characteristics of the tubers and is exacer-
bated as most are harvested after the flowering season, leaving few or no fertile characters
for specimen identification in the field. Moreover, once the tubers enter the market chain, it
becomes impossible to discriminate between tubers of different orchid species, and even
attempting to distinguish them at the genus level is prone to errors (Davenport and
Ndangalasi 2003). Collectors and traders of orchid tubers for chikanda are known to have
various local classifications of these tubers based on vernacular names. Collectors dis-
tinguish real chikanda tubers that yield a solid, gelatinous texture, and msekelele chikanda
tubers that yield a crumbling, coarser product that is considered of inferior quality. Another
way for people to distinguish between the tubers is based on the type of soil from which
they were harvested (Davenport and Ndangalasi 2003). However, several problems might
occur when these local classifications are to be translated into scientific classifications
(Otieno et al. 2015). In previous studies tubers were either collected for propagation to
allow for the identification of flowering specimens (Nyomora 2005), or species assess-
ments were made by accompanying collectors in the field during the flowering season and
asking them to point out which species are considered edible (Davenport and Ndangalasi
2003; Challe and Price 2009). These methods can be effective, but they are time con-
suming and capture only the diversity of species collected by people in selected study
areas.
The use of DNA barcoding and metabarcoding for the identification of commercialized
plant products has evolved with advances in molecular biology and sequencing (Coghlan
et al. 2012; Kool et al. 2012; Cheng et al. 2014; de Boer et al. 2014). Metabarcoding
combines DNA barcoding and high-throughput sequencing (Taberlet et al. 2012). Most
metabarcoding studies focusing on plants have used the plastid trnL P6 loop, as it has high
primer universality, short amplicon length, high stability and high sequence variation. The
combination of these characteristics has made trnL P6 the marker of choice for ancient
DNA and ancient sediment DNA metabarcoding studies (Jørgensen et al. 2012; Parducci
et al. 2012; Taberlet et al. 2012; Boessenkool et al. 2014; Willerslev et al. 2014). The use
of nrITS1 and nrITS2 has been limited due to the shorter read length of previous high-
throughput sequencing platforms, but the markers are more variable and have a greater
potential for identification at finer taxonomic scales than the shorter and less variable trnL
P6 loop. The higher level of sequence variation is important for identification of orchids
that often have limited interspecific variation (van der Niet et al. 2005; Bytebier et al. 2007;
van der Niet and Linder 2008).
Several metabarcoding studies have been published that use nrITS1 or nrITS2 for the
identification of fungi (Epp et al. 2012; Blaalid et al. 2013; Schmidt et al. 2013; De Beeck
et al. 2014). So far the only plant studies to use nrITS in metabarcoding have used nrITS2
to determine the taxonomic composition of pollen collected by honey bees (Galimberti
et al. 2014; Richardson et al. 2015) and species composition in herbal medicines (Cheng
et al. 2014; Ivanova et al. 2016).
This study takes a novel approach by focusing on nrITS metabarcoding of a highly
processed and complex product: prepared orchid chikanda. DNA barcoding for species
Biodivers Conserv (2017) 26:2029–2046 2031
123

identification has so far not been attempted in African orchid trade, and identification of the
constituent species in prepared chikanda has hitherto been impossible. Species level
identification of orchid species used in prepared chikanda would allow us to identify the
species that are targeted most, detect the presence of rare, threatened or narrow endemics,
and enable us to identify priority species for conservation efforts. The objectives of this
study were to provide useful and accurate assessments of which orchid genera are included
in chikanda, while also producing useful estimates of species diversity in these samples.
We hypothesize that nrITS metabarcoding of chikanda cake will allow species level
identification of the species used in chikanda cake. If this approach proves to be suit-
able we further hypothesize that this data can provide useful input to determining which
species might be at risk of overharvesting and which species should be prioritized for
conservation. This method may also be applicable to the analysis of the ingredients in other
processed plant products.
Materials and methods
Research was conducted in the Southern Highlands of Tanzania in the Mbeya, Njombe and
Sumbawanga regions. The mountainous grasslands of the Southern Highlands have been
long recognized for their floral diversity and high level of endemism (Hedberg 1957; Cribb
and Leedal 1982; Davenport and Ndangalasi 2003). The area is home to over 85 terrestrial
orchid species, of which at least 31 are national or near-national endemics. The area, and in
particular the Kitulo Plateau, has been under continuous harvesting pressure by chikanda
tuber collectors for several decades (Davenport and Ndangalasi 2003). In 2004, the Kitulo
Plateau was established as a national park with the specific aim of protecting its rich
botanical biodiversity. Although this has not led to a complete stop of orchid harvesting
from Kitulo, much less harvesting is reported to now take place in the protected area
(Davenport and Bytebier 2004).
Surveys at local markets in Tunduma at the Tanzania–Zambia border were carried out
February and September 2013. Vendors were interviewed informally about the seasonality
of the trade and additional information about chikanda availability. February and
September are outside the harvesting season for chikanda tubers, but during in February we
found five people on either side of the border selling unprocessed orchid tubers, prepared
chikanda or both. In September no vendors were observed selling ready-made chikanda
and only three market vendors were selling unprocessed orchid tubers. Informal interviews
with informants involved in the chikanda trade revealed that in February only lesser quality
msekelele tubers were available, and in September supply by the collectors was limited to
once a week or fortnight. They indicated that the peak-season for chikanda was in June–
July, when they receive new chikanda tuber supplies every other day.
In February, ready-made chikanda samples were purchased at the market from three
different vendors (chikanda 1–3), and in September we organized chikanda to be prepared
on location by two local cooks using tubers bought in the market (chikanda 4–6). Two
chikanda cakes were made with tubers purchased as real chikanda (chikanda 4 and 6), and
a third was made with msekelele chikanda tubers (chikanda 5). Small pieces of prepared
chikanda were collected in silica gel for DNA extraction and entire vouchers were stored in
70% EtOH. Additional information, about availability of the tubers and preferred har-
vesting time, was collected through informal interviews in Swahili with 14 informants
2032 Biodivers Conserv (2017) 26:2029–2046
123

involved in chikanda collection or trade in Tunduma and Sumbawanga in Tanzania, and
Nakonde and Chihanga in Zambia.
Samples were stored at room temperature prior to DNA extraction. To reduce the risk of
contamination, the outer layer of each chikanda sample was removed before homoge-
nization. Samples were homogenized using a Retsch mill (Retsch GmbH, Germany). DNA
was extracted from the homogenized samples using two modified standard methods: silica-
based extraction (Rohland and Hofreiter 2007) and CTAB extraction (Doyle and Doyle
1987). In the CTAB extractions, polysaccharides from the starch-rich orchid tubers formed
a gelatinous substance during the CTAB-incubation step, and this gel caused difficulties
during subsequent mixing with the chloroform–isoamyl alcohol and resulted in a relatively
low yield of DNA from the water phase after centrifugation. In silica-based extractions,
unprocessed tuber samples also formed a gel in the extraction buffer, which resulted in a
low yield of DNA from the extraction. DNA purification was performed using a QIAquick
PCR purification kit (Qiagen NV, The Netherlands). DNA concentration and purity were
measured using a NanoDrop (ThermoFischer Scientific, USA). Extracted DNA yields
ranged from 2.1 to 102.4 ng/ll and quality values varied between 1.2 and 2.44 (260/280
ratio).
Amplicons were generated from the nuclear ribosomal internal transcribed spacers
nrITS1 and nrITS2 using primers 17SE and 5.8I1, and 5.8I2 and 26SE, respectively (Sun
et al. 1994). PGM forward primers were labeled with unique -MIDx tags and reverse
primers with uniform -trP1 tags. Thermal cycling was carried out in 25 ll reaction vol-
umes, and each reaction contained 5 ll Phire 59 PCR buffer, 5 ll 59 TBT-PAR (Sa-
marakoon et al. 2013), 0.25 lM of each primer, 1 ll of 10 mM dNTP, 0.5 ll of 4 U/llPhire hsTaq polymerase, 8.5 ll of milliQ (Ultrapore) H2O and 3 ll of template DNA. The
following PCR protocol was used: 40 s of initial denaturation at 98 �C, followed by 35
cycles of 98 �C for 5 s, 50 �C for 20 s, 72 �C for 15 s, followed by a final extension step of
60 s at 72 �C. After PCR amplicons were cleaned and selected with 0.99 Agencourt
AMpure beads following standard protocol. An equimolar pool concentration of these
eluted amplicons was made through measurement on a Bioanalyser using a DNA 1000 chip
(Agilent). Equimolar pools were then measured on the Bioanalyser with a high sensitivity
chip and diluted according to the calculated template dilution factor to target 10–30% of all
positive ISPs. The template preparation of this pool was carried out on an Ion One Touch
instrument with the Ion PGM Template OT2 400 kit (Life Technologies) according to
manual 7218 v3.0. The ion sphere quality control kit was used to check quality of the Ion
One Touch2 400 ion sphere particles on a Life Qubit 2.0. The ion sphere’s were loaded on
a 314 chip v2 and sequenced with the ion PGM sequencing 400 kit (Life Technologies) on
an Ion-Torrent personal genome machine (Life Technologies, ThermoFischer Scientific,
USA).
Sequencing reads were processed using the HTS-barcode-checker pipeline (Lammers
et al. 2014) available as a Galaxy pipeline at the Naturalis Biodiversity Center (http://145.
136.240.164:8080/). Using the HTS pipeline, adapters were removed, and ITS1 and ITS2
primer sequences were used to demultiplex the sequencing reads per sample and to filter
out reads that did not match any of the primers. PRINSEQ (Schmieder and Edwards 2011)
was used to determine filtering and trimming values based on read lengths and Phred read
quality (Ewing and Green 1998). All reads with a mean Phred quality score of less than 25
were filtered out, as well as reads with a length of less than 200 bp. Remaining reads were
trimmed to a maximum length of 360 bp. CD-HIT-EST (Li and Godzik 2006) was used to
cluster reads into molecular operational taxonomic units (MOTUs) defined by a sequence
similarity of[99% and a minimum number of 2 reads. The consensus sequences of non-
Biodivers Conserv (2017) 26:2029–2046 2033
123

singleton MOTUs were queried using BLAST (Altschul et al. 1990) against a local copy of
the NCBI/GenBank nucleotide database, with a maximum e-value of 0.05, a minimum hit
length of 100 bp and sequence identity of[97%. The number of reads per MOTU as well
as the BLAST results per MOTU were compiled using custom scripts from the HTS
Barcode Checker pipeline (Lammers et al. 2014). A separate identification run was per-
formed with the complementary Habenaria dataset, to detect the presence of African
Habenaria species.
A sequence reference database was compiled from all publicly available nuclear
internal transcribed spacer (nrITS) sequences from the online repository NCBI GenBank,
including numerous sequences of the chikanda orchid genera Disa (149 accessions—
corresponding to 129 species, including 13 of the 29 Disa species occurring in Tanzania),
Satyrium (127 accessions—corresponding to 63 species, including 27 of the 36 Satyrium
species occurring in Tanzania) and Habenaria (335 accessions—corresponding to 100
species, of which most are from the Neotropics and 9 from Africa), as well as accessions
from several additional orchid genera suspected to be used in chikanda. Since most of the
nrITS sequences in NCBI GenBank for Habenaria belonged to Neotropical species the
database was complemented with 88 as yet unpublished nrITS sequences of African
Habenaria species that form part of the PhD research of G. Ngugi from the Bytebier Lab
(corresponding to 61 species, including 29 of the 96 Habenaria species occurring in
Tanzania). To determine whether species in these genera could be identified using
MOTUs, the interspecific genetic distance variation of the three genera was analyzed using
SpeciesIdentifier v 1.7.9 (Meier et al. 2006). Prior to analysis with SpeciesIdentifier, the
sequences were automatically aligned using MAFFT (Katoh et al. 2002) as implemented in
AliView (Larsson 2014), and only critically checked GenBank submissions, which were
submitted by renowned orchid experts, were kept for analysis. The weighted homopolymer
ratio (WHR) was calculated to determine if sequencing errors, which are frequent in long
homopolymer regions, would be likely to lead to misidentifications in the later analysis
(Loman et al. 2012). Calculations were performed using the following formula:
WHR =PN
i¼1 n2i
� �=N where n accounts for the length of the homopolymer and N is the
total number of homopolymers in the sequence.
All research was performed following the International Society for Ethnobiology Code
of Ethics (2006). Interviews were conducted after agreeing on prior informed consent with
the informants. Duplicates of collected sample vouchers were deposited at both the
herbarium of the Institute of Traditional Medicine, Muhimbili University of Health and
Allied Sciences (ITMH) in Tanzania and Naturalis Biodiversity Center (L) in the
Netherlands. Permits for both research and export of collected material were obtained from
the Tanzania Commission of Science and Technology (COSTECH), Tanzania Wildlife
Research Institute (TAWIRI), Tanzania National Parks Authority (TANAPA) and the
Phytosanitary Section of the Ministry of Agriculture and Food Security.
Results
Clustering thresholds
Clustering sequencing reads into MOTUs using clustering thresholds lower than most
interspecific genetic distances can result in chimeric MOTUs and inaccurate species
identification. If reads are clustered into MOTUs based on a 97% sequence similarity, then
2034 Biodivers Conserv (2017) 26:2029–2046
123
one assumes that species within the target genus have a sequence similarity of less than
97%, but this might not be the case among recently diverged species. As a consequence, a
single MOTU might contain more than one species and thus overlook species diversity in
the studied mixture. Pairwise comparisons of the genetic distances of the nrITS sequences
of the studied genera were created to determine interspecific variation and the suitability of
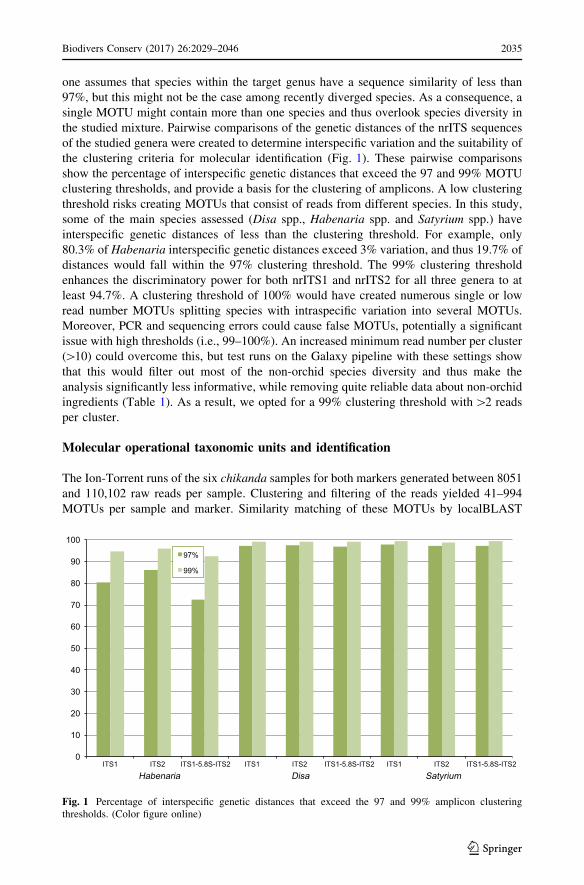
the clustering criteria for molecular identification (Fig. 1). These pairwise comparisons
show the percentage of interspecific genetic distances that exceed the 97 and 99% MOTU
clustering thresholds, and provide a basis for the clustering of amplicons. A low clustering
threshold risks creating MOTUs that consist of reads from different species. In this study,
some of the main species assessed (Disa spp., Habenaria spp. and Satyrium spp.) have
interspecific genetic distances of less than the clustering threshold. For example, only
80.3% of Habenaria interspecific genetic distances exceed 3% variation, and thus 19.7% of
distances would fall within the 97% clustering threshold. The 99% clustering threshold
enhances the discriminatory power for both nrITS1 and nrITS2 for all three genera to at
least 94.7%. A clustering threshold of 100% would have created numerous single or low
read number MOTUs splitting species with intraspecific variation into several MOTUs.
Moreover, PCR and sequencing errors could cause false MOTUs, potentially a significant
issue with high thresholds (i.e., 99–100%). An increased minimum read number per cluster
([10) could overcome this, but test runs on the Galaxy pipeline with these settings show
that this would filter out most of the non-orchid species diversity and thus make the
analysis significantly less informative, while removing quite reliable data about non-orchid
ingredients (Table 1). As a result, we opted for a 99% clustering threshold with[2 reads
per cluster.
Molecular operational taxonomic units and identification
The Ion-Torrent runs of the six chikanda samples for both markers generated between 8051
and 110,102 raw reads per sample. Clustering and filtering of the reads yielded 41–994
MOTUs per sample and marker. Similarity matching of these MOTUs by localBLAST
0
10
20
30
40
50
60
70
80
90
100
ITS1 ITS2 ITS1-5.8S-ITS2 ITS1 ITS2 ITS1-5.8S-ITS2 ITS1 ITS2 ITS1-5.8S-ITS2
97%
99%
SatyriumHabenaria Disa
Fig. 1 Percentage of interspecific genetic distances that exceed the 97 and 99% amplicon clusteringthresholds. (Color figure online)
Biodivers Conserv (2017) 26:2029–2046 2035
123

Table
1ComparisonofMOTU
analysesfornrITS2Ion-Torrentrunsofsixchikandacakes
withdifferentminim
um
read
thresholdsper
cluster
Chikanda
samples
#MOTUs
[2reads
percluster
%BLAST
identification
#MOTUs
[5reads
per
cluster
%BLAST
identification
Changes
compared
to[2reads
analysis
#MOTUs
[10
readsper
cluster
%BLAST
identification
Changes
cpto[2and[5reads
analyses
1247
96.36
198
95.96
Only
Disaochrostachya
clusters,no
Arachishypogaea
orDisa
erubescens
95
95.79
Only
Disaochrostachya
clusters,no
Arachishypogaea
orDisa
erubescens
241
58.54
13
53.85
Only
Satyrium
andAerococcus
viridansdetectable.NoArachis
hypogaea
orIpomoea
batatas
clustersdetectable
955.56
Only
Satyrium
andAerococcus
viridansdetectable.NoArachis
hypogaea
orIpomoea
batatas
clustersdetectable
3994
44.16
498
44.18
NoSatyrium
carsonii,S.
coriophoroides,S.sacculatum,
BidensalbaorBurkholderia
detectable
230
51.30
Habenariaclavata
isnolonger
detectable
4288
81.25
151
90.07
NoMusa
andDioscoreadetectable
78
89.74
Only
Disaochrostachya
andtwo
Satyrium
detectable,noTriticum
andnoDisasatyriopsis
5262
92.37
163
89.57
NoSatyrium
volkensii,Dioscorea
polystachya
orElymustauri
detectable
75
94.67
Disaornithanthanolonger
detectable.NoAegilopsbiuncialis
orEleusinecoracana
6351
90.31
158
95.57
NoArachis
hypogaea
detectable
81
97.53
NoArachis
hypogaea
detectable
Readlength[200bp,[
99%
similarityclustering
2036 Biodivers Conserv (2017) 26:2029–2046
123

using our tailored sequence reference databases yielded hits for 34.66–88.01% of the
MOTUs (Table 2). The WHR for the three orchid genera did not exceed two, which
indicates that it unlikely that homopolymer runs would account for a significant raise in
sequencing errors.
Species composition in chikanda
For nrITS2 a total of 1482 MOTUs were matched using BLAST sequence similarity to 35
plant taxa. The BLAST identifications included at least 17 orchid species: ten Satyrium
species, 6 Disa spp., and 1 Habenaria species (Table 3). The combined results for nrITS2
MOTUs from the six chikanda samples show that Disa MOTUs account for 59% of the
reads, Satyrium MOTUs for 30%, Habenaria MOTUs for just 0.1% and other MOTUs for
another 11%. Nearly all (99.99–100%) nrITS1 MOTUs were identified as peanut (Arachis
hypogaea). Only two MOTUs, one in chikanda sample 1 and one in sample 4, were
identified differently: as Serratia plymuthica, a gram-negative bacterium. No other species
were detected using the nrITS marker. The nrITS2 MOTUs yielded primarily orchid hits,
but also species from several other families. The separate BLAST run on the African
Habenaria database reveals the presence of two additional Habenaria species in chikanda
sample 3. All chikanda samples show GenBank hits with Habenaria when we run a local
BLAST search with our separate database, but most hits are from fragments of 106 to
116 bp and a sequence identity percentage (97.17–98.11%). In chikanda 3, however, three
MOTUs are identified as Habenaria with a hit length of 341, 343, 341 bp and a sequence
identity percentage of 97.95, 98.54, 99.41%, respectively. Two out of three MOTUs have
shared top hits in the BLAST search. One has a shared top hit (341 bp hit length, 99.41%
sequence identity) for Habenaria microsaccos, Habenaria macrostele and Habenaria
kyimbilae, and the other a shared top hit (341 bp hit length and 97.95% sequence identity)
for Habenaria tenuispica and Habenaria praestans. The third MOTU is identified as
Habenaria clavata (343 bp hit length, 98.54% sequence identity), but has a close follow-
Table 2 Overview of Ion-Torrent PGM results for nrITS sequences in all six chikanda samples
Sample # # Raw reads % Filteredreads
# MOTUs # Non singletonMOTUs
% BLAST hitreads (filtered)
1 ITS1 18,266 67.87 2346 472 76.44
1 ITS2 30,191 31.79 1493 247 84.69
2 ITS1 22,846 63.07 2610 555 74.05
2 ITS2 8051 10.91 242 41 50.8
3 ITS1 18,668 64.01 2164 480 73.37
3 ITS2 110,102 21.42 5815 994 34.66
4 ITS1 23,702 64.93 2357 518 78.41
4 ITS2 22,975 34.39 1789 288 71.63
5 ITS1 21,876 69.06 2328 547 77.63
5 ITS2 24,943 57.75 2633 351 81.12
6 ITS1 22,313 64.47 2140 500 80.09
6 ITS2 17,377 74.28 1456 262 88.01
Read length[200 bp,[99% similarity clustering,[2 reads per cluster
Biodivers Conserv (2017) 26:2029–2046 2037
123

Table 3 Species identified in chikanda samples from amplicon metabarcoding of MOTUs
Ingredients Families Common names, usage Sample #
Plants
Mangifera indica Anacardiaceae Mango, food crop 3
Bidens spp. Asteraceae Traditional medicine 3
Helianthus spp. Asteraceae Sunflower, food crop 5
Cannabis sativa Cannabaceae Marijuana, psycho-active plant 3
Ipomoea batatas Convulvulaceae Sweet potato, food crop 2
Cucurbita maxima Cucurbitaceae Pumpkin, food crop 3
Cucurbita pepo Cucurbitaceae Squash, food crop 2
Dioscorea polystachya Dioscoreaceae Chinese yam, food crop 4–5
Arachis hypogaeaa Fabaceae Peanut, food crop 1–6
Abelmoschus esculentus Malvaceae Okra, food crop 3
Coscinium fenestratum Menispermaceae Medicine (SE Asia) 3
Musa spp. Musaceae Banana/plantain, food crop 4
Disa erubescens Orchidaceae Orchid 1
Disa miniata Orchidaceae Orchid 4–6
Disa ochrostachyaa Orchidaceae Orchid 1–6
Disa robusta Orchidaceae Orchid 3
Disa satyriopsis Orchidaceae Orchid 4–6
Disa aff. similisa Orchidaceae Orchid 3
Habenaria clavataa Orchidaceae Orchid 3
Habenaria macrostelea Orchidaceae Orchid 3
Habenaria praestansa Orchidaceae Orchid 3
Satyrium anomalum Orchidaceae Orchid 3, 5
Satyrium breve Orchidaceae Orchid 2–3
Satyrium carsonii Orchidaceae Orchid 3
Satyrium comptum Orchidaceae Orchid 4–6
Satyrium coriophoroides Orchidaceae Orchid 3
Satyrium elongatum Orchidaceae Orchid 2–6
Satyrium aff. elongatuma Orchidaceae Orchid 2
Satyrium riparium Orchidaceae Orchid 3–6
Satyrium shirense Orchidaceae Orchid 4–6
Satyrium trinerve Orchidaceae Orchid 2, 3
Satyrium aff. trinervea Orchidaceae Orchid 2
Satyrium volkensii Orchidaceae Orchid 3, 5
Eleusine coracana Poaceae African finger millet, food 5
Elymus spp. Poaceae Grass 3, 5
Pseudoroegneria spp. Poaceae Grass 3
Triticum aestivum Poaceae Common wheat, food crop 4, 5
Capsicum annuum Solanaceae Chili pepper, food crop 6
Aquilaria sinensis Thymelaeaceae Medicine (SE Asia) 3
Bacteria
Burkholderia phytofirmans Burkholderiaceae Plant associated bacterium 3
Klebsiella variicola Enterobacteriaceae Human pathogen 3
2038 Biodivers Conserv (2017) 26:2029–2046
123

up in Habenaria gonatosiphon with a hit length of 345 bp and a sequence identity per-
centage of 98.26%.
More species were detected in chikanda sample 3 than in any of the other samples
(Fig. 2), and this includes 12 non-orchid MOTUs that could be identified as food crops,
e.g., Arachis hypogaea (peanut), Abelmoschus esculentus (okra), Mangifera indica
(mango), and Cucurbita maxima and C. pepo (squashes and pumpkins), as well as human
pathogens (Salmonella spp. and Klebsiella spp.). Detection of Aquilaria sinensis, a
southeast Asian sandalwood species that is CITES appendix II listed could be attributed to
unintentional contamination from wildlife forensic DNA barcoding research on Aquilaria
done in the same lab. For the other samples the number of non-orchid MOTUs identified
ranged from one to six, and these were mostly food crops. They included Arachis hypo-
gaea (peanut), Ipomoea batatas (sweet potato), Mangifera indica (mango), Helianthus
annuus (sunflower), Eleusine coracana (African pearl millet) and Capsicum annuum (chili
pepper).
Table 3 continued
Ingredients Families Common names, usage Sample #
Salmonella enterica Enterobacteriaceae Human pathogen 3
Burkholderia cenocepacia Burkholderiaceae Plant associated bacterium 3
Pantoea vagans Enterobacteriaceae Plant associated bacterium 3
Enterobacter cloacae Enterobacteriaceae Human gut flora 3
a See discussion for an evaluation of the identifications
Disa
Disa ochrostachya, 2.7%
Disa robusta, 0.7%
Disa similis, 0.5%
Habenaria
Habenaria clavata, 0.2%
Satyrium
Satyrium anomalum, 1.6%
Satyrium breve, 4.3%
Satyrium carsonii, 0.2%
Satyrium coriophoroides, 0.2%
Satyrium elongatum, 13.2%
Satyrium riparium, 0.7%
Satyrium sacculatum, 0.5%
Satyrium trinerve, 43.4%
Satyrium volkensii, 1.6%Non orchid species
Abelmoschus esculentus, 3.6%
Arachis hypogaea (incl. A. ipaensis), 17.3%
Cannabis sativa, 1.6%
Klebsiella spp., 3.9%
Other, 3.9%
Habenaria praestans, 0.1%Habenaria kyimbilae, 0.1%
Fig. 2 Species composition of chikanda, expressed as relative abundance of nrITS2 amplicon metabar-coding reads per BLAST identified MOTU for chikanda sample 3. (Color figure online)
Biodivers Conserv (2017) 26:2029–2046 2039
123

The MOTU composition of chikanda varied among the samples (Fig. 3). The nrITS2
sequences of chikanda 1, for example, only reveal the presence of three MOTUs, which
resulted in BLAST identifications for Disa ochrostachya, Disa erubescens and Arachis
hypogaea, whereas other samples showed a much higher diversity, ranging from 8 to 27
MOTUs. Besides peanut that was predominant in the nrITS1 reads, Disa MOTUs
accounted for most of the reads in chikanda 1, 4, and 6 (99.6, 94 and 93% of the ITS2
reads, respectively), whereas chikanda 2 and 3 had a larger portion of reads for Satyrium
MOTUs (50 and 66% of ITS2 reads, respectively). Chikanda 5 was the only sample that
appeared to have a nearly equal amount of reads for the two main orchid genera, with 51%
Satyrium and 46% Disa. From all of the chikanda samples only three MOTUs, identified as
species of the genus Habenaria, were found, all present in chikanda 3.
Discussion
The results of the chikanda metabarcoding show that identifications at genus level can be
made unambiguously with nrITS2 metabarcoding. Taxa from all three orchid genera have
been found in the analyzed chikanda cakes. Disa species were present in all of the samples,
Satyrium species in five out of six and Habenaria species in one of the samples. Although a
greater diversity of Satyrium species was found in chikanda, reads of Disa species are far
greater in number. The Satyrium species identified from the chikanda MOTUs account for
Fig. 3 Genus composition of chikanda samples based on relative abundance of nrITS2 ampliconmetabarcoding reads. (Color figure online)
2040 Biodivers Conserv (2017) 26:2029–2046
123

only 30% of all reads, whereas the Disa species account for 59%. Additional tests would
need to be performed to determine if more reads for Disa species could indicate that Disa
species were used in higher quantities or that the higher read number is an artifact of PCR
or sequencing bias. Interestingly, when comparing the species composition of chikanda 4
and 6, which were made with ‘real’ chikanda tubers with the species composition of
chikanda 5, which was made with inferior orchid tubers, it seems to support the idea that
Disa tubers are preferred and that Satyrium tubers are indeed deemed to be of lower
quality, since half of the reads in chikanda 5 were identified as Satyrium species. It should
be noted however, that the read numbers cannot be used to quantify the species compo-
sition of the chikanda cakes, nor to confirm absence of a species, rather, it is likely to
indicate the presence of the species that have been identified. Even though read numbers
cannot reliably be used for quantification, the fact that Disa is present in all of the samples
and the fact that Disa ochrostachya/Disa robusta is the most commonly identified Disa
MOTU, corroborates findings from previous studies in which Disa species were also said
to be used preferentially (Richards 1939; Bingham 2004).
MOTUs identified within the genus Habenaria were present in only one of the six
chikanda samples. This is far less than expected as various papers dealing with chikanda
indicate that the genera Disa, Satyrium and Habenaria are equally affected (Bingham and
Smith 2002; Davenport and Ndangalasi 2003; Bingham 2004; Nyomora 2005; Challe and
Price 2009). Based on the literature it was expected that Habenaria would be present in
chikanda in a similar ratio as Satyrium as a common substitute for the preferred Disa
species. The genus Habenaria was well represented in the reference database used for the
MOTU identification for both nrITS1 and nrITS2, so underrepresentation is unlikely to
have contributed to the low number of Habenaria species found in the chikanda cakes. In
addition, poor primer fit and resulting bias is unlikely as the nrITS1 and nrITS2 sequences
of Habenaria were contributed by one of the co-authors, and these were amplified with the
same primers as used in this study. The tuber morphology of the larger Habenaria species
is very similar to that of Satyrium and Disa, which make it unlikely that Habenaria tubers
are deemed of lower quality. However, it might be that Habenaria species are targeted less
because their inflorescences might break off after flowering and fruiting is over, which
would make it more difficult to spot them in the field. The inflorescences of Disa and
Satyrium, on the other hand, are sturdier and can be spotted even when the flowers have
dried. Another explanation for the prevalence of Disa and Satyrium species above
Habenaria species in chikanda cake might be that Disa ochrostachya, D. erubescens, and
many of the Satyrium species tend to form colonies of plants, whereas Habenaria species
are usually much more scattered. Lastly, it might be possible that Habenaria species are
absent from almost all the chikanda samples because collection of chikanda samples took
place outside of the peak season.
When we look at the MOTU diversity within the orchid cakes, some intriguing results
are found that warrant a closer examination of the identifications. In several of the chi-
kanda samples ambiguous MOTU identifications were found. Disa ochrostachya and Disa
robusta were consistently grouped together as the highest BLAST hit, up to an identity
match of 99.58% for a 323 bp hit length, indicating that the resolution for nrITS2 in this
clade is too low. The species present in the orchid cake could be either one of them, or
both, or a closely related sister species, which has no sequence available in GenBank.
Another clade that shows a resolution ambiguity is that containing Satyrium anomalum, S.
elongatum, S. riparium and S. volkensii. MOTUs identified as any of these species usually
have very similar scores for the lower ranked BLAST hits, and this could indicate that the
species present in the chikanda cake is a closely related species instead. Another
Biodivers Conserv (2017) 26:2029–2046 2041
123

explanation would be that the individual in the cake is from a disparate population (e.g.,
from another country) than the individual present in GenBank and that intraspecific dis-
tance between those populations result in a seemingly less accurate BLAST identification.
Large intraspecific genetic distances and database gaps will lead to less accurate species
assignments. All Disa species (except for D. similis) identified in the chikanda samples are
represented in GenBank from vouchers collected in Tanzania (Bytebier et al. 2007). For
Satyrium, several of the GenBank sequences come from individuals collected in Malawi
and South Africa, which could have an effect on the accuracy of the identifications if the
query individual and the reference individual are from divergent populations (Van der Niet
and Linder 2008). Inspection of the results of Satyrium elongatum and Satyrium trinerve
clusters showed distinct molecular signatures in several separate clusters, indicating that,
besides Satyrium trinerve and Satyrium elongatum, two closely related species are present
in the cake as well (Table 3).
In bench-marking studies, it has been shown that Ion-Torrent PGM reads are prone to
indels and specifically insertions (Bragg et al. 2013), but Quail et al. (2012) report that if
sequence quality is curated accurately in downstream analyses, then read accuracy on Ion-
Torrent PGM should be similar to that of Illumina MiSeq platforms. However, visual
inspection of the reads shows that many sequences appear to include sequencing errors
despite the stringent quality control, and when matching query sequences to references,
queries often contain anomalous insertions. Stricter quality filtering, however, would most
likely result in loss of valuable information of the species composition in mixtures,
therefore it seems useful to avoid too strict filtering on quality boundaries, but instead
visually evaluate the data.
Lastly, several MOTUs from chikanda 3 match with Disa similis. This is remarkable,
because D. similis has not been recorded from Tanzania, but so far only from Zambia,
Angola and South Africa (La Croix and Cribb 1995). This could mean that the nrITS2
sequence of D. similis is very similar to a Tanzanian species not included in our reference
database, but it could also indicate that part of the tubers used for this chikanda originated
from Zambia, or that D. similis occurs in Tanzania but has not yet been recorded by
botanists there. The latter possibility is rather unlikely as this is a very distinctive orchid
with pale violet to blue flowers. The former possibility seems more probable, since our
99% clustering threshold can only distinguish 99.19% of interspecific genetic distances in
the reference database, and missing species could also be genetically similar to included
species such as D. similis. This is supported by the fact that the section Aconitoideae, to
which D. similis belongs, has been undersampled in the prevailing Disa phylogeny
(Bytebier et al. 2007). Taking this into account it might well be possible that the species in
the chikanda sample is one of the sister species to Disa similis, such as D. aperta, D.
equestris, D. dichroa or even D. nyikensis. These uncertain identifications are a serious
indication that we are likely currently underestimating species diversity in chikanda cakes,
and we stress the fact that it is essential in this kind of research to have an understanding of
the systematics and phylogenetic relationships of the analyzed species.
None of the orchid species identified from these chikanda samples are currently listed
on the East-African or global IUCN Red List (2014), but data on most orchid species in this
area is deficient. The intensive commercial collection appears to be unsustainable and the
need for protection is becoming increasingly urgent. Records from 2001 show that up to 4
million orchid tubers were harvested every year, and a recent survey from 2014 shows
amounts have stayed at similar levels, but that orchid tubers are sourced from further afield
every year as local populations are depleted (Davenport and Ndangalasi 2001, 2003;
Bingham 2004; Veldman et al. 2014).
2042 Biodivers Conserv (2017) 26:2029–2046
123

In addition to orchids, 17 other plant species and 6 bacterial species (Table 2) were
identified among the clustered MOTUs. Two species, Arachis hypogaea and Capsicum
annuum are traditional chikanda cake ingredients and were both recovered in the
sequencing runs, as expected. Species such as Mangifera indica (mango), Helianthus
annuus (sunflower), Ipomoea batatas (sweet potato) and Cucurbita maxima (pumpkin) are
all abundantly present in the stalls and sheds were the chikanda is traded, prepared and
sold, and can thus be expected to be present in chikanda even if they were not intentionally
added. Some MOTU identifications yield unexpected results and this could be due to
insufficient reference sequences in GenBank. The identification of Dioscorea polystachya
was unexpected as this species is not cultivated locally, but several other Dioscorea
species, for which there are no nrITS sequences in GenBank, are grown as tuber crops in
Eastern Africa. The identification of Pseudoroegneria spp., Coscinium fenestratum, and
Aquilaria sinensis could reflect a similar situation, but above the level of genera. Pseu-
doroegneria is a genus of North American grass, but the amplified DNA could belong to
species from a closely related African genus. The same might apply to C. fenestratum and
A. sinensis, which are both southeast Asian medicinal plant species, but might have closely
related African genera that did not have nrITS sequences deposited in GenBank at the time
of the BLAST identifications. These issues highlight the difficulties posed to species
identification using DNA based methods.
Amplification bias in amplicon metabarcoding can have major impacts on the number
of reads generated in next generation sequencing for species in mixtures (Pawluczyk et al.
2015). In our study, the majority of nrITS1 amplicon sequencing reads were Arachis
hypogaea (peanut) and nrITS2 reads show predominantly orchids, as well as some other
species, but almost no Arachis. The Sorghum universal primers (Sun et al. 1994) used in
this study have good primer fit for both nrITS1 and nrITS2 for both Arachis and the
targeted orchid genera. Nevertheless the amplification and sequencing process can yield a
bias in the final number of reads (Pawluczyk et al. 2015), so estimating abundance based
on read depth should be treated with caution.
MOTU based identification to species level with nrITS1 and nrITS2 should carefully
consider clustering parameters as a low threshold (97%) could lead to grouping of multiple
species into single MOTUs, whereas a high threshold (99%) could result in oversplitting of
MOTUs and loss of valuable data in MOTU filtering. Pairwise comparisons of interspecific
genetic distance among species in the orchid genera Disa, Satyrium and Habenaria shows
that respectively 97.5, 97.1 and 80.3% of interspecific distances are less than 3%. An
MOTU clustering threshold of 3% divergence would thus group up to 19.7% of Habenaria
species into single MOTUs. A more stringent threshold of 1% would cluster up to 5.3% of
Habenaria species into single MOTUs, and only 0.8% of Disa and 1.4% of Satyrium
species. Studies such as Ivanova et al. (2016) that use a clustering threshold of 2%, risk
overlooking species diversity among closely related species in their metabarcoding
downstream analyses. Something that needs to be considered as well, however, is sequence
inaccuracies due to PCR amplification and sequencing errors. If the clustering threshold
used is too stringent erroneous sequences can be grouped in MOTUs and could thus be
mistaken for separate taxa. However, the use of High Fidelity DNA polymerases reduces
PCR error rates and improves quality filtering in downstream sequence analysis, and
removal of singleton MOTUs eliminates large quantities of uncertain or inaccurate reads.
In our analyses we found that relaxing the clustering and quality filtering thresholds
reduces the risk of formation of MOTUs based on PCR or sequencing errors, but that these
less stringent MOTUs underestimate species diversity. The current thresholds yield a
higher number of MOTUs, but in the similarity matching we find a large level of
Biodivers Conserv (2017) 26:2029–2046 2043
123
identification redundancies (i.e., multiple MOTUs matching to the same species).
Increasing the number of target genes would greatly reduce the uncertainty in species-level
identification.
Lastly, it should be taken into account, that this study used only six chikanda samples,
and this sample size makes it difficult to generalize the results and draw conclusions for all
commercialized chikanda. When looking at a larger scale, results might deviate from the
results in this study and show a higher diversity of orchids used or possibly more adul-
terated chikanda cakes.
Conclusions
Amplicon metabarcoding using the barcoding markers nrITS1 and nrITS2 shows the
potential advantages of these markers and approach for analysis of species composition, as
well as highlight some of the disadvantages. The analysis of interspecific genetic distances
between sequences of these markers for the three target orchid genera shows that identi-
fications at generic level can be made with a high level of confidence, but that species-level
identifications should be closely examined to minimize identifications based on false
assignments to sister taxa that are not represented in GenBank. Data deficiency for orchids
is a serious problem in Eastern Africa, and none of the 17 orchid species identified in our
samples are currently listed on the East-African or global IUCN Red List (2014). Increased
availability of reference sequences in GenBank is likely to improve resolution in species
identification and make this approach more widely applicable in the future. For terrestrial
orchids used in chikanda this will enable quick assessment of genetic diversity of MOTUs
in prepared products and subsequent inference of provenance of the used tubers. Under-
standing the species diversity and provenance of chikanda orchid tubers will enable the
chain of commercialization of these sensitive species to be traced back to the harvesters
and their natural habitats, and thus allow for targeted efforts to protect or sustainably use
these wild populations.
Supporting information
Raw sequence read data from the Ion-Torrent PGM is deposited in Dryad in FASTQ
format (http://dx.doi.org/10.5061/dryad.tn641). In addition to the FASTQ files the primer
sequences for ITS1 and ITS2 (Sun et al. 1994) that were used for demultiplexing and
primer trimming are also provided in a csv file. All MOTUs, the number of reads per
MOTU and the localBLAST identifications are provided per sample and marker in
Appendix S1.
Acknowledgements The authors would like to thank the market vendors and chikanda mamas who par-ticipated in the field study. In addition, all authors acknowledge funding from NWO-SIDA-COSTECHTASENE Grant W 02.29.102.
Open Access This article is distributed under the terms of the Creative Commons Attribution 4.0 Inter-national License (http://creativecommons.org/licenses/by/4.0/), which permits unrestricted use, distribution,and reproduction in any medium, provided you give appropriate credit to the original author(s) and thesource, provide a link to the Creative Commons license, and indicate if changes were made.
2044 Biodivers Conserv (2017) 26:2029–2046
123

References
Altschul SF, Gish W, Miller W et al (1990) Basic local alignment search tool. J Mol Biol 215:403–410Bingham MG (2004) Chikanda trade in Zambia. Orchid Conserv News 4:22–25Bingham MG, Smith PP (2002) Southern African plant red data lists: Zambia. SABONET, PretoriaBlaalid R, Kumar S, Nilsson RH et al (2013) ITS1 versus ITS2 as DNA metabarcodes for fungi. Mol Ecol
Resour 13:218–224. doi:10.1111/1755-0998.12065Boessenkool S, Mcglynn G, Epp LS et al (2014) Use of ancient sedimentary DNA as a novel conservation
tool for high-altitude tropical biodiversity. Conserv Biol 28:446–455. doi:10.1111/cobi.12195Bragg LM, Stone G, Butler MK et al (2013) Shining a light on dark sequencing: characterising errors in Ion
Torrent PGM data. PLoS Comput Biol 9:e1003031Bytebier B, Bellstedt DU, Linder HP (2007) A molecular phylogeny for the large African orchid genus Disa.
Mol Phylogenet Evol 43:75–90Challe JF, Price LL (2009) Endangered edible orchids and vulnerable gatherers in the context of HIV/AIDS
in the Southern Highlands of Tanzania. J Ethnobiol Ethnomed 5:41. doi:10.1186/1746-4269-5-41Cheng X, Su X, Chen X et al (2014) Biological ingredient analysis of traditional Chinese medicine
preparation based on high-throughput sequencing: the story for Liuwei Dihuang Wan. Sci Rep 4:5147.doi:10.1038/srep05147
CITES (2014) The Convention on International Trade in Endangered Species of Wild Fauna and FloraAppendices. http://www.cites.org/. Accessed 1 May 2016
Coghlan M, Haile J, Houston J et al (2012) Deep sequencing of plant and animal DNA contained withintraditional Chinese medicines reveals legality issues and health safety concerns. PLoS Genet8:e1002657. doi:10.1371/journal.pgen.1002657
Cribb PJ, Leedal GP (1982) The mountain flowers of southern Tanzania: a field guide to the commonflowers. AA Balkema, Rotterdam
Davenport TRB, Bytebier B (2004) Kitulo Plateau, Tanzania-a first African park for orchids. Orchid Rev112:161–165
Davenport TRB, Ndangalasi HJ (2001) Orchid harvest—an assessment of the harvesting and trade of orchidtubers across Tanzania’s Southern Highlands. Wildlife Conservation Society
Davenport TRB, Ndangalasi HJ (2003) An escalating trade in orchid tubers across Tanzania’s SouthernHighlands: assessment, dynamics and conservation implications. Oryx 37:55–61
De Beeck MO, Lievens B, Busschaert P et al (2014) Comparison and validation of some ITS primer pairsuseful for fungal metabarcoding studies. PLoS ONE 9:e97629. doi:10.1371/journal.pone.0097629
De Boer HJ, Ouarghidi A, Martin G et al (2014) DNA barcoding reveals limited accuracy of identificationsbased on folk taxonomy. PLoS ONE 9:e84291. doi:10.1371/journal.pone.0084291
Doyle JJ, Doyle JL (1987) A rapid DNA isolation procedure for small quantities of fresh leaf tissue.Phytochem Bull 19:11–15
Epp LS, Boessenkool S, Bellemain EP et al (2012) New environmental metabarcodes for analysing soilDNA: potential for studying past and present ecosystems. Mol Ecol 21:1821–1833. doi:10.1111/j.1365-294X.2012.05537.x
Ewing B, Green P (1998) Base-calling of automated sequencer traces using phred. II. Error probabilities.Genome Res 8:186–194
Galimberti A, De Mattia F, Bruni I et al (2014) A DNA barcoding approach to characterize pollen collectedby honeybees. PLoS ONE 9:e109363. doi:10.1371/journal.pone.0109363
Hamisy CW (2008) Development of conservation strategies for the wild edible orchid in Tanzania. Progressreport for the Rufford Small Grants Foundation. www.ruffordsmallgrants.org/files/orchidreport202007[1].doc. Accessed 1 May 2016
Hedberg O (1957) Afroalpine vascular plants: a taxonomic revision. Symb Bot Ups 15:1–411ISE (2006) International Society of Ethnobiology code of ethics (with 2008 additions). http://ethnobiology.
net/code-of-ethics/. Accessed 1 May 2016IUCN SSC (2014) IUCN Red List of threatened species. Version 2014.3, 2014.3 edn. IUCN, The World
Conservation Union, GlandIvanova NV, Kuzmina ML, Braukmann TW et al (2016) Authentication of herbal supplements using next-
generation sequencing. PLoS ONE 11:e0156426. doi:10.1371/journal.pone.0156426Jørgensen T, Kjaer KH, Haile J et al (2012) Islands in the ice: detecting past vegetation on Greenlandic
nunataks using historical records and sedimentary ancient DNA meta-barcoding. Mol Ecol21:1980–1988. doi:10.1111/j.1365-294X.2011.05278.x
Kasulo V, Mwabumba L, Munthali C (2009) A review of edible orchids in Malawi. J Hortic For 1:133–139Katoh K, Misawa K, Kuma K, Miyata T (2002) MAFFT: a novel method for rapid multiple sequence
alignment based on fast Fourier transform. Nucleic Acids Res 30:3059–3066
Biodivers Conserv (2017) 26:2029–2046 2045
123

Kool A, de Boer HJ, Kruger A et al (2012) Molecular identification of commercialized medicinal plants inSouthern Morocco. PLoS ONE 7:e39459. doi:10.1371/journal.pone.0039459
La Croix I, Cribb PJ (1995) Flora Zambesiaca. Orchidaceae. Parts I and II, vol 11. Balkema, RotterdamLammers Y, Peelen T, Vos RA, Gravendeel B (2014) The HTS barcode checker pipeline, a tool for
automated detection of illegally traded species from high-throughput sequencing data. BMC Bioinform15:44. doi:10.1186/1471-2105-15-44
Larsson A (2014) AliView: a fast and lightweight alignment viewer and editor for large datasets. Bioin-formatics 30:3276–3278. doi:10.1093/bioinformatics/btu531
Li W, Godzik A (2006) Cd-hit: a fast program for clustering and comparing large sets of protein ornucleotide sequences. Bioinformatics 22:1658–1659
Loman NJ, Misra RV, Dallman TJ et al (2012) Performance comparison of benchtop high-throughputsequencing platforms. Nat Biotechnol 30:434–439
Meier R, Shiyang K, Vaidya G, Ng PKL (2006) DNA barcoding and taxonomy in Diptera: a tale of highintraspecific variability and low identification success. Syst Biol 55:715–728. doi:10.1080/10635150600969864
Nyomora AMS (2005) Distribution and abundance of the edible orchids of the Southern Highlands ofTanzania. Tanzan J Sci 31:45–54
Otieno J, Abihudi S, Veldman S et al (2015) Vernacular dominance in folk taxonomy: a case study ofethnospecies in medicinal plant trade in Tanzania. J Ethnobiol Ethnomed. doi:10.1186/1746-4269-11-10
Parducci L, Jørgensen T, Tollefsrud MM et al (2012) Glacial survival of boreal trees in Northern Scandi-navia. Science 335:1083–1086. doi:10.1126/science.1216043
Pawluczyk M, Weiss J, Links MG et al (2015) Quantitative evaluation of bias in PCR amplification andnext-generation sequencing derived from metabarcoding samples. Anal Bioanal Chem 407:1841–1848
Quail MA, Smith M, Coupland P et al (2012) A tale of three next generation sequencing platforms:comparison of Ion Torrent, Pacific Biosciences and Illumina MiSeq sequencers. BMC Genomics13(1):1
Richards AI (1939) Land, labour and diet in Northern Rhodesia: an economic study of the Bemba tribe.Oxford University Press, Oxford
Richardson RT, Lin C-H, Sponsler DB et al (2015) Application of ITS2 metabarcoding to determine theprovenance of pollen collected by honey bees in an agroecosystem. Appl Plant Sci 3:apps.1400066.doi:10.3732/apps.1400066
Rohland N, Hofreiter M (2007) Ancient DNA extraction from bones and teeth. Nat Protoc 2:1756–1762.doi:10.1038/nprot.2007.247
Samarakoon T, Wang SY, Alford MH (2013) Enhancing PCR amplification of DNA from recalcitrant plantspecimens using a trehalose-based additive. Appl Plant Sci 1:apps.1200236. doi:10.3732/apps.1200236
Schmidt P-A, Balint M, Greshake B et al (2013) Illumina metabarcoding of a soil fungal community. SoilBiol Biochem 65:128–132. doi:10.1016/j.soilbio.2013.05.014
Schmieder R, Edwards R (2011) Quality control and preprocessing of metagenomic datasets. Bioinformatics27:863–864
Sun Y, Skinner DZ, Liang GH, Hulbert SH (1994) Phylogenetic analysis of Sorghum and related taxa usinginternal transcribed spacers of nuclear ribosomal DNA. Theor Appl Genet 89:26–32
Taberlet P, Coissac E, Pompanon F et al (2012) Towards next-generation biodiversity assessment usingDNA metabarcoding. Mol Ecol 21:2045–2050. doi:10.1111/j.1365-294X.2012.05470.x
Van der Niet T, Linder HP (2008) Dealing with incongruence in the quest for the species tree: a case studyfrom the orchid genus Satyrium. Mol Phylogenet Evol 47:154–174
Van der Niet T, Linder HP, Bytebier B, Bellstedt DU (2005) Molecular markers reject monophyly of thesubgenera of Satyrium (Orchidaceae). Syst Bot 30:263–274
Veldman S, Otieno JN, van Andel T et al (2014) Efforts urged to tackle thriving illegal orchid trade inTanzania and Zambia for chikanda production. TRAFFIC Bull 26:47–50
Willerslev E, Davison J, Moora M et al (2014) Fifty thousand years of Arctic vegetation and megafaunaldiet. Nature 506:47–51. doi:10.1038/nature12921
2046 Biodivers Conserv (2017) 26:2029–2046
123