Embed Size (px)
Citation preview

HIGH-TECHNOLOGY ACTIVITIES IN ARIZONA: 2007 UPDATE
Revised, January 2008
Produced for the Arizona Department of Commerce
Center for Competitiveness and Prosperity Research L. William Seidman Research Institute
W. P. Carey School of Business Arizona State University
Box 874011 Tempe, Arizona 85287-4011
(480) 965-3961
FAX: (480) 965-5458 EMAIL: [email protected]
www.wpcarey.asu.edu/seid

1
TABLE OF CONTENTS Summary 2 Definition of High Technology 3 Data 5 High Technology in Arizona and the Nation 6 High Technology in Arizona Compared to Selected States in 2005 11 Changes in High Technology between 2001 and 2005 13 High Technology in Arizona Counties 16 Economic Impact of High Technology in Arizona 19
LIST OF TABLES 1. Definition of High Technology 5 2. Measures of High Technology by Category in Arizona in 2005 10 3. High-Technology Location Quotients by Category for Selected States in 2005 14 4. Measures of Changes in High Technology by Category in Arizona from 2001 to 2005 15 5. High-Technology Employment by Category and County in 2005 17 6. High-Technology Location Quotients by Category and County in 2005 18 7. Economic Impact of High-Technology Activities on the Arizona Economy in 2005 21
LIST OF CHARTS 1. Total High-Technology Location Quotients in Arizona from 1990 through 2005 7 2. High-Technology Manufacturing and Services Location Quotients in Arizona from 1998 through 2005 8 3. High-Technology Location Quotients by Category in Arizona in 2005 11 4. High-Technology Location Quotients for Selected Categories in Arizona from 1998 through 2005 12 5. Total High-Technology Location Quotients for Selected States in 2005 13

2
SUMMARY High-technology manufacturing and services are highly desired economic activities. The high-technology workforce possesses strong skills and educational attainment, and is highly paid — upwards of twice as much as the rest of the workforce. Further, a high proportion of the goods and services produced by high-technology activities in Arizona are sold to consumers from outside the state. Thus, these activities import monies into Arizona that would not be present if these activities were not physically located in the state.
Economic impact analysis traces the full impact, direct and indirect, of an economic activity on jobs and incomes in a local economy.The direct impact of high-technology activities on the Arizona economy in 2005 amounted to 4 percent of employment, 5 percent of value added (gross state product), and 7 percent of earnings. The inclusion of indirect impacts pushes the impact of high-tech activities to 10 percent of employment, 11 percent of value added, and 13 percent of earnings in Arizona.
However, the concentration of high-technology activities in Arizona continued to decline between 2001 and 2005. In 2005, Arizona no longer had a high-technology presence much different than the national average. Employment in high-technology activities decreased between 2001 and 2005 in Arizona. Coupled with significant employment growth in other sectors, the high-technology share of the Arizona economy dropped considerably. High-tech employment also fell nationally, but at a lesser rate than in Arizona. With national employment growth modest in other sectors, high-tech’s share of the national economy did not fall much.
Per capita employment in high-technology activities in Arizona decreased from 20 percent higher than the national average in 2001 to 4 percent more in 2005. Most of the other states with a strong high-technology concentration also experienced a decline in per capita high-technology employment between 2001 and 2005, but in only one state was the magnitude of the decline greater than in Arizona. Arizona has a narrow base of high-technology activities. Only two activities with substantial employment — manufacturing of aerospace products and manufacturing of semiconductor and other electronic components — had a much greater relative presence in Arizona than the national average in 2005. Four other high-tech categories (of a total of 16) had an above-average concentration in Arizona, but per capita employment in these categories either was only slightly higher than the national average and/or the number of employees in these categories was not significant. Within Arizona, high-technology activities are highly concentrated in the two populous urban counties. In 2005, Maricopa County had above-average activity in several high-tech categories, particularly aerospace manufacturing and semiconductor and electronic component manufacturing. Instruments manufacturing and data processing services were other significant high-tech activities. In Pima County, aerospace manufacturing had a very strong presence. Instruments manufacturing and software development were other important high-tech activities. The decrease in high-technology employment in Arizona between 2001 and 2005 largely occurred in Maricopa County. However, a decline also occurred in Pima County.

3
DEFINITION OF HIGH-TECHNOLOGY The North American Industry Classification System (NAICS) was first defined in 1997
and replaced the Standard Industrial Classification (SIC). The NAICS has been revised twice, in 2002 and 2007. Federal government agencies gradually switched from the SIC to the NAICS between 1997 and 2002, but all have produced data solely by the NAICS in recent years. The NAICS has a hierarchical structure, with 20 two-digit sectors divided into three-digit subsectors, four-digit industry groups, and five- and six-digit industries.
“High technology” is not defined in the NAICS or SIC. Multiple efforts to define high-technology activities had been made by different groups using the SIC. In recent years, several definitions using the NAICS have been published. Some of these definitions are derivative, based on the definitions used in other studies; some are specific to a particular geographic area; and some are based, at least in part, on judgment/expert opinion. Three sources were used to define high technology for this report of high-tech activities in Arizona: • U.S. Bureau of Labor Statistics (BLS): “High-Technology Employment: A NAICS-Based
Update,” Monthly Labor Review, July 2005 (author Daniel E. Hecker). Conceptually, the BLS wanted to define high technology based on five factors: (1) intensity of science, engineering, and technician occupations, (2) research and development (R&D) employment, (3) production of high-technology products, (4) use of high-technology production methods, and (5) the relationship between high-technology industries and productivity growth. However, “due to data and conceptual problems, only science, engineering, and technician occupation intensity was used to develop a list of industries.” The BLS identified 46 four-digit NAICS industry groups based on this factor, dividing the list into three intensity levels.
• American Electronics Association (AeA): “Defining the High-Tech Industry,” February 2003. The AeA’s guiding principle for selecting high-technology activities was that “an industry had to be a maker/creator of technology, whether it be in the form of products, communications, or services.” The AeA selected 49 six-digit NAICS industries.
• Carnegie Mellon University’s Center for Economic Development (CED) and the State Science & Technology Institute (SSTi): “Technology Industries and Occupations for NAICS Industry Data,” March 2004 (authors Jerry Paytas and Dan Berglund). Three overlapping lists of six-digit NAICS industries were created. The first list was based on “technology employers” — those industries in which the share of science and engineering occupations was at least triple the national average. The second list of “primary technology generators” was based on each of two measures being greater than the national average: R&D expenditures per employee and the proportion of full-time-equivalent R&D scientists and engineers in the workforce. Those industries in which only one of the two measures exceeded the national average were included on the third list of “secondary technology generators.”
An inconsistency exists across these three sources: the BLS list is at the four-digit industry group level while the other two sources used the six-digit industry level. The importance of the decision to use industry groups or industries is lessened by several of the high-technology industry groups on the BLS list consisting of only one industry. For this study of Arizona high technology, the issue of data availability was the primary factor in the decision to define high technology primarily at the industry group level: the data disclosure problem is more severe at the industry level. In addition, in most of the high-tech industry groups, most of the industries also are high tech. However, the use of industry groups necessarily results in some not very high-tech industries being included. Generally, these are not major employers. In addition to the

4
industry groups, a few high-tech industries within a generally not high-tech industry group also were included in the definition of high technology used in this study.
Each of the “level 1” industry groups defined by the BLS was included in this study of Arizona’s high-technology activities. After updating the BLS list to the 2007 NAICS, this list consisted of 12 industry groups. In each of these 12 industry groups, most industries also were included in the first list developed by the CED/SSTi, with the majority of these industries also appearing in the second list. In 10 of the 12 groups, at least one industry was included in the AeA list. In addition, a BLS “level 2” industry group was included in the definition of Arizona’s high-technology activities if the majority of industries within the group also were included in at least one of CED/SSTi lists and in the AeA listing. Only one industry group was added on this basis. If a minority of industries within a BLS level 2 industry group were included in the AeA and CED/SSTi listings, then the industries rather than the industry group were added to the definition of Arizona’s high-technology activities. Three six-digit industries were selected on this basis.
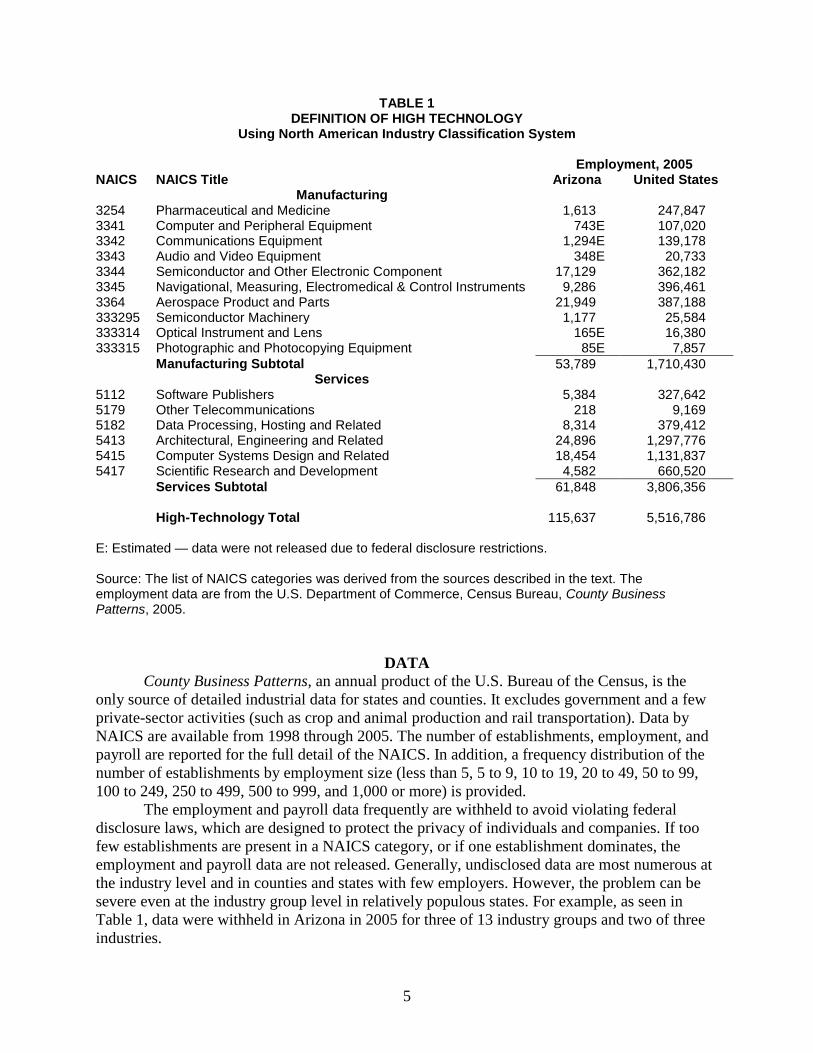
The full list of high-technology industry groups and industries used in this report are shown in Table 1. The list has been subdivided into manufacturing activities (seven industry groups and three industries) and service activities (six industry groups). Employment in 2005 is included in the table to provide a measure of the relative size of these NAICS industry groups and industries. Very considerable differences in size are present across the 16 high-tech categories.
When the initial study of Arizona’s high-technology activities was undertaken in 2003, nearly all of the available definitions of high technology were based on the SIC. Because the SIC did not identify some of the newer technologies, and since NAICS categories only imperfectly could be matched to the SIC definition, the list of NAICS categories used in the 2003 study now are viewed as suboptimal to use. Further, because of the limitations of the SIC, it is not possible to translate the new NAICS definition of high technology back to the SIC. Since detailed industrial data prior to 1998 only are available by the SIC, the revised definition of high technology cannot be applied to data before 1998. The list of high-technology activities in Table 1 differs from the list compiled for the initial version of the Arizona high-technology study completed in 2003. The revised definition is somewhat narrower, dropping some (mostly small) NAICS categories from the list. The manufacturing categories deleted were 325992 photographic film, 333313 office machinery, 3346 magnetic and optical media, and 3391 medical equipment and supplies. Service categories deleted were 51222 record production and distribution, 517 (other than 5179) telecommunications, 54162 environmental consulting, 54169 other scientific and technical consulting, and 811212 computer and office machine repair. Applying the original definition of high technology, 6.3 percent of the national nonfarm private-sector employment in 2005 was high tech. Using the revised definition, the high-tech share was 4.7 percent. The Arizona shares were 6.6 percent using the original definition and 5.4 percent using the revised definition. Thus, while the revised definition is narrower, Arizona compares more favorably under this definition relative to the national average — the high-tech sectoral share in Arizona was 13 percent higher than the national average using the revised definition and 4 percent above average using the original definition.
5
TABLE 1 DEFINITION OF HIGH TECHNOLOGY
Using North American Industry Classification System Employment, 2005 NAICS NAICS Title Arizona United States Manufacturing 3254 Pharmaceutical and Medicine 1,613 247,847 3341 Computer and Peripheral Equipment 743E 107,020 3342 Communications Equipment 1,294E 139,178 3343 Audio and Video Equipment 348E 20,733 3344 Semiconductor and Other Electronic Component 17,129 362,182 3345 Navigational, Measuring, Electromedical & Control Instruments 9,286 396,461 3364 Aerospace Product and Parts 21,949 387,188 333295 Semiconductor Machinery 1,177 25,584 333314 Optical Instrument and Lens 165E 16,380 333315 Photographic and Photocopying Equipment 85E 7,857 Manufacturing Subtotal 53,789 1,710,430 Services 5112 Software Publishers 5,384 327,642 5179 Other Telecommunications 218 9,169 5182 Data Processing, Hosting and Related 8,314 379,412 5413 Architectural, Engineering and Related 24,896 1,297,776 5415 Computer Systems Design and Related 18,454 1,131,837 5417 Scientific Research and Development 4,582 660,520 Services Subtotal 61,848 3,806,356 High-Technology Total 115,637 5,516,786 E: Estimated — data were not released due to federal disclosure restrictions. Source: The list of NAICS categories was derived from the sources described in the text. The employment data are from the U.S. Department of Commerce, Census Bureau, County Business Patterns, 2005.
DATA County Business Patterns, an annual product of the U.S. Bureau of the Census, is the
only source of detailed industrial data for states and counties. It excludes government and a few private-sector activities (such as crop and animal production and rail transportation). Data by NAICS are available from 1998 through 2005. The number of establishments, employment, and payroll are reported for the full detail of the NAICS. In addition, a frequency distribution of the number of establishments by employment size (less than 5, 5 to 9, 10 to 19, 20 to 49, 50 to 99, 100 to 249, 250 to 499, 500 to 999, and 1,000 or more) is provided.
The employment and payroll data frequently are withheld to avoid violating federal disclosure laws, which are designed to protect the privacy of individuals and companies. If too few establishments are present in a NAICS category, or if one establishment dominates, the employment and payroll data are not released. Generally, undisclosed data are most numerous at the industry level and in counties and states with few employers. However, the problem can be severe even at the industry group level in relatively populous states. For example, as seen in Table 1, data were withheld in Arizona in 2005 for three of 13 industry groups and two of three industries.

6
Undisclosed employment data were estimated for this project based on the frequency distribution of establishments by employment size and average employment by sector for each employment-size category by state. Employment was estimated for Arizona for each of the eight years from 1998 through 2005. Because estimating undisclosed data is very time-consuming, estimates for other states and Arizona counties were limited to 1998, 2001 and 2005.
Employment is the primary indicator used in this report to measure high-technology activities. Conceptually, a dollar measure provides a superior indicator of economic activity, but estimating undisclosed payroll data can result in substantial inaccuracies. While the number of establishments is not withheld, this is a simplistic measure that says little about economic activity. In order to compare geographic areas of differing size, the “location quotient” was determined for each high-technology industrial category in each geographic area. The location quotient for each industrial category was calculated as per capita employment (employment divided by population) in each local area (state or county) divided by the national average per capita employment. A location quotient of more than 1 indicates a concentration of activity greater than the national average. Using the location quotient and employment, “excess employment” was calculated. The excess is the difference in the actual employment and the employment that would have existed if the local area’s location quotient had been equal to 1.
HIGH TECHNOLOGY IN ARIZONA AND THE NATION Three levels of detail are presented for high-technology activities, as shown in Table 1: (1) the detailed categories (industry groups and industries), (2) subtotals of the manufacturing and service categories, and (3) the overall high-tech total.
Total Based on the revised definition of high technology, approximately 115,625 high-tech jobs
were present in Arizona in 2005. High-technology employment was down approximately 17,000 (13 percent) from the peak reached in 2000. Nationally, high-technology employment also declined, but the percentage change was less than in Arizona. Thus, the state’s share of the nation’s high-technology employment dropped from 2.34 percent in 2000 to 2.10 percent in 2005.
Despite the decrease in employment between 2000 and 2005, the number of high-technology establishments in Arizona continued to rise, going up 16 percent over the five years. The national gain in high-tech establishments was only half as fast, with the state’s share of the nation’s high-technology establishments increasing from 1.79 percent in 2000 to 1.93 percent in 2005.
The average high-technology establishment size in Arizona in 2005 was 21.6 employees, greater than the 16.4 average of the entire nonfarm private sector. While the overall establishment size has not changed much over time, the high-technology average fell from a high of 28.8 in 2000. Nationally, the high-technology establishment size did not fall as much, from 22 to 20, but it remained less than in Arizona in 2005.
As a share of nonfarm private-sector employment counted in County Business Patterns, high-technology activities in Arizona accounted for 5.4 percent of the state’s employment and 4.1 percent of its establishments in 2005. While the high-tech share of establishments was slightly higher than in the late 1990s, the high-tech share of employment was down considerably.

7
The peak employment share was 6.9 percent in 2000. Nationally, the shares were lower in 2005 than in Arizona: high-tech employment accounted for 4.7 percent of the nonfarm private-sector total; the high-tech share of establishments was 3.7 percent. However, the high-tech employment share was hardly lower than in the past.
Due to employment and payroll data being withheld from several high-tech NAICS categories in Arizona, it is not possible to calculate the average wage for all of high technology. For those high-tech categories with available data, average payroll per employee in 2005 was approximately $64,000 — 6 percent less than the national average for the same high-tech categories, but 93 percent higher than the overall average wage in Arizona. Nationally, the average wage in high technology was 80 percent higher than the overall average in 2005. The annual high-technology location quotient calculated for Arizona provides an easy means of comparing Arizona to the national average. As seen in Chart 1, Arizona’s high-technology employment per capita has declined over time relative to the national average. The location quotient in 2005 was just 1.04 — per capita high-tech employment in Arizona was only 4 percent higher than the national average. It had been 28 percent above the national average in 2000. Excess high-technology employment in Arizona was approximately 4,900 in 2005, the least of the eight-year period. The excess was more than 20,000 annually through 2002.
As seen in Chart 1, Arizona’s high-technology decline relative to the national average has been ongoing since at least 1990. Thus, while it was accurate in the past to describe Arizona as a high-technology center, such a description no longer is accurate.
CHART 1 TOTAL HIGH-TECHNOLOGY LOCATION QUOTIENTS
IN ARIZONA FROM 1990 THROUGH 2005
1.00
1.05
1.10
1.15
1.20
1.25
1.30
1.35
1990 1991 1992 1993 1994 1995 1996 1997 1998 1999 2000 2001 2002 2003 2004 2005
Location Quotient
Original SIC Definition Revised NAICS Definition
Source: Calculated from U.S. Department of Commerce, Bureau of the Census, County Business Patterns, 1990 through 2005.

8
Manufacturing versus Services Less than half (47 percent) of the high-technology jobs in Arizona in 2005 were in
manufacturing industries. Manufacturing’s share had been 63 percent in 1998. Nationally, only 31 percent of the high-tech jobs were in manufacturing in 2005, down from 46 percent in 1998. Arizona accounted for 3.1 percent of the nation’s high-tech manufacturing jobs in 2005, compared to only 1.6 percent of the high-tech service jobs.
Less than 10 percent of the high-technology establishments in 2005, nationally and in Arizona, were in the manufacturing sector. Thus, the average establishment size was much larger in high-tech manufacturing than in high-tech services.
Of those high-technology manufacturing categories with available payroll data, Arizona’s payroll per employee exceeded the national average by 10 percent in 2005. (While payroll was not disclosed for five of 10 manufacturing categories, estimated employment in these undisclosed categories accounted for only 5 percent of the manufacturing total.) In Arizona, payroll per employee in high-tech services was considerably lower than in high-tech manufacturing, but nationally, the average high-tech wage was a little higher in services than in manufacturing. Thus, the average wage in high-tech services in Arizona was 16 percent less than the national average. The high-technology manufacturing location quotient was substantially higher than 1 in each year from 1998 through 2005 (see Chart 2). However, except for a jump in 2000, the location quotient has slipped over time. In contrast, the high-tech services location quotient was considerably less than 1 in each year. Other than a rise in 2002, it has declined slightly over time. High-technology manufacturing provided excess employment of nearly 20,000 in 2005, the lowest figure of the eight-year period. The excess was more than 30,000 in 2000 and 2001. In contrast, per capita employment in Arizona in high-technology services was below the national average in 2005. This shortage of jobs offset most of the excess manufacturing employment.
CHART 2 HIGH-TECHNOLOGY MANUFACTURING AND SERVICES LOCATION QUOTIENTS
IN ARIZONA FROM 1998 THROUGH 2005
0.75
1.00
1.25
1.50
1.75
2.00
1998 1999 2000 2001 2002 2003 2004 2005
Location Quotient
Manufacturing Services Total
Source: Calculated from U.S. Department of Commerce, Bureau of the Census, County Business Patterns, 1998 through 2005.

9
Detailed Categories Based on employment, the largest high-technology category in Arizona in 2005 was
architectural, engineering and related services, with about 24,900 employees (see Table 2). Aerospace product and parts manufacturing was second largest, followed by computer systems design and related services. Semiconductor and other electronic component manufacturing, which had been the largest high-technology employer as recently as 2001, ranked fourth in 2005. More than 70 percent of the state’s high-tech employment was in these four categories in 2005; employment was much less (less than 1,000) in five of the 16 high-tech categories.
Relative to the national average, two high-technology categories stand out: in 2005, Arizona accounted for 5.7 percent of the nation’s aerospace manufacturing jobs and for 4.7 percent of the semiconductor and other electronic component manufacturing employment. Each of these categories provided substantial employment nationally and in Arizona. Arizona’s share of the nation’s employment also was quite high in the semiconductor machinery manufacturing industry, but employment in this industry was less than a tenth of that in the aerospace and electronics industry groups. Of those high-technology categories with disclosed payroll, average payroll per employee in 2005 was highest in Arizona in aerospace at approximately $91,950 — 36 percent higher than the U.S. average for this category. The Arizona average was $70,100 in instruments, 8 percent more than the national average. In each of the other categories, the Arizona average was less than the national average, by at least 10 percent in eight categories. Arizona’s location quotient exceeded 1 in six of 16 high-technology categories in 2005 (see Chart 3). The highest figure (2.82) was in the aerospace category. While lower than from 2000 through 2004, the 2005 location quotient remained higher than in 1998 and 1999. The second-highest location quotient (2.36) was in the semiconductor and electronic component category, but the 2005 figure was the lowest in this category in the eight-year period from 1998 through 2005. The semiconductor machinery industry had nearly as high a location quotient; its figure was higher in 2004 and 2005 than in earlier years. The other three high-technology categories in Arizona with a location quotient greater than 1 in 2005 had a figure less than 1.2. The location quotient in the instruments category has been erratic over time, with the 2005 value of 1.17 the second lowest of the eight years (see Chart 4). The data processing category had a location quotient of 1.09 in 2005. Following a substantial gain in 2001, the figure fell in 2004, but has remained higher than in the late 1990s. The very small other telecommunications category also had a location quotient greater than 1. Four high-technology categories in Arizona had a location quotient in 2005 less than 1 but more than 0.8: engineering services, audio and visual equipment, software, and computer design. Of these, the 2005 location quotient was not much different than the historical figures except in software, which experienced a large drop in 2003. In each of the other six categories, the 2005 location quotient was less than 0.55. Among these is the scientific research and development category, which was a major employer nationally. The aerospace category provided excess employment of 14,175 in 2005 in Arizona. The semiconductor and electronic component category produced an excess of about 9,850, but this was substantially less than the excesses through 2001. The next-largest excess was 1,325 in the instruments category. In the research and development category, Arizona would have needed 8,675 more jobs just to equal the national figure for per capita employment. Sizable shortfalls also were present in the computer design and pharmaceuticals categories.

10
TABLE 2 MEASURES OF HIGH TECHNOLOGY BY CATEGORY IN ARIZONA IN 2005
(1) (2) (3) (4) (5) # Estab Empl Payroll Empl/Estab Pay/Empl
Manufacturing Pharmaceutical and Medicine 31 1,613 $19,824 52.0 $49,161 Computer and Peripheral Equipment 33 743E na 24.4 na Communications Equipment 32 1,294E na 38.9 na Audio and Video Equipment 8 348E na 43.5 na Semiconductor and Other Electronic Component 136 17,129 207,810 125.9 48,528 Navigational, Measuring, Electromedical & Control Instruments 101 9,286 162,741 91.9 70,102 Aerospace Product and Parts 75 21,949 504,494 292.7 91,939 Semiconductor Machinery 16 1,177 18,179 73.6 61,781 Optical Instrument and Lens 10 165E na 17.0 na Photographic and Photocopying Equipment 9 85E na 10.2 na Manufacturing Subtotal 451 53,789E na 119.3 na
Services Software Publishers 147 5,384 97,282 36.6 72,275 Other Telecommunications 10 218 2,305 21.8 42,294 Data Processing, Hosting and Related 286 8,314 100,079 29.1 48,150 Architectural, Engineering and Related 2,597 24,896 294,205 9.6 47,269 Computer Systems Design and Related 1,634 18,454 315,235 11.3 68,329 Scientific Research and Development 236 4,582 85,678 19.4 74,795 Services Subtotal 4,910 61,848 894,784 12.6 57,870 High-Technology Total 5,361 115,637 na 21.6 na Notes: (1) Number of establishments. (2) Employment is expressed as of the week including March 12 and includes part-time employees. (3) Payroll is for the first quarter and is in thousands. (4) Employment per establishment. (5) Payroll per employee is calculated as first quarter payroll divided by employment, times four. E (estimated) and na (not available) — data were not released due to federal disclosure restrictions. Source: Calculated from U.S. Department of Commerce, Bureau of the Census, County Business Patterns, 2005.

11
CHART 3 HIGH-TECHNOLOGY LOCATION QUOTIENTS BY CATEGORY IN ARIZONA IN 2005
Categories Listed in Order of Employment in Arizona
0.0 0.5 1.0 1.5 2.0 2.5 3.0
Photographic and Photocopying EquipmentOptical Instrument and Lens
Other TelecommunicationsAudio and Video Equipment
Computer EquipmentSemiconductor Machinery
Communications EquipmentPharmaceutical and Medicine
Scientific Research and DevelopmentSoftware Publishers
Data Processing, Hosting and RelatedNavigational & Control Instruments
Semiconductor and Other Electronic Computer Systems Design and Related
Aerospace Product and PartsArchitectural, Engineering and Related
Location Quotient
Source: Calculated from U.S. Department of Commerce, Bureau of the Census, County Business Patterns, 2005.
HIGH-TECHNOLOGY IN ARIZONA COMPARED TO SELECTED STATES IN 2005 County Business Patterns data for 2005 were examined for key high-technology activities in all states (the large quantity of withheld data precluded doing this analysis for all high-tech activities in all states). Three factors based on the key activities and two other factors were used to select comparison states: • A strong overall presence in the key high-technology activities. • A strong presence in computer and electronic product manufacturing (NAICS 334), an
important subsector in Arizona. • Strength in aerospace product and parts manufacturing (NAICS 3364), another important
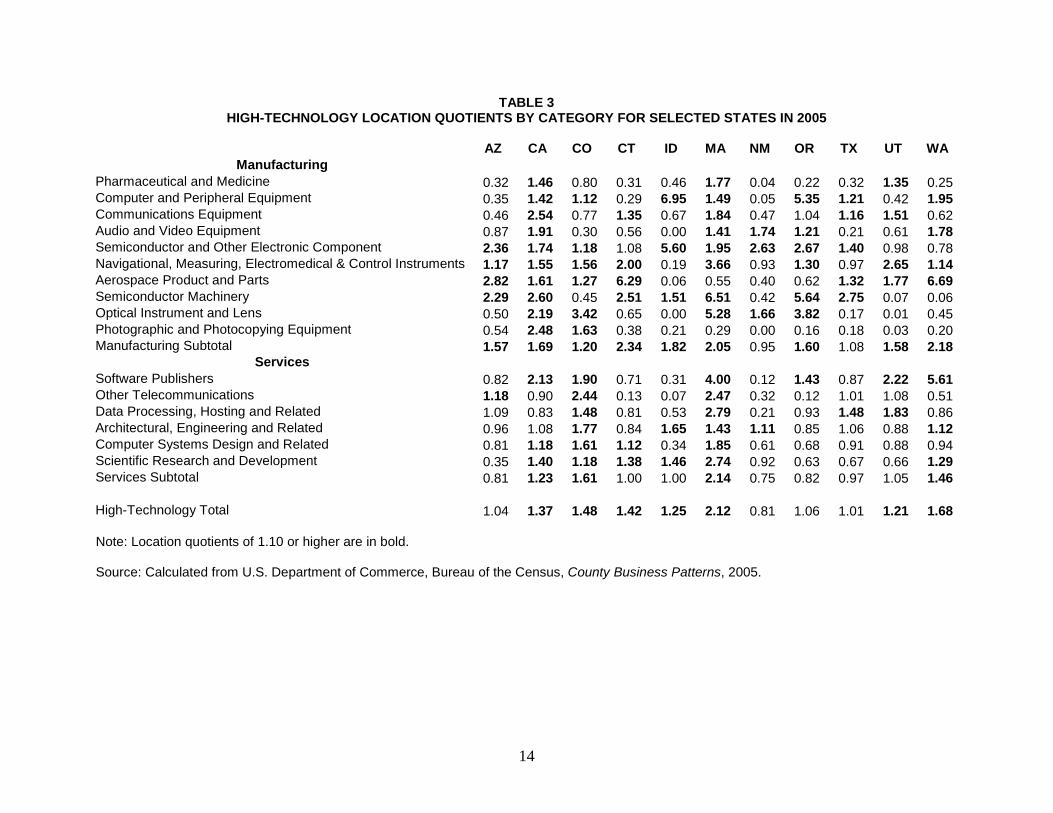
high-technology activity in Arizona. • A location in the West. • A moderate-to-large state based on population. The 10 states that scored the highest were selected as comparison states: California, Colorado, Connecticut, Idaho, Massachusetts, New Mexico, Oregon, Texas, Utah, and Washington. Arizona ranked toward the bottom of the 11 states (10 comparison states and Arizona) in the overall measure of high technology. As seen in Chart 5, Arizona ranked ninth, above only Texas and New Mexico. Massachusetts had by far the highest location quotient based on this definition of high technology. Arizona ranked eighth in the high-technology manufacturing

12
CHART 4 HIGH-TECHNOLOGY LOCATION QUOTIENTS FOR SELECTED CATEGORIES
IN ARIZONA FROM 1998 THROUGH 2005
0.751.001.251.501.752.002.252.502.753.003.25
1998 1999 2000 2001 2002 2003 2004 2005
Location Quotient
Aerospace Electronics InstrumentsEngineering Software
0.00
0.25
0.50
0.75
1.00
1.25
1.50
1998 1999 2000 2001 2002 2003 2004 2005
Location Quotient
Communications Data Processing Computer DesignR&D Pharmaceuticals
Source: Calculated from U.S. Department of Commerce, Bureau of the Census, County Business Patterns, 1998 through 2005.

13
CHART 5 TOTAL HIGH-TECHNOLOGY LOCATION QUOTIENTS FOR SELECTED STATES IN 2005
0.00
0.25
0.50
0.75
1.00
1.25
1.50
1.75
2.00
2.25
MA WA CO CT CA ID UT OR AZ TX NM
Location Quotient
Source: Calculated from U.S. Department of Commerce, Bureau of the Census, County Business Patterns, 2005.
measure (see Table 3), above Colorado as well as Texas and New Mexico. Only New Mexico had a lower location quotient in the high-technology services measure. Arizona ranked third among the 11 states in location quotient in the aerospace manufacturing industry group, behind Connecticut and Washington. Arizona also was third highest in the small categories of photographic and photocopying equipment manufacturing (despite a location quotient of only 0.54) and other telecommunications. Arizona’s location quotient was fourth highest in the semiconductor and other electronic component industry group, less than Idaho, Oregon and New Mexico. In the semiconductor machinery manufacturing industry, the other category in which Arizona had a high location quotient, the state ranked only sixth.
CHANGES IN HIGH TECHNOLOGY BETWEEN 2001 AND 2005 The 2001-through-2005 period is highlighted for two reasons: (1) the prior high-
technology study used data through 2001, and (2) the latest recession ended in 2001. As seen in Table 4, high-technology employment in Arizona dropped 12 percent between 2001 and 2005, but the number of high-tech establishments rose 14 percent. This contrast partially resulted from the varied performance of high-tech manufacturing and high-tech services. High-tech manufacturing experienced declines in establishments and employment, with a sizable drop of 28 percent in employment. However, high-tech services employment rose 8 percent. Average establishment size dropped in both manufacturing and services, though by more in manufacturing. Payroll per employee in high-tech services rose a little after adjusting for inflation; most of the high-tech manufacturing categories had missing data in 2001 and/or 2005.
Arizona’s high-technology location quotient fell from 1.20 in 2001 to 1.04 in 2005. Only one of the 10 comparison states (Colorado) had a larger decrease. High-tech manufacturing and
14
TABLE 3 HIGH-TECHNOLOGY LOCATION QUOTIENTS BY CATEGORY FOR SELECTED STATES IN 2005
AZ CA CO CT ID MA NM OR TX UT WA
Manufacturing Pharmaceutical and Medicine 0.32 1.46 0.80 0.31 0.46 1.77 0.04 0.22 0.32 1.35 0.25 Computer and Peripheral Equipment 0.35 1.42 1.12 0.29 6.95 1.49 0.05 5.35 1.21 0.42 1.95 Communications Equipment 0.46 2.54 0.77 1.35 0.67 1.84 0.47 1.04 1.16 1.51 0.62 Audio and Video Equipment 0.87 1.91 0.30 0.56 0.00 1.41 1.74 1.21 0.21 0.61 1.78 Semiconductor and Other Electronic Component 2.36 1.74 1.18 1.08 5.60 1.95 2.63 2.67 1.40 0.98 0.78 Navigational, Measuring, Electromedical & Control Instruments 1.17 1.55 1.56 2.00 0.19 3.66 0.93 1.30 0.97 2.65 1.14 Aerospace Product and Parts 2.82 1.61 1.27 6.29 0.06 0.55 0.40 0.62 1.32 1.77 6.69 Semiconductor Machinery 2.29 2.60 0.45 2.51 1.51 6.51 0.42 5.64 2.75 0.07 0.06 Optical Instrument and Lens 0.50 2.19 3.42 0.65 0.00 5.28 1.66 3.82 0.17 0.01 0.45 Photographic and Photocopying Equipment 0.54 2.48 1.63 0.38 0.21 0.29 0.00 0.16 0.18 0.03 0.20 Manufacturing Subtotal 1.57 1.69 1.20 2.34 1.82 2.05 0.95 1.60 1.08 1.58 2.18
Services Software Publishers 0.82 2.13 1.90 0.71 0.31 4.00 0.12 1.43 0.87 2.22 5.61 Other Telecommunications 1.18 0.90 2.44 0.13 0.07 2.47 0.32 0.12 1.01 1.08 0.51 Data Processing, Hosting and Related 1.09 0.83 1.48 0.81 0.53 2.79 0.21 0.93 1.48 1.83 0.86 Architectural, Engineering and Related 0.96 1.08 1.77 0.84 1.65 1.43 1.11 0.85 1.06 0.88 1.12 Computer Systems Design and Related 0.81 1.18 1.61 1.12 0.34 1.85 0.61 0.68 0.91 0.88 0.94 Scientific Research and Development 0.35 1.40 1.18 1.38 1.46 2.74 0.92 0.63 0.67 0.66 1.29 Services Subtotal 0.81 1.23 1.61 1.00 1.00 2.14 0.75 0.82 0.97 1.05 1.46 High-Technology Total 1.04 1.37 1.48 1.42 1.25 2.12 0.81 1.06 1.01 1.21 1.68 Note: Location quotients of 1.10 or higher are in bold. Source: Calculated from U.S. Department of Commerce, Bureau of the Census, County Business Patterns, 2005.

15
TABLE 4 MEASURES OF CHANGES IN HIGH TECHNOLOGY BY CATEGORY IN ARIZONA FROM 2001 TO 2005
(1) (2) (3) (4) (5) # Estab Empl Payroll Empl/Estab Pay/Empl
Manufacturing Pharmaceutical and Medicine 15% 75% 71% 52% -2% Computer and Peripheral Equipment -33 -34E na -2 na Communications Equipment -18 -73E na -67 na Audio and Video Equipment -11 -26E na -13 na Semiconductor and Other Electronic Component -9 -44 -57 -38 -24 Navigational, Measuring, Electromedical & Control Instruments 20 0 2 -17 3 Aerospace Product and Parts 14 -14 9 -25 28 Semiconductor Machinery 23 -8E na -25 na Optical Instrument and Lens -41 -55E na -24 na Photographic and Photocopying Equipment -25 -41E na -21 na Manufacturing Subtotal -3 -28E na -25 na
Services Software Publishers -25 -9 -5 22 4 Other Telecommunications -44 -14 17 55 36 Data Processing, Hosting and Related 54 -6 -8 -39 -3 Architectural, Engineering and Related 20 7 7 -11 0 Computer Systems Design and Related 12 13 19 2 5 Scientific Research and Development 12 53 89 36 23 Services Subtotal 16 8 12 -7 4 High-Technology Total 14 -12E na -23 na Notes: (1) Number of establishments. (2) Employment is expressed as of the week including March 12 and includes part-time employees. (3) Payroll is for the first quarter. The percent change is inflation adjusted, using the Gross Domestic Product Implicit Price Deflator. (4) Employment per establishment. (5) Payroll per employee is calculated as first quarter payroll divided by employment, times four. The percent change is inflation adjusted, using
the Gross Domestic Product Implicit Price Deflator. E (estimated) and na (not available) — data were not released due to federal disclosure restrictions. Source: Calculated from U.S. Department of Commerce, Bureau of the Census, County Business Patterns, 2001 and 2005.

16
high-tech services each had a decrease in location quotient in Arizona. Two states (Massachusetts and Washington) experienced larger drops in manufacturing, while California and Colorado had larger decreases in services.
Despite the overall decline in the high-technology location quotient in Arizona, seven of the 16 high-technology categories experienced an increase in location quotient between 2001 and 2005. Two of the gains were significant, but both were in very small categories: semiconductor machinery and other telecommunications. The largest decrease in location quotient occurred in the moderately sized communications equipment category. Only one of the comparison states had a larger drop. A large drop in 2002 continued the downslide of this high-tech category in Arizona, but the location quotient has been steady since 2002 at less than 0.5. A further decrease in location quotient occurred in the semiconductor and electronic component category between 2001 and 2005. However, the 2005 value in Arizona was the same as in 2002. The 2001-to-2005 decline was larger than in each of the comparison states.
A decline in location quotient also was measured in the aerospace category in Arizona, but the 2005 figure remained higher than those of the late 1990s. Only Washington had a larger drop between 2001 and 2005.
The data processing category had unusually high location quotients from 2001 through 2003. Thus, while a large decline occurred between 2001 and 2005, the 2005 location quotient of 1.09 remained higher than the values of the late 1990s. A large decrease occurred in the very small optical category, but all of the drop was in 2002. Little change in location quotient occurred in the other high-technology categories between 2001 and 2005.
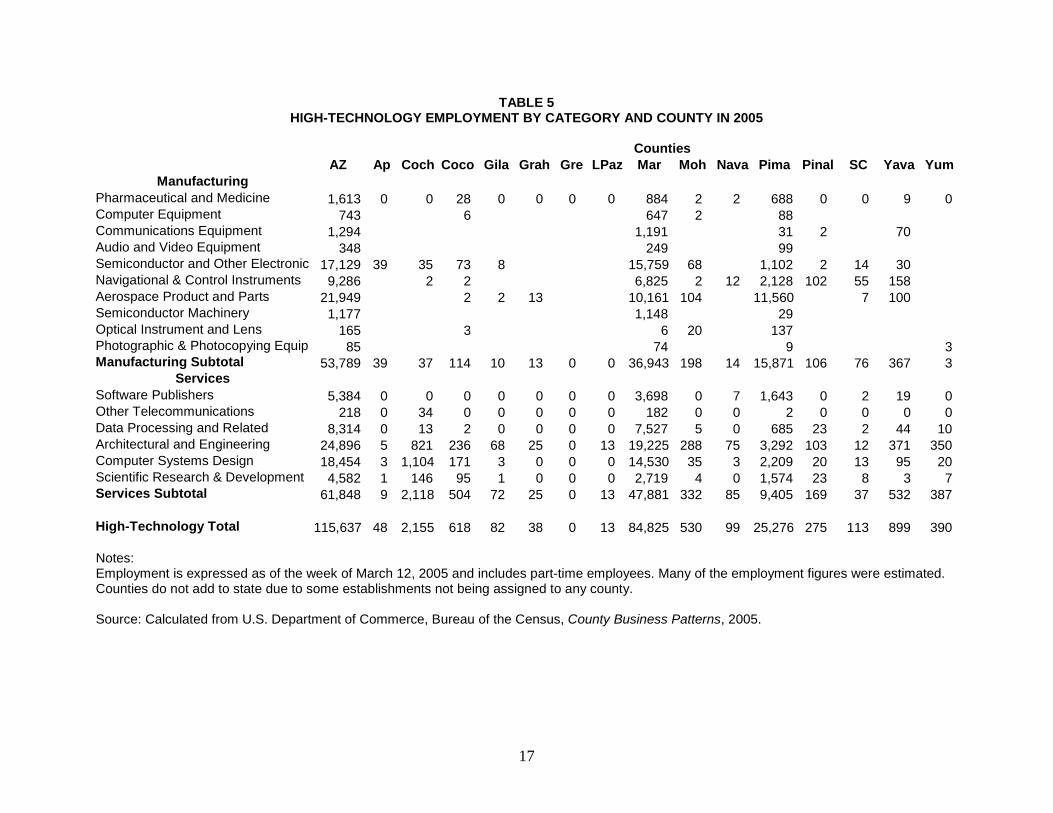
HIGH-TECHNOLOGY IN ARIZONA COUNTIES High-technology employment in Arizona is heavily concentrated in the state’s two highly
populous counties: Maricopa and Pima (see Table 5). Seventy-three percent of the high-tech employment was in Maricopa County in 2005, compared to the county’s 61 percent share of the state’s residents; the location quotient was 1.25. The concentration was stronger in Pima County, with 22 percent of the high-tech workers, compared to 15.5 percent of the residents; the location quotient was 1.47. Of the other 13 counties, only Cochise had a high-tech employment share close to its population share. Its location quotient was 0.92 — the next-highest figure was 0.27 in Coconino County.
Pima County was particularly strong in high-technology manufacturing, accounting for 30 percent of the state’s employment in 2005; its location quotient was 2.97, compared to 1.76 in Maricopa County. The highest location quotient in high-tech services was in Cochise County at 1.31. Maricopa County’s figure was barely greater than 1, but the location quotient in Pima County was less than 0.8.
Of the 16 high-technology categories, Maricopa County’s share of the state’s employment exceeded its population share in 12. More than 90 percent of the state’s employment was in Maricopa County in four categories, including the sizable categories of semiconductor and electronic component manufacturing (which had a location quotient of 3.55), and data processing (a location quotient of 1.62). The location quotient exceeded 2 in two other manufacturing categories: aerospace products and semiconductor machinery (see Table 6).
Pima County’s share of the state’s high-technology employment was greater than its population share in seven of the high-technology categories. Most notable was its 53 percent share and 9.57 location quotient in the sizable aerospace products category. Other categories
17
TABLE 5 HIGH-TECHNOLOGY EMPLOYMENT BY CATEGORY AND COUNTY IN 2005
Counties AZ Ap Coch Coco Gila Grah Gre LPaz Mar Moh Nava Pima Pinal SC Yava Yum
Manufacturing Pharmaceutical and Medicine 1,613 0 0 28 0 0 0 0 884 2 2 688 0 0 9 0 Computer Equipment 743 6 647 2 88 Communications Equipment 1,294 1,191 31 2 70 Audio and Video Equipment 348 249 99 Semiconductor and Other Electronic 17,129 39 35 73 8 15,759 68 1,102 2 14 30 Navigational & Control Instruments 9,286 2 2 6,825 2 12 2,128 102 55 158 Aerospace Product and Parts 21,949 2 2 13 10,161 104 11,560 7 100 Semiconductor Machinery 1,177 1,148 29 Optical Instrument and Lens 165 3 6 20 137 Photographic & Photocopying Equip 85 74 9 3 Manufacturing Subtotal 53,789 39 37 114 10 13 0 0 36,943 198 14 15,871 106 76 367 3
Services Software Publishers 5,384 0 0 0 0 0 0 0 3,698 0 7 1,643 0 2 19 0 Other Telecommunications 218 0 34 0 0 0 0 0 182 0 0 2 0 0 0 0 Data Processing and Related 8,314 0 13 2 0 0 0 0 7,527 5 0 685 23 2 44 10 Architectural and Engineering 24,896 5 821 236 68 25 0 13 19,225 288 75 3,292 103 12 371 350 Computer Systems Design 18,454 3 1,104 171 3 0 0 0 14,530 35 3 2,209 20 13 95 20 Scientific Research & Development 4,582 1 146 95 1 0 0 0 2,719 4 0 1,574 23 8 3 7 Services Subtotal 61,848 9 2,118 504 72 25 0 13 47,881 332 85 9,405 169 37 532 387 High-Technology Total 115,637 48 2,155 618 82 38 0 13 84,825 530 99 25,276 275 113 899 390 Notes: Employment is expressed as of the week of March 12, 2005 and includes part-time employees. Many of the employment figures were estimated. Counties do not add to state due to some establishments not being assigned to any county. Source: Calculated from U.S. Department of Commerce, Bureau of the Census, County Business Patterns, 2005.

18
TABLE 6 HIGH-TECHNOLOGY LOCATION QUOTIENTS BY CATEGORY AND COUNTY IN 2005
Counties AZ Ap Coch Coco Gila Grah Gre LPaz Mar Moh Nava Pima Pinal SC Yava Yum
Manufacturing Pharmaceutical and Medicine 0.32 0.00 0.00 0.27 0.00 0.00 0.00 0.00 0.29 0.01 0.02 0.89 0.00 0.00 0.05 0.00 Computer Equipment 0.35 0.00 0.00 0.13 0.00 0.00 0.00 0.00 0.49 0.03 0.00 0.26 0.00 0.00 0.00 0.00 Communications Equipment 0.46 0.00 0.00 0.00 0.00 0.00 0.00 0.00 0.70 0.00 0.00 0.07 0.02 0.00 0.75 0.00 Audio and Video Equipment 0.84 0.00 0.00 0.00 0.00 0.00 0.00 0.00 0.98 0.00 0.00 1.53 0.00 0.00 0.00 0.00 Semiconductor and Other Electronic 2.36 0.46 0.23 0.48 0.13 0.00 0.00 0.00 3.55 0.30 0.00 0.98 0.01 0.27 0.12 0.00 Navigational & Control Instruments 1.17 0.00 0.01 0.01 0.00 0.00 0.00 0.00 1.40 0.01 0.08 1.72 0.32 0.98 0.59 0.00 Aerospace Product and Parts 2.82 0.00 0.00 0.01 0.03 0.30 0.00 0.00 2.14 0.43 0.00 9.57 0.00 0.13 0.39 0.00 Semiconductor Machinery 2.29 0.00 0.00 0.00 0.00 0.00 0.00 0.00 3.66 0.00 0.00 0.36 0.00 0.00 0.00 0.00 Optical Instrument and Lens 0.50 0.00 0.00 0.44 0.00 0.00 0.00 0.00 0.03 1.94 0.00 2.67 0.00 0.00 0.00 0.00 Photographic & Photocopying Equip 0.54 0.00 0.00 0.00 0.00 0.00 0.00 0.00 0.76 0.00 0.00 0.36 0.00 0.00 0.00 0.62 Manufacturing Subtotal 1.57 0.10 0.05 0.16 0.03 0.07 0.00 0.00 1.76 0.18 0.02 2.97 0.08 0.31 0.32 0.00
Services Software Publishers 0.82 0.00 0.00 0.00 0.00 0.00 0.00 0.00 0.92 0.00 0.06 1.61 0.00 0.04 0.09 0.00 Other Telecommunications 1.18 0.00 8.72 0.00 0.00 0.00 0.00 0.00 1.62 0.00 0.00 0.07 0.00 0.00 0.00 0.00 Data Processing and Related 1.09 0.00 0.08 0.01 0.00 0.00 0.00 0.00 1.62 0.02 0.00 0.58 0.07 0.04 0.17 0.04 Architectural and Engineering 0.96 0.02 1.49 0.44 0.30 0.17 0.00 0.15 1.21 0.35 0.16 0.81 0.10 0.07 0.43 0.44 Computer Systems Design 0.81 0.01 2.29 0.36 0.02 0.00 0.00 0.00 1.05 0.05 0.01 0.63 0.02 0.08 0.13 0.03 Scientific Research & Development 0.35 0.01 0.52 0.34 0.01 0.00 0.00 0.00 0.34 0.01 0.00 0.76 0.04 0.09 0.01 0.02 Services Subtotal 0.81 0.01 1.31 0.32 0.11 0.06 0.00 0.05 1.03 0.14 0.06 0.79 0.05 0.07 0.21 0.17 High-Technology Total 1.04 0.04 0.92 0.27 0.09 0.06 0.00 0.03 1.25 0.15 0.05 1.47 0.06 0.14 0.24 0.12 Note: Location quotients of 1.10 or higher are in bold. Source: Calculated from U.S. Department of Commerce, Bureau of the Census, County Business Patterns, 2005.

19
with a location quotient greater than 1.6 were optical instruments, navigational and control instruments, and software publishers.
Little high-technology employment was located in the other 13 counties. While more than 23 percent of the state’s residents live in these counties, the 13 counties accounted for less than 5 percent of the state’s high-technology employment in 2005. The share was less than 20 percent in each category and exceeded 10 percent only in the small optical instruments and other telecommunications categories.
Of the 16 high-technology categories in the 13 less populous counties, only four of 208 had a location quotient greater than 1 in 2005. One was the small optical instruments category in Mohave County. The other three were in service categories in Cochise County, largely the result of services provided to Fort Huachuca. Two of these categories had many employees nationally and in Arizona: computer systems design (a location quotient of 2.29) and engineering (a location quotient of 1.49).
The decline in the state’s high-technology location quotient between 2001 and 2005 resulted from drops in Pima County and Maricopa County. Both counties had a significant decline in high-tech manufacturing — though the drop was much larger in Maricopa County than Pima County — and a minor decrease in high-tech services. The location quotients in the other counties did not change much, with more counties posting an increase than a decrease.
Among the manufacturing categories, the state’s decline in aerospace was entirely in Maricopa County; the location quotient in Pima County rose between 2001 and 2005. The large loss in the semiconductor and electronic component category mostly occurred in Maricopa County, though Pima County’s location quotient also fell. In the navigational and control instruments category, the location quotient rose in Pima County, but slipped in Maricopa County. Among the smaller categories, the pharmaceuticals location quotient rose in Pima County and was little changed in Maricopa County, the communications equipment figure fell in both counties and by a large amount in Maricopa County, but the semiconductor machinery value jumped in Maricopa County while falling in Pima County.
In the services categories, the decrease in the state’s location quotient in data processing was entirely in Maricopa County. However, Pima County was responsible for the decline in the research and development category.
ECONOMIC IMPACT OF HIGH TECHNOLOGY IN ARIZONA A high proportion of the goods and services produced by high-technology activities are sold to consumers from outside the state. Thus, these activities import monies into Arizona that would not be present if these activities were not physically located in the state. In contrast, most economic activities primarily serve local residents. Sales by such local support activities thus largely represent a recycling of monies already present in the local economy.
Economic impact analysis traces the full impact, direct and indirect, of an economic activity on jobs and incomes in a local economy. An economic activity directly affects an economy by employing workers and paying income to workers and owners. Indirect effects arise when goods and services are purchased from other local businesses, when these suppliers place upstream demands on other producers, when workers either directly or indirectly associated with the operations spend a portion of their incomes in the local economy, and when governments spend new tax revenues. In the end, the cumulative changes in jobs and incomes are a multiple of the initial direct effects.
20
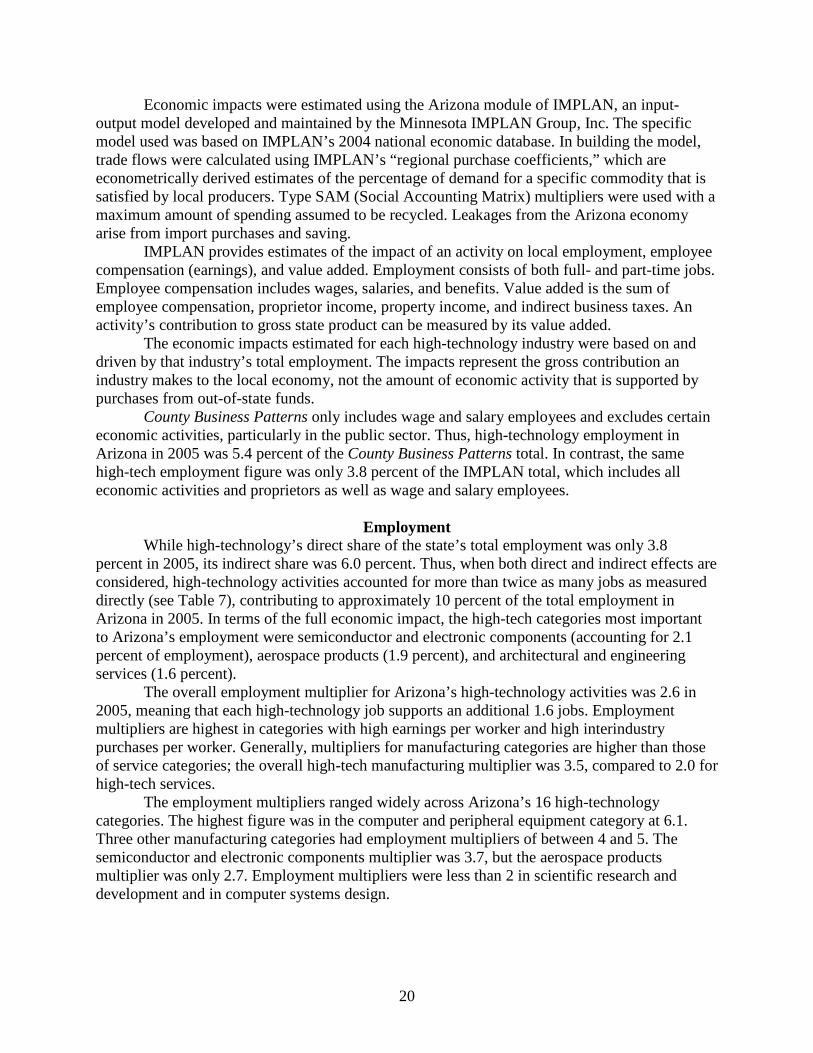
Economic impacts were estimated using the Arizona module of IMPLAN, an input-output model developed and maintained by the Minnesota IMPLAN Group, Inc. The specific model used was based on IMPLAN’s 2004 national economic database. In building the model, trade flows were calculated using IMPLAN’s “regional purchase coefficients,” which are econometrically derived estimates of the percentage of demand for a specific commodity that is satisfied by local producers. Type SAM (Social Accounting Matrix) multipliers were used with a maximum amount of spending assumed to be recycled. Leakages from the Arizona economy arise from import purchases and saving. IMPLAN provides estimates of the impact of an activity on local employment, employee compensation (earnings), and value added. Employment consists of both full- and part-time jobs. Employee compensation includes wages, salaries, and benefits. Value added is the sum of employee compensation, proprietor income, property income, and indirect business taxes. An activity’s contribution to gross state product can be measured by its value added. The economic impacts estimated for each high-technology industry were based on and driven by that industry’s total employment. The impacts represent the gross contribution an industry makes to the local economy, not the amount of economic activity that is supported by purchases from out-of-state funds.
County Business Patterns only includes wage and salary employees and excludes certain economic activities, particularly in the public sector. Thus, high-technology employment in Arizona in 2005 was 5.4 percent of the County Business Patterns total. In contrast, the same high-tech employment figure was only 3.8 percent of the IMPLAN total, which includes all economic activities and proprietors as well as wage and salary employees.
Employment While high-technology’s direct share of the state’s total employment was only 3.8
percent in 2005, its indirect share was 6.0 percent. Thus, when both direct and indirect effects are considered, high-technology activities accounted for more than twice as many jobs as measured directly (see Table 7), contributing to approximately 10 percent of the total employment in Arizona in 2005. In terms of the full economic impact, the high-tech categories most important to Arizona’s employment were semiconductor and electronic components (accounting for 2.1 percent of employment), aerospace products (1.9 percent), and architectural and engineering services (1.6 percent). The overall employment multiplier for Arizona’s high-technology activities was 2.6 in 2005, meaning that each high-technology job supports an additional 1.6 jobs. Employment multipliers are highest in categories with high earnings per worker and high interindustry purchases per worker. Generally, multipliers for manufacturing categories are higher than those of service categories; the overall high-tech manufacturing multiplier was 3.5, compared to 2.0 for high-tech services.
The employment multipliers ranged widely across Arizona’s 16 high-technology categories. The highest figure was in the computer and peripheral equipment category at 6.1. Three other manufacturing categories had employment multipliers of between 4 and 5. The semiconductor and electronic components multiplier was 3.7, but the aerospace products multiplier was only 2.7. Employment multipliers were less than 2 in scientific research and development and in computer systems design.

21
TABLE 7 ECONOMIC IMPACT OF HIGH-TECHNOLOGY ACTIVITIES ON THE ARIZONA ECONOMY IN 2005
Direct Effects Total Effects
Employment
Value Added Employee
Compensation
Employment
Value Added Employee
Compensation Manufacturing
Pharmaceutical and Medicine 1,613 $357,155 $116,863 7,829 $830,151 $358,611 Computer and Peripheral Equipment 743 69,822 77,106 4,503 365,606 248,450 Communications Equipment 1,294 108,148 100,865 4,580 353,758 236,303 Audio and Video Equipment 348 18,988 17,738 1,499 99,172 63,710 Semiconductor and Other Electronic Component 17,129 2,090,364 1,690,555 63,730 5,385,903 3,481,489 Navigational, Measuring & Control Instruments 9,286 971,003 925,426 27,412 2,243,309 1,621,830 Aerospace Product and Parts 21,949 2,347,355 1,977,909 58,802 4,923,024 3,410,926 Semiconductor Machinery 1,177 183,144 122,597 4,867 445,042 264,338 Optical Instrument and Lens 165 10,532 8,796 362 24,349 16,173 Photographic and Photocopying Equipment 85 9,747 6,454 296 25,632 14,912 Manufacturing Subtotal 53,789 6,166,256 5,044,308 173,880 14,695,946 9,716,743
Services Software Publishers 5,384 670,825 351,873 16,433 1,354,981 713,570 Other Telecommunications 218 33,793 11,938 579 59,842 24,647 Data Processing, Hosting and Related 8,314 646,305 429,940 20,050 1,356,829 810,911 Architectural, Engineering and Related 24,896 1,542,839 1,144,262 49,283 3,021,148 1,919,718 Computer Systems Design and Related 18,454 968,121 901,203 30,941 1,721,543 1,284,952 Scientific Research and Development 4,582 254,516 213,545 8,374 494,052 333,748 Services Subtotal 61,848 4,116,398 3,052,759 125,660 8,008,395 5,087,546 High-Technology Total 115,637 10,282,654 8,097,066 299,540 22,704,341 14,804,289 Note: Dollar values are in thousands. Source: Calculated from IMPLAN.

22
Value Added The direct value added (gross state product) of high technology was $10.3 billion, according to the IMPLAN model. At 5.1 percent, high-tech’s share of the state’s total value added was higher than its share of employment, a reflection particularly of the high wages associated with high technology. The share of the total value added coming from high-tech’s direct and indirect effects (11.4 percent) was more than twice as large as the direct share. Two high-tech categories accounted for much larger amounts of direct and indirect value added than the other categories: semiconductors and electronic components (2.7 percent of the total), and aerospace products (2.5 percent). The value-added multiplier for high-technology activities as a whole was 2.2 in 2005. Value-added multipliers tend to be highest in categories that place heavy demands on local suppliers in other industries and where earnings account for a large share of value added. Labor intensity is important because in regional input-output models labor income is assumed to be recycled within the local economy while capital income is not. The high-tech manufacturing multiplier was 2.6 while the services figure was 1.9. Two categories had high value-added multipliers at 5.2: computer equipment, and audio and visual equipment. The next-highest multiplier was 3.3; in most high-tech categories, the figure was between 1.8 and 2.6.
Employee Compensation High technology’s direct share of employee compensation was 7.2 percent, higher than each of the shares of employment and value added. Including indirect effects, high-tech’s share was less than twice as much as the direct share at 13.2 percent. Again, semiconductors and electronic components and aerospace products had the highest values, each accounting for 3.1 percent of the state’s total. High-technology activities in Arizona had an overall earnings multiplier of 1.8 in 2005. Earnings multipliers are highest in industries with large interindustry purchases per dollar of earnings. The multiplier was 2.3 for high-tech manufacturing and 1.7 for services. Three categories had earnings multipliers of more than 3: audio and visual equipment, computer equipment, and pharmaceuticals and medicines. Most high-tech categories had compensation multipliers between 1.6 and 2.3. Computer systems design had the lowest multiplier at 1.4.