Embed Size (px)
Citation preview
Proceedings of the National Seminar & Exhibitionon Non-Destructive Evaluation
NDE 2011, December 8-10, 2011
The high-speed time-average digital holography techniquereported in this paper has lot of advantages over theshearography techniques. The high sensitivity to deformation,large coverage area and high quality fringes with low specklenoises are a few of the advantages, which guarantees fast andcent percentage debond detection. This paper gives details ofthe basic theory of the technique, experimental details,validation, vibration stressing method, holographic fringesignature analysis and application test results.
2. TIME AVERAGE DIGITAL HOLOGRAPHY
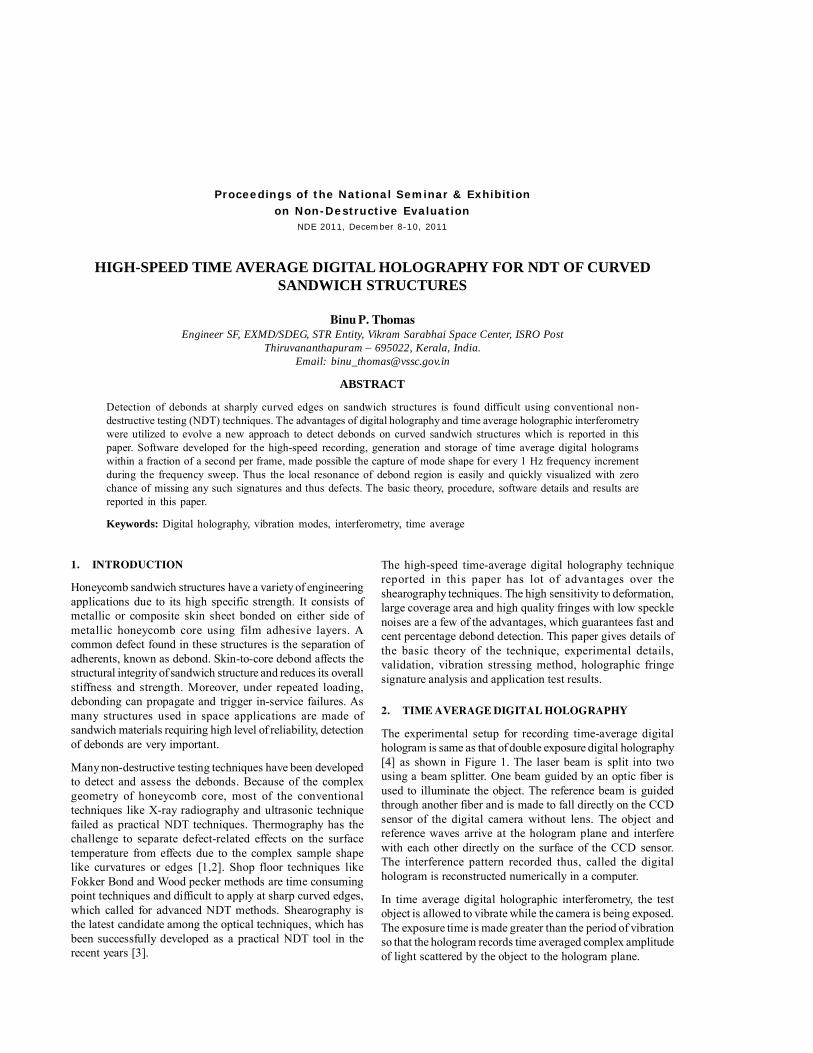
The experimental setup for recording time-average digitalhologram is same as that of double exposure digital holography[4] as shown in Figure 1. The laser beam is split into twousing a beam splitter. One beam guided by an optic fiber isused to illuminate the object. The reference beam is guidedthrough another fiber and is made to fall directly on the CCDsensor of the digital camera without lens. The object andreference waves arrive at the hologram plane and interferewith each other directly on the surface of the CCD sensor.The interference pattern recorded thus, called the digitalhologram is reconstructed numerically in a computer.
In time average digital holographic interferometry, the testobject is allowed to vibrate while the camera is being exposed.The exposure time is made greater than the period of vibrationso that the hologram records time averaged complex amplitudeof light scattered by the object to the hologram plane.
HIGH-SPEED TIME AVERAGE DIGITAL HOLOGRAPHY FOR NDT OF CURVEDSANDWICH STRUCTURES
Binu P. ThomasEngineer SF, EXMD/SDEG, STR Entity, Vikram Sarabhai Space Center, ISRO Post
Thiruvananthapuram – 695022, Kerala, India.Email: [email protected]
ABSTRACT
Detection of debonds at sharply curved edges on sandwich structures is found difficult using conventional non-destructive testing (NDT) techniques. The advantages of digital holography and time average holographic interferometrywere utilized to evolve a new approach to detect debonds on curved sandwich structures which is reported in thispaper. Software developed for the high-speed recording, generation and storage of time average digital hologramswithin a fraction of a second per frame, made possible the capture of mode shape for every 1 Hz frequency incrementduring the frequency sweep. Thus the local resonance of debond region is easily and quickly visualized with zerochance of missing any such signatures and thus defects. The basic theory, procedure, software details and results arereported in this paper.
Keywords: Digital holography, vibration modes, interferometry, time average
1. INTRODUCTION
Honeycomb sandwich structures have a variety of engineeringapplications due to its high specific strength. It consists ofmetallic or composite skin sheet bonded on either side ofmetallic honeycomb core using film adhesive layers. Acommon defect found in these structures is the separation ofadherents, known as debond. Skin-to-core debond affects thestructural integrity of sandwich structure and reduces its overallstiffness and strength. Moreover, under repeated loading,debonding can propagate and trigger in-service failures. Asmany structures used in space applications are made ofsandwich materials requiring high level of reliability, detectionof debonds are very important.
Many non-destructive testing techniques have been developedto detect and assess the debonds. Because of the complexgeometry of honeycomb core, most of the conventionaltechniques like X-ray radiography and ultrasonic techniquefailed as practical NDT techniques. Thermography has thechallenge to separate defect-related effects on the surfacetemperature from effects due to the complex sample shapelike curvatures or edges [1,2]. Shop floor techniques likeFokker Bond and Wood pecker methods are time consumingpoint techniques and difficult to apply at sharp curved edges,which called for advanced NDT methods. Shearography isthe latest candidate among the optical techniques, which hasbeen successfully developed as a practical NDT tool in therecent years [3].
If do(x, y) is the amplitude of mechanical vibration at location(x, y) and ω is the circular frequency of vibration then thedisplacement of a point on the vibrating object at time t isgiven by the relation [5] d(x, y, t) = do(x, y) sin ωt.
The phase shift ΔΦ of the light scattered from this point isthen a function of time, which is given as [5] (ΔΦ(x, y, t)=k.do(x, y) sin ωt where k is the sensitivity vector.
Now let O (x, y) = | O (x, y) | e-iΦ(x, y) represent complexamplitude of the scattering light when the object is stationary,where | O (x, y) | and Φ(x, y) are the amplitude and phaserespectively of the scattering light at a point (x, y). Thencomplex amplitude of the scattering light of the vibratingobject at any instant t, is given by [5]
O (x, y, t)= %O (x, y)%e-i [Φ(x, y)+k. do (x, y) sin ωt ]
The complex amplitude u (x, y) of the wave reconstructed bythe hologram is given by [6]
where T is the exposure time interval and MT(x,y) is known asthe characteristic function.
If the exposure time is long com
pared
to the period of vibration then MT is given by [6] as,
where J0 is the zero order Bessel function of the first kind [6].The intensity in the reconstructed image is then given by [6]as
I(x,y) = u(x,y) . u(x,y)* = |O(x,y) MT(x,y) |2
∝ J02(Z)
where Z = k. do(x, y).
Hence the intensity of the time average holographicinterferogram is proportional to the squared zero order Besselfunction. The dark fringes, at which the intensity drops to zero,correspond to the zeros of the function J0
2(Z) and the brightfringes to its maxima [6]. The nodes of the vibrating object(for which the amplitude of oscillation is zero) yield themaximum possible value for the squared zero-order Besselfunction, and therefore appear brighter than any other featurein the holographic interferogram. Hence the fringe patternrecorded through time average holography visually indicateswhere the vibrations are occurring and how strong they are atany given point on the surface of the object.
3. VIBRATION STRESSING
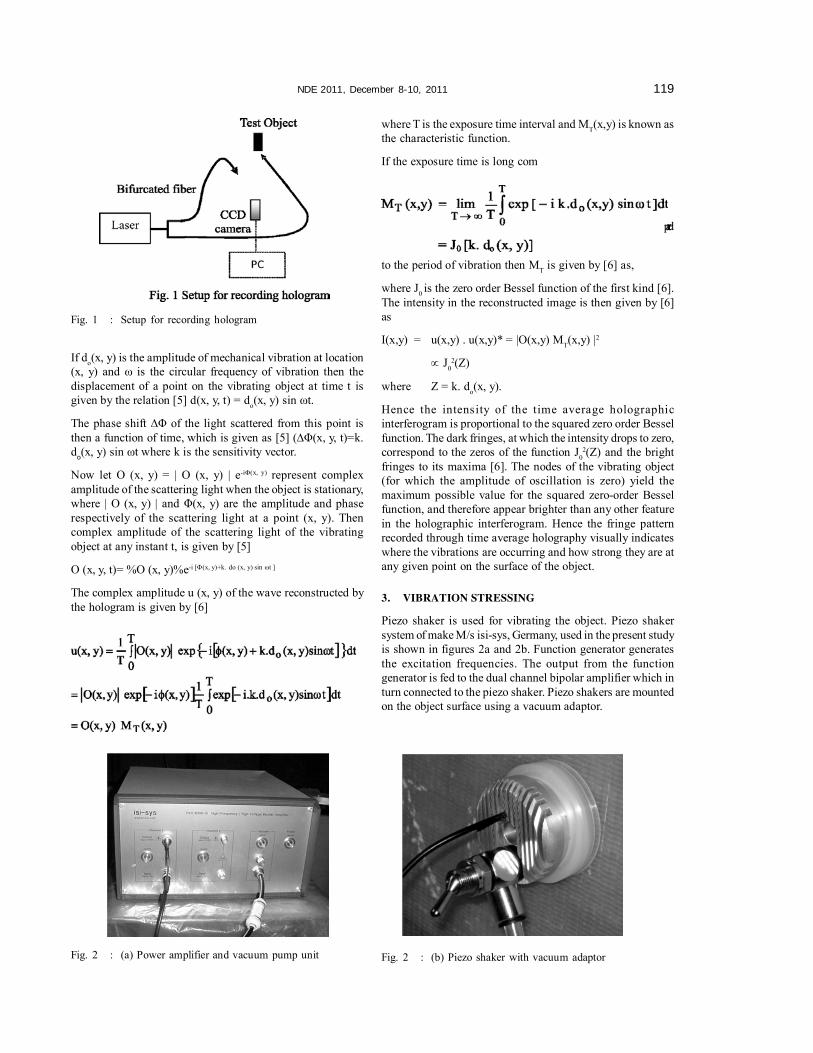
Piezo shaker is used for vibrating the object. Piezo shakersystem of make M/s isi-sys, Germany, used in the present studyis shown in figures 2a and 2b. Function generator generatesthe excitation frequencies. The output from the functiongenerator is fed to the dual channel bipolar amplifier which inturn connected to the piezo shaker. Piezo shakers are mountedon the object surface using a vacuum adaptor.
Fig. 1 : Setup for recording hologram
Fig. 2 : (a) Power amplifier and vacuum pump unit Fig. 2 : (b) Piezo shaker with vacuum adaptor
NDE 2011, December 8-10, 2011 119
120 Binu P. Thomas : Proceedings of the National Seminar & Exhibition on Non-Destructive Evaluation
4. NUMERICAL RECONSTRUCTION SOFTWARE
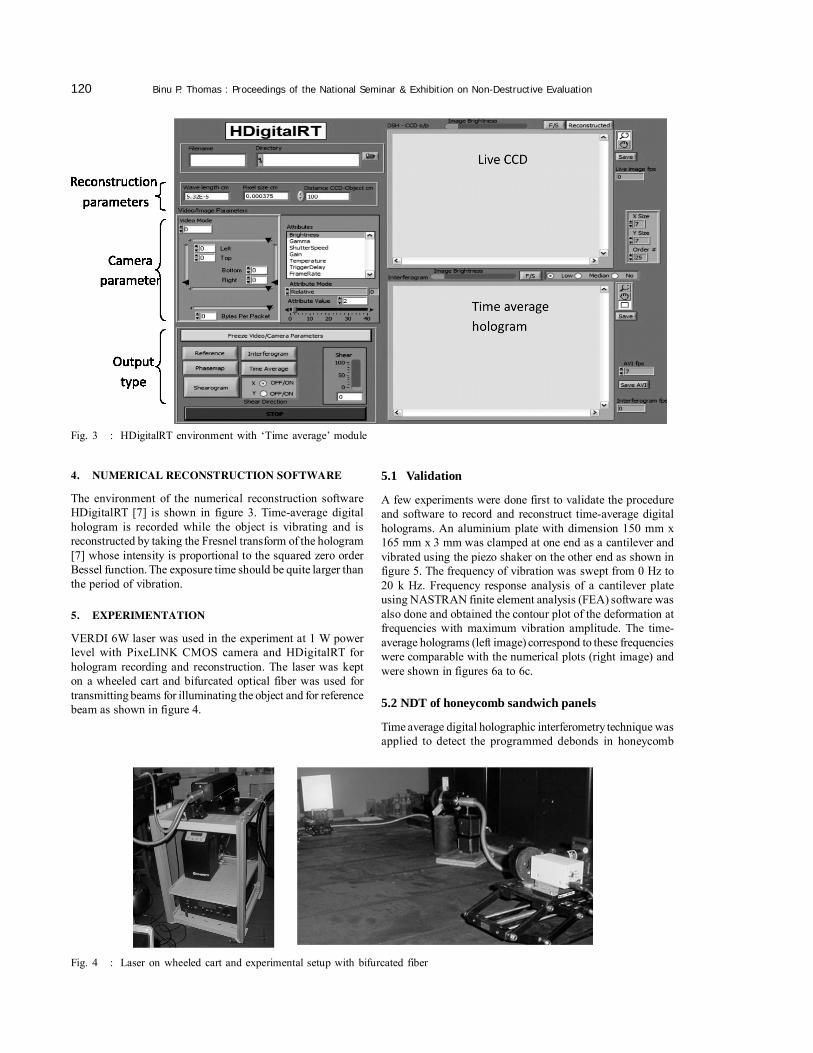
The environment of the numerical reconstruction softwareHDigitalRT [7] is shown in figure 3. Time-average digitalhologram is recorded while the object is vibrating and isreconstructed by taking the Fresnel transform of the hologram[7] whose intensity is proportional to the squared zero orderBessel function. The exposure time should be quite larger thanthe period of vibration.
5. EXPERIMENTATION
VERDI 6W laser was used in the experiment at 1 W powerlevel with PixeLINK CMOS camera and HDigitalRT forhologram recording and reconstruction. The laser was kepton a wheeled cart and bifurcated optical fiber was used fortransmitting beams for illuminating the object and for referencebeam as shown in figure 4.
5.1 Validation
A few experiments were done first to validate the procedureand software to record and reconstruct time-average digitalholograms. An aluminium plate with dimension 150 mm x165 mm x 3 mm was clamped at one end as a cantilever andvibrated using the piezo shaker on the other end as shown infigure 5. The frequency of vibration was swept from 0 Hz to20 k Hz. Frequency response analysis of a cantilever plateusing NASTRAN finite element analysis (FEA) software wasalso done and obtained the contour plot of the deformation atfrequencies with maximum vibration amplitude. The time-average holograms (left image) correspond to these frequencieswere comparable with the numerical plots (right image) andwere shown in figures 6a to 6c.
5.2 NDT of honeycomb sandwich panels
Time average digital holographic interferometry technique wasapplied to detect the programmed debonds in honeycomb
Fig. 3 : HDigitalRT environment with ‘Time average’ module
Fig. 4 : Laser on wheeled cart and experimental setup with bifurcated fiber
NDE 2011, December 8-10, 2011 121
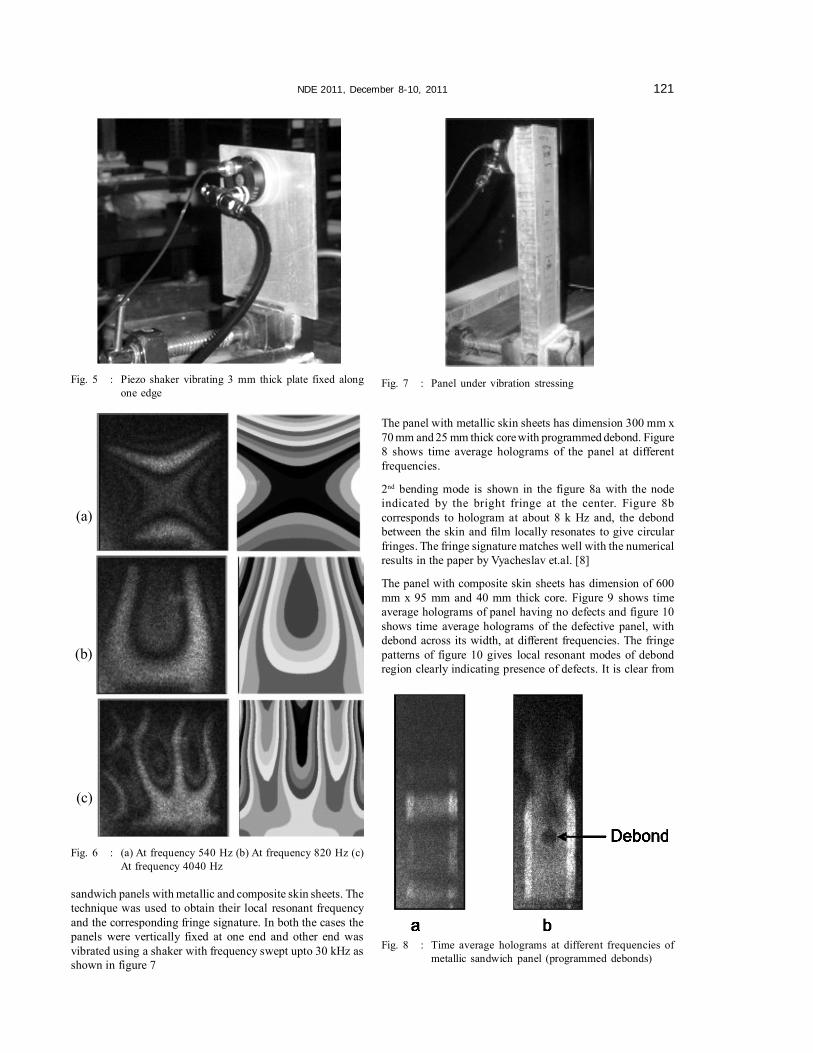
The panel with metallic skin sheets has dimension 300 mm x70 mm and 25 mm thick core with programmed debond. Figure8 shows time average holograms of the panel at differentfrequencies.
2nd bending mode is shown in the figure 8a with the nodeindicated by the bright fringe at the center. Figure 8bcorresponds to hologram at about 8 k Hz and, the debondbetween the skin and film locally resonates to give circularfringes. The fringe signature matches well with the numericalresults in the paper by Vyacheslav et.al. [8]
The panel with composite skin sheets has dimension of 600mm x 95 mm and 40 mm thick core. Figure 9 shows timeaverage holograms of panel having no defects and figure 10shows time average holograms of the defective panel, withdebond across its width, at different frequencies. The fringepatterns of figure 10 gives local resonant modes of debondregion clearly indicating presence of defects. It is clear from
Fig. 5 : Piezo shaker vibrating 3 mm thick plate fixed alongone edge
Fig. 6 : (a) At frequency 540 Hz (b) At frequency 820 Hz (c)At frequency 4040 Hz
(a)
(b)
(c)
sandwich panels with metallic and composite skin sheets. Thetechnique was used to obtain their local resonant frequencyand the corresponding fringe signature. In both the cases thepanels were vertically fixed at one end and other end wasvibrated using a shaker with frequency swept upto 30 kHz asshown in figure 7
Fig. 7 : Panel under vibration stressing
Fig. 8 : Time average holograms at different frequencies ofmetallic sandwich panel (programmed debonds)

122 Binu P. Thomas : Proceedings of the National Seminar & Exhibition on Non-Destructive Evaluation
figure 10a that the size of the debond matches well with thatof its first local resonant mode.
6. NDT OF CURVED SANDWICH STRUCTURES
Sandwich structures made of metallic honeycomb sandwichpanels with folded type of joints making three curved edgesas shown in the figure 11 were tested in this study. Vibration
stressing was applied using a piezo shaker and the frequencyof vibration swept from 1 Hz to 50 kHz maximum. Timeaverage holograms were recorded continuously in real timewith a frequency increment of minimum 1 Hz.
Figure 12 shows the mode shape of edge A at frequency of800 Hz. Figures 13 and 14 show time average holograms ofedge B at 800 Hz and 8 kHz respectively and local vibration
Fig. 9 : Time average holograms at different frequencies ofnon defective panel
Fig. 10 : Time average holograms at different frequencies ofdefective panel
Fig. 11 : Configuration of sandwich structure showing the threecurved edges A, B and C
Fig. 12 : Time averagehologram of edge A
Fig. 13 : Time average hologramof edge B at 800 Hz
Fig. 15 : Curved edge A and shaker
Fig. 14 : Time average hologram of edge B at 8 k Hz
NDE 2011, December 8-10, 2011 123
modes are not present in these holograms. Anomalous fringepatterns or local resonant modes are not observed throughoutthe frequency sweep at any of the three edges. Hence it isconcluded that no debond exists at any of the three curvededges.
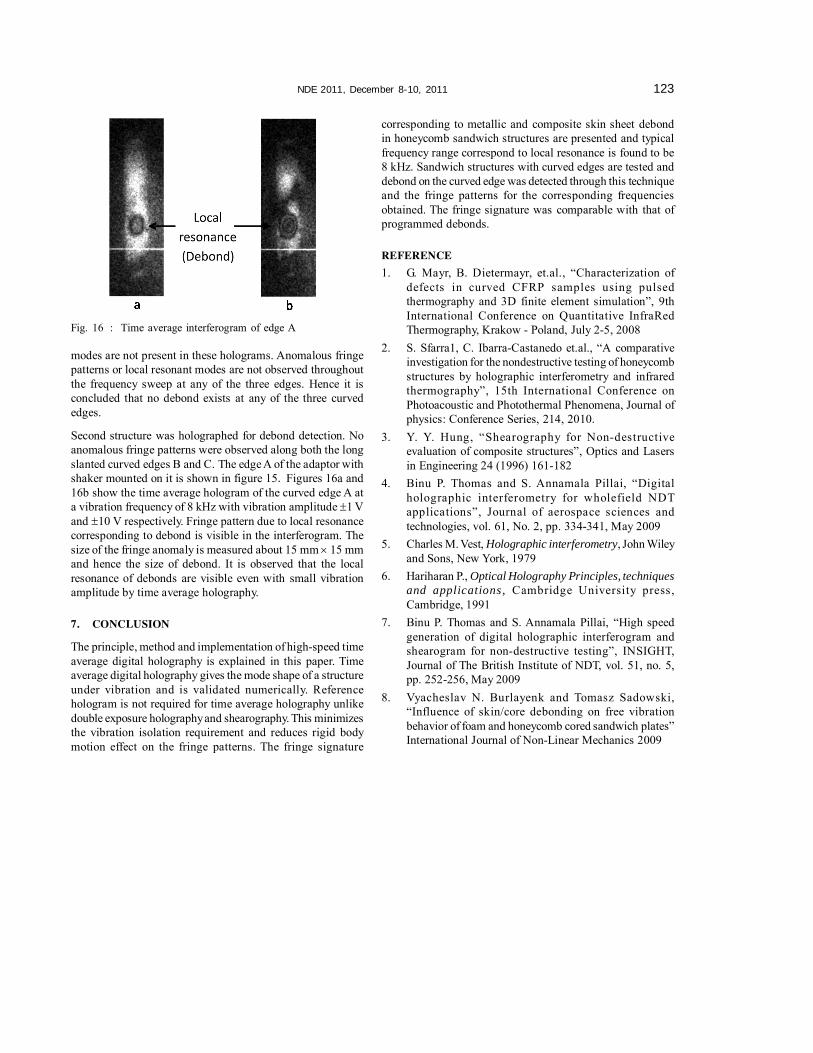
Second structure was holographed for debond detection. Noanomalous fringe patterns were observed along both the longslanted curved edges B and C. The edge A of the adaptor withshaker mounted on it is shown in figure 15. Figures 16a and16b show the time average hologram of the curved edge A ata vibration frequency of 8 kHz with vibration amplitude ±1 Vand ±10 V respectively. Fringe pattern due to local resonancecorresponding to debond is visible in the interferogram. Thesize of the fringe anomaly is measured about 15 mm × 15 mmand hence the size of debond. It is observed that the localresonance of debonds are visible even with small vibrationamplitude by time average holography.
7. CONCLUSION
The principle, method and implementation of high-speed timeaverage digital holography is explained in this paper. Timeaverage digital holography gives the mode shape of a structureunder vibration and is validated numerically. Referencehologram is not required for time average holography unlikedouble exposure holography and shearography. This minimizesthe vibration isolation requirement and reduces rigid bodymotion effect on the fringe patterns. The fringe signature
corresponding to metallic and composite skin sheet debondin honeycomb sandwich structures are presented and typicalfrequency range correspond to local resonance is found to be8 kHz. Sandwich structures with curved edges are tested anddebond on the curved edge was detected through this techniqueand the fringe patterns for the corresponding frequenciesobtained. The fringe signature was comparable with that ofprogrammed debonds.
REFERENCE
1. G. Mayr, B. Dietermayr, et.al., “Characterization ofdefects in curved CFRP samples using pulsedthermography and 3D finite element simulation”, 9thInternational Conference on Quantitative InfraRedThermography, Krakow - Poland, July 2-5, 2008
2. S. Sfarra1, C. Ibarra-Castanedo et.al., “A comparativeinvestigation for the nondestructive testing of honeycombstructures by holographic interferometry and infraredthermography”, 15th International Conference onPhotoacoustic and Photothermal Phenomena, Journal ofphysics: Conference Series, 214, 2010.
3. Y. Y. Hung, “Shearography for Non-destructiveevaluation of composite structures”, Optics and Lasersin Engineering 24 (1996) 161-182
4. Binu P. Thomas and S. Annamala Pillai, “Digitalholographic interferometry for wholefield NDTapplications”, Journal of aerospace sciences andtechnologies, vol. 61, No. 2, pp. 334-341, May 2009
5. Charles M. Vest, Holographic interferometry, John Wileyand Sons, New York, 1979
6. Hariharan P., Optical Holography Principles, techniquesand applications, Cambridge University press,Cambridge, 1991
7. Binu P. Thomas and S. Annamala Pillai, “High speedgeneration of digital holographic interferogram andshearogram for non-destructive testing”, INSIGHT,Journal of The British Institute of NDT, vol. 51, no. 5,pp. 252-256, May 2009
8. Vyacheslav N. Burlayenk and Tomasz Sadowski,“Influence of skin/core debonding on free vibrationbehavior of foam and honeycomb cored sandwich plates”International Journal of Non-Linear Mechanics 2009
Fig. 16 : Time average interferogram of edge A


![[DESIGN] Piezo-Piezo to Pie](https://img.dokumen.tips/doc/110x75/5571f8bb49795991698df909/design-piezo-piezo-to-pie.jpg)