Embed Size (px)
Citation preview

High Speed - Low Cost Rail Inspection Technology
Thomas R. Hay, D. Robert Hay WavesInSolids LLC, Madeira Beach, Fl. USA, C.M. Lee, J.L. Rose, The Pennsylvania State University.
Abstract In 2002, the US DOT solicited new technologies for high-speed low cost rail inspection under the DOT Small Business Innovative Research (SBIR) Program. The desired inspection speed was 30 MPH. The target flaws were transverse defects in the rail head 30% or greater in head cross-sectional area. The desired cost of the inspection technology was $50,000 not including the rail vehicle. This paper presents the evolution of a guided wave based rail inspection technology from conception to commercialization under the DOT SBIR Phase I and Phase II Programs. The paper presents the motivation for the research in terms of rail flaw statistics and current rail inspection technologies. The research and development during the initial feasibility studies is also presented. Finally, the first generation of the commercialized technology is presented. Introduction Transverse defects (TDs) are common causes of rail accidents if left undetected. As shown in Figure 1, TDs account for over one-third of total costs incurred by accidents. An example of a TD is shown in Figure 2. TDs are always located in the head and are oriented perpendicular to the direction of the rail longitudinal axis. An ultrasonic inspection technology designed to detect TDs, therefore, will focus energy in the head while being optimized for maximum ultrasonic energy reflection from reflectors oriented perpendicular to the rail longitudinal axis. These parameters, among others, were used as design guidelines during the development phase of the WavesinSolids’ rail inspection technology.
Figure 1. Distribution of harm by rail defect noting that transverse defects (detail fractures and transverse/compound fissures) account for over one-third of total costs incurred by accidents.
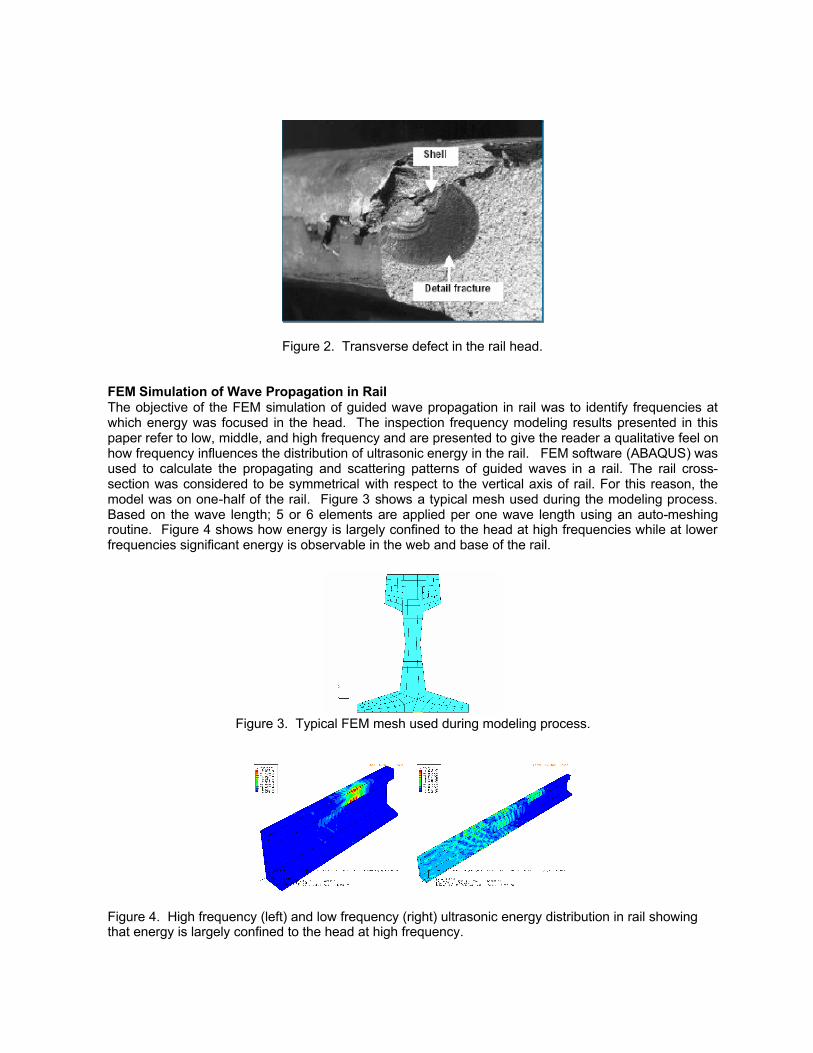
Figure 2. Transverse defect in the rail head.
FEM Simulation of Wave Propagation in Rail The objective of the FEM simulation of guided wave propagation in rail was to identify frequencies at which energy was focused in the head. The inspection frequency modeling results presented in this paper refer to low, middle, and high frequency and are presented to give the reader a qualitative feel on how frequency influences the distribution of ultrasonic energy in the rail. FEM software (ABAQUS) was used to calculate the propagating and scattering patterns of guided waves in a rail. The rail cross-section was considered to be symmetrical with respect to the vertical axis of rail. For this reason, the model was on one-half of the rail. Figure 3 shows a typical mesh used during the modeling process. Based on the wave length; 5 or 6 elements are applied per one wave length using an auto-meshing routine. Figure 4 shows how energy is largely confined to the head at high frequencies while at lower frequencies significant energy is observable in the web and base of the rail.
Figure 3. Typical FEM mesh used during modeling process.
Figure 4. High frequency (left) and low frequency (right) ultrasonic energy distribution in rail showing that energy is largely confined to the head at high frequency.
Transverse Defect Detection in the Field The technology was evaluated at select frequencies based on the modeling results at the Transportation Technology Center, Inc. in Pueblo, Colorado. The objective of the TTCI tests was to evaluate the technology on naturally occurring transverse defects which was not previously possible due mainly to the unavailability of quality test specimens. The TTCI tests provided the first opportunity for exposure to naturally occurring transverse defects. The objective of these trials was to demonstrate sensitivity to 30% CSA transverse defects. TTCI provided the location of numerous transverse defects to WavesinSolids in the 10 to 45% cross-sectional head area (CSHA) size range. The data acquisition system acquired data at a variety of different distances from these defects. The data presented in this section is designed to provide the reader with an intuitive understanding of sensitivity to transverse defects. Summarizing briefly the milestones:
• All transverse defects that TTCI staff supplied to WINS on the research track and on the evaluation track were detected.
• Transverse defects at other locations on both the research track and evaluation track were detected and verified by TTCI nondestructive testing technicians using standard angle beam ultrasonic testing.
• Transverse defects in the 10 to 45% CSA range were detected. Representative data from transverse defects are provided in Figures 5 to 9. Summary The paper summarizes the motivation for the development of an ultrasonic rail inspection technology that targets transverse defect detection in the rail head. An FEM ultrasonic wave propagation model was developed for rail to identify frequencies at which TD detection in the head is optimized. The detection capability of the inspection system was validating during field tests at TTCI on naturally occurring transverse defects. The results show that the technology can detect transverse defects in the 10% to 45% CSHA range. Acknowledgements WavesinSolids would like to acknowledged the contributed technical expertise of the FRA’s, Mr. Don Plotkin, and Volpe’s, Mr. Jeff Gordon, during all phases of this project.
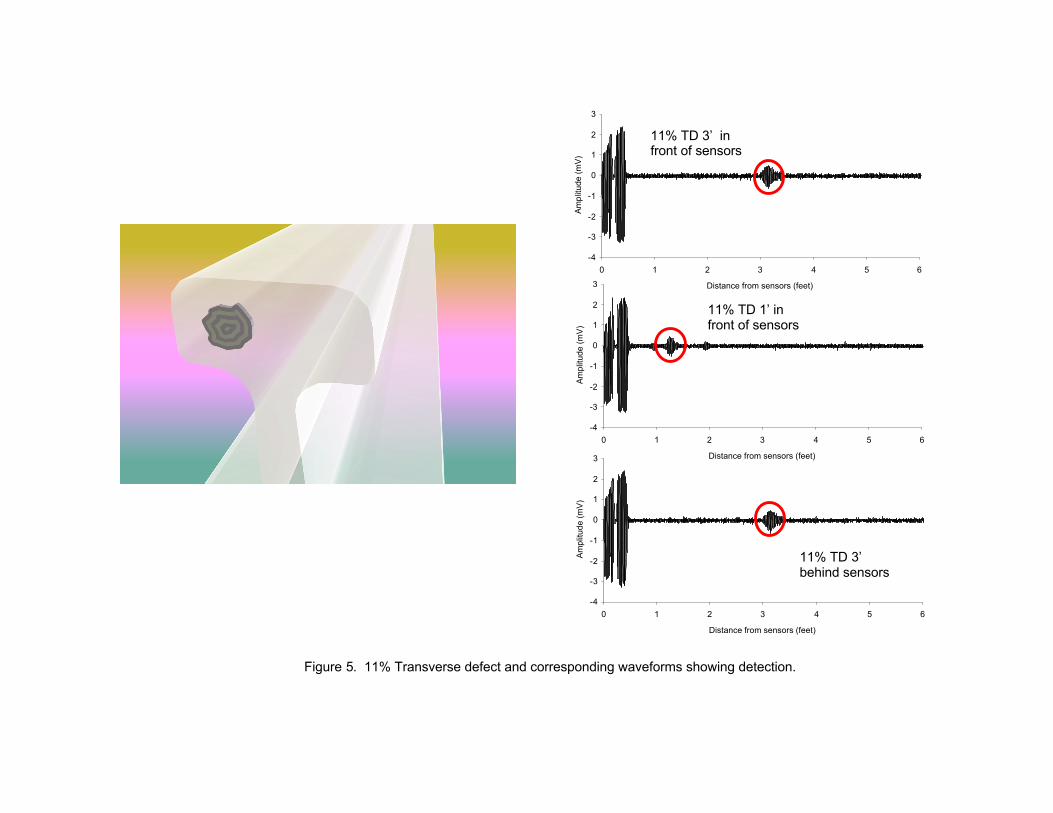
Figure 5. 11% Transverse defect and corresponding waveforms showing detection.
11% Transverse defect
11% TD 3’ in front of sensors
11% TD 1’ in front of sensors
11% TD 3’ behind sensors
-4
-3
-2
-1
0
1
2
3
0 1 2 3 4 5 6
Distance from sensors (feet)
Ampl
itude
(mV)
-4
-3
-2
-1
0
1
2
3
0 1 2 3 4 5 6
Distance from sensors (feet)
Ampl
itude
(mV)
-4
-3
-2
-1
0
1
2
3
0 1 2 3 4 5 6
Distance from sensors (feet)
Ampl
itude
(mV)

Figure 6. 35% Transverse defect and corresponding waveforms showing detection.
35% Transverse defect
35% TD 1’ in front of sensors
35% TD 3.5’ in front of
35% TD 5’ behind sensors
-4
-3
-2
-1
0
1
2
3
0 1 2 3 4 5 6
Distance from sensors (feet)
Am
plitu
de (m
V)
-4
-3
-2
-1
0
1
2
3
0 1 2 3 4 5 6
Distance from sensors (feet)
Am
plitu
de (m
V)
-4
-3
-2
-1
0
1
2
3
0 1 2 3 4 5 6
Distance from sensors (feet)
Am
plitu
de (m
V)
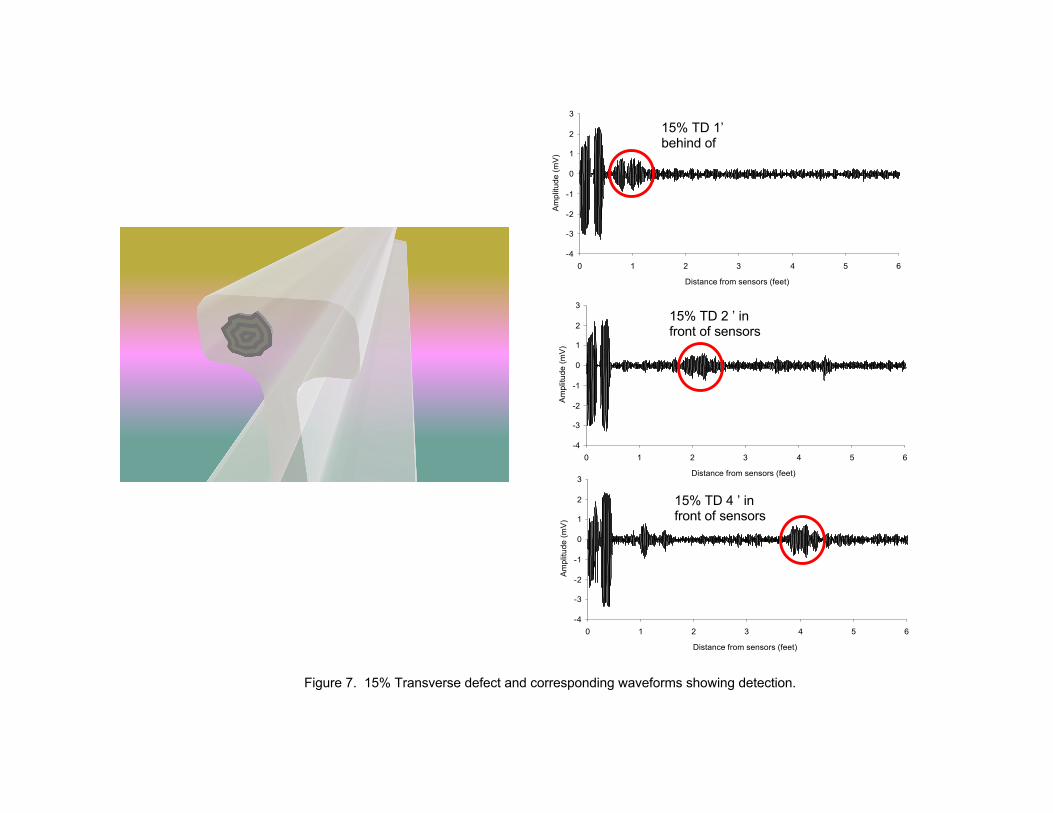
Figure 7. 15% Transverse defect and corresponding waveforms showing detection.
15% TD 1’ behind of
15% TD 2 ’ in front of sensors
15% TD 4 ’ in front of sensors
15% Transverse defect
-4
-3
-2
-1
0
1
2
3
0 1 2 3 4 5 6
Distance from sensors (feet)
Am
plitu
de (m
V)
-4
-3
-2
-1
0
1
2
3
0 1 2 3 4 5 6
Distance from sensors (feet)
Am
plitu
de (m
V)
-4
-3
-2
-1
0
1
2
3
0 1 2 3 4 5 6
Distance from sensors (feet)
Am
plitu
de (m
V)
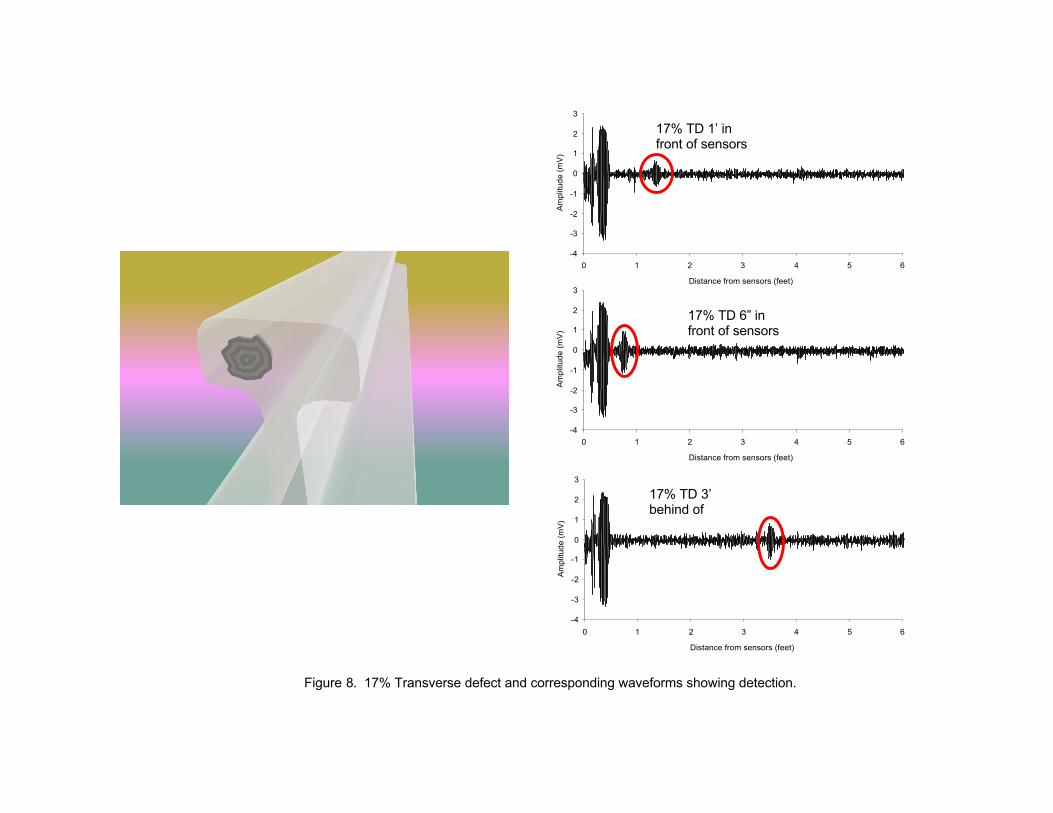
Figure 8. 17% Transverse defect and corresponding waveforms showing detection.
17% TD 1’ in front of sensors
17% TD 6” in front of sensors
17% TD 3’ behind of
17% Transverse defect
-4
-3
-2
-1
0
1
2
3
0 1 2 3 4 5 6
Distance from sensors (feet)
Am
plitu
de (m
V)
-4
-3
-2
-1
0
1
2
3
0 1 2 3 4 5 6
Distance from sensors (feet)
Am
plitu
de (m
V)
-4
-3
-2
-1
0
1
2
3
0 1 2 3 4 5 6
Distance from sensors (feet)
Am
plitu
de (m
V)
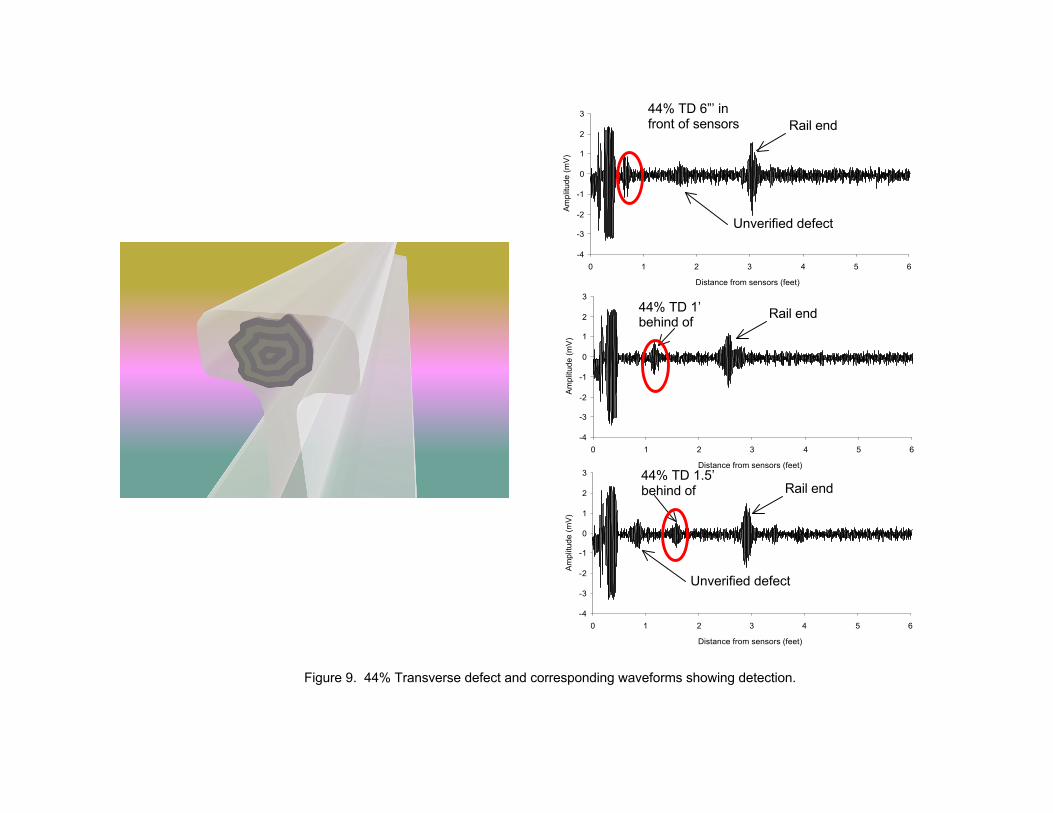
Figure 9. 44% Transverse defect and corresponding waveforms showing detection.
44% TD 6”’ in front of sensors
44% TD 1’ behind of
44% TD 1.5’ behind of
Rail end
Rail end
Rail end
Unverified defect
Unverified defect 44% Transverse defect
-4
-3
-2
-1
0
1
2
3
0 1 2 3 4 5 6
Distance from sensors (feet)
Am
plitu
de (m
V)
-4
-3
-2
-1
0
1
2
3
0 1 2 3 4 5 6
Distance from sensors (feet)
Am
plitu
de (m
V)
-4
-3
-2
-1
0
1
2
3
0 1 2 3 4 5 6
Distance from sensors (feet)
Am
plitu
de (m
V)