Embed Size (px)
Citation preview

i
VOT 74212
HIGH SENSITIVITY DIFFERENTIAL SCANNNING CALORIMETER
(HSDSC) TECHNIQUE FOR ASSAYING GINGER OLEORESIN
RESEARCH VOTE NO:
74212
PROF. MADYA DR. NOOR AZIAN BINTI HAJI MORAD
PROF. MADYA MUSTAFA KAMAL BIN ABD. AZIZ
CENTRE OF LIPIDS ENGINEERING AND APPLIED RESEARCH
(CLEAR)
UNIVERSITI TEKNOLOGI MALAYSIA
KUALA LUMPUR
2006

ii
This research work was funded by the government of Malaysia through IRPA grant. The
authors also wish to thank individuals and organizations that have contributed to this
work.
iii
ABSTRACT
Thermal analysis that is DSC ‘heat-flux’ type was studied as additional or
supportive technique to the analytical technique commonly used such as chromatographic,
spectroscopic and combination of chromatographic-spectroscopic. Two medicinal plants
of Zingiberaceae, that is Zingiber officinale Roscoe (ginger) and Zingiber zerumbet Smith
(wild ginger) were investigated. The dried rhizomes of ginger were extracted using solvent
extraction techniques to produce crude product (oleoresin) while the fresh rhizomes of
wild ginger were extracted using hydrodistillation to produce the essential oil. The major
compounds were separated and purified by means of several chromatographic techniques
including vacuum column chromatography, gravity column chromatography and
preparative thin layer chromatography. The structures were elucidated using spectroscopic
methods including 1H NMR, 13C NMR, IR, GC and GC-MS. Two pure compounds were
isolated from Z. officinale oleoresin and identified as 6-gingerol (brownish viscous liquid)
and 6-shogaol (yellowish viscous liquid), while zerumbone (white crystals) was isolated
from Z. zerumbet essential oil. The crude product as well as the pure compounds were
analysed by using DSC technique. This method can be used to identify the major
compound in crude product based on qualitative investigation of thermal behaviour
(melting point, Tm and heat of fusion, ΔHf). DSC can also estimate the purity of a
substance based on the shape and temperature of the DSC melting endotherm. Sharp peak
indicated pure compound while broad peak showed a mixture of various compounds.
Key researchers :
Prof. Madya Dr. Noor Azian Morad
Prof. Madya Mustafa Kamal Abd Aziz
Prof. Madya Dr. Yasmin Anum
E − mail : [email protected]
Telephone no. : 03−2615 4894
Vote no. : 74212

iv
ABSTRAK
Analisis terma iaitu DSC jenis ‘heat-flux’ adalah dikaji sebagai teknik tambahan
atau sokongan di samping teknik-teknik analisis yang selalu digunakan seperti
kromatografi, spektroskopi dan gabungan kromatografi-spektroskopi. Dua spesies
Zingiberaceae iaitu Zingiber officinale Roscoe dan Zingiber zerumbet Smith telah dikaji.
Pengekstrakan menggunakan pelarut dijalankan ke atas rizom halia kering bagi
mendapatkan ekstak mentah (oleoresin), manakala pengekstrakan rizom segar dilakukan
dengan menggunakan teknik penyulingan hidro bagi menghasilkan minyak pati.
Pemisahan dan penulenan sebatian kimia utama dilakukan dengan menggunakan pelbagai
teknik kromatografi, antaranya kromatografi turus vakum, kromotografi turus graviti dan
kromatografi lapisan nipis penyediaan. Sebatian tulen yang berjaya dipisahkan telah
dikenal pasti strukturnya melalui pelbagai teknik spektroskopi iaitu RMN 1H, RMN 13C,
IM, KG dan KG-SJ. Dua sebatian tulen utama telah berjaya dipisahkan daripada Z.
officinale iaitu 6-gingerol (cecair pekat kuning gelap) dan 6-shogaol (cecair pekat kuning
muda), manakala zerumbone (kristal putih) adalah sebatian utama di dalam minyak pati
dan ekstrak mentah daripada Z. zerumbet. Ekstrak mentah dan sebatian-sebatian tulen
tersebut dianalisa menggunakan teknik DSC. Teknik ini dapat mengenalpasti sebatian
utama di dalam ekstrak mentah berdasarkan sifat-sifat termanya (takat lebur, Tm dan
perubahan entalpi, ΔHf). DSC juga mampu menganggarkan ketulenan sesuatu bahan
berdasarkan keadaan bentuk dan suhu takat lebut puncak endotermik tersebut. Puncak
tajam menunjukan sebatian tulen manakala puncak lebar menunjukan campuran sebatian-
sebatian utama.

v
LIST OF CONTENTS
CHAPTER TITLE PAGE
TITLE i
DEDICATION ii
ABSTRACT iii
ABSTRAK iv
LIST OF CONTENT v
LIST OF TABLES ix
LIST OF FIGURES x
NOMENCLATURES / SYMBOLS xiii
LIST OF APPENDICES xv
GLOSSARY
xv
1 INTRODUCTION
1.1 Research Background 1
1.2 Zingiberacea 4
1.2.1 Zingiber Officinale Roscoe 4
1.3 Research Objectives 8
1.4 Research Scopes 8

vi
HIGH SENSITIVITY DIFFERENTIAL SCANNING 2 CALORIMETRY (HSDSC)
2.1 Introduction to Analytical Equipment 9
2.2 High Sensitivity Differential Scanning Calorimeter 11
(HSDSC)
2.2.1 Principles of HSDSC 12
2.2.2 Definitions and terms 18
2.3 Interpretation of DSC curves 19
2.4 Purity determination using DSC 22
2.5 Phase diagram of a pure substance 24
METHODOLOGY 3
3.1 Overall Research 26
3.2 General Procedure 28
3.3 Extraction of Zingiber Officinale Roscoe 28
3.3.1 Isolation of 6-Gingerol 28
3.4 General Experimental Procedure Using HSDSC 35
3.4.1 Standard Materials 35
3.4.2 Instrumentation 36
3.5 HSDSC Maintenance 37
3.5.1 Cleaning 37
3.5.2 Instrument Calibration 37
3.5.2.1 Temperature Calibration Methods 37
3.5.2.2 Heat Flow Calibration Methods 38
3.5.2.3 Sample Temperature Calibration 39
3.5.2.4 HSDSC Sensitivity Calibration 40
(Calibrating The Sensitivity Using
Multiple Standards)
3.5.2.5 HSDSC Slope Correction 41

vii
3.6 Optimum Operating Condition Procedure Stepscan-mode 42
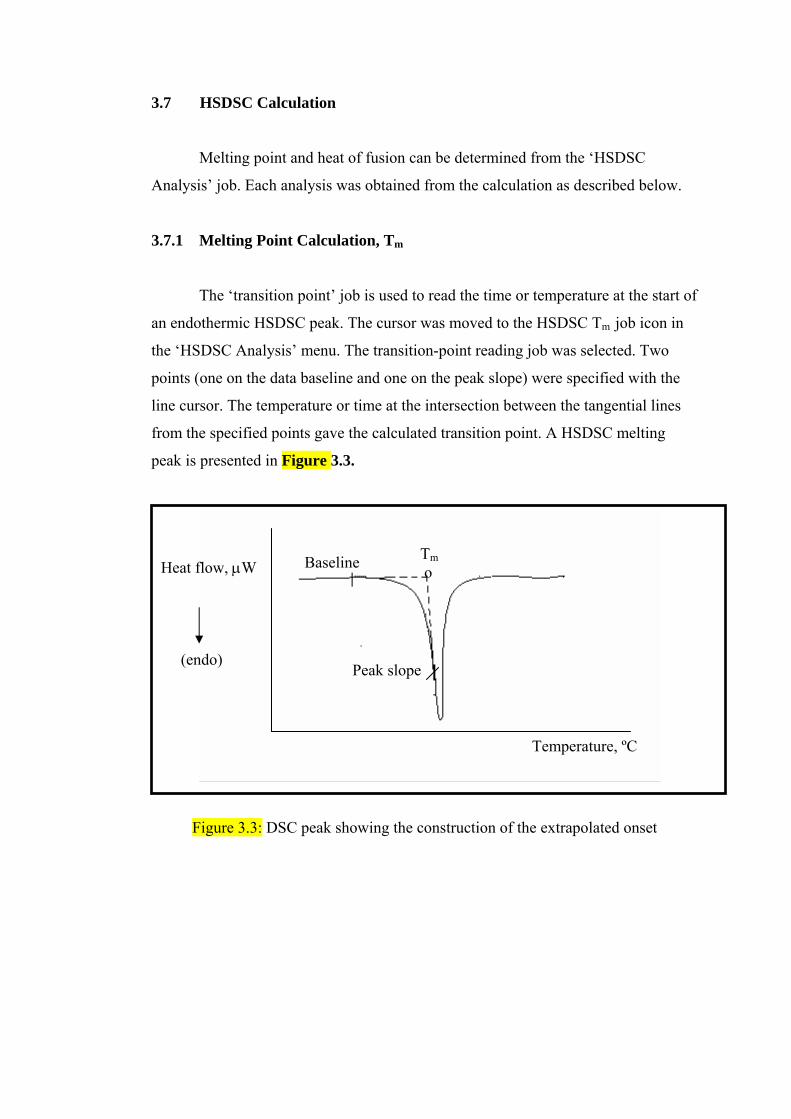
3.7 HSDSC Calculation 43
3.7.1 Melting Point Calculation, TM 43
3.7.2 Heat of Fusion Calculation, ΔHF 44
3.7.3 Purity Determination 45
3.8 HSDSC Data Analyze or Processing 45
3.8.1 Melting Point and Heat of Fusion Analysis 48
4 RESULTS AND DISCUSSIONS
4.1 Zingiber Officinale Roscoe - Oleoresin 50
4.1.1 Yield of Ginger Oleoresin 50
4.1.2 6-Gingerol Isolation and Purification Techniques 51
4.2 HSDSC Scans for Organic Compounds 54
4.3 Data Confirmation with Other DSC 55
4.3.1 Optimum Conditions for Pure Organic Compound 55 Analysis
4.3.2 6-Gingerol Step-scan Analysis 56
4.3.3 Glycerol Step-scan Analysis 57
4.3.4 Optimum Condition for Analyzing Ginger 59
Oleoresin
4.4 Heat of Fusion 61
4.5 Verification of Ginger Oleoresin Composition 62
REFERENCES 64
APPENDIX 1 72
APPENDIX 2 73
APPENDIX 3 74
APPENDIX 4 75
APPENDIX 5 76

viii
APPENDIX 6 77
APPENDIX 7 78
APPENDIX 8 79
APPENDIX 9 80
APPENDIX 10 81
APPENDIX 11 82
APPENDIX 12 83
ix
LIST OF TABLES
TABLES NO. TITLE PAGE
1.1 Physical Properties From Literature For The
Prominent Constituents in Zingiber Officinale Roscoe
Extracts
7
2.1 Locations and Type of DSC are Available in Malaysia 10
2.2 Specification of Diamond HSDSC Perkin Elmer 17
4.1 IR Parameter for Compound 6-Gingerol 51
4.2 1H NMR and 13C NMR Parameters for Compound 53
6-Gingerol
4.3 Tm and ΔHf Data of 6-Gingerol 54
4.4 Melting Point Variation of 6-Gingerol Standard As 57
A Function of Varied Scan Rates
4.5 Pure Glycerol As a Function of Scan-rate - 58
Tm Variation With Varied Scan Rate
4.6 Experimental Conditions and Results Applied to 59
Organic Compounds After Calibration
4.7 Gingerol Oleoresin At Scan Rate 50°C/min 60
4.8 Heats of Fusion of 6-Gingerol and Ginger Oleoresin 61
At The Optimum Scan Rate of 50°C/min
(sample mass 13.0 – 14.0 mg)
x
LIST OF FIGURES
FIGURES
NO.
TITLE PAGE
1.1 The Percentage Constituents of The Ginger Rhizome 5
(Zingiber Officinale)[32]
1.2 Structures of The Prominent Cosntituents in Ginger 6
Oleoresin[42]
2.1 DSC Development as Thermal Analysis [49] 10
2.2 Heat Flux and Power Compensated System
Design [51]
13
2.3 Differences in Size Furnace [51] 13
2.4 Difference Between Heat Flux and Power
Compensated DSC in Thermogram at The Rate
100°C/min [52]
15
2.5 The Block Diagram of The Perkin Elmer Diamond
HSDSC Equipment
16
2.6 Diamond HSDSC Perkin Elmer, MARDI, Serdang 16
2.7 Definition of Characteristic Temperatures of A Peak 19
2.8 Typical DSC Scan [55] 20
2.9 Melting Processs : (a) A Pure Substances; 21
(b) A Sample With A Eutectic Impurity; (c) A
Mixture; (d) and (e) Melting With Decomposition
[56]
2.10 a Idealised DSC Record of Melting of Pure Sample. 22
T0 is the Melting Point of a Theoretical Sample with
Zero Impurity. Area ABC Represents the Enthalpy of
Fusion, ΔHf [57]

xi
2.10 b Idealised DSC Record of Melting of an Impure
Sample. Tm is the Melting Point of a Sample. The
Area ABC Represents the Enthalpy of Fusion, ΔHf.A.
[57]
23
2.12 A Phase Diagram of a Pure Substance [58] 24
3.1 Overall Methodology 27
3.7 a The VLC Procedure 30
3.7 b (a) Sample is Put Homogeneously From The Column
Wall; (b) Sample is Isolated Through SiO2 Packed By
the Series of Solvent System ; (c) Most of the Sample
Isolated Completely With 100% EtOAC (most polar)
(d) The 25 Fractions Are Produced Which Every
Fraction Will Be Analyzed by TLC and the Same
Spot Have to Combine
31
3.7 c The GLC Procedure 32
3.7 d Shows the Two Pictorial of Sample Fractionation
using GLC
32
3.7 e The TLC Procedure 33
3.2 HSDSC Measurement at MARDI, Serdang 36
3.3 DSC Peak Showing The Construction of The
Extrapolated Onset
43
3.4 DSC Measurement of Heat of Fusion 44
3.5 Sample Info Dialog Box 46
3.6 Initial State Dialog Box 46
3.7 Program Dialog Box 47
3.8 View Program Dialog Box 47
3.9 Peak Search Analysis Dialog Box 48
3.10 Peak Calculation Analysis Dialog Box 49
3.11 Result Dialog Box 49
4.1 Gingerol Structure 53
4.2 Comparison of DSC for Isolated and Standard of
6-Gingerol
54

xii
4.3 DSC Heat Flow of 6-Gingerol Standard as a Function
of Temperature at Varied Scan Rate 10, 20, 50 and
100°C/min, Sample Mass : 13.8 mg
57
4.4 DSC Heat Flow of Glycerol as a Function of
Temperature at Varied Scan Rates 10, 20, 50 and
100°C/min, Sample Mass : 13.8 mg
58
4.5 DSC Heat Flow of Ginger Oleoresin as a Function of
Temperature at Scan Rate 50°C/min,
Sample Mass : 13.8 mg
60

xiii
NOMENCLENTURES / SYMBOLS
ΔH changes of enthalpy
ΔHf heat of fusion
μW micro Watt 13C NMR Nucleur Magnetic Resonance Carbon 1H NMR Nucleur Magnetic Resonance Proton
C Carbon
CCl4 carbon tetrachloride
CDCl3 Deuterium chloroform
CHCl3 Chloroform
d Double
dd double of doublet
DSC Differential Scanning Calorimetry
DTA Differential Thermal Analysis
Et2O diethyl ether
EtOAc ethyl acetate
FID Flame Ionisation Detector
GC Gas Chromatography
GC-MS Gas Chromatography-Mass Spectroscopy
H Hydrogen
HPLC High Performance Liquid Chromatography
Hz Hertz
i.d internal diameter
IR Infrared
KBr Potassium bromide
m Multiplet
mg Milligram
MHz Megahertz
mJ MilliJoule
mL Millilitre
MS Mass Spectroscopy

xiv
NaCl Sodium chloride
OH Hydroxide
PE petroleum ether
R gas constant
Rf retardation time
RI Refractive Index
s Singlet
t Triplet
T absolute temperature
T0 melting point of a theoretical sample with zero impurity
Te end temperature / peak end
Ti initial temperature / peak start
TLC Thin Layer Chromatography
Tm melting temperature of sample
TMS Tetramethylsilane, (CH3)4 Si
Tp peak maximum temperature
UV Ultra Violet
x mole fraction
xv
LIST OF APPENDICES
APPENDIX TITLE PAGE
1 Gas Chromatograph of Ginger Oleoresin 72
2 IR Spectrum of Compound 6-Gingerol 73
3 1H NMR of Compound 6-Gingerol 74
4 13C NMR of Compound 6-Gingerol 75
5 MS of Compound 6-Gingerol (m/e = 194 [M]+
(from 98% mole purity)
76
6 GC-MS of Compound 6-Gingerol
(from 98% mole purity)
77
7 GC-MS of Compound Isolated 6-Gingerol 78
8 DSC Thermogram of Glycerol (ORIEM) 79
9 DSC Thermogram of Ginger Oleoresin (ORIEM) 80
10 DSC Thermogram of Ginger Oleoresin (SIRIM) 81
11 Calculation of Purity Determination Using DSC 82
12 Calculation of Purity Determination Using DSC 83

xvi
GLOSSARY
Analyte The species in the sample about which analytical
information is sought
Anti-emetic A substance to prevent vomiting
Anti-rheumatic A substance used to alleviate rheumatism (pain,
swelling and deformating of joints)
Authentic sample Isolated sample obtained from previous research which
had already determined as pure
Calibration The process of ensuring that the signal measured by an
instrument is correct
Chromatogram A plot of analyte signal as a function of elution time or
elution volume
Chromatography A term for methods of separation based upon the
partition of analyte species between a stationary phase
and a mobile phase
Column
Chromatography
Methods in which the stationary phase is held within or
on the surface of a column
Crucible Vessel used to hold sample. Also know as container or
pan
Crystalline Solid form
Crystallisation Formation of crystalline substances from solutions, melt
or the glassy state
Decomposition
Breakdown or change of a material or substance (by
heat, chemical reaction or other process) into other
chemical compound.
DSC Instrument for measuring the differential energy
supplied between a sample and reference to maintain a
minimal temperature difference between the sample and
reference in response to a temperature program

xvii
Endotherm Deviation from the sample baseline of a DSC curve
indicating energy absorption by the sample relative to a
reference
Enthalpy Sum of the internal energy of a system plus the product
of the system volume multiplied by the ambient
pressure.
Exotherm Deviation from the sample baseline of a DSC curve
indicating energy release by the sample relative to the
reference
Fusion See Melting
Gas Chromatography Methods that make use of a gaseous mobile phase and a
liquid (GLC) or a solid (GSC) stationary phase
Glycerol The most common natural carrier for acyl groups and
the basis of many lipid classes
Heat-flux type DSC Commercial name for quantitative DTA
Heating rate Rate of temperature increase in response to a
temperature program
HPLC A term for column methods in which the mobile phase
is a liquid, often under pressure
Instrument baseline DSC curve recorded in the scanning mode when there is
no sample and reference present
Melting Change of state of a substance from a solid phase to a
liquid phase. Also known as fusion
Melting temperature Temperature of transition from a solid phase to a liquid
phase
Mobile phase A liquid or a gas that carries analytes through a liquid or
solid stationary phase
Mole The SI base unit for the amount of substance
Myristic acid Tetradecanoic acid, this alkanoic acid is present in
coconut oil and palm kernel oil and as the minor
component of most animal fats and fish oils

xviii
Onset temperature Transition temperature defines as the intersection
between the tangent to the maximum rising slope of a
DSC peak and the extrapolated sample baseline.
Peak General term for an endothermic or exothermic
deviation from baseline.
Phase Chemically and/or physically homogeneous region of a
sample (gas, liquid, solid) with distinct boundaries
which can be distinguished from other dissimilar
regions of the sample
Phase diagram Graphically representation of the phase structure of a
system as a function of an experimental parameter
(pressure, temperature, composition, etc.)
Phase transition
enthalpy
Enthalpy change of a system due to a change of phase.
Phase transition
temperature
Temperature of transition from one phase of a system to
another phase.
Planar
Chromatography
The term used to describe chromatographic methods
that make use of a flat stationary phase; the mobile
phase migrates across the surface by gravity or capillary
action
Purge gas Inert gas which replaces the atmosphere in the vicinity
of a sample to standardise the experimental conditions
Qualitative analysis An analysis in which we determine the identity of the
constituents species in a sample
Quantitative analysis An analysis in which we determine how much of a
constituents species is present in a sample
Refractive index The ratio of the velocity of electromagnetic radiation in
vacuo and the velocity in some other medium
Spectrometric
methods
Methods based on the absorption, the emission, or the
fluorescence of electromagnetic radiation that is
proportional to the amount of analyte in the sample

xix
Standard reference
material
High-purity material exhibiting a well-characterised
phase change, which is used to calibrate a Thermal
Analysis instrument.
Stationary phase A solid or immobilised liquid upon which analyte
species are partitioned; compare with mobile phase
Stearic acid Octadecanoic acid, this C18 acid is the second most
common saturated acid
Thermal analysis Class of analytical methods where the nature of a
sample is investigated in response to a temperature
program, includes DSC, DTA, DMA, TG and TMA.
Also know as thermoanalysis

CHAPTER 1
INTRODUCTION
1.1 Research background
Plants are used for many purposes including foods, treating medical ailments
and for dyeing clothes. Nowadays, many researchers have focused their interest on
medicinal plants due to the increasing demand for health food. Species of
Zingiberaceae, Annonaceae, Araceae, Simaroubaceae and many others are known as
having medicinal values [1,2]. The active compounds of the plant extracts contribute
to the medicinal effects, so that a number of analyses are important in research
besides the extraction techniques. All conventional and advance analytical
techniques to guarantee high quality of herbal products have extensively been
studied. In practice, various methods and procedures for identifying and analysing
the constituents have been tested to obtain high quality of the end products.
Chromatographic, spectrometric and combination of chromatographic-spectrometric
analytical techniques are widely used in identifications of crude and active
compounds in plant extracts [3].
This technique was applied to Zingiber extracts; Zingiber officinale Roscoe
was studied in this research. Besides compound identification and characterisation,
analytical methods such as GC,GC-MS, HPLC and spectroscopic methods are
frequently used to determine the purity of organic compounds. A thermoanalytical
2
method, which makes use of differential scanning calorimetry (DSC) has been used
successfully in recent years for the determination of absolute purity. This technique
has been applied to large number of substances including organic and inorganic
compounds, pharmaceuticals, polymers and others. In 2001, the conventional heat
flux DSC was used to identify and quantify the major compounds in order to
characterise the constituents in the oleoresin mixture [4].
The purity determination of organic compounds has been extensively and
critically reviewed by numerous authors; Plato [5]; Plato and Glasgow [6]; Widmann
and Scherrer [7]; Yamamoto et al. [8]; Palermo and Jen Chiu [9]; Gustin [10];
Mccullough and Waddington [11]; Sondack [12]; Flynn [13] Elder [14]; An and
Sabbah [15]; Donnelly et al. [16]; and Giron [17]. DSC analysis in conjunction with
chromatographic technique provides valuable information when determining
compound purity and also aid in compound identification. Donnelly et al. [16]
reported DSC and MS were two complementary techniques, where DSC was used to
ascertain purity and MS to verify identity.
DSC is very frequently used to observe the transition behaviour. It was found
as an efficient method for characterising foods. In 1985, J. Schlicter et al.[18] used
DSC technique to investigate the extent of polymorphic transformations in pure
cocoa butter and in the presence of a food emulsifier. It has been further studied by
Imogen Foubert et al. [19] to determine the isothermal crystallization kinetics of
cocoa butter to explore the transformation of the DSC crystallization peak to a
sigmoid crystallization curve. In 1995, Noor Azian [20] has established optimum
operating conditions of DSC to determine the specific heat capacity of
triacylglycerols, the major component in palm oil, the values are important in the
design of palm oil refining.
In the study by J. M. N Marikkar et al.[21], the use of cooling and heating
thermograms from HSDSC for monitoring the presence of genuine lard (GLD), beef
tallow (BT), chicken fat (CF) as adulterants in canola oil has been investigated.
Mixing of animal fats especially lard and tallow in any form in food products is a
cause of concern for certain religions. Canola oil samples spiked separately with BT,
GLD and CF in levels were analysed by HSDSC to obtain their cooling and heating
3
profiles. A. F. Baroni et al. [22] employed DSC to examine thermal transition by
monitoring peak glass transition temperatures and transition enthalpies of dehydrated
tomato. Establishing the effects of scanning rate on DSC characteristics is critical to
qualitative and quantitative analyses of these products. DSC is used for compound
characterisation, using the temperature of melting endotherm and the associated
enthalpy of fusion.
In an earlier study (1993), W. L. Kerr et al. [23] studied the DSC for its
ability to detect thermal transition in analyzing foods such as sucrose, maltodextrin
and frozen potato. After several years (2000), Kouame et al. [24] investigated the
effect of water and glass transition on the hydrolysis of sucrose by invertase in
noncrystalline carbohydrate systems. The glass transition occurs over a temperature
range and it has been recognized as a possible factor affecting kinetics of enzymatic
changes in low-moisture foods. The glass transition is often observed from changes
in the mechanical properties as the viscous, solid-like glass is transformed to a more
flowing, liquid-like state. In polymer, E. Illikova et al.[25] also suggest accuracies
measurement procedure to get the accurate specific heat measurement on
Fe73Co12BB15 and Co67Cr7Fe4Si8B14B metallic glasses.
The present research was an attempt to apply High Sesitivity Differential
Scanning Calorimetry (HSDSC) instead of using ordinary or conventional DSC for
identification of the major compounds in the crude product based on their thermal
behaviour. HSDSC can be used as a control or a routine tool for verifying the
identity of a compound. The identity of the compound was checked qualitatively by
its melting point and compound purity was determined quantitatively by HSDSC
method. Amar et al. [26] characterise the thermodynamics of protein denaturation.
β-Lactoglobulin using DSC technique and the transition was found to be irreversible
due to aggregation occurring.
Before this in 1999, D. Torreggianni et al.[27] investigate how added
carbohydrates affect the colour stability of frozen strawberry juices stored at high
temperature, i.e. above Tg the glass transition temperature of the maximally freeze
concentrated phase. J. Ford et al.[28] has shown the ability of HSDSC to measure

4
very low amorphous content in lactose, carbamazephine and nifedipine a glassy and
amorphous nature structure in pharmaceutical material.
1.2 Zingiberaceae
The Zingiberaceae is a plant family made up of wild and cultivated species. It
comprises about 1200 species of which about 1000 occur in tropical Asia.
Botanically, Zingiber gives its name to the whole ginger family, Zingiberaceae [29].
Several Zingiberaceae plants have been reported to be useful in traditional medicines
[30].
1.2.1 Zingiber officinale Roscoe
Ginger, the rhizome of Zingiber Officinale Roscoe, is one of the most popular
spices. It has been used since ancient times mainly for flavouring and medicinal
purposes. It has good demand in the international and even local market for
preparing ginger oil, oleoresin, ginger juice and essence. Ginger rhizome contains a
mixture of an essential oil, a fixed oil, pungent compounds, starch, and others, such
as saccharides, proteins, cellulose, waxes, colouring matter, trace minerals and etc.
Starch is believed to be the most abundant of these components comprising of 40 -
60 % w/w of the dry rhizome. Previous research found that the percentage of the
crude protein was 6.2 - 19.8 %, total lipid was 5.7 - 14.5 % and crude fibre was 1.1 -
7.0 % [31]. They compared these three prominent components in different cultivars
at different maturity stages of the ginger rhizomes.
Oleoresin (crude extract) is one of valued ginger product, has been obtained
by solvent extraction, followed by removal solvents, while ginger oil is obtained by
water extraction or steam distillation. The dried rhizome of ginger contains
approximately 4 - 7.5 % oleoresin [32]. The composition of the ginger rhizome is
summarised in the pie chart in Figure 1.1.

5
Volatile oil
Oleoresin
Starch
Proteins
Fats
Others
40 - 60 %
10 %
10 %
9.5 % 1 - 3 %4 - 7.5 %
Figure 1.1: The percentage constituents of the ginger rhizome (Zingiber
officinale) [32]
The oleoresin of ginger contains the pungent principles and non-pungent
substances in addition to the essential oil content, which is about 28 % [33].
However, the quantitative composition of oleoresin is believed to vary according to
the source of material, solvent used and conditions of preparation. Oleoresin or
standardised ginger root extracts, known as Zinaxin™ is a registered trade name,
which is commercially available in the market. The product is similar to other
preparation also known as Zingiber officinale and gingerols.
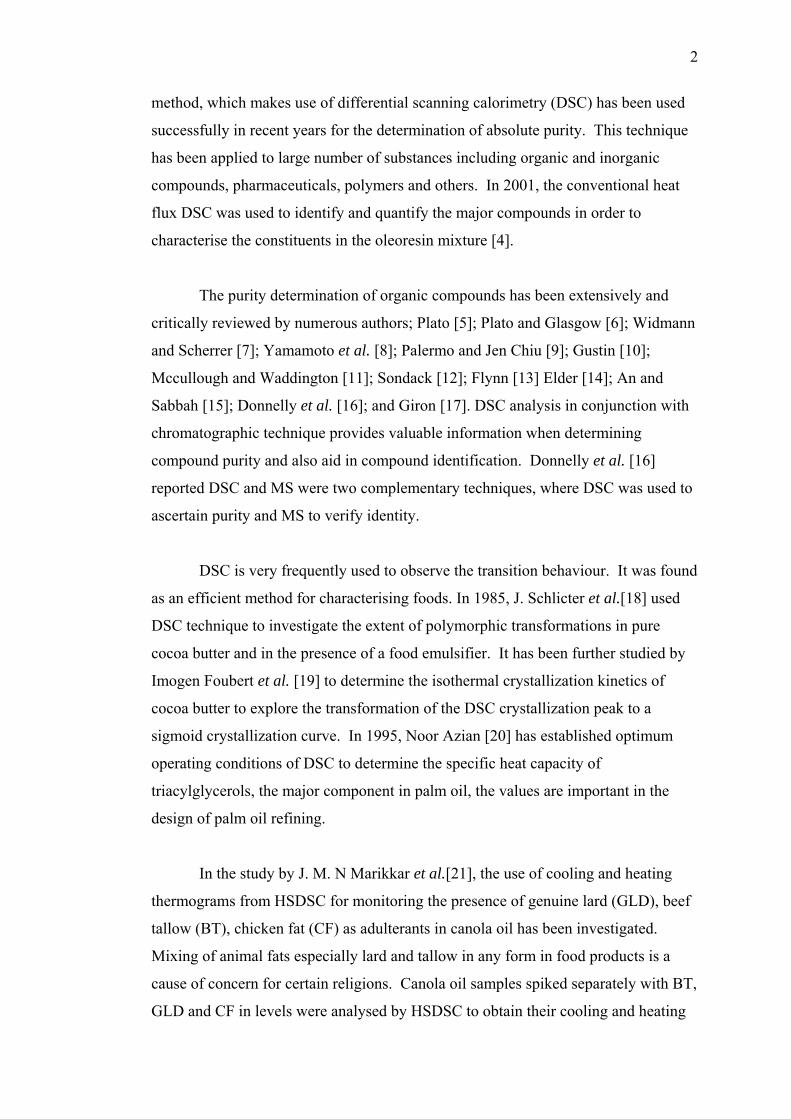
6-gingerol (1) is a major constituent of ginger oleoresin responsible for
ginger’s medicinal effects. Specifically, gingerol has been identified as anti-
bacterial, anti-emetic, anti-inflammatory, anti-oxidants, anti-prostaglandin, anti-
rheumatic, anti-tumor, anti-ulcer and many others [34-39]. Another constituent, 6-
shogaol (2) may also act as an active anti-prostaglandin compounds and anti-ulcer
[40]. The non-volatile pungent principles that accounts for the characteristic aroma
of ginger are gingerol, shogaols and zingerone (3). Besides that, the minor
compounds are α-zingiberene (4), 6-paradol, gingerdiones, gingerdiols, linalool,
camphene , citral and borneol . Compound 4 was recognised as the major
6
component in ginger oil [41]. The structures of the major constituents are shown in
Figure 1.2 and the physical properties of the constituents are given in Table 1.1.
CH3
HO
MeO 1
23
453'
2'1'
4'5'
6'
6
7
8
9
10
O OH
(1)
CH310
O
MeO
HO
3'2'
1'
4'5'
6'
1
23
4
5
6
7 9
8
(2)
MeO
HO
O
(3)
(4)
Figure 1.2: Structures of the prominent constituents in ginger oleoresin [42]

7
Table 1.1: Physical Properties from Literature for the Prominent constituents
in Zingiber officinale Roscoe Extracts [42]
Constituents and characteristic
Molecular formula
Melting point (ºC)
Boiling point (ºC)
UV Max.
Refractive index
Mw
6-Gingerol -yellow oil -obtained as pungent -50% soluble in alcohol, ether, chloroform, benzene
C17H26O4
29 [43]
bp18 235 - 240
bp6 227 - 229
282; 284
ηD20 1.5224
ηD
20 1.5212
294
6-Shogaol -pale yellow oil
C17H24O3 25.2 -26.2 [44]
bp2-2.5 201.3 ηD25 1.5252 276
Zingerone -sweet odour -slowly volatile in steam -constituents of ginger oil -crystals from acetone -sparingly soluble in water, PE
C11 H14O3 40 - 41 bp14 187 - 188
194
Zingiberene -constituents of ginger oil -natural oil
C15H24 bp14 134
ηD20 1.4956
204
6-Gingerol and 6-Shogaol are the most important pungent compounds of
ginger products. Other gingerols and shogaols are less important. A pungency study
has indicated that 6-Gingerol is much more pungent than 6-Shogaol. 6-Shogaol and
zingerone were substantially absent in ginger but only formed in the oleoresin during
or after preparation [33]. The physical properties of the major constituents are given
in Table 1.1. The data were limited to melting and boiling points data. Other data
were not documented.

8
1.3 Research Objectives
The aim of this research was to study the possibility of using high sensitivity
DSC in analysing natural products, especially for the family of Zingiberaceae plants,
specifically melting point and heat of fusion. By doing so, a thermal analysis
correlation between crude ginger oleoresin and pure active compounds will be
define.
1.4 Research Scopes
In order to achieve the objectives mentioned earlier, three scopes have been
identified:
1 Fresh Indonesian ginger (Zingiber officinale Roscoe) of grade A obtained
from Pasar Selayang were used to prepare the dried ginger. A standard
procedure of sample were developed and observed throughout this research
work.
2 The extraction of ginger oleoresin was through solvent extraction using
ethanol followed by short path distillation, rotary evaporator and
microdistiller as the final step in purification.
3 Isolation and purification major compounds of the pungent principles of
Zingiber officinale Roscoe eg gingerol, shogaol, zingerone and zingeberene
compound. These standards must be first obtained in a pure form from the
supplier such as Wako Pure Chemical Ind. Ltd..
4 Establish the HSDSC optimum condition (optimum scanning rate) in order to
minimise errors and variations.
5 Qualitative study and design correlation of thermal behaviour; the melting
point and heat of fusion data of the crude extract and pure active compounds.

9
CHAPTER II
HIGH SENSITIVITY
DIFFERENTIAL SCANNING CALORIMETRY
(HSDSC)
2.1 Introduction to Analytical Equipment
The analytical equipment that was used in this research work was high
sensitivity differential scanning calorimeter (HSDSC), which is Diamond DSC from
Perkin Elmer that used power compensated type of Differential Scanning
Calorimeter (DSC) instead of using heat flux conventional thermal analysis. Field
trips were undertaken to locate current HSDSC instrument in peninsular Malaysia.
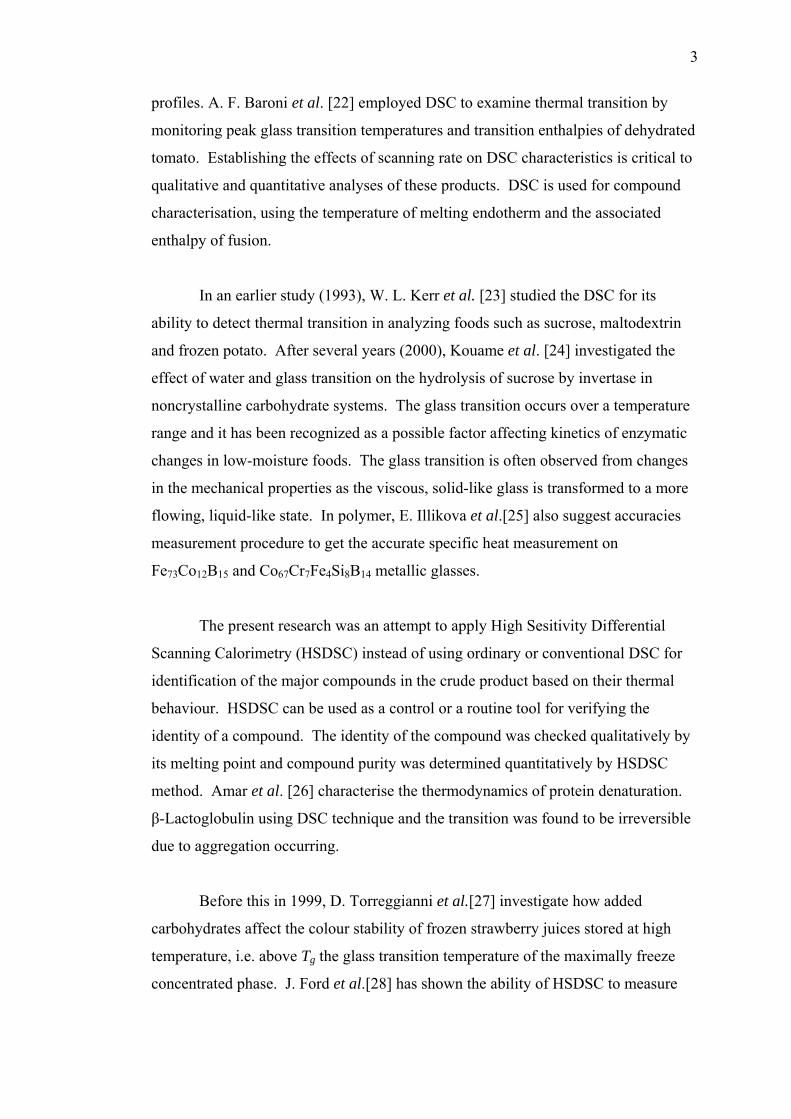
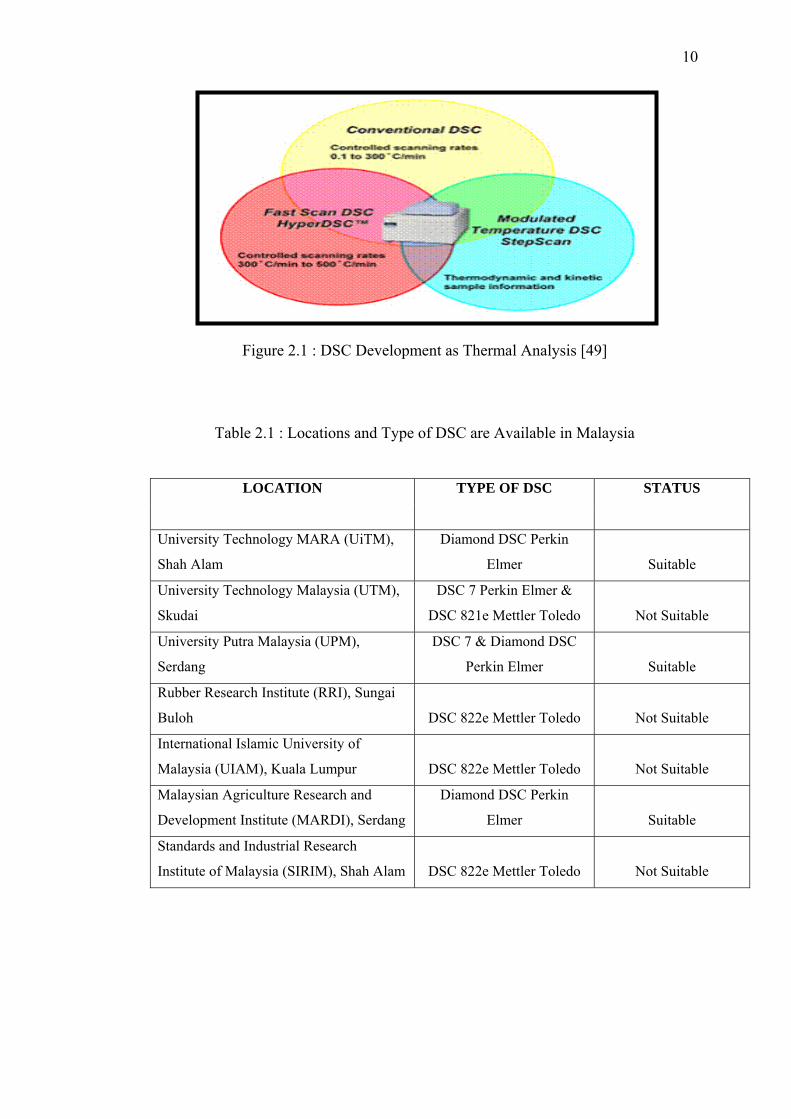
Table 2.1 is the list of all locations and type of DSC, whether the instrument is
suitable or not. The instrument only categorized suitable if it used power
compensated Differential Scanning Calorimeter, which is DSC 7 or Diamond DSC.
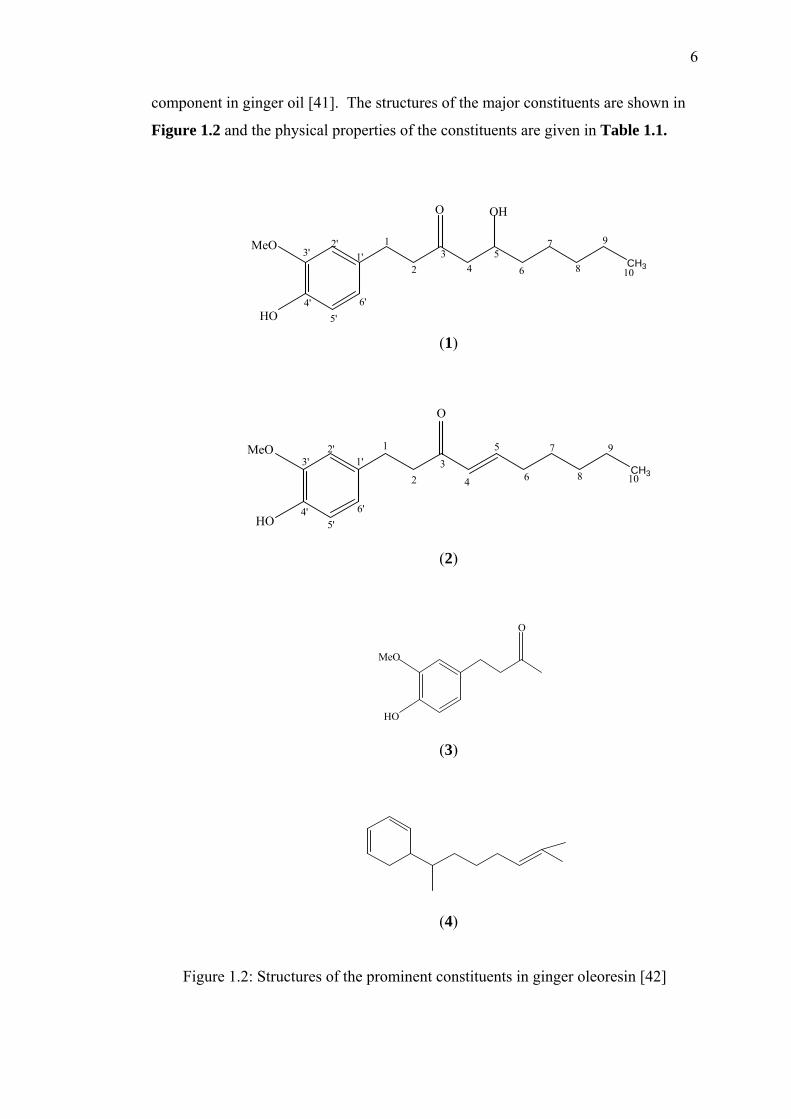
Figure 2.1 shows an illustration of DSC development from ordinary heat flux DSC
that control scan rates from 0.1 °C/min to 300 °C/min to modern and fast scan DSC
that can control scanning rates between the ranges of 300 °C/min to 500 °C/min.
10
Figure 2.1 : DSC Development as Thermal Analysis [49]
Table 2.1 : Locations and Type of DSC are Available in Malaysia
LOCATION TYPE OF DSC STATUS
University Technology MARA (UiTM),
Shah Alam
Diamond DSC Perkin
Elmer Suitable
University Technology Malaysia (UTM),
Skudai
DSC 7 Perkin Elmer &
DSC 821e Mettler Toledo Not Suitable
University Putra Malaysia (UPM),
Serdang
DSC 7 & Diamond DSC
Perkin Elmer Suitable
Rubber Research Institute (RRI), Sungai
Buloh DSC 822e Mettler Toledo Not Suitable
International Islamic University of
Malaysia (UIAM), Kuala Lumpur DSC 822e Mettler Toledo Not Suitable
Malaysian Agriculture Research and
Development Institute (MARDI), Serdang
Diamond DSC Perkin
Elmer Suitable
Standards and Industrial Research
Institute of Malaysia (SIRIM), Shah Alam DSC 822e Mettler Toledo Not Suitable

11
2.2 High Sensitivity Differential Scannning Calorimeter
(HSDSC)
Thermal analysis in general and high sensitivity differential scanning
calorimeter (HSDSC) in particular, is one of the fastest growing analytical technique
which has been used for certain test like purity determination that can be performed
for pharmaceuticals and organic material since development of commercial DSC
instrument in the early 1960s. HSDSC has proven to be a rapid, accurate, precise
and easy to use [45]. It is a breakthrough method for materials characterization,
providing extra sample information in seconds rather than minutes. HSDSC can run
samples as fast as 500°C/min under control, measuring the real sample temperature,
whereas, for a conventional DSC method, the maximum scan rate is normally
20°C/min or 40°C/min. As a result of these fast scanning rates, throughput is at least
10 times faster and because of the conventional DSC slow heating rate, some
materials may experience re-crystallization during the melting process or decompose
immediately after melting. This may cause difficulty in obtaining a true analysis and
may also generate some additional, unexpected thermal phenomena.[45].
In 1990, W. J. Sichina [45], has reviewed used of HSDSC for
characterization of starches. For the successful characterisation of starches, it is
important to have high performance DSC instrument, as the critical transitions
associated with starches are very weak and can be difficult to detect. In 1996,
Edward Kolbe et al [46] has participated also in a thermal analysis study to
determine onset and peak transition temperatures and enthalpy, for both starch
gelatinization and tristearin melting and crystallization using 3 types of DSC. The
development of HSDSC is particularly impressive. Phil Robinson et. al.[47] used the
HSDSC to analyze cocoa butter, one of the main ingredient used to produce
chocolate, can exist in multiple and unstable crystalline forms, known as
polymorphs. The given processing or thermal history of the cocoa butter and
chocolate can generate different polymorphic forms which will affect the final
properties (melting characteristics, appearance and physical handling) of the
chocolate. The melting properties of cocoa butter and chocolate are very important,
as the melting is what delivers the ‘feel’ and taste of the chocolate to the mouth. It

12
becomes important to characterize and understand the melting properties of the
chocolate as it is related to essential consumer aspects.
In 2003, Svenja G. et al.[50]. A good quality DSC is capable of yielding
satisfactory ‘partial fusion’ when used in stepwise and isotherm scanning mode. The
term of compensated DSC is widely used by crime investigation unit to detect single
fiber in forensic application. Applications of HSDSC include the characterization of
polymers, fibers, films, thermosets, elastomers, composites, pharmaceuticals, foods,
cosmetics, as well as organics and inorganic. HSDSC provides valuable and
important information on the following important properties of materials:
· Glass transition or Tg · Melting points or Tm
· Crystallization points · Heats of fusion
· Percent crystallinities · Oxidative stabilities
· Compositional analysis · Heat capacities
· Purities · Polymorphism
· Thermal stabilities · Heat set temperatures
2.2.1 Principles of HSDSC
In 1995, U. Jorimann, et al. [51] has discovered by increasing heating rate, it
will increase the sensitivity and by making right selection heating rate it will
definitely give high resolution. The Perkin Elmer Diamond HSDSC is the
differential scanning calorimeter that used power compensated principle, the sample
and reference materials are each held in a separate, self-contained calorimeter, with
its own heater element (Figure 2.2). When an exothermic (heat yielded) or
endothermic (heat absorbed) change occurs in the sample, power or energy is applied
to or removed from one or both of the calorimeters to compensate for the energy
change occurring in the sample. The power compensated HSDSC system is
maintained in a “thermal null” state at all times. The amount of power required to
maintain the system in equilibrium conditions is directly proportional to the energy
changes occurring in the sample. In HSDSC small furnace features two 1-gram is
used while heat flux systems use on large furnace (Figure 2.3). This size difference

13
results in faster heating and cooling rates and therefore provides a true measure of
the calorimetric properties of the sample since the fundamental measurement with
the power compensated DSC is energy flow.
Figure 2.2: Heat Flux and Power Compensated System Design [51].
Heat Flux
Power Compensated
Figure 2.3: Differences in Size Furnace [51].
Paul Gabbot et al.[52] had proven HSDSC technique is only possible on
power-compensation DSC, which measures heat flow directly and does not require
complex mathematics to get premium results. Since the DSC output is mW (J/sec),
HSDSC gives increased sensitivity with shorter scan times and smaller sample mass.
The HSDSC analysis allows the measurement of small samples down to a few
micrograms. Examples of small samples are very thin layers in multilayer films,
coatings or very small amounts of materials for pharmaceutical development.
14
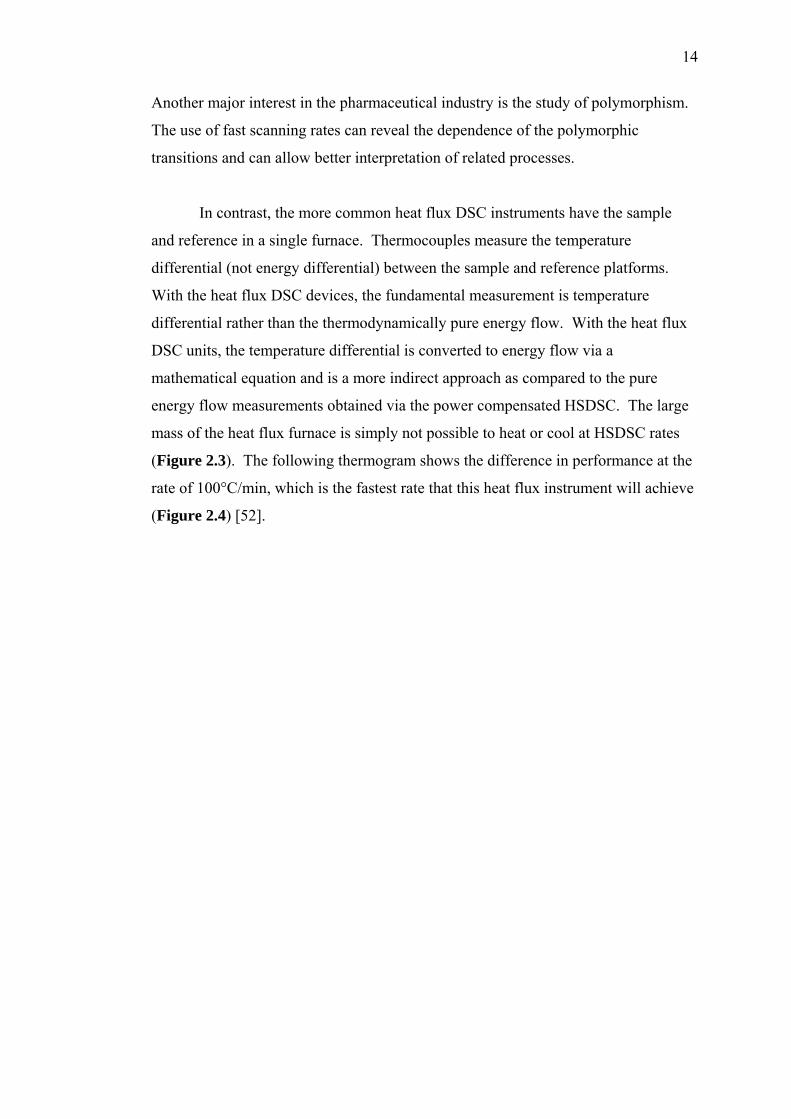
Another major interest in the pharmaceutical industry is the study of polymorphism.
The use of fast scanning rates can reveal the dependence of the polymorphic
transitions and can allow better interpretation of related processes.
In contrast, the more common heat flux DSC instruments have the sample
and reference in a single furnace. Thermocouples measure the temperature
differential (not energy differential) between the sample and reference platforms.
With the heat flux DSC devices, the fundamental measurement is temperature
differential rather than the thermodynamically pure energy flow. With the heat flux
DSC units, the temperature differential is converted to energy flow via a
mathematical equation and is a more indirect approach as compared to the pure
energy flow measurements obtained via the power compensated HSDSC. The large
mass of the heat flux furnace is simply not possible to heat or cool at HSDSC rates
(Figure 2.3). The following thermogram shows the difference in performance at the
rate of 100°C/min, which is the fastest rate that this heat flux instrument will achieve
(Figure 2.4) [52].

15
Figure 2.4 : Difference between heat flux and power compensated DSC in
thermogram at the rate 100°C/min [52].
One major advantage of the power compensated design over the heat flux
DSC cell is that the masses of the individual furnaces of the power compensated
system are much lower than that of the heat flux. The mass of the power
compensated furnace is only 1 g as compared to 100 to 200 g for most heat flux
devices. The thermodynamics and physics of the low mass furnace translates into an
extremely fast response times (due to less thermal inertia,) and the ability to achieve
much faster heating and cooling rates as compared to the more sluggish and massive
heat flux DSC furnace. The faster response time of the power compensated DSC also
provides a much higher degree of resolution as compared to heat flux DSC devices.
Resolution is a measure of the DSC to separate out closely occurring transitions. This
is important for applications such as polymorphism of pharmaceuticals and food
oils/fats, detection of heat set temperatures of polymers and fibers, characterization
of liquid crystalline materials and the study of the melting properties of blends [52].
The Perkin Elmer Diamond HSDSC thermal analysis is comprised of
intracooler, Hewlett Packard modified computer consist of Pentium IV and Pyris
Diamond DSC software, an output device for making a permanent record and a
visual display unit. Figure 2.5 shows the block diagram of Diamond HSDSC Perkin
Elmer model.

16
Analysis module Thermal Analysis Output Equipment
TA-CPU Pentium IV
Monitor CRT Keyboard
Diamond DSC Plotter
Hard Disk
Floppy Disk
Intracooler
CD- Rom
Mouse
Figure 2.5 The Block Diagram of the Perkin Elmer Diamond
HSDSC Equipment.
An overview of the Diamond HSDSC Perkin Elmer (Figure2.6) and
equipment specification (Table 2.2)
Figure 2.6 : Diamond HSDSC Perkin Elmer, MARDI
Serdang.

17
Table 2.2 : Specification of Diamond HSDSC Perkin Elmer
Specifications Description
DSC Type Power-compensation temperature null principle. Measures temperature
and energy directly, rather than differential temperature (DT).
DSC Cell Independent dual furnaces constructed of platinum-iridium alloy with independent
platinum resistance heaters and temperature sensors with furnace mass less than 1g.
Temperature Sensors Distributed, Platinum Resistance Thermometers for best linearity.
Atmosphere Static or dynamic, including nitrogen, argon, helium, carbon dioxide, air, oxygen or
other inert or active gases, over full temperature range. Oxygen can be used up to
730 °C which allows easy cleaning. Temperature
Range Range -170 °C to 730 °C Calorimetry Accuracy / Precision < ±1% / < ±0.1%
Sensitivity 0.2 μW Dynamic Range 0.2 μW to 800 mW
Signal Response (1 mg Indium, 10 °C/min, nitrogen purge)
Peak Height 7.44 mW ± 0.15 mW Width at half height 0.42 ± 0.10 °C H/W Ratio 17.6 mW/°C ± 1 mW/°C
Isothermal Drift -150 °C / 100 °C < 15 μW / < 10 μW
(10 min) Scanning Rates Heating/Cooling 0.01 °C to 500 °C/min Temperature
Overshoot 100 °C/min < 0.1 °C Cooling Options Ice Water 25 °C to 730 °C
Circulating Liquid -10 °C to 730 °C Refrigerator (Intracooler) -70 °C to 730 °C
Automatic Liquid N2 (CryoFill) -170 °C to 300 °C

18
2.2.2 Definitions and Terms
The temperature of any process in the sample must be determined from the
measured curves. Figure 2.7 shows the terms used for the description of the
measured curves. The explanation is given below [53, 54]:
Measured curve: Trace of the measured signal as a function of time or temperature
(furnace temperature or sample-sensor temperature).
Peak: Curve measured during liberation of a heat due to a transition in the sample.
Peak start, Ti: Initial deviation of the measured signal from the baseline in the region
of the peak.
Peak maximum, Tp: Maximum difference between interpolated baseline and peak.
Peak end, Tf: Final deviation of the measured signal from the baseline in the region
of the peak.
Melting temperature, Tm: The extrapolated onset temperature is defined as the
intersection between the tangential lines through the descending slope
of the peak and the linearly extrapolated initial baseline. It is also
known as transition temperature, Tt as general.
Heat of fusion, ΔHf: The area of the peak marked of by the straight line between two
points (start and end temperature).

19
Measured signal (Heat flow, μW)
Time (temperature) Ti Tp TfTm
ΔHfo
Final baseline Initial
baseline
Figure 2.7: Definition of Characteristic Temperatures of a Peak [53].
2.3 Interpretation of DSC Curves
In general, each substance gives a DSC curve in which the number of peaks,
shape and position of the various endothermic and exothermic features serve as a
means of qualitative identification of the substance [55]. Figure 2.8 shows a typical
heat-flux DSC scan. When an endothermic change occurs, the sample temperature
lags behind the reference temperature because of the heat in the sample. The
initiation point of a phase change or chemical reaction is the point at which the curve
first deviates from the baseline.
When the transition is complete, thermal diffusion brings the sample back to
equilibrium quickly. Broader endothermic curve (T1) cover behaviour ranging from
dehydration and temperature-dependent phase behaviours of partially crystalline
compounds or mixture while sharp endothermic curve (T2) is indicative of crystalline
rearrangements, fusions, or solid-state transitions for relatively pure materials. A
crystallisation curve, T3 shows positive deviation (exothermic) indicates heat
evolution.

20
Figure 2.8 : Typical DSC Scan [55]
baseline
The heat of fusion and melting point can be determined from the melting
curve. For phase transitions the calorimeter plots are represented normally by a
‘peak’, which is shown in Figure 2.9. The characteristic temperature of a peak can
be determined either through onset temperature or peak maximum temperature.
Figure 2.9 (a –f) illustrate the possible reactions when samples are heated. With pure
substances, where the low temperature side of the melting peak is almost a straight
line (Figure 2.9 a), the melting point corresponds to the onset temperature. Impure
and mixture sample often show several peaks, whose melting curve are concave in
shape, are characterised by the temperature of their peak maximum [56] (Figure 2.9
b and c).
Since the peak maximum temperature depends heavily on sample mass and
shape while the onset temperature is independent of sample parameters [54], thus
only the extrapolated onset temperature should be taken for melting point
determination. Substance with eutectic impurities exhibit two peaks (Figure 2.9 b),
first the eutectic peak, whose size is proportional to the amount of impurity and then
the main peak. Sometimes the eutectic is amorphous so the first peak is missing
(Figure 2.9 c). Partially crystalline substances give rise to very broad melting peaks
because of the size distribution of the crystallites. Many organic compounds melt

21
with decomposition (exothermic or endothermic). The curve can be clearly seen in
Figure 2.9 (d) and 2.9 (e) [56].
(a)
(e)
(c) (d)
(b)
Tm
o
eutectic
o Tm
o Tm
endothermic
exothermic
endothermic
endothermic
Figure 2.9: Melting Processes: (a): a Pure Substance; (b): a Sample with a
Eutectic Impurity; (c): a Mixture; (d) and (e): Melting with
Decomposition [56]

22
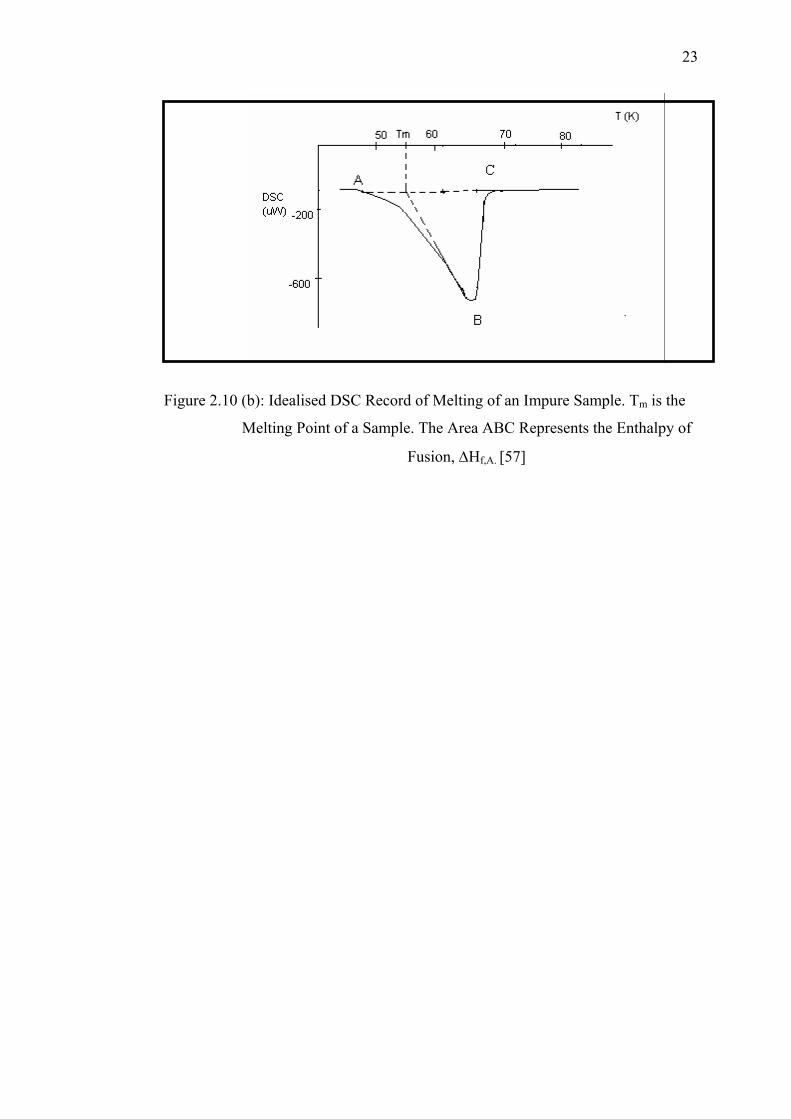
2.4 Purity Determination Using DSC
Measurements of the depression of the melting point of a sample are often
used to determine its purity [57]. Calculations are based on the assumption that solid
solutions are not formed and that the melt is an ideal solution. The melting
endotherm for a pure substance recorded on a DSC is illustrated in Figure 2.10 (a).
T0 is the melting point of the sample and the area ABC is proportional to the
enthalpy of fusion, ΔHf, of the sample. Compare with the presence of impurity in the
sample generally lowers the melting point and also broadens the melting range,
giving a broader DSC endotherm as illustrated in Figure 2.10 (b).
Figure 2.10 (a): Idealised DSC Record of Melting of Pure Sample. T0 is the Melting
Point of a Theoretical Sample with Zero Impurity. Area ABC
Represents the Enthalpy of Fusion, ΔHf. [57]
23
Figure 2.10 (b): Idealised DSC Record of Melting of an Impure Sample. Tm is the
Melting Point of a Sample. The Area ABC Represents the Enthalpy of
Fusion, ΔHf,A. [57]

24
2.5 Phase Diagram of a Pure Substance
Equilibrium can exist not only between the liquid and vapour phases of a
substance but also between the solid and liquid phases, and the solid and gas phases
of a substance. A phase diagram is a graphical way to depict the effects of pressure
and temperature on the phase of a substance [58]. Figure 2.12 illustrates a phase
diagram of a pure substance.
Solid
Liquid
Gas
Pressure
Temperature
melting
freezing vaporization
condensation
sublimation
deposition
triple point
critical point
Figure 2.12: A Phase Diagram of a Pure Substance [58]
The curves indicate the conditions of temperature and the pressure under
which equilibrium between different phases of a substance can exist. The vapour
pressure curve is the border between the liquid and gaseous states of the substance.
The vapour pressure curve ends at the critical point. The line between the gas and
solid phase indicates the vapour pressure of the solid as it sublimes at different
temperatures. The line between the solid and liquid phases indicates the melting
temperature of a solid as a function of pressure. The triple point is the particular

25
condition of temperature and pressure where all three physical states are in
equilibrium. Regions not on a line represent conditions of temperature and pressure
where only one particular phase is present.

26
CHAPTER III
METHODOLOGY
3.1 Overall Research
Methodology for the whole research would be referring to the overall flowchart
Figure 3.1. Basically, there are 5 main parts in the research:
1) Preliminary survey to locate HSDSC, the Diamond DSC from Perkin
Elmer in peninsular Malaysia, conducted through out visits.
2) Extraction of pure ginger oleoresin compounds using solvent extractor
3) Isolation of pure ginger oleoresin compounds using gravity liquid
chromatography
4) Elucidation and confirmation of the pure structures using Thin Layer
Chromatography and comparing with the standard.
5) Qualitative and quantitative analysis development using HSDSC.

IDENTIFY SUITABLE HSDSC FOR USE WITH
PERMISSION
PRELIMINARY SURVEY LOCATING HSDSC
CLEANING AND CALIBRATION
IMPROVED OPERATING CONDITION
PURE COMPOUNDS : GINGEROL, SHOGAOL, ZINGERONE &
ZINGIBERENE
MIXTURE COMPOUNDS : GINGER OLEORESIN
COMPARISON WITH CONVENTIONAL TECHNIQUES
STUDIES FOR THERMAL PROPERTIES MELTING POINT & HEAT OF FUSION
CHARACTERISATION
Figure 3.1: Overall Methodology
MICRODISTILLER FINAL PURIFICATION
GINGER OLEORESIN
PURITY DETERMINATION
PURE COMPOUNDS : GINGEROL, SHOGAOL, ZINGERONE &
ZINGIBERENE
ISOLATION AND ELUCIDATION
GRAVITY LIQUID CHROMATOGRAPHY
THIN LAYER CHROMATOGRAPHY
ROTARY EVAPORATOR PRELIMINARY PURIFICATION
PLANT EXTRACTION (MIXTURE ZINGIBER
OFFICINALE ROSCOE AND ETHANOL 1 : 4)

3.2 General Procedure
Mature ginger rhizomes (Zingiber officinale Roscoe) were obtained from a
supplier in Pasar Borong Selayang, Selangor. The major compound in ginger
oleoresin, 6-gingerol standard was purchased from Wako Pure Chemical Industries
(Osaka, Japan). All reagents (chloroform, petroleum ether, diethyl ether and ethyl
acetate) were of analytical grade (LabScan Asia, Co.) and were used without further
purification except for petroleum ether (LabScan Asia, Co.) and glycerol (Fisher
Scientific). Two techniques were performed in this research, where dried rhizomes
were extracted using solvent extraction to produce crude products (oleoresin).
3.3 Extraction of Zingiber officinale Roscoe
The rhizomes were washed, sliced, bleached and solar-dried. To ensure
consistent oleoresin sample after solvent removal, the Refractive Index (RI) was
measured using ATAGO’s Abbe Refractometer 1T, accurate to ± 0.0002 and
afterward sample was taken only if ηD20 1.5200 [59]. In this research synthetic
ethanol (Labscan Asia Co. 98% pure) were used to extract oleoresin.
The ginger rhizomes (200 g) were used and the ratio of ginger to ethanol was
1:4. The extraction process was performed in the 15 L capacity vessel extractor. The
extraction time was carried out for 6 hours at 65°C and 1 atm. After this period, 98%
solvent was removed under vacuum at 175 mbar in the Buchi R205 rotary
evaporator. The crude extract was used as a mixture in DSC analysis.
3.3.1 Isolation of 6-Gingerol
The major compounds were separated and purified using gravity liquid
chromatography (GLC). The absorbent used for column chromatography were silica
gel Merck 60 (230-400 mesh) and silica gel Merck 60 (70-230 mesh). A series of
solvent system with increasing polarity.

Rhizomes Z. officinale Roscoe (2000.00 g) were extracted using large vessel
extractor in ethanol (8L) for 6 hours. The solvent was removed using Buchi R-205
rotary evaporator at constant vacuum 175 mbar, a brown viscous liquid ginger
oleoresin (2.00 g) was subjected to gravity column chromatography over 10 g silica
gel Merck 60 (70 - 230 mesh) in a slurry with the increasing polarity of mobile phase
starting with non polar, petroleum ether to a mixture of petroleum ether and diethyl
ether, followed by 100 % of diethyl ether until PE:Et2O (4:6 v/v). Petroleum ether
(60-80°C) was distilled before it can be used as eluent (mobile phase) in separation
process. The slurry mixture was poured into the vertically oriented glass column (30
cm x 1.5 cm i.d.) to yield 41 fractions. The earlier fractions contained very volatile
and least polar compounds present in the extracted oleoresin, followed by polar
compounds and the most polar compounds. Each fraction was analysed by TLC and
was performed using TLC aluminium plate, gel silica Merck 60 F254 with 0.20 mm
thickness. The spots of the isolated compounds on TLC plate were examined under a
UV lamp (254) nm and were clearly visualised by iodine vapour that form a brown
spots.
Isolation and purification techniques are necessary to obtain the major
compounds in the pure form in order to provide the sample for DSC investigation,
which require the thermal reference data of the major compounds. The major
compounds were separated and purified by means of several chromatographic
techniques including vacuum liquid chromatography (VLC), gravity liquid
chromatography (GLC) and preparative thin layer chromatography (TLC). The
structures were elucidated using spectroscopic methods including 1H NMR, 13C
NMR, IR and GC-MS.
3.3.1.1 Vacuum Liquid Chromatography (VLC)
The chromatographic column was prepared by mixing the adsorbent (silica
gel 9385, 230-400 mesh) in slurry with the mobile phase (series of solvent mixture,
starting with non polar, petroleum ether to a mixture of petroleum ether: diethyl ether
with increasing polarity). The round filter paper was placed in the column, served to
give flat base to the column of adsorbent and the sample while solvent was poured

and suck dry. The earlier fraction contained the very volatile and least polar
compounds present in the extracted oleoresin. The following fraction contained polar
compounds and next was the most polar compounds. About 25 fractions were
produced from this method and the same Rf value from TLC analyses was combined
to get the main fraction (6 fractions). Next step, the fraction that contains the major
compounds is selected for further purification using gravity liquid chromatography
(GLC). The purification procedures were simplified as shown in figure 3.7 (a). A
part of the procedure has been taken a photo (Figure 3.7 (b)).
250 g SiO2 (230-400 Mesh, Silica Merck 9385) were packed inside vacuum
column (diameter, 6 cm) acted as stationary phase.
15 g crude extract were dropped to the column wall to make homogenous.
Round filter paper was placed in the column, served to give flat base to the
column of adsorbent and the sample while solvent was poured and suck dry.
Series of solvent mixtures, starting with non-polar (PE to a mixture of
PE:Et2O with increasing polarity then Et2O 100%, Et2O:EtOAC, 50:50 and
finally EtOAC 100%)
All the fractions are collected and analyzed by TLC. The same Rf value are
combined to get the main fraction.
Figure 3.7 (a): The VLC procedure

(a) (b) (c)
(d)
Figure 3.7 (b):
(a) Sample is put homogeneously from the column wall.
(b) Sample isolated through the SiO2 packed by the series of solvent
system.
(c) Most of the sample isolated completely with 100% EtOAC
(most polar). (d) The 25 fractions are produced which every fraction will be analyzed
by TLC and the same spot have to combine.
3.3.1.2 Gravity Liquid Chromatography (GLC)
The stationary phase used was (silica gel 7734) and the mobile phase (pet.
ether: diethyl ether, 3:7 v/v). The adsorbent was packed in the column (30 cm x 2.5
cm i.d.) with petroleum ether into the vertically oriented glass column. The column
was taped during packing to minimized air bubbles in the packing procedure. The
fraction sample from GLC is placed in the column approximately 1 cm from the
adsorbent base. It must be cautioned that the level of the mobile phase must never be
allowed to fall below the level of the adsorbent. This may result in the development
of cracks in the adsorbent column and hence poor resolution [2]. Elution of the
sample was carried out using 3:7 v/v (pet. ether: diethyl ether) by gravity action.
Figure 3.7 (c) shows the GLC procedure, which is the continuous technique after the
sample has been fractionated using VLC.
100 g SiO2 (100-140 Mesh, Silica Merck 7734) were packed inside gravity column (diameter, 4 cm) acted as stationary phase
2.43 g fraction from VLC was dropped to the column wall to make homogenous.
9:1 (PE:Et2O) and 8.5:1.5 (PE:Et2O) will be the solvent system used as a mobile phase to isolate the major compound
All the fractions are collected and analyzed by TLC. The same Rf value was
combined to get the main fraction.
Figure 3.7 (c): The GLC procedure
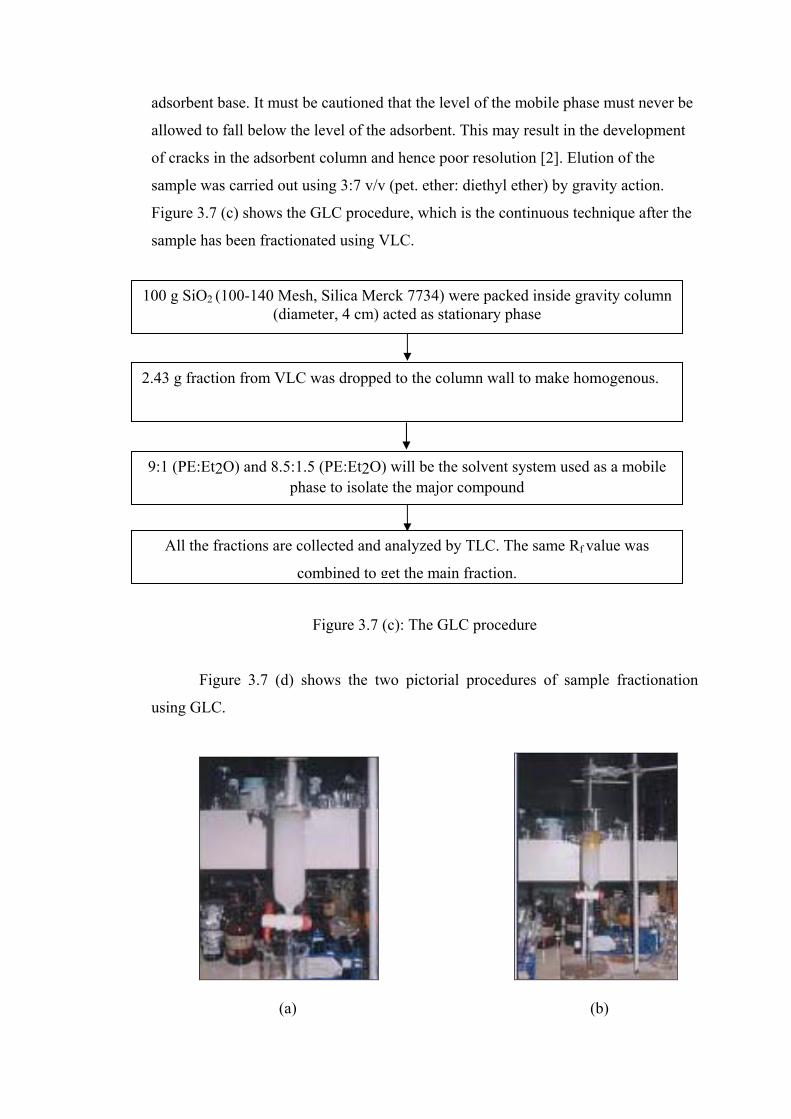
Figure 3.7 (d) shows the two pictorial procedures of sample fractionation
using GLC.
(a) (b)

Figure 3.7 (d):
(a) Shogaol (the second fraction from VLC) is placed on SiO2 packing.
(b) The sample moves through SiO2 packing after being fractionated
with the mobile phase by gravity action.
3.3.1.3 Thin Layer Chromatography (TLC)
Figure 3.7 (e) shows the steps involved in the thin layer chromatography
technique.
Standard and sample were spotted on the baseline (0.5 cm) drawn on the TLC
After the sample solvent has evaporated, the plate is placed in a close container
that is saturated with vapours of the developing solvents.
After development 4 cm from the origin, the plate is removed and examined
under a UV lamp (254 nm)
The spot were clearly visualized by iodine vapour that forms a brown spot and
Figure 3.7 (e): The TLC procedure
1H-NMR and carbon 13C-NMR spectra were recorded using spectrometer
NMR Varian Unity INOVA 400, which operated at 400 MHz and 100 MHz,
respectively. CDCl3 was used as a solvent and TMS as an internal standard. Infrared
spectra of the pure components were recorded in the region of 4000-400 cm-1 using
Fourier Transform Infrared (FTIR) Perkin Elmer Spectrometer. About 1 mg of solid
sample was finely ground with about 100 mg of dry KBr. The mixture was placed in
a steel die and subjected to a pressure of approximately 15,000 psi. The KBr disc was
then placed in the radiation beam. In the case of liquids, a few drops of sample were
placed on a flat, polished disc of crystalline NaCl and a second such disc was placed

on top. The two discs are squeezed together until an evenly distributed liquid film
was obtained between them. This combination was placed into a suitable holder that
fits in the radiation beam. Mass spectra (MS) were recorded using Hewlett Packard
Model 5989A Spectrometer.
A Shimadzu GC 14A Chromatograph equipped with a FID detector using
fused-silica CBP1 column (25 m x 0.22 mm i.d.) was employed. The samples were
injected in the split mode, using pressure controlled by helium as a carrier gas at 50
cm3/min. The injector and detector temperatures were maintained at 250 ºC. The
oven temperature program from 60 ºC (10 min) to 250 ºC at 3 ºC/min and the final
time was 1 min. GC-MS was recorded using Hewlet Packard Model 5890 Series II
Spectometer. The analyses were carried out on a CBP1 column (25 m x 0.22 mm
i.d.). The oven temperature program was 60 ºC (10 min), then 3 ºC/min to 250 ºC
(1 min) with helium as carrier gas.
The main emphasis of isolation technique in this research was to isolate the pure
major compounds. The yield of the isolated compound was not taken into
consideration. Compound 6-Gingerol standard with 98 % purity determined by
HPLC was imported from Japan and used as a standard.

3.4 General experimental procedure using HSDSC
HSDSC needs to be cleaned and calibrated before any measurement was
made. The HSDSC furnace was heated until equilibrium is achieved at 50 °C. Sealed
aluminium pan were used to study all the thermal properties that might be involved.
A 10 mg sample mass was weighed into the pan on a microbalance and crimped. An
empty pan treated in the same way was used as reference. The reference pan was
placed on a reference holder, while the sample pan was placed on the sample holder
in the furnace.
Generally, the HSDSC was set to a temperature programme where start
temperature was -20 ºC below the melting point and end temperatures were 100 ºC
above the melting point. The initial and final temperature was held for 3 minutes. All
the samples were heated continuously. At least three sets of runs were carried out for
every sample. The scanning was started when the baseline has been stabilised
(equilibrium). Gas purging is required throughout the experimental runs for faster
cooling.
3.4.1 Standard materials
The DSC calibration was performed using the following organic compounds, to
check the accuracy of the instrument:
i) Glycerol with a purity of 99.8% determined by GC (Fisher Scientific)
ii) Gingerol Standard with a purity of 98.0% determined by HPLC (Wako
Pure Chemical Ind. Ltd.)
The organic samples were chosen based on their thermal properties. Ideally,
the thermal properties of the organic samples including its melting temperature
should be as close as possible to those of the sample under consideration [60].

3.4.2 Instrumentation
DSC: The DSC heat flow measurements will be determined with power
compensated Diamond HSDSC system from Perkin Elmer, at Malaysian Agriculture
Research and Development Institute (MARDI), Serdang. This analytical instrument
comprises a Diamond furnace, intra-cooler, a data-processing unit TA station, an
output device for recording the hard copy and a visual display unit. See Figure 3.2.
The unit comes together with the software called Pyris for heat of reaction and
transition temperature calculation. The crucible type used was an aluminium pan.
Microbalance: The samples were weighed using Mettler Toledo MonoBLoc
AB204-S, maximum and minimum weight is 220 g and 0.1mg in accuracy to ± 0.05
mg. For each experimental run, two aluminium pans were used (sample and
reference) and these two pans were within ± 0.05 mg.
Figure 3.2: HSDSC Measurement at MARDI, Serdang

3.5 HSDSC maintenance
3.5.1 Cleaning
The HSDSC was cleaned every time after measurement. Cleaning the sample
holder is important to check any abnormal peak before measurement has been made.
Commonly the sample holder sensor and the furnace may be contaminated due to
decomposition, evaporation or sublimation of the sample. Cleaning inside the
furnace using acetone was performed by purging the inert gas, N2 (30 mL/min) and
raised the furnace temperature from 0 ºC to a high temperature 600 ºC to remove any
impurities or volatile component that are formed from previous measurements.
3.5.2 Instrument calibration
To get precise data, HSDSC instrument must be calibrated according to the
procedures described by the manufacturer in the operations manual or using ASTM
methods in designation E 968[61] and E 967[62] for calorimetric sensitivity from
time to time. There are two kinds of calibration, temperature calibration and heat
flow calibration (E 1269)[63]. In this experiment, HSDSC was calibrated frequently
(after every 10 measurements) using organic standard materials liked 6-Gingerol and
glycerol. It is obvious that a good agreement with the literature values and standard
material must be obtain when measuring the transition temperature.
3.5.2.1 Temperature Calibration Methods
Procedures for temperature calibration are divided by two, such as two point
calibration and one point calibration that was used for substances that melted
transition of >99.99% pure materials(ASTM E 967)[62].
i) Two Point Calibration Procedure
Select two calibration standard materials with melting temperatures one
above and one below the temperature range of interest. The calibration
materials should be as close to the temperature range of interest as

practical. Calibration materials about 5 to 15 mg were placed in a clean
specimen holder. Then the specimens were loaded into the instrument
chamber (furnace) with dry nitrogen being purge throughout the
experiment.
Finally, calibrations materials were rapidly heated or cooled below the
calibration temperatures of interest to allow it to stabilize. This
calculation enables the coefficient of the thermal curve that has been
recorded. If practical, adjustment to the temperature scale of the
instrument should be made so that temperatures are accurately indicated
directly.
ii) One Point Calibration Procedure
This procedure can only be used if the slope value previously from the
two point calibrations was determined to be sufficiently close to 1.0000.
All procedure is the same as two point calibrations except for using only
one standard material.
3.5.2.2 Heat Flow Calibration Methods
For heat flow calibration, the two main procedures are calibration at a
specific temperature and other temperatures that are used to calibrate the heat flow
response of the instrument with the same type specimen holder, heating rate, purge
gas and purge gas flow rate (E968)[61].
i) Calibration at a Specific Temperature
Melt transition calibration material 5 to 15 mg weighed amount was
placed into a clean specimen holder and sealed with lid to minimize
the free space. Then the specimen was loaded into the instrument to
equilibrate at a temperature below the melting temperature.
Next the specimen was heated up until the baseline re-established
above the melting endotherm and the accompanying thermal curve of

heat been recorded. The specimen was then cooled and reweighed.
The data will be rejected if mass losses exceeded 1% of the original
mass or if there is any reaction with the specimen holder. Finally, the
coefficient of the thermal curve that has been recorded was calculated.
ii) Calibration at Other Temperature
This procedure is an interpolative technique that can be accomplished
after data from calibration at a specific temperature procedure were
obtained. The scan starts at least 30°C below the lowest temperature
of interest (to permit attainment of dynamic equilibrium) to 10°C
above the highest temperature of interest and include the temperature
from above method (5.1.2.i) must be selected. Then, the sapphire was
placed into the specimen holder with lid and loaded into the furnace.
The initial temperature was held for 5 minutes. The specimen was
heated up and held for 2 minutes at the end of the scan. The specimen
was cooled and the calibration coefficient at the temperature of
interest within the temperature range was calculated.
3.5.2.3 Sample Temperature Calibration
The sample temperature was corrected by measuring the melting point of
indium and tin. The constants a and b were calculated from the measure melting
point (x) and accepted melting point, literature (y) using the formula below:
Value to be input as T. offset
( ) ininintn
intn yxaxxyy
a +−−−
= ; ...3.1
Value to be input as T. gain
( )'bxxyy
bintn
intn
−−
= ...3.2
where;
a’ = T. offset value used in the measurement = 0 initial value
b’ = T. gain value used in the measurement = 1 initial value
x in = measured melting point of indium (ºC)
x tn = measured melting point of tin (ºC)
y in = accepted melting point of indium (156.6 ºC)
y tn = accepted melting point of tin (232.0 ºC)
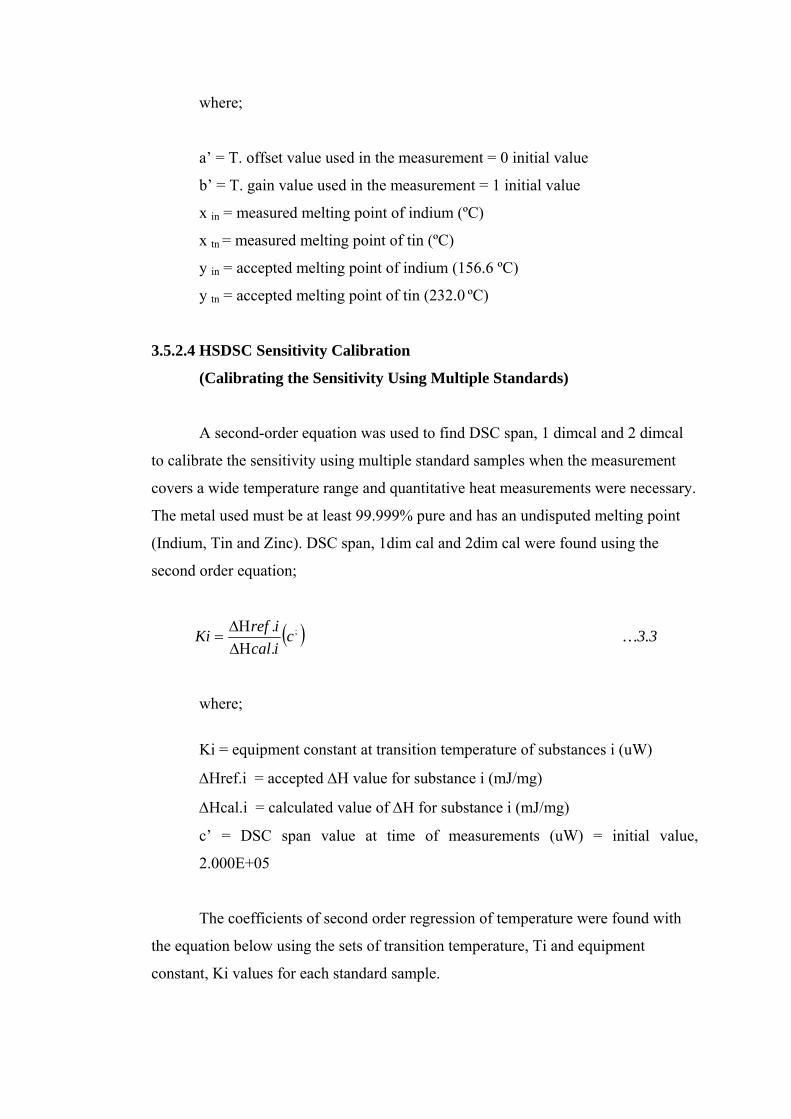
3.5.2.4 HSDSC Sensitivity Calibration
(Calibrating the Sensitivity Using Multiple Standards)
A second-order equation was used to find DSC span, 1 dimcal and 2 dimcal
to calibrate the sensitivity using multiple standard samples when the measurement
covers a wide temperature range and quantitative heat measurements were necessary.
The metal used must be at least 99.999% pure and has an undisputed melting point
(Indium, Tin and Zinc). DSC span, 1dim cal and 2dim cal were found using the
second order equation;
( );
.
. cicalirefKi
ΔΗΔΗ
= …3.3
where;
Ki = equipment constant at transition temperature of substances i (uW)
ΔHref.i = accepted ΔH value for substance i (mJ/mg)
ΔHcal.i = calculated value of ΔH for substance i (mJ/mg)
c’ = DSC span value at time of measurements (uW) = initial value,
2.000E+05
The coefficients of second order regression of temperature were found with
the equation below using the sets of transition temperature, Ti and equipment
constant, Ki values for each standard sample.

K (T) = C x (1 +dT + eT2) …3.4
3.5.2.5 HSDSC Slope Correction
When HSDSC baseline was slanted, the slope can be found from the data and
corrected by inputting the slope in HSDSC slope. The initial value for the HSDSC
slope was 0 before making the measurement. The baseline slope correction was
carried out without pan within the experimental temperature range (-20 - 100 ºC) and
scanning rate of 10 ºC/min.
The DSC slope value was found using the following equation:
12
12'
TTyySslopeDSC
−−
−= ..3.5
where;
S’ = DSC slope value at time of measurement = 0 initial value
T1, T2 = temperature at 2 points on the baseline
y1, y2 = DSC reading at T1 and T2

3.6 Optimum Operating Condition Procedure Step-scan Mode
Instead of continuously heating the sample, heat is applied in stepscan-mode.
Step-scanning mode was applied to all analysis, tested using sealed pan. Improved
scanning rate was done in order to optimise the operating condition. Two criteria
were used in the analysis; curve with the most significant endothermic peak
according to the best fit of three repeated runs (especially the Tm value) and with
acceptable statistic based on the lowest percentage of Absolute Average Deviation
(AAD). The experiments were performed using 6-gingerol standard from Wako Pure
Chemical Ind. Ltd. and pure glycerol fisher scientific sample, which is the
characteristic as same as ginger oleoresin.
In order to confirm the accuracy of the instrument, enthalpy of fusion and
melting temperature values of some organic compounds (glycerol and 6-gingerol
standard) were determined and these values were compared with the literature. About
13.00 mg – 14.00 mg samples were weighed into aluminium pan and crimped. The
heating rate was varied to identify the optimum scan rate from 10, 20, 50 and 100
ºC/min and the curve were recorded continuously from -20 to 100 ºC for both
sample. Both samples were cooled and the temperature was held for 3 minutes to
reach a steady state at -20 °C before it was scanned at the respective scanning rate up
to 100 °C. At 100 °C, the temperature was again held for 3 minutes to reach a steady
state. For each scanning rate, the heat flow measurements were repeated 3 times.
3.7 HSDSC Calculation
Melting point and heat of fusion can be determined from the ‘HSDSC
Analysis’ job. Each analysis was obtained from the calculation as described below.
3.7.1 Melting Point Calculation, Tm
The ‘transition point’ job is used to read the time or temperature at the start of
an endothermic HSDSC peak. The cursor was moved to the HSDSC Tm job icon in
the ‘HSDSC Analysis’ menu. The transition-point reading job was selected. Two
points (one on the data baseline and one on the peak slope) were specified with the
line cursor. The temperature or time at the intersection between the tangential lines
from the specified points gave the calculated transition point. A HSDSC melting
peak is presented in Figure 3.3.
Tm o Baseline
Peak slope
Temperature, ºC
Heat flow, μW (endo)
Figure 3.3: DSC peak showing the construction of the extrapolated onset

3.7.2 Heat of Fusion Calculation, ΔHf
The ΔHf job calculates the amount of heat from the area of the DSC peak,
divides it by the sample weight to convert it into ΔHf (mJ/mg) value. The procedure
is given below.
The ΔH job was selected from the icon in the ‘DSC Analysis’ menu. Two
points (one before and one after the peak) were specified with the line cursor. A
straight line was drawn between those two points and the ΔHf (mJ/mg) value was
calculated and displayed for the area of the peak marked of by the straight line
(Figure 3.4).
ΔHf
Temperature, ºC
Heat flow, μW
(endo)
Figure 3.4: DSC measurement of heat of fusion
3.7.3 Purity Determination
The temperature of phase changes and reactions as well as heats of fusion
were used to determine the purity of the compounds. Equation 3.6 namely Van’t
Hoff equation is used:
⎟⎟⎠
⎞⎜⎜⎝
⎛−
ΗΔ=−=
TTRxx Af
BA11)1ln(ln
0
, ...3.6

where;
xA = mole fraction purity (%)
xB = mole fraction impurity (%) B
T0 = theoretical melting point of the pure substance (K)
T = Tm, represent the melting point of impure sample (K)
Af ,ΗΔ = heat of fusion of the major component, A (J/mol)
R = gas constant, 8.314 J/mol.K
3.8 HSDSC Data Analyze or Processing
This section will brief all procedures performed in this research. Data
processing involved analysis of thermogram curves using Pyris Perkin Elmer
software, give all the curves were in “.pdid” format. The data were analyzed to give
the characteristics of the substances eg. the melting point and heat of fusion.
Altering or modifying method can be made on method editor dialog box and
choose sample info. Figure 3.5 shows sample info dialog box, which is used to set
sample identification, name of the operator, set the directory and set the sample mass
where the heat of fusion will be analyze. Then, to know whether the analysis action
is going to start or occur immediately or not, click initial state dialog box at the
method editor menu, Figure 3.6. After all info had been set, click on Program menu,
the dialog box will appear as in Figure 3.7, which is used to select heating or
cooling, continuous scans or step-scan and arrange method in order. Once a set of
method is confirmed, click end condition and start at the DSC Control Panel Box.
When analyzed sample start, click view program at the method editor menu as
Figure 3.8, it is used to overview all parameters or variables that has been selected

Figure 3.5: Sample info dialog box.
Figure 3.6: Initial state dialog box.

Figure 3.7: Program dialog box.
Figure 3.8: View program dialog box.

3.8.1 Melting Point and Heat of Fusion Analysis
Figure 3.9 shows a typical thermogram curve. First step, click the icon “Peak
Search” on the menu bar, to detect and identify a peak along the curve.
Figure 3.9: Peak search analysis dialog box.
Second step, click the icon “Peak Calculation” on the menu bar, Figure 3.10.
Optionally, choose selection parameter onset, end and peak height at the peak
calculation dialog box. Then click calculate, it will display all the parameter that had
been selected.

Figure 3.10: Peak calculation analysis dialog box.
The result including melting point and heat of fusion is displayed as in Figure 3.11.
Figure 3.11: Result dialog box.

CHAPTER IV
RESULTS AND DISCUSSION
4.1 Zingiber officinale Roscoe - Oleoresin
4.1.1 Yield of Ginger Oleoresin
The dried and grind rhizomes of Z. Officinale Roscoe (2500.00 g) were
extracted with ethanol 98% (10 Liter) in a solvent extractor for 6 hours. The solvent
was evaporated using Buchi R205 rotary evaporator to give the crude extract to yield
ginger oleoresin, a brown viscous liquid (247.63 g) i.e. 9.91 % yield. Oleoresin is a
mixture of a resin and an essential oil. The simple screening test was carried out to
measure compound purity, either melting point for solid or refractive index
measurement for liquid. The melting point of a solid sample was determined by
HSDSC Perkin Elmer while the refractive index of liquid samples were measured
using ATAGO’s Abbe Refractometer 1T, accurate to ± 0.0002. The pure
compounds were then investigated by spectroscopic and chromatographic methods
for structural elucidation and confirmation of the compounds. A gas chromatogram
of the ginger oleoresin is presented in Appendix 1.

4.1.2 6- Gingerol Isolation and Purification Techniques
Ginger oleoresin (14.00 mg) was subjected to gravity column
chromatography over 10 g silica gel Merck 60 (70 - 230 mesh) in a slurry with the
increasing polarity of mobile phase until PE:Et2O (4:6 v/v). The slurry mixture was
poured into the vertically oriented glass column (30 cm x 1.5 cm i.d.) to yield 41
fractions.
Fraction 37 was evaporated under vacuum to give compound 6-Gingerol
(9.29 mg, 0.01%) as a pungent, dark brownish viscous liquid with Rf 0.28 by TLC in
PE:Et2O (1:1 v/v). IR νmax cm-1: 3435.0, 2927.7, 1708.8, 1515.9, 1269.1; 1H NMR
(CDCl3): δ 0.85 (3H, t, J = 7.0 Hz, Me), 1.20-1.55 (8H, m, H-9, H-8, H-7, H-6), 2.45
(1H, dd, J =17.2 Hz, 8.0 Hz, H-4), 2.70-2.80 (4H, m, H-1, H-2), 3.02 (1H, broad, s,
OH), 3.85 (3H, s, OMe), 4.00 (1H, m, H-5), 5.55 (1H, broad, s, Ar-OH), 6.60 (1H,
dd, J =8.0 Hz, 2.0 Hz, H-6’), 6.61 (1H, d, J =2.0 Hz, H-2’), 6.80 (1H, d, J =8.0 Hz,
H-5’); 13C NMR (CDCl3): δ 14.00, 23.00, 25.50, 29.50, 32.00, 37.50, 46.00, 49.50,
56.00, 68.00, 111.00, 114.00, 121.00, 133.00, 144.00, 147.00, 212.00.
The IR spectrum (Appendix 2) showed a broad hydroxyl absorption at
3435.0 cm-1, a strong carbonyl absorption at 1708.8 cm-1, aromatic stretching at
1604.7 and 1515.9 cm-1 and also C-O stretching at 1269.1 cm-1. Table 4.1 gives the
IR parameter of compound 6-Gingerol.
Table 4.1: IR Parameter for Compound 6-Gingerol.
Frequency (cm-1) Intensity Type of Bond
3435.0 M O-H
2927.7 and 2858.3 S C-H
1708.8 S C=O
1604.7 and 1515.9 M C=C aromatic
1269.1 S C-O stretch
m = medium, s = strong

1H NMR spectrum (Appendix 3) of this compound indicated that compound
6-Gingerol had a similar structure to compound Shogaol due to the presence of a
methoxyl group at 3.85 (3H, s), methyl group at δ 0.85 (3H, t, J=6.3 Hz) and three
aromatic protons (H-6’, H-5’ and H-2’) observed at δ 6.60, 6.61 and 6.80
respectively. However, the spectrum for compound 6-gingerol showed a broad peak
at δ 3.02 was attributed to the hydroxyl proton. A broad single peak integrating for
two protons was assigned to two hydroxyl protons at δ 5.55. A multiplet peak at δ
2.70-2.80 was assigned for four protons (H-1 and H-2). Four methylene groups (H-
9, H-8, H-7 and H-6) were observed at δ 1.20–1.55 as multiplet.
The 13C NMR spectrum (Appendix 4) supported that compound 6-Gingerol
based on the 17 peaks, which represents 17 carbons in the molecule. The presence of
carbon methyl was observed at δ 14.00 and δ 56.00, seven methylene carbon, C-1
(29.5), C-2 (46.0), C-4 (49.5), C-6 (37.0), C-7 (32.0), C-8 (25.5), C-9 (23.0) and
metyna C-5 (68.0), carbonyl carbon C-3 (212.0), quaternary carbon C-1’ (133.0), C-
3’ (147.0), C-4’ (144.0) and carbon aryl C-2’ (111.0), C-5’ (114.0) and C-6’ (121.0).
That compound has been identified as compound 6-Gingerol based on the physical
properties and the spectroscopic data of compound isolated from Zingiber officinale
Roscoe [4] and compared with the authentic sample and compound 6-Gingerol
standard. Both of the NMR data are summarised in Table 4.2.

Table 4.2: 1H NMR and 13C NMR Parameters for Compound 6-Gingerol.
Carbon 13C, δ (ppm) 1H, δ (ppm)
1 29.50 2.70-2.80
2 46.00 2.70-2.80
3 212.00
4 49.50 2.45, 2.50
5 68.00 4.00
3.02 (-OH)
6 37.00 1.20-1.55
7 32.00 1.20-1.55
8 25.50 1.20-1.55
9 23.00 1.20-1.55
10 14.00 0.85
1’ 133.00
2’ 111.00 6.61
3’ 147.00
4’ 144.00 5.55
5’ 114.00 6.80
6’ 121.00 6.60
Ome 56.00 3.85
CH3
HO
MeO 1
23
453'
2'1'
4'5'
6'
6
7
8
9
10
O OH
Figure 4.1:- Gingerol structure.
(1-(4’-Hydroxy-3’-methoxyphenyl)-5-hydroxy-3-decanone)

4.2 Purity Determination for Organic Compound Analysis Using DSC
6-gingerol is a relatively stable compound that does not readily decompose
unless under extreme conditions. Hence, the DSC temperature studied was at low
temperature, less than 100°C. Figure 4.2, shows the DSC peak of isolated and
standard 6-gingerol. Both samples melt below 30°C and the broad peak was observed
due the nature of the sample, which is amorphous solid. The Tm and ΔHf data of 6-
gingerol samples are presented in Table 4.3.
Figure 4.2: Comparison of DSC scan for isolated and standard of 6-gingerol.
Table 4.3: Tm and ΔHf data of 6-gingerol
Melting temperature,
Tm (°C)
Sample Sample
mass (mg)
Onset Peak
maximum
Heat of
fusion,
ΔHf
(mJ/mg)
DSC %
mole
purity
Compound (1)
std. (Wako
product)
1.00 26.20 34.50 50.6 93.24
Isolated
compound (1)
1.02 29.20 36.88 18.7 99.34
From the graph (Figure 4.2), the fusion occurred endothermically in the
temperature range from 25 to 50 ºC. The samples identified as 6-gingerol based on
their melting points and not on the heat of fusion data. Isolated 6-gingerol reported in
this study show a temperature onset very close to the literature melting point.
For 6-gingerol standard, the melting point was 26.20 ºC and its heat of fusion
was found to be 50.6 mJ/mg. For the isolated 6-gingerol the melting point was
indicated at 29.20 ºC and its heat of fusion was found lower than the standard, which
was 18.7 mJ/mg. Tm data was not much different, except for heat of fusion where the
difference was quite obvious. However, from DSC purity calculation, both
compounds showed more than 90 % purity. It showed that purity determination by
DSC is depends on Tm value rather than ΔHf value.
4.3 HSDSC Scans for Organic Compounds
Organic compounds, glycerol which melts at the same temperature range with
the investigated samples 6-gingerol, were tested using the calibrated DSC. The
accuracy of the instrument was checked by determination of melting temperature and
heat of fusion for each pure organic compound. Pure glycerol (Fisher Scientific) is a
viscous liquid, similar condition to the investigated sample, ginger oleoresin. Pure 6-
gingerol standard (Wako Pure Chemical Ind. Ltd.) is a major constituent of ginger
oleoresin responsible for ginger’s characteristic.
4.3.1 Optimum Conditions for Pure Organic Compounds Analysis
An alternative step-scan mode was used in this approach; the HSDSC was
programmed to make a series of small temperature interval, 1ºC each followed by an
isothermal period. Subsequent temperature steps and holding periods follow, until
the whole temperature range of interest was examined. This scanning mode is called
‘step-scan mode’. Step-scan technique can be applied to all substances that are
thermally stable during melting in order to analyze more peaks instead of one broad
peak [23]. This may be particularly advantageous if the melting is close in

temperature to one. It is allowing sufficient time for a melting to occur within a small
temperature interval and also between steps for heat flow to reach a steady state [66].
Hence, much greater time was required to analyse sample using step-scan
compared to continuous scan. Fortunately, if the analysis uses higher scan rate it will
definitely take much less time. The experiments were conducted at step-scan mode
and various scanning rates (10, 20, 50 and 100 °C/min). The sample mass was kept
constant between 13.0 mg to 14.0 mg for all applied scan rates, tested using sealed
aluminium pan. Due to that, statistical analysis was explored using Microsoft office-
Excel spreadsheet to get the percentage Average Absolute Deviation (AAD). The
lowest percentage was favoured, since this indicates a small gap between literature
and experimental data, indicating good agreement between experimental and
literature results.
4.3.2 6-Gingerol Step-scan Analysis
6-Gingerol is a relatively stable compound that does not readily decompose
unless under extreme conditions [65]. Hence, the HSDSC temperature studied was at
low temperature, less than 100 °C. From Figure 4.3, each scan rates 10 and 20 °C
/min for 6-Gingerol standard showed only one broad endothermic peak and the
melting peak was not clearly defined. The appearance of broad peak is due to the
nature of the sample itself, where an amorphous compound or viscous liquid is
melted, there is no sharp change in structural characteristic, but rather a gradual lost
of interactions [64]. At the fastest scanning rate of 100 °C /min, the peak is very
sharp but the melting point value was little bit far from literature. Table 4.3, the
optimum scan rate that gives nearest melting peak value is 50 °C /min at 28.93 °C.

Figure 4.3: DSC Heat Flow of 6-Gingerol Standard as a Function of
Temperature at Varied Scan Rates 10, 20, 50 and 100 ºC/min,
Sample Mass: 13.8 mg.
Table 4.4: Melting point variation of 6-Gingerol Standard As A Function
of Varied Scan Rates.
Scan Rate (°C /min)
Melting Point, Tm
(°C ) AAD
[(Tm-Tr)/Tr] AAD
% 100.00 29.61 0.013 1.3 50.00 28.93 0.036 3.6 20.00 34.05 0.135 13.50 10.00 34.05 0.135 13.50
Tr = Reference point = 29.00 °C
Tm = Melting point
AAD = Average absolute deviation
4.2.3 Glycerol Step-scan Analysis
Pure Glycerol thermal behaviour was monitored using HSDSC. The range of
temperature -20°C to 100 °C was chosen since its melting point is just below 30°C.

Figure 4.4, illustrates that the melting point 18.14°C at scan rate 50 °C /min was
estimated the nearest to the literature value at 0.30% AAD in Table 4.5.
Figure 4.4: DSC Heat Flow of Glycerol as a Function of Temperature at
Varied Scan Rates 10, 20, 50 and 100 ºC/min,
Sample Mass: 13.8 mg
Table 4.5: Pure glycerol as a function of scan rates – Tm variation with
varied scan rate.
Scan Rate (°C /min)
Melting Point, Tm
(°C ) AAD
[(Tm-Tr)/Tr] AAD
% 100.00 17.76 0.024 2.40 50.00 18.14 0.003 0.30 20.00 20.61 0.133 13.30 10.00 20.63 0.133 13.30
Tr = Reference point = 18.20°C [67]
Tm = Melting point

4.3.4 Optimum Condition for Analyzing Ginger Oleoresin
The results from Figures 4.3, 4.4 and 4.5 were summarised in Table 4.6.
This gives the experimental conditions as well as the measured results for organic
compounds. The melting points of these organic compounds determined by HSDSC
were in good agreement with the literature values except for the heat of fusion,
ΔHf (J/g).
Ginger oleoresin is a semisolid mixture or amorphous solid compound of a
resin and essential oil, constituent of compounds 6-Gingerol, 6-Shogaol, Zingerone
and Zingeberene. The oleoresin on scanning gives the broad melting peak. The
optimum conditions were identified after analysing pure glycerol and 6-Gingerol
standard. Scan rate of 50 °C /min was chosen as the optimum value. The range of
temperature between -20 to 100 °C and sample mass ranging from 13.0 mg to 14.0
mg were used for ginger oleoresin.
Table 4.6: Experimental Conditions and Results Applied to Organic
Compounds After Calibration.
Melting point, Tm
(°C)
Heat of fusion, ΔHf
(J/g)
Organic compounds Sample mass (mg)
Scan rate (°C/min)
Temp. Range (°C)
Exp. Lit. Exp. Lit.
Glycerol 13.8 50.0 -20.0 -100.0 18.14 18.20[67]
3.091 200.62[67]
6-Gingerol
Standard (Wako Pure
Chem. Ind. Ltd)
13.8 50.0 -20.0-100.0 28.93 29.00[43] 2.045
50.6[44]
Ginger Oleoresin 13.8 50.0 -20.0 -100.0 27.90 30.34[44] 2.055 72.4 [44]

Figure 4.5: DSC Heat Flow of Ginger Oleoresin as a Function of Temperature
At Scan Rate 50ºC/min,
Sample Mass: 13.8 mg.
Table 4.7: Ginger Oleoresin at Scan Rate 50 ºC/min.
Scan Rate (°C /min)
Melting Point, Tm
(°C )
Coefficient of Variation
(%) 50.00 (1st Run) 27.88 -0.07 50.00 (2nd Run) 27.40 -1.79 50.00 (3rd Run) 28.43 1.90
Coefficient of variation = ⎟⎟⎠
⎞⎜⎜⎛
⎝
−
ave
ave
TTT
Tave = 27.90°C
For this set of experiment, the goal was to get the precise ginger oleoresin
melting point, its predicted value from previous researcher using heat flux Seiko
DSC is 30.34 °C [44]. Analysis of ginger oleoresin based on the melting point can
provide information about the major compounds. The melting points of gingerol,

shogaol and zingerone are 30 - 31 °C [44], less than 30 °C and 40 - 41 °C [44]
respectively. From Figure 4.5, the broad peak is believed to cover a wide range of
temperature so as to include the entire major component’s melting point, which is
close to each other. The melting of the mixed samples can be estimated from the
HSDSC peaks. The average melting point of ginger oleoresin 27.90 ºC at 50 ºC/min
is in good agreement with the melting point of 6-Gingerol standard as stated in the
literature.
4.4 Heat of Fusion
The heats of fusion is the amount of energy required to the melt a gram of sample
mass. The heats of fusion of 6 – gingerol and ginger oleoresin are as tabulated in
Table 4.8.
Table 4.8 Heats of Fusion of 6 – gingerol and Ginger Oleoresin At The Optimum
Scan Rate of 50°C/min (sample mass 13.0 – 14.0 mg).
Sample DSC ΔHf (J/g) ΔHf (ave.) Coeff. Of
Variation(%)
6 – gingerol Perkin Elmer
Diamond (MARDI) 2.045
2.020 - 1.703
1.957 - 4.769 ginger
oleoresin
Perkin Elmer
Diamond (MARDI) 2.188
2.055
6.472
Perkin Elmer
Diamond (ORIEM) ginger
oleoresin Mettler Toledo
0.729
RRI Sg.Buloh 0.37
The heats of fusion of ginger oleoresin was found to vary significally, from one DSC
to the others, therefore the results of ΔHf are not conclusive. However, based on the
HSDSC in MARDI, the ΔHf of 6 – gingerol is 2.045 J/g whilst that of ginger
oleoresin is 2.055 J/g.
4.5 Verification of Ginger Oleoresin Composition.
The heats of fusion of ginger oleoresin of 2.055 J/g is very close to those of 6 –
gingerol at 2.0455 J/g. Based on Kay’s rule for mixture, on a property ∑ xiP where,
xi = mole fraction of a compound and P = property, the equation can be extended to
heats of fusion.
Hence,
∑ xi ΔHfi = ΔHf(mixture)
Taking mole fraction of 6 – gingerol to be xa, the other components are 1 – xa = xb.
∴ xaΔHfa + (1 – xa)ΔHfb = ΔHf(mixture)
This indicates that ginger oleoresin extracted in this work comprises mainly of
6 – gingerol. The other possibility is that ginger oleoresin may comprise of very
similar substance to 6 – gingerol, which is not detectable by using HSDSC. Hence,
the melting curve of ginger oleoresin is slightly broader than those of 6 – gingerol.

CHAPTER V
CONCLUSIONS
5.1 Conclusions
Based on the result, several conclusions can be drawn from the experiments
conducted using DSC technique. Sample mass used in this research was about 13.0
mg. Higher mass was selected since it gave a smaller and closer to the true melting
point. The sample was heated at a rate of 50 °C/min as used for instrument
calibration and it was also valid for reproducible results in crude ginger oleoresin and
pure 6-Gingerol analysis. The Power Compensated DSC and the High Sensitivity
DSC was not really sensitive in detecting a few compounds in ginger oleoresin
because of the broad peak and heat of fusion value differ from literature. Separation
of major compounds in mixture can only be done in chromatographic techniques, but
not in thermal analysis techniques. In complex mixture, ginger oleoresin showed
only one broad endothermic peak. The melting point was corresponded to the 6-
gingerol’s compound. The broad peak was attributed to the multi-component mixed
samples. It was assumed to cover a wide range of melting point of the major
compounds, which are close to each other. Step-scan analysis was applicable for this
kind of DSC, since continuous scan cannot detect or identify any thermal changes.
The DSC however, can be used to identify purity of samples provided the standard
sample data on melting point is available and the purity is above 80%.

REFERENCES
1. Soepadmo, E. (1991). “Conservation Status of Medicinal Plants in Peninsular
Malaysia.” in. Khozirah Shaari, Azizol Abd. Kadir, Abd. Razak Mohd.
Ali. “Medicinal Products from Tropical Rain Forest Proceedings of the
Conference”. Kuala Lumpur: Forest Research Institute Malaysia. 13-23
2. Latiff, A. (1991). “Plant Resources for Natural Products: An Ethnobotanical
Perspective”. in. Khozirah Shaari, Azizol Abd. Kadir, Abd. Razak Mohd.
Ali. “Medicinal Products from Tropical Rain Forest Proceedings of the
Conference”. Kuala Lumpur: Forest Research Institute Malaysia. 1-12
3. Kinghorn, D and Eun-Kyoung (1998). “Chromatographic/Chromatographic
Spectroscopic Combination Methods for the Analysis of Botanical
Drugs”. Drug Information Journal. 32. 487-495
4. M. R. Haira Rizan (2004). “Differential Scanning Calorimetry (DSC) Studies
on Two Zingiber Species”.Master Thesis Copy of Universiti Teknologi
Malaysia 1-139
5. Plato, C. (1972). “Differential Scanning Calorimetry as a General Method for
Determining purity and Heat of Fusion of High-Purity Organic
Chemicals: Application to 64 Compounds.” Anal. Chem. 44 (8). 1531-
1534
6. Plato, C. and Glasgow, A. R. (1969). “Differential Scanning Calorimetry as a

General Method for Determining purity and Heat of Fusion of Hogh-
Purity Organic Chemicals: Application to 95 Compounds.” Anal. Chem.
41 (2). 330-336
7. Widmann, G. (1991). “A New Program for DSC Purity Analysis.” J.
Therm. Anal. 37. 1957-1964
8. Yamamoto, K., Momota, M., Katayama, S. and Narita, K. (1998).
“Determination of the Purity of Multi-Component Organic Substances by
DSC.” Anal. Sci. 14. 599-602
9. Palermo, E. F and Chiu, J. (1976). “Critical Review of Methods for the
Determination of Purity by Differential Scanning Calorimetry.”
Thermochim. Acta. 14.1-12
10. Gustin, G. M. (1980). “Broad Range Purity Analysis by Melting Point
Depression Using a Singular Feature Common to All DSC Purity Scans.”
Thermochim. Acta. 39. 81-93
11. Mccullough, J. P. and Waddington, G. (1957). “Melting Point Purity
Determinations: Limitations As Evidence By Calorimetric Studies In The
Melting Region.” Anal. Chim. Acta. 17. 80-96
12. Sondack, D. L. (1972). “Simple Equation for Linearization of Data in
Differential Scanning Calorimetric Purity Determinations.” Anal. Chem.
44 (4). 888
13. Flynn, J. H. (1993). “Analysis of DSC results by Integration.” Thermochim.
Acta. 217.129-149
14. Elder, J. P. (1979). “Dynamic DSC Purity Analysis Studies of Two
Component Doped Systems.” Thermochim. Acta. 34. 11-17
15. An, X. W and Sabbah, R. (1991). “Correction in DTA Purity Determination.”

Thermochim. Acta. 190. 241-249
16. Donnelly, J. R., Drewers, L. A., Johnson, R. L., Munslow, W. D., Knapp, K.
K. and Sovocool, G. W. (1990). “Purity and heat of fusion data for
environmental standards as determined by DSC.” Thermochim. Acta. 167.
155-187
17. Giron, D. (1974). “Differential Scanning Calorimetry, A Quick
Differentiating Method in Quality Control for New Substances”. Therm.
Anal. 3. Proceedings Fourth ICTA Budapest.
18. J. Schlicter, S. Sarig and N. Garti (1985). “ Polymorphic Transformation of
Cocoa Butter in The Presence of Emulsifier, Studied by DSC”.
Thermochim. Acta 85. 517-520
19. Imogen Fourbert, Peter A. Vanrolleghem and Koen Dewittinck (2002) “A
DSC Method to Determine Isothermal Crystallization Kinetics of Cocoa
Butter”. Thermochim. Acta. 400. 131-142
20. Noor Azian, M. (1995). “The Physical Properties of Palm Oil Mixture for
Design and Process Equipment”: Universiti Teknologi Malaysia: Thesis
Ph. D.
21. J. M. N. Marikkar, H. M. Ghazali, Y. B. Che Man and O. M. Lai (2002).
“ The Use of Cooling and Heating Thermograms for Monitoring of
Tallow, Lard and Chicken Fat Adulteration in Canola Oil”
Thermochim. Acta 35. 1007-1014
22. A. F. Baroni, A. M. Sereno and M. D. Hubinger. (2002) “Thermal Transition
Osmotically Dehydrated Tomato by Modulated Temperature DSC”.
Thermochim. Acta 395. 237-249
23. Kerr, W. L. and Reid, D. S. (1994). “The Use of Stepwise Differential

Scanning Calorimetry for Thermal Analysis of Foods.” Thermochim.
Acta. 246. 299-308
24. Kouame Kouassi and Yrjo H. Roos (2001). “Glass Transition and Water
Effect on Sucrose Inversion in Noncrystalline Carbohydrate Food
Systems” Thermochim. Acta 34. 895 -901
25. E. Illikova, B. Abba and F. A Kuhnas(1991) “Measurement of Accurate
Specific Heat of Metallic Glasses by DSC”
Thermochim. Acta 195. 195 -209
26. Amar Auozelleg and Laura Anne Bull (2004). “Differential Scanning
Calorimetry Study of Pressure/Temperature Processed β-lactoglobulin :
the Effect of Dextran Sulphate” Thermochim. Acta 37. 933 -940
27. D. Torreggiani, E. Forni, I. Guercilena, A. Maestrelli, G. Bertolo, G. P.
Archer, C. J. Kennedy, S. Bone, G. Blond, E. Contreras-Lopez and D.
Champion (1999). “Modification of Glass Transition Temperature
Through Carbohydrates Additions: Effect Upon Colour and
Anthocyanin Pigment Stability in Frozen Strawberry Juices”.
Thermochim. Acta 32. 441-446
28. J. Ford, M. Saunders and P. Royall. “The use HyperDSC in the study of
Amorphous Lactose- A Study of Percentage Amorphous Content.
PETA Solution Hyper DSC Application Note”.
29. Wong, K. M. (1999). “Gingers of Peninsular Malaysia and Singapore:
Larsen, K., Ibrahim, H., Khaw, S. H. and Saw, L. G.” Natural History
Publications (Borneo), Kota Kinabalu. 1-114
30. Halijah, I. and Ahmad, A. Rahman. (1988). “Several Ginger Plants
(Zingiberaceae) of Potential Value.” Proceedings: Malaysian Traditional
Medicine, Kuala Lumpur. 159-161
31. Lawrence, B. M. (1984). “Major Tropical Species-Ginger (Zingiber officinale

Roscoe).” Perfumer Flavorist.
32. Merck & Co., Inc. 1999 Whitehouse Station, NJ, USA
33. Connell, D. W. (1970). “The Chemistry of the Essential Oil and Oleoresin of
Ginger (Zingiber officinale Roscoe).” The Flavour Industry. 677-693
34. Bone, M. E., Wilkinson, D. J., Young, J. R., McNeil, J., and Charlton, S.
(1990). “Ginger root: A New Anti-Emetic, the Effect of Ginger Root or
Postoperative Nausea and Vomiting after Major Gynaecological Surgery.
Anaesthesia. 45. 669-671
35. Kikizaki, H. and Nakatani, N. (1993). “Anti-Oxidant Effects of Some Ginger
Constituents.” J. Food Sci. 58. 1407-1410
36. Srivastava, K. C. and Mustafa, T. (1992). “Ginger (Zingiber officinale) in
Rhematism and Muscoskeletal Disorders.” Medical Hypothesis. 39 (4).
342-348
37. Itokawa, H. and Takaya, K. (1993). “Anti-Tumor Substances from Higher
Plants.” Heterocycles. 35. 100-112
38. Yoshikawa, M., Yamaguchi, S., Kunimi, K., Matsuda, H., Okuno, Y.,
Yamahara, J. and Murakami, N. (1994). “Stomachic principles in Ginger.
III An Anti-Ulcer Principle, 6-gingesulfonic Acid and three
Monoacyldigalactosylglycerols, gingerglycolipids A, B and C from
Zingiberis Rhizoma Originating in Taiwan.” Chem. Pharm. Bull. 42. (6).
1226-1230
39. Young, H. T., Chiang, C. T., Pan, F. P. and Chen, G. L. (2002). “Analytical
and Stability Studies of Ginger Preparations.” J. Food and Drug Anal. 10 (3).
149-153
40. Philips, S. (1993). “Zingiber officinale (Ginger). An Anti-Emetic for Day
Case Surgery.” Anaesthesia. 48. 715-717
41. Miyazawa, M and Kameoka, H. (1988). “ Volatile Flavour Components of
Zingiberis Rhizoma (Zingiber officinale Roscoe).” Agric. Biol. Chem. 52
(11). 2961-2963
42. Pollock, J. R. A. and Stevens, R. (1965). “Dictionary of Organic
Compounds.” Vol. 1-5. London: Eyre & Spottiswoode Publishers, Ltd.
109,405, 541, 709, 714, 761, 1504, 1509, 1534, 2016, 2899, 3280, 3281
43. Yamagishi, T., Hayashi, K. and Mitsuhashi, H. (1972). “Isolation of
Hexahydrocurcumin, Dihydrogingerol and Two Additional Pungent
Principles from Ginger.” Chem. Pharm. Bull. 20 (10). 2291-2292
44. M. R. Haira Rizan (2004). “Differential Scanning Calorimetry (DSC) Studies
on Two Zingiber Species”.Master Thesis Copy of Universiti Teknologi
Malaysia 1-139
45. W. J. Sichina and Steven Bouffard, Thermal Analysis Application Note,
Perkin Elmer Instrument, Purity Measurement of Pharmaceutical and
Organics by DSC.
46. Edward Kolbe, Lester A. Wilson and Richard Hartel (1996).“A Round Robin
Evaluation of Differential Scanning Calorimetry to Measure Transition
Enthalpy and Temperatures” Thermochim. Acta 40. 95 -99
47. Phill robinson and Bill sichina.(1999). Characterization of Chocolate Using
Power Compensated DSC.
48. Margret Mansson(1996). “Purity Determination by Thermal Analysis-
Equilibrium Method CCQM/96-19, Working Document Committee
Consultative Pour la Quantite de Matiere”.
49. W. J. Sichina and Steven Bouffard (2000), Thermal Analysis application
note, Perkin Elmer Instrument,Characterization of Single Fiber for
Forensic Application Using High Speed DSC.
50. Svenja Goth, Lin Li, Paul Gabbot, Tim Mann (1999), PETA Solutions
(PETech) Beaconsfield, UK., Perkin Elmer Life and Analytical Sciences
Shelton.
51. U. Jörimann, Dr. B. Benzler, Dr. J. de Buhr, Dr. R. Riesen, J. WidmannSelection of
the heating rate by mettler Toledo information for uses of thermal
analysis systems, dec 1995
52. Paul Gabbott,Paul Clarke,Tim Mann, Paul Royall,and Sukhraj Shergill.
(2000). A High-Sensitivity,High-Speed DSC Technique: Measurement
of Amorphous Lactose, Perkin-Elmer Instruments: Application Note.
53. Hemminger, W. F. and Sarge, S. M. (1991). “The Baseline Construction and
its Influence on the Measurement of Heat with Differential Scanning
Calorimeters.” J. Thermal Anal. 37. 1455-1477
54. Hohne, G. W. H. (1991). “Remarks on the Calibration of Differential
Scanning Calorimeters.” J. Therm. Anal. 37. 1987-2000
55. Willard, H. H., Merritt, L. L., Dean, J. A. and Settle, F. A. (1988). “
Instrumental Methods of Analysis.”7th.ed. International Student Edition:
Wadsworth, Inc. 761-771
56. UserCom 1/2000. “Interpreting DSC curves. Part 1: Dynamic
measurements.” Information for users of METLER TOLEDO thermal
analysis systems. 1-7
57. Brown, M. E. (1988). “Introduction to Thermal Analysis: Technique and
Application.” Chapman & Hall. 34-35, 152-156
58. Atkins, P. W. (1990). “Physical Chemistry.” 4th Edition. ELSB with Oxford

U Press. 131- 171
59. Noor Azian, M., Sazalina, M. S and Haira Rizan, M. R. (2001). “Ginger
Oleoresin From Zingiber Officinale Roscoe: Effect of Sample Preparation
Yield and Quality.” Paper presented at Congress of Science and
Technology Malaysia (COSTAM). Kota Kinabalu
60. Lide, D. R. (1994). “CRC Handbook of Chemistry and Physics.” 75th Edition.
6-129, 6-132
61. ASTM International. “Standard Practice for Heat
Flow Calibration of Differential Scanning Calorimeters”.
Designation : E 968-02, 1-5
62. ASTM International. “Standard Test Method for Temperature Calibration of
Differential Scanning Calorimeters and Differential Thermal
Analyzers”. Designation : E 967-03, 1-4
63. ASTM International. “Standard Test Method for Determining Specific Heat
Capacity by Differential Scanning Calorimeters”.
Designation : E 1269-01, 1-6
64. Naqieb, Z. A. (1990). “Thermal Analysis of Eucalptus Camaldulensis and
Cotton Stalks at Different Heating Rates.” J. Therm. Anal. 36. 1429-1439
65. Ksiazczak, A. and Ksiazczak, T. (1994). “Thermal Stability of Some
Pesticides at the Melting Temperature.” J. Therm. Anal. 41. 1153-1163
66. The Saskatchewan Nutraceutical Network, SNN. (2002). “Developments in
Nutraceuticals and Functional Foods.” NutraNews. 11. Third Annual
SNN Conference
67 Handbook CRC Handbook of Chemistry and Physics, 62nd

APPENDIX 1: Gas chromatograph of ginger oleoresin
APPENDIXES

APPENDIX 2: IR spectrum of compound 6-gingerol

APPENDIX 3: 1H NMR of compound 6-gingerol

APPENDIX 4: 13C NMR of compound 6-gingerol
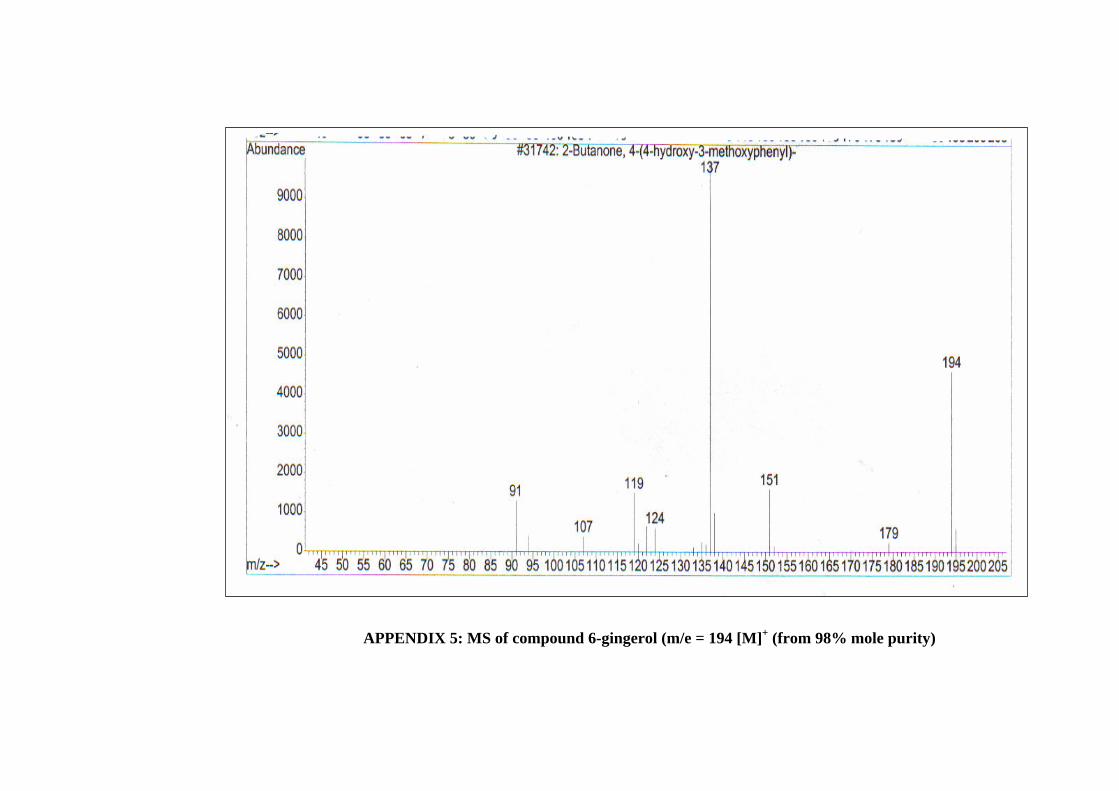
APPENDIX 5: MS of compound 6-gingerol (m/e = 194 [M]+ (from 98% mole purity)

APPENDIX 6: GC-MS of compound 6-gingerol (from 98% mole purity)

APPENDIX 7: GC-MS of compound isolated 6-gingerol)
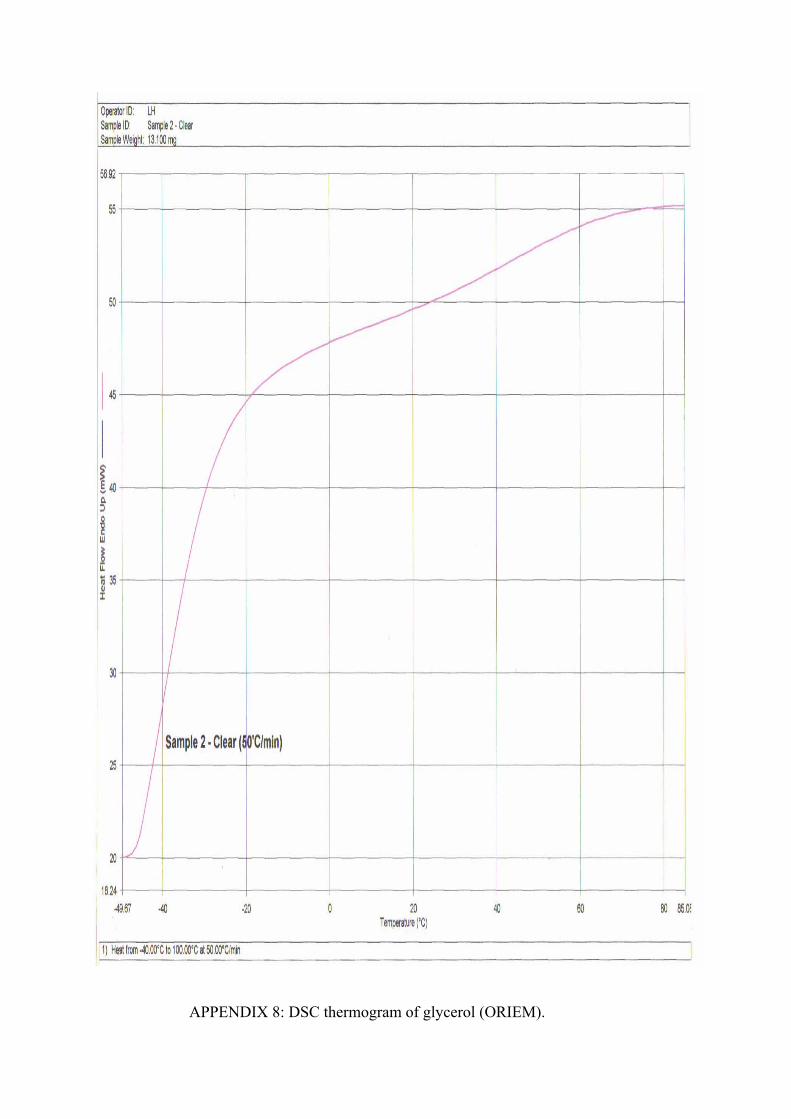
APPENDIX 8: DSC thermogram of glycerol (ORIEM).

APPENDIX 9: DSC thermogram of ginger oleoresin (ORIEM).

APPENDIX 10: DSC thermogram of ginger oleoresin (SIRIM).

APPENDIX 11: Calculation of purity determination using DSC
Sample: Stearic acid, GC ∼ 97%
T0 represents the theoretical melting point of the pure substance [72] = 341.97 K
Tm = T represent the melting point of impure sample (K) from DSC thermogram
Af ,ΗΔ represents the enthalpy of fusion (J/mol)
R represents gas constant = 8.314 J/mol.K
xA = mole % purity of sample
xB = mole % impurity of sample
b) Glycerol: 50.000 ºC/min
T0 = 303.15 K
T = 18.141 °C = 291.291 K
Af ,ΗΔ = 210.6 mJ/mg x 284.49 g/mol =59913.59 J/mol
⎟⎟⎠
⎞⎜⎜⎝
⎛−
ΗΔ=−=
TTRxx Af
BA11)1ln(ln
0
,
ln xA = ⎟⎠⎞
⎜⎝⎛ −
KKKmolJmolJ
70.3411
97.3411
./314.8/59.59913
xA = e-0.0167
xA = 98.35 mole % purity

APPENDIX 12: Calculation of purity determination using DSC.
Sample: 6-Gingerol, HPLC ∼ 98%
T0 represents the theoretical melting point of the pure substance [72]
Tm = T represent the melting point of impure sample (K) from DSC thermogram
Af ,ΗΔ represents the enthalpy of fusion (J/mol)
R represents gas constant = 8.314 J/mol.K
xA = mole % purity of sample
xB = mole % impurity of sample
a) Scanning rate: 50.000 ºC/min
T0 = 303.15 K
T = 28.930 °C = 302.080 K
Af ,ΗΔ = 50.6 mJ/mg x 294 g/mol = 14876.4 J/mol
⎟⎟⎠
⎞⎜⎜⎝
⎛−
ΗΔ=−=
TTRxx Af
BA11)1ln(ln
0
,
ln xA = ⎟⎠⎞
⎜⎝⎛ −
KKKmolJmolJ
08.3021
15.3031
./314.8/4.14876
=1789.32(0.0032987-0.0033104)
=-0.020935044
xA = e-0.020935044
=0.979282573
xA = 97.93 mole % purity
b) Glycerol: 50.000 ºC/min
T0 = 303.15 K
T = 18.141 °C = 291.291 K
Af ,ΗΔ = 210.6 mJ/mg x 284.49 g/mol =59913.59 J/mol
⎟⎟⎠
⎞⎜⎜⎝
⎛−
ΗΔ=−=
TTRxx Af
BA11)1ln(ln
0
,
ln xA = ⎟⎠⎞
⎜⎝⎛ −
KKKmolJmolJ
70.3411
97.3411
./314.8/59.59913

xA = e-0.0167
xA = 98.35 mole % purity
area of the curve= mW *C = mJ/s * C = mJ *C/s * 1/Scanrate * 1/mass =AH = mJ/mg