Embed Size (px)
Citation preview

High School Graduate Outcomes Report
An Analysis of Postsecondary Enrollment and Degree Completion of Georgia High School Graduates
Hannah Page
July 2016

i
Executive Summary
This report serves as a follow-up to the “Georgia Students’ High School to College
Transition” report published by GOSA in 2009, which presents college enrollment by
school system and investigates the relationship between college enrollment as well as
student-level factors. This report goes beyond the previous report by adding a layer of
analysis using newly available data from Georgia’s Academic and Workforce Analysis
and Research Data System (GA•AWARDS) and investigates relationships at the high
school level. The report also acts as a companion tool to the High School Graduate
Outcomes Dashboard, launched in January 2016, which allows users to drill down into
the data from high school graduating classes between 2007 and 2014 and investigate
where students enrolled in college, as well as the overall outcome of their enrollment.i
This analysis follows the high school graduating classes of 2008, 2009, and 2010 to
analyze patterns in college enrollment and degree completion. Using data from these
three graduating classes allows for an analysis of degree completion since at least five
years have passed since high school graduation.ii Additionally, the rates of college
enrollment and degree completion are examined by high school to identify differences
between high schools. Figure 1 presents the total number of high school graduates, the
total that enrolled in college within 12 months, and the total who completed a degree
within 5 years.
Figure 1: Outcomes for High School Graduates (2008-2010)
i In this report, “college” refers to colleges, universities, and technical colleges. ii In this report, “degree” refers to certificates, associate’s, bachelor’s, master’s, doctorates, and
professional degrees.
256,646
180,425
(70%)
77,680
(30%)
-
50,000
100,000
150,000
200,000
250,000
300,000
High School
Graduates
Enrolled within 12
Months
Completed
Degree within 5
Years
70%

ii
The figure below presents the race/ethnicity percentages among of high school graduates,
the number who enrolled in college within 12 months, and the number who completed a
degree within 5 years.iii Students who enrolled in college and those who earned degrees
within this cohort are proportionally more likely to be white and Asian and less likely to
be Hispanic and black when compared to the original high school graduate cohort. It is
important to note that the outcomes presented in this paper should not be interpreted as
cause-effect because additional factors outside of the scope of this analysis may play a
role in the relationship.
Figure 1: Demographics of Graduates, Enrollees and Five-Year Degree Completers
Selected findings from the analysis of high school graduates between 2008 and 2010
include:
Enrollment in College within 12 Months
o 70.3% of high school graduates enrolled in college within 12 months.
o Of those high school graduates enrolling, 86.1% of students elected in-
state colleges.
o Of the students enrolling in colleges outside of Georgia, 57.1% enrolled
in the neighboring states of Alabama, South Carolina, Tennessee,
Florida, and North Carolina.
o High schools with higher participation rates on the SAT/ACT and AP
tended to have higher enrollment rates, as do high schools with higher
average three-year high school graduation rate (2008-2010).
o High schools with high eligibility rates for free or reduced-price lunch
(FRL) tended to have lower college enrollment rates.
Degree Completion
o Only 30.3% of the students in this study completed a certificate or degree
within five years.
o Compared to all high school graduates, Hispanic and black students were
proportionally underrepresented among degree completers, while white
and Asian students were proportionally overrepresented.
iii Degree completers waiting more than twelve months after high school graduation to enroll in
college are included in the enrollment group in Figure 1.
0% 10% 20% 30% 40% 50% 60% 70% 80% 90% 100%
Degree Completers within Five Years
Enrolled within 12 Months
High School Graduates (2008-2010) White
Black
Hispanic
Asian
Other

iii
o 52.7% of high school graduates were eligible for FRL, but only 22.6% of
degree completers five years later were FRL-eligible.
Figure 3: Graduates, Enrollees and Five-Year Degree Completers by FRL Status
o 18.2% of students who require remediation in math and English at
Georgia public colleges completed a degree within five years, compared
to 45.0% of students who did not require remediation.
o High schools with higher FRL-eligibility rates tended to have lower
degree completion rates.
o High schools with high AP exam participation rates and high school
graduation rates tended to have higher degree completion rates.
22.6
30.8
52.7
77.4
69.2
47.3
0 20 40 60 80 100
Degree Completers within Five Years
Enrolled within 12 Months
High School Graduates (2008-2010)
FRL
Not FRL
%

iv
Contents
EXECUTIVE SUMMARY ............................................................................................................. I
TABLE OF TABLES AND FIGURES ......................................................................................... V
TABLE OF ABBREVIATIONS ................................................................................................. VI
INTRODUCTION ...........................................................................................................................7
DATA AND METHODOLOGY ....................................................................................................7
HIGH SCHOOL GRADUATE COHORT DEMOGRAPHICS .................................................8
STATEWIDE COLLEGE ENROLLMENT ................................................................................9
PATTERNS AND OUTCOMES IN GEORGIA’S COLLEGE ENROLLMENT BY HIGH
SCHOOL ........................................................................................................................................ 11
Geographic Patterns ................................................................................................. 12
College Enrollment and Other Characteristics ......................................................... 17
STATEWIDE DEGREE COMPLETION RATES .................................................................... 22
PATTERNS IN HIGH SCHOOL RATES OF CERTIFICATE AND DEGREE
COMPLETION ............................................................................................................................. 24
Relationship with Other Characteristics ................................................................... 28
Comparison of Enrollment Rates and Degree Completion Rates ............................ 31
CONCLUSION .............................................................................................................................. 32
APPENDICES ............................................................................................................................... 34
Appendix A. High School Outcomes Calculation Guide ......................................... 34
Appendix B: High School Code Changes ................................................................ 36
Appendix C: Degree Ranking .................................................................................. 37

v
Table of Tables and Figures
Figure 1: Outcomes for High School Graduates (2008-2010) ............................................ i Figure 2: Demographics of Graduates, Enrollees and Five-Year Degree Completers...... ii Figure 3: Graduates, Enrollees and Five-Year Degree Completers by FRL Status .......... iii Figure 4: Georgia's High School Graduates by High School Location (2008-2010) .......... Table 1: Demographics of High School Graduates Enrolling in Colleges within 12
Months ................................................................................................................................ 9 Figure 5: 2008-2010 High School Graduates Enrolling in College within 12 Months .... 10 Table 2: College Enrollment Rate Summary Statistics ..................................................... 11 Figure 6: Density Plot of College Enrollment Rates ........................................................ 11 Table 3: Top In-State and Out-of-State Institutions by Enrollment .................................. 12 Table 4: College Enrollment by Out-of-State and In-State ............................................... 12 Figure 7: In-State Enrollment by College Type and Size ................................................. 13 Figure 8: Out-of-State Enrollment .................................................................................... 14 Table 5: Summary Statistics for District Enrollment Rates .............................................. 15 Figure 9: Map of District Enrollment Rates ..................................................................... 16 Table 6: Summary Statistics of Percentage of Graduates Eligible for FRL by High School
.......................................................................................................................................... 17 Figure 10: College Enrollment Rate by Free and Reduced-Price Lunch Population ...... 18 Table 7: ACT/SAT Participation Rates by High School ................................................... 19 Figure 11: High School College Enrollment by ACT/SAT Participation ......................... 19 Table 8: AP Exam Participation Rates by High School ................................................... 20 Figure 12: College Enrollment by AP Exam Participation .............................................. 20 Table 9: High School Graduation Rate Summary Statistics (2008-2010) ........................ 21 Figure 13: College Enrollment Rates and Average High School Graduation Rates........ 21 Table 10: Demographics of High School Graduates and Five Year Degree Completers 22 Figure 14: Highest Degrees by Type Earned within Five Years ...................................... 23 Figure 15: Degree Completion by Learning Support ....................................................... 23 Table 11: Degree Completion by High School Summary Statistics .................................. 24 Figure 16: Density Plot of High School Degree Completion Rates ................................ 24 Table 12: Summary Statistics for District Enrollment Percentages ................................. 25 Figure 17: Map of Degree Completion Rates by District ................................................. 26 Figure 18: Five-Year Degree Completers by State .......................................................... 27 Figure 19: Degree Completion Rates by Free and Reduced-Price Lunch ....................... 28 Figure 20: Degree Completion Rates by AP Exam Participation .................................... 29 Figure 21: Average High School Graduation Rates by Degree Completion .................... 30 Figure 22: College Enrollment by Degree Completion Rates .......................................... 31 Figure 23: Demographics of Graduates, Enrollees and Five-Year Degree Completers .. 32 Figure 24: Graduates, Enrollees and Five-Year Degree Completers by FRL Status....... 33 Table 13: Degree/Certificate Ranking .............................................................................. 35 Table 14: High School Code Changes .............................................................................. 36

vi
Table of Abbreviations
ACT American College
Test
GICA Georgia Independent
College Association
AP Advanced Placement GOSA Governor’s Office of
Student Achievement
APS Atlanta Public
Schools
LEP Limited English
Proficiency
FRL Free and Reduced-
Price Lunch
NSC National Student
Clearinghouse
GA•AWARDS Georgia’s Academic
and Workforce
Analysis and
Research Data
System
TCSG Technical College System
of Georgia
GaDOE Georgia Department
of Education
USG University System of
Georgia

High School Graduate Outcomes
7
Introduction
Building on GOSA’s 2009 Post-Secondary Enrollment report, this analysis explores the
relationships between student and high school characteristics and college enrollment and
degree completion.1 It follows the high school graduate cohorts of 2008, 2009, and 2010
with the overall goal of exploring the following questions:
Are certain groups of students who graduate more likely to enroll in college
within 12 months or earn a certificate or degree within 5 years?
What high school characteristics are associated with college enrollment and
degree completion?
This report also serves as a companion to GOSA’s High School Graduate Outcomes
Dashboard and employs the same business rules as used in the dashboard.2
This report investigates how individual student characteristics, such as gender,
race/ethnicity, and disability status, are related to college enrollment and degree
completion. It also investigates how high school characteristics, such as the percentage
of students taking Advanced Placement (AP) exams and the average graduation rate, are
related to college enrollment and degree completion. Finally, geographic patterns are
analyzed at the district, state, and national level. It is important to note that the outcomes
presented in this paper should not be interpreted as cause-effect because additional
factors outside of the scope of this analysis may play a role in the relationship.
The report is divided into five parts. The first section describes the data used in this
report, followed by a second section that has a discussion of composition of the high
school graduate cohort. The third section presents information on high school graduates
enrolling in college within twelve months, and the fourth focuses on those students who
earned degree within five years of high school graduation. The report concludes with a
summary of findings and avenues for further research.
Data and Methodology
This report utilizes data from Georgia’s longitudinal data system, GA•AWARDS, which
applies a matching algorithm that links records from participating agencies across
multiple years. Using these matched data, this report analyzes the college enrollment and
degree attainment rates for students who graduated from high school during the 2007-
2008, 2008-2009, and 2009-2010 school years.3 Using data from these three cohorts
allows for an analysis of degree completion since at least five years have passed since
high school graduation.
1 In this report, “college” refers to colleges, universities, and technical colleges. “Degree” refers
to certificates, associate’s, bachelor’s, master’s, doctorates, and professional degrees. 2 For more information on the calculations used in the Dashboard, click here. 3 Detailed information about the treatment of duplicate enrollments is located in the calculation
guide in Appendix A. During the three-year period, at least nine high schools within districts
changed school codes while retaining the same school name. Please refer to Appendix B for an
explanation and table of all high schools impacted by the school code changes.

High School Graduate Outcomes
8
This report matches all of Georgia’s public high school graduates in this cohort with
college enrollment and degree attainment records using a unique identifier called the
GA•AWARDS ID. The data also include demographic information, including gender,
race/ethnicity, disability status, limited English proficiency (LEP), and eligibility for free
or reduced-price lunch (FRL).4 This report presents subgroup information as descriptive
information only.
High School Graduate Cohort Demographics
Over a quarter of a million students make up the aggregated high school graduating
classes during the three years. These high school graduates represent all of Georgia’s city
and county districts, as well as state charter schools active during these years.5 These
students graduated from 414 high schools across the state of Georgia, ranging from
combined class sizes of 10 in DeKalb County’s Destiny Academy of Excellence and
Quitman County High School to 2,265 in Gwinnett County’s Brookwood High School.6
When the three years of high school
graduating classes are combined, female
graduates outnumbered male graduates by
more than five percentage points (52.5%
compared to 47.5%). More than a third
(36.6%) of the graduates were eligible for
free and reduced-priced lunches. A third of
the high school graduates were black, and
more than half are white.
Figure 3 shows a map of the graduates by
high school and size of the combined
graduating classes. The map shows a
clustering of high schools in Atlanta,
Augusta, Columbus, Macon, and
Savannah. Although high schools are
clustered around the metro Atlanta area,
the majority (56.0%) of high school
graduates came from high schools located
outside of the metro Atlanta area. 7
4 For all of these groupings, the data represent the student’s graduating year. 5 Eleventh and twelfth graders from Clay County attend high school in Randolph County. 6 High school graduating classes with fewer than 10 total students were excluded in this analysis. 7 The metro area is defined by the Atlanta Regional Commission as the ten-county metropolitan
area (http://www.atlantaregional.com/about-us/the-region). In addition to these districts, the
following metro area city school systems are included: Atlanta Public Schools (APS), Buford City,
Decatur City, and Marietta City Schools.
Figure 4: Georgia's High School Graduates by High
School Location (2008-2010)

High School Graduate Outcomes
9
Statewide College Enrollment
Using college enrollment data from GA•AWARDS, GOSA determined whether students
enrolled in colleges within the Technical College System of Georgia (TCSG) or the
University System of Georgia (USG), private in-state schools, or out-of-state schools
within twelve months of high school graduation.8 The table below presents the
demographics of these enrolling students. Compared to the high school graduates,
students who are female, Asian, white, and live in the metro-Atlanta area were
proportionally more likely to enroll in college within 12 months, while black students,
Hispanic students, and students who qualified for FRL and LEP status were
proportionally less likely to enroll. It should be noted that these data are descriptive in
nature and are used to summarize the sample of students.
Table 1: Demographics of High School Graduates Enrolling in Colleges within 12
Months
Demographic Indicator High School Graduating Classes
(n=256,646) Enrollees in College
(n= 180,425)
Female
Male
52.5%
47.5%
55.5%
45.5%
Asian 3.5% 4.0%
Black 35.5% 34.0%
Hispanic 6.0% 4.1%
Other 2.3% 2.2%
White 52.7% 55.7%
Free and Reduced-Price Lunch 36.6% 30.8%
Limited English Proficiency 1.4% 0.7%
Students with Disabilities 5.1% 3.8%
Metro-Atlanta 44.0% 45.6%
8 Please refer to the calculation guide for information on how GOSA treated students with multiple
enrollments during the year following high school graduation.

High School Graduate Outcomes
10
The figure below presents the percentage of high school graduates enrolled by type of
college, along with those students who did not enroll in any college during this time
period. The plurality (45%) enrolled in USG institutions, followed by 10 % each
enrolling in out-of-state and TCSG institutions. Five percent of students enrolled in
private, in-state institutions. Of enrolled students, the majority (86%) enrolled in
programs within the state of Georgia.
Figure 5: 2008-2010 High School Graduates Enrolling in College within 12 Months
45%
10%5%
10%
30%
USG
TCSG
Private, in-state
Out-of-state
Not enrolling

High School Graduate Outcomes
11
Patterns and Outcomes in Georgia’s College Enrollment by High School
The following section presents an analysis of the college enrollment rate calculated at the
high school level, followed by an analysis of geographic patterns and student
characteristics.
To calculate the enrollment rate by high school, students from each graduating high
school class enrolling in college within 12 months were divided by the total number of
high school graduates.9 The table below presents the summary statistics for the college
enrollment rate at the high school level. Within an average high school, 66.7% of high
school graduates enrolled in a college within twelve months. This rate ranged from
17.1% at Jackson County’s Regional Evening Alternative School to 94.0% at Richmond
County’s Davidson Magnet School. The middle 50% of schools had enrollment rates
between 60.6% and 74.6%, as presented in in the figure below. Many of the high schools
with lower enrollment rates tended to be from non-traditional schools, including
alternative and evening schools, while higher performers were often more selective
magnet schools.
Table 2: College Enrollment Rate Summary Statistics
Figure 6: Density Plot of College Enrollment Rates
9 Full calculation information for the enrollment percentage available in Appendix A.
Min Average Max Standard Deviation
Enrollment Rate 17.1 66.7 94.0 12.5

High School Graduate Outcomes
12
Geographic Patterns
Utilizing the 12-month enrollment data, the table below presents the top enrolling in-state
and out-of-state colleges and universities. All of the top ten in-state institutions were
USG colleges and universities, and half were located within the metro Atlanta area. For
the top enrolling out-of-state institutions, half were located in Alabama and the fifth
highest enrolling institution, the University of Phoenix, offers online courses and may
include students staying in Georgia.
Table 3: Top In-State and Out-of-State Institutions by Enrollment
Students who elect to stay within the state differ from those attending an out-of-state
institution. A greater percentage of students enrolling out-of-state were male, black, or
from the metro-Atlanta area, while a smaller percentage of out-of-state enrollees were
white or eligible for FRL in high school (see the table below).
Table 4: College Enrollment by Out-of-State and In-State
Demographic Indicator In-State Enrollment
(n=155,397)
Out-of-State Enrollment
(n=25,028)
Female
Male
56.2%
43.8%
51.4%
48.6%
Asian 4.2% 2.9%
Black 32.5% 43.6%
Hispanic 4.3% 2.5%
Other 2.2% 2.3%
White 56.8% 48.7%
Free and Reduced-Price Lunch 31.1% 28.9%
Limited English Proficiency 0.8% 0.5%
Students with Disabilities 3.9% 3.0%
Metro-Atlanta 42.9% 62.5%
Rank In-State institutions Out-of-State institutions
1 University of Georgia Auburn University (AL)
2 Georgia Perimeter College University of Alabama (AL)
3 Georgia Southern University Jacksonville State University (AL)
4 Georgia State University Alabama State University (AL)
5 Kennesaw State University University Of Phoenix (AZ)
6 Valdosta State University Tuskegee University (AL)
7 Gainesville State College Florida A&M University (FL)
8 University of West Georgia University Of South Carolina (SC)
9 Georgia Institute of Technology Benedict College (SC)
10 Gordon State College University Of Mississippi (MS)

High School Graduate Outcomes
13
The map below displays in-state college enrollment by size and is colored by type of
institution, with green indicating USG institutions, red indicating TCSG, and blue for
private, in-state colleges. Enrollment remains clustered in Atlanta, Augusta, Macon,
Valdosta, and Columbus.
Figure 7: In-State Enrollment by College Type and Size

High School Graduate Outcomes
14
For students who enrolled outside of Georgia, they chose between more than 1,500
colleges and universities in all remaining 49 states.10 In addition to graduates being more
likely to enroll in neighboring states, between 500-999 students also enrolled in colleges
and universities in Arizona, Kentucky, Louisiana, Mississippi, New York, Virginia, and
the District of Columbia.11 Fewer than 30 students enrolled in colleges in Alaska,
Delaware, Maine, Montana, Nevada, North Dakota, South Dakota, and Wyoming (see
map below).
Figure 8: Out-of-State Enrollment
10 Colleges/universities in Puerto Rico and the Virgin Islands enrolled fewer than 10 students
during this time period and are excluded from the map. Colleges in the District of Columbia are
also excluded from the map. 11 The majority of students (69.1%) enrolling in Arizona are enrolled at the University of Phoenix.

High School Graduate Outcomes
15
District Geographic Patterns
Eight districts had enrollments rates over 80%: Chickamauga City, Decatur City, Fayette
County, Lee County, Oconee County, Schley County, Trion City, and Webster County.
Six districts had college enrollment rates that were lower than 55%: Chattahoochee
County, Gordon County, Haralson County, Heard County, Long County, and Stewart
County. When college enrollment rates are compared by district enrollment, large
districts with more than 5,000 graduates in the three years had a slightly higher average
college enrollment rate (71.6%) than those districts with fewer than 100 graduates
(70.0%).
Table 3: Summary Statistics for District Enrollment Rates
Min Average Max Standard Deviation
Enrollment Rate 50.0 68.4 85.6 7.0

High School Graduate Outcomes
16
The map below presents college enrollment rates by district, with those in darker green
with higher enrollment than those in lighter green.12 Districts in the western portions of
middle and south Georgia and the north Metro Atlanta area had higher than average
enrollment rates, while several districts in the northeastern and southeastern region of the
state surrounding Long County had lower enrollment rates.
Figure 9: Map of District Enrollment Rates
12 Equal sized intervals of percentage ranges determine the color bands. Two state charter schools
(Mountain Education Center and CCAT) have graduates in the dataset. However, since these two
schools serve students statewide, they are excluded from this district-level analysis. Note that 11th
and 12th graders from Clay County attend high school and graduate from Randolph County. In
this map, Clay County is assigned the same percentage as Randolph County.

High School Graduate Outcomes
17
College Enrollment and Other Characteristics
The following section compares the high school college enrollment rate to FRL status,
SAT/ACT and AP exam participation, and high school graduation rates to determine how
these characteristics are related to the rate of college enrollment at the high school level.
Free and Reduced-Price Lunch (FRL)
FRL indicators provide a useful proxy for an individual student or family’s income
status.13 When comparing the percentage of the graduating class identified as eligible for
FRL to the college enrollment rate, a negative relationship emerges. In other words, as
the percentage of the FRL-eligible graduates at a high school decreased, the college
enrollment rate increased (see figure below).14
Table 6: Summary Statistics of Percentage of Graduates Eligible for FRL by High School
13 FRL status is reported as of the student’s graduating year. Because these graduation years
occurred before the expansion of the National School Lunch Program’s Community Eligibility
Provision (CEP), the numbers presented here are not affected by the issues discussed in this e-
bulletin. 14 Fayette County’s Evening School and Charter Conservatory (CCAT) do not report any
graduates qualifying for FRL, while all graduates qualify for FRL in nine high schools: Atkinson
County High School, Macon County High School, Quitman County High School, Screven County
High School, Stewart County High School, Talbot County’s Central Elementary High School,
Taliaferro County School, Telfair County High School, and Terrell County High School.
Min Average Max Standard Deviation
Graduates Eligible for FRL (%) 0 44.6 100 24.0

High School Graduate Outcomes
18
Figure 10: College Enrollment Rate by Free and Reduced-Price Lunch Population
Dots above the red line indicate that the schools’ enrollment rate was higher than
predicted based on its FRL-eligibility rate. As seen in the figure above, DeKalb County’s
Early College Academy and Webster County High School are outliers, with a high
percentage of graduates qualifying for FRL and a high college enrollment rate. Webster
County High School, falling into the top right corner, has a higher enrollment rate (84%)
than would be predicted by a population of 96% of graduates eligible for FRL, and the
Early College Academy enrolls 92% of its students in college and more than half (64%)
of its graduates is eligible for FRL. At the bottom of the plot, Jackson County’s Regional
Evening Alternative School enrolls 17% of students in college, and 44% of the graduates
are eligible for FRL. Of high schools with FRL eligibility rates of 90% or more, college
enrollment ranges from 45% (APS’s South Atlanta Law and Social Justice School) to
84% (Webster County High School). The eight high schools with 100% FRL have higher
college enrollment rates than is predicted, aside from Stewart County High School, which
is located just below the trend line.
DeKalb Early College Academy
Regional Evening Alt. School
Stewart County
Webster County
020
40
60
80
10
0
Enro
llmen
t R
ate
0 20 40 60 80 100FRL-Eligibility Rate

High School Graduate Outcomes
19
ACT and SAT Participation Rates
As the rate of high school graduates taking ACT and/or SAT increased, the college
enrollment rate tended to increase as well (see figure below). The three schools with
ACT/SAT participation rates above 90% also had high enrollment rates: Richmond
County’s Davidson Magnet School, Savannah Arts Academy, and Cobb County’s Walton
High School. The high schools with the lowest SAT/ACT participation rates (less than
3%) are alternative schools: Murray County’s Mountain Creek Academy School, Berrien
County’s Academy Performance Learning Center, and Jackson County’s Regional
Evening Alternative School. The nature of the population and programming at alternative
schools may contribute to lower rates of SAT and ACT taking. Notably, nearly 80
percent (77.8%) of students at Atlanta Public School’s School of Technology at Carver
took either the SAT or the ACT, yet only 53.3% of students enrolled in college within a
year.
Table 4: ACT/SAT Participation Rates by High School
Min Average Max Standard Deviation
ACT/SAT Participation Rate 0.0 56.9 92.5 16.4
Figure 11: High School College Enrollment by ACT/SAT Participation
Berrien Academy
Savannah ArtsWalton
Regional Evening Alt. School
Mountain Creek Academy School
Davidson Magnet
School of Technology at Carver
020
40
60
80
10
0
Enro
llmen
t R
ate
0 20 40 60 80 100ACT/SAT Participation Rate

High School Graduate Outcomes
20
AP Exam Participation 15
In the average high school, 22.8% of students took at least one AP exam. Richmond
County’s Davidson Magnet School has the highest exam participation rate at 80.6%, and
29 high schools have no students taking AP exams.
Table 5: AP Exam Participation Rates by High School
Min Average Max Standard Deviation
AP Exam Participation Rate 0.0 22.8 80.6 15.1
A study by College Board found that participation in AP courses positively correlates
with student achievement, college readiness, and college completion.16 The following
plot shows that a similar relationship exists in Georgia between AP exam participation
and rates of college enrollment; as AP exam participation increased, the college
enrollment rate also increased. Ware Magnet School and DeKalb Early College Academy
emerge as outliers, with low or no AP participation but high college enrollment rates. In
contrast, Cobb County’s Osborne High School and DeKalb County’s Cross Keys High
School had lower-than-expected college enrollment rates based on their AP exam
participation rates.
Figure 12: College Enrollment by AP Exam Participation
15 This study also examined the relationship between AP course enrollment and college
enrollment. Only three percent of students who took an AP course did not take the associated
exam. Similar patterns were found. As a result, the AP course information is not presented here. 16 Are AP Students More Likely to Graduate from College on Time? College Board Research
Report Mattern, Marini, Shaw, 2013.
Osborne High School
Cross Keys High School
DeKalb Early College Academy
Henry County Evening Academy
Regional Evening Alt. School
Ware Magnet School
020
40
60
80
10
0
Enro
llmen
t R
ate
0 20 40 60 80 100AP Test Participation Rate
High School Graduate Outcomes
21
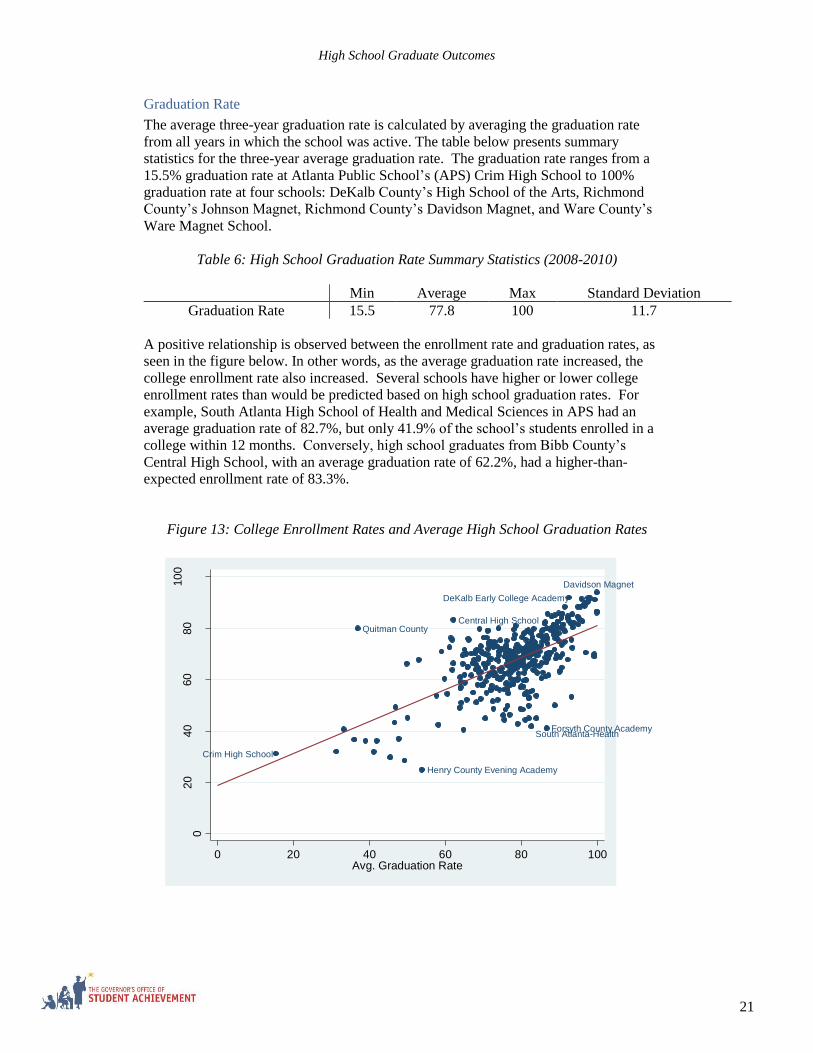
Graduation Rate
The average three-year graduation rate is calculated by averaging the graduation rate
from all years in which the school was active. The table below presents summary
statistics for the three-year average graduation rate. The graduation rate ranges from a
15.5% graduation rate at Atlanta Public School’s (APS) Crim High School to 100%
graduation rate at four schools: DeKalb County’s High School of the Arts, Richmond
County’s Johnson Magnet, Richmond County’s Davidson Magnet, and Ware County’s
Ware Magnet School.
Table 6: High School Graduation Rate Summary Statistics (2008-2010)
Min Average Max Standard Deviation
Graduation Rate 15.5 77.8 100 11.7
A positive relationship is observed between the enrollment rate and graduation rates, as
seen in the figure below. In other words, as the average graduation rate increased, the
college enrollment rate also increased. Several schools have higher or lower college
enrollment rates than would be predicted based on high school graduation rates. For
example, South Atlanta High School of Health and Medical Sciences in APS had an
average graduation rate of 82.7%, but only 41.9% of the school’s students enrolled in a
college within 12 months. Conversely, high school graduates from Bibb County’s
Central High School, with an average graduation rate of 62.2%, had a higher-than-
expected enrollment rate of 83.3%.
Figure 13: College Enrollment Rates and Average High School Graduation Rates
Central High School
DeKalb Early College Academy
Forsyth County Academy
Henry County Evening Academy
Quitman County
Davidson Magnet
South Atlanta-Health
Crim High School
020
40
60
80
10
0
Enro
llmen
t R
ate
0 20 40 60 80 100Avg. Graduation Rate

High School Graduate Outcomes
22
Statewide Degree Completion Rates
Using the degree data stored in GA•AWARDS, GOSA matched students in the high
school graduate cohort to any degrees they earned within five years of high school
graduation. For the purposes of this report, the degree counted is the highest credential
earned within five years of graduation. 17 The degree completion rate is calculated by
dividing the number of students receiving a degree within five years by the total number
of high school graduates. The degree completer cohort may not be composed exclusively
of the enrollment cohort discussed previously, as it could include students waiting to
enroll in college for more than a year after high school graduation. Please refer to
Appendix A for additional information.
Of high school graduates from 2008-2010, only one in three (30.3%) students completed
a degree within five years of high school graduation. Compared to all high school
graduates, female students, Asian students, white students, and students from the metro-
Atlanta area were proportionally overrepresented among degree completers (see Table
10). In contrast, black students, Hispanic students, students who were eligible for FRL in
high school, students who were identified as limited English proficient, and students with
disabilities were proportionally underrepresented.
Table 7: Demographics of High School Graduates and Five Year Degree Completers
Demographic Indicator High School Graduating
Classes 2008-2010
(n=256,426)
Degree Completers
within Five Years
(n= 77,680)
Female
Male
52.5%
47.5%
61.2%
38.8%
Asian 3.5% 5.4%
Black 35.5% 24.8%
White 52.7% 64.0%
Hispanic 6.0% 3.9%
Other 2.3% 2.0%
Free and Reduced Price Lunch 52.7% 22.6%
Limited English Proficiency 1.4% 0.7%
Students with Disabilities 5.1% 2.5%
Metro Atlanta 44.0% 48.8%
17 Please refer to Appendix C for an explanation of the mapping of specific degree types to degree
categories.

High School Graduate Outcomes
23
The pie graph below summarizes the highest degrees earned by the cohort. Degree types
range from certificates to graduate degrees. Bachelor’s degrees represent the majority of
degrees earned (70%) within five years of high school graduation, followed by
Associate’s degrees (20%).
Figure 14: Highest Degrees by Type Earned within Five Years
Learning Support
National research finds that students taking remedial courses (also known as learning
support) are less likely to earn degrees than those who do not require remediation both
nationally and within Georgia.18 Using learning support data from GA•AWARDS, GOSA
tracked the outcomes of students enrolled in TCSG and USG institutions who were
enrolled in math and English learning support at any time during the five years following
high school graduation. As seen in the figure below, students who had not enrolled in
math or English remedial support had degree completion rates of 45.0%, compared to
18.2% of students who had enrolled in either math or English remedial courses.
Figure 15: Degree Completion by Learning Support
18 Complete College America. Transform Remediation: The Co-Requisite Model (2010).
Complete College Georgia. Complete College Georgia: Georgia Higher Education Plan 2012
(2012).
7%
20%
70%
1% 2%
Certificate
Associate's
Bachelor's
Master's or Higher
Other Credential
45.0%
18.2%
0.0%
10.0%
20.0%
30.0%
40.0%
50.0%
Students Not Enrolled in
Learning Support
Students Enrolled in
Learning Support
Degree Completion Rate

High School Graduate Outcomes
24
Patterns in High School Rates of Certificate and Degree Completion
In addition to college enrollment rates, GOSA calculated degree completion rates by high
school to determine the percentage of high school graduates who successfully completed
credentials or degrees within five years.
When all high schools are compared, an average of 26.5% of students within a given high
school graduating class complete a degree within five years.19 Degree completion rates
ranged from 0% at DeKalb County’s Destiny Academy of Excellence Charter School and
Quitman County High School to 64% at DeKalb County’s Early College Academy. The
density plot below shows the distribution of degree completion rates by high schools, with
the middle 50% falling between 19.5% and 32.1%.
Table 8: Degree Completion by High School Summary Statistics
Min Average Max Standard Deviation
Enrollment 0.0 26.5 64.0 11.3
Figure 16: Density Plot of High School Degree Completion Rates
19 High school classes with fewer than 10 graduates are excluded from this analysis.

High School Graduate Outcomes
25
District Geographic Patterns
In three districts, more than 45% of graduates completed a degree within five years:
Fayette County, Oconee County, and Schley County, while less than 15% of graduates
received degrees in Chattahoochee County, Quitman County, and Twiggs County. When
degree completion rates are compared by district enrollment, large districts with more
than 5,000 graduates in the three years had a higher average degree completion rate
(31.6%) than districts with fewer than 100 graduates (22.0%), even though these two
groups have similar average enrollment rates.
Table 9: Summary Statistics for District Enrollment Percentages
Min Average Max Standard Deviation
Enrollment 0 27.6 47.4 6.8

High School Graduate Outcomes
26
The following map presents degree completion rates by district, with those in darker
shades having higher degree completion rates than those in lighter shades.20 Districts
surrounding metro Atlanta had higher than average enrollment rates, while districts in the
northeastern and southeastern region of the state had lower enrollment rates.
Figure 17: Map of Degree Completion Rates by District
20 Equal sized intervals of percentage ranges determine the color bands. Two state charter schools
(Mountain Education Center and CCAT) have graduates in the dataset. However, since these two
schools serve students statewide, they are excluded from this district-level analysis. Note that 11th
and 12th graders from Clay County attend high school and graduate from Randolph County. In
this map, Clay County is assigned the same percentage as Randolph County.

High School Graduate Outcomes
27
Out-of-State Degree Completion
As shown in the map below, of all out-of-state degree completers, Alabama had the most
high school graduates complete degrees out of state, followed by South Carolina. Ten or
fewer students received awards in the following states: Alaska, Delaware, Montana,
Nebraska, Nevada, North Dakota, and Puerto Rico. Although high school graduates
initially enrolled in colleges and universities in South Dakota and the Virgin Islands, no
degrees were completed in either state/territory.21
Figure 18: Five-Year Degree Completers by State
21 The District of Columbia, Puerto Rico, and the Virgin Islands are not portrayed on this map.

High School Graduate Outcomes
28
Relationship with Other Characteristics
The following section compares the degree completion rate with the following high
school characteristics: percentage of graduates eligible for FRL, AP exam participation,
and average high school graduation rates. These patterns are similar to the pattern found
between these characteristics and the enrollment rates, which is expected given the strong
correlation between the enrollment and degree completion rates.22
FRL Population
Similar to enrollment rates, a negative relationship is observed between the degree
completion rate and the percentage of students eligible for FRL (see figure below).
DeKalb Early College Academy again was as an anomaly, with both a high degree
completion rate (64%) and high percentage of FRL students (64%). Several alternative
schools are clustered in the bottom left corner, with degree completion rates under 10%
and FRL populations under 20%.23 Several schools with high FRL populations had
higher degree completion rates than the trend line would suggest. Of particular note are
Atkinson County High School and Macon County High School, which had one-third of
graduates complete a degree despite 100% FRL eligibility.
Figure 19: Degree Completion Rates by Free and Reduced-Price Lunch
22 The correlation coefficient is 0.84 for the two rates. This correlation will be explored in a later
section. 23 Henry County Evening Academy, Forsyth County Academy, Cobb County’s Oakwood Digital
Academy, Mountain Education Center School, Cherokee County’s Polaris Evening School,
Fayette County’s Evening School, and Whitfield County’s Phoenix High School.
Atkinson County
DeKalb Early College Academy
Macon County High School
020
40
60
80
10
0
De
gre
e C
om
ple
tio
n R
ate
0 20 40 60 80 100FRL-Eligibility Rate

High School Graduate Outcomes
29
AP Exam Participation
A positive relationship is also observed between the percentage of high school graduates
taking the AP exam and the percentage of students completing a degree within five years
(see figure below). In the upper left-hand corner, DeKalb Early College Academy
appears as an outlier, with no students taking AP exams, but 64% of graduates obtaining
a degree or credential within five years. Richmond County’s Davidson Magnet School
and Cobb County’s Walton High School, located in the upper right-hand corner, had high
AP test participation rates (>65%) and degree completion rates (>60%). Conversely,
several schools located in the bottom of the figure are underperforming, with low degree
completion rates when compared to their AP exam particpation rates: Cobb County’s
Osborne High School, APS’ Therrell School of Engineering, Math, and Science, and
APS’ South Atlanta School of Computer Animation and Design.
Figure 20: Degree Completion Rates by AP Exam Participation
Therrell-EngineeringSouth Atlanta-Computer Animation
Osborne
Davidson MagnetWaltonDeKalb Early College Academy
020
40
60
80
10
0
De
gre
e C
om
ple
tio
n R
ate
0 20 40 60 80 100AP Test Participation Rate

High School Graduate Outcomes
30
High School Graduation Rate
A positive relationship is observed when high school degree completion rates are
compared to high school graduation rates (see Figure 20). In other words, high schools
with high graduation rates tended to have high degree completion rates as well. Several
schools in the bottom right-hand corner had high graduation rates but low degree
completion rates. For example, Muscogee County’s Early College Academy of
Columbus and Atlanta Public School’s School of Technology at Carver, Early College
High School at Carver, and Tech High School had an average graduation rate of over
90%, but fewer than 25% of students completed a degree within 5 years. Several schools
in the top right corner have high graduation rates and a high degree completion rates:
Cobb County’s Walton High School, DeKalb County’s Early College Academy, and
Richmond County’s Davidson Magnet School.
Figure 21: Average High School Graduation Rates by Degree Completion
Quitman County
Crim High School
Henry County Evening Academy
South Atlanta School of Health and Medical ScienceForsyth County Academy
Central High School
Davidson Magnet
DeKalb Early College Academy
020
40
60
80
10
0
Enro
llmen
t R
ate
0 20 40 60 80 100Avg. Graduation Rate

High School Graduate Outcomes
31
Comparison of Enrollment Rates and Degree Completion Rates
When the enrollment and degree completion rates are compared, a strong positive
relationship is observed between the two rates, as observed in the figure below. Several
schools in the top right-hand corner had higher degree completion rates than expected
based on the enrollment rate. For example, DeKalb Early College Academy, Cobb
County’s Walton High School, and Richmond County’s Davidson Magnet School had
degree completion percentages greater than 60%. APS’s Therrell School of Engineering,
Math, and Science is in the bottom center of the figure, with 61% of the graduating class
enrolled in college or universities, but only 2% obtained a degree within five years.
Similarly, Quitman High School did not have any degree completers, but had 80% of its
high school graduating class enrolled in college.24 DeKalb Alternative Night School had
a degree completion rate that is higher than expected (22%) based on its enrollment rate
(32%).
Figure 22: College Enrollment by Degree Completion Rates
24 Note that Quitman County had only 10 graduates over the three years.
Walton
DeKalb Alt. Night School
DeKalb Early College Academy
Quitman County
Davidson Magnet
Therrell-Engineering
020
40
60
80
10
0
De
gre
e C
om
ple
tio
n R
ate
0 20 40 60 80 100Enrollment Rate

High School Graduate Outcomes
32
Conclusion
This analysis provides information on the transition from high school to college and to
completing a credential or degree. Following the high school graduating classes of 2008,
2009, and 2010, it investigates patterns in enrollment in college and degree completion
based on characteristics of students and their high schools. Using data from these three
graduating classes allows for analysis of degree completion since at least five years have
passed since high school graduation. It is important to note that the outcomes presented in
this paper should not be interpreted as cause-effect because additional factors outside of
the scope of this analysis may play a role in the relationship.
The figure below presents the race/ethnicity percentages among of high school graduates,
the number who enrolled in college within 12 months, and the number who completed a
degree within 5 years.25 Students who enrolled in college and those who earned degrees
within this cohort are proportionally more likely to be white and Asian and less likely to
be Hispanic and black when compared to the original high school graduate cohort.
Figure 23: Demographics of Graduates, Enrollees and Five-Year Degree Completers
Selected findings from the analysis of high school graduates between 2008 and 2010
include:
Enrollment in College within 12 Months
o 70.3% of high school graduates enrolled in college within twelve months
of high school graduation.
o Of those high school graduates enrolling, 86% of students selected in-
state colleges.
o Of the students enrolling in colleges outside of Georgia, a majority
(57%) enrolled in the neighboring states of Alabama, South Carolina,
Tennessee, Florida, and North Carolina.
o High schools with higher participation rates on the SAT/ACT and AP
tended to have higher enrollment rates, as do high schools with higher
average three-year high school graduation rates (2008-2010).
o High schools with high FRL-eligibility rates tended to have lower
college enrollment rates.
25 Degree completers waiting more than twelve months after high school graduation to enroll in
college are included in the enrollment group in Figure 22.
0% 10% 20% 30% 40% 50% 60% 70% 80% 90% 100%
Degree Completers within Five Years
Enrolled within 12 Months
High School Graduates (2008-2010) White
Black
Hispanic
Asian
Other

High School Graduate Outcomes
33
Degree Completion
o Only 30.3% of the students in this study completed a certificate or degree
within five years.
o Compared to all high school graduates, Hispanic and black students were
proportionally underrepresented among degree completers, while white
and Asian students were proportionally overrepresented.
o 52.7% of high school graduates were eligible for FRL, but only 22.6% of
degree completers five years later were FRL-eligible.
Figure 24: Graduates, Enrollees and Five-Year Degree Completers by FRL Status
o 18.2% of students who required remediation in math and English at
Georgia public colleges/universities complete a degree within five years,
compared to 45.0% of students who did not require remediation.
o High schools with higher FRL-eligibility rates tended to have lower
degree completion rates.
o High schools with AP exam participation rates and average high school
graduation rates tended to have higher degree completion rates.
Throughout this analysis, several schools stood out as high-performing outliers, namely
Richmond County’s Davidson Magnet School, DeKalb County’s Early College
Academy, and Ware County’s Ware Magnet School. These schools had enrollment rates
over 86% and degree completion rates over 45%. In the case of DeKalb County’s Early
College Academy, this school had a high enrollment rate (92%), despite a high FRL-
eligibility rate (64%) and low AP exam participation rate (0%).
22.6
30.8
52.7
77.4
69.2
47.3
0 20 40 60 80 100
Degree Completers within Five
Years
Enrolled within 12 Months
High School Graduates (2008-
2010)
FRL
Not FRL
%

High School Graduate Outcomes
34
Appendices
Appendix A. High School Outcomes Calculation Guide
Duplication Rules
High school students with multiple graduations within the same year and high school are
removed; however, multiple graduations across years or schools are retained in this
analysis. For students enrolled in multiple college/universities during the first year after
high school graduation, the report applies the same ranking methodology as the High
School Graduates Outcomes Dashboard.26 No duplicates appear in the five year degree
completers because the degree types are ranked by the logic found in Appendix C.
High School Graduate Cohort
The Georgia Department of Education defines a student as a high school graduate if
he/she is withdrawn with a code for graduation (G) either as a junior or a senior and also
earn one of the following diplomas (B-Both College Prep & Vocational, C-College
Preparatory, G-General Diploma, or V-Vocational) in high school. High schools with
graduating classes with fewer than ten graduates are excluded from this analysis. For a
list of high schools that change school codes in this analysis, see Appendix B.
College Enrollment Calculation
The college enrollment rate is calculated for each high school to determine how many
students enrolled in a college institution within twelve months of high school graduation.
To calculate the overall college enrollment rate by high school, the total high school
graduates from the three years is divided by the total high school graduates.
𝐻𝑖𝑔ℎ 𝑆𝑐ℎ𝑜𝑜𝑙 𝐶𝑜𝑙𝑙𝑒𝑔𝑒 𝐸𝑛𝑟𝑜𝑙𝑙𝑚𝑒𝑛𝑡 𝑅𝑎𝑡𝑒 = 𝑇𝑜𝑡𝑎𝑙 𝐻𝑖𝑔ℎ 𝑆𝑐ℎ𝑜𝑜𝑙 𝐺𝑟𝑎𝑑𝑢𝑎𝑡𝑒𝑠 𝐸𝑛𝑟𝑜𝑙𝑙𝑖𝑛𝑔 𝑤𝑖𝑡ℎ𝑖𝑛 12 𝑚𝑜𝑛𝑡ℎ𝑠
𝑇𝑜𝑡𝑎𝑙 𝐻𝑖𝑔ℎ 𝑆𝑐ℎ𝑜𝑜𝑙 𝐺𝑟𝑎𝑑𝑢𝑎𝑡𝑒𝑠
Out-of-State College Counts
GA•AWARDS receives information on Georgia high school graduates who attend out-
of-state institutions from the National Student Clearinghouse (NSC).27 Any institution
not located within the state of Georgia is considered an out-of-state college.
Percent of Students Taking the ACT and the SAT
The numerator for the SAT/ACT participation rates were the students taking either exam
between 2005 and 2015, and the denominator is the total high school graduating class.
𝐴𝐶𝑇/𝑆𝐴𝑇 𝐸𝑥𝑎𝑚 𝑃𝑎𝑟𝑡𝑖𝑐𝑖𝑝𝑎𝑡𝑖𝑜𝑛 𝑅𝑎𝑡𝑒 = 𝑇𝑜𝑡𝑎𝑙 𝐻𝑖𝑔ℎ 𝑆𝑐ℎ𝑜𝑜𝑙 𝐺𝑟𝑎𝑑𝑢𝑎𝑡𝑒𝑠 𝑇𝑎𝑘𝑖𝑛𝑔 𝑡ℎ𝑒 𝑆𝐴𝑇 𝑎𝑛𝑑 /𝑜𝑟 𝑡ℎ𝑒 𝐴𝐶𝑇
𝑇𝑜𝑡𝑎𝑙 𝐻𝑖𝑔ℎ 𝑆𝑐ℎ𝑜𝑜𝑙 𝐺𝑟𝑎𝑑𝑢𝑎𝑡𝑒𝑠
26 Click here for the calculation guide. 27 NSC also provides information on the private institutions in Georgia that do not provide data to
GA•AWARDS.

High School Graduate Outcomes
35
AP Exam Participation
The numerator for the AP participation rates is the number of students taking at least one
AP exam between 2006 and 2015, and the denominator is the total high school
graduating class. Students count as AP exam participants if they take an AP exam,
regardless of which high school they were enrolled in when they took the test.
𝐴𝑃 𝐸𝑥𝑎𝑚 𝑃𝑎𝑟𝑡𝑖𝑐𝑖𝑝𝑎𝑡𝑖𝑜𝑛 𝑅𝑎𝑡𝑒 = 𝑇𝑜𝑡𝑎𝑙 𝐻𝑖𝑔ℎ 𝑆𝑐ℎ𝑜𝑜𝑙 𝐺𝑟𝑎𝑑𝑢𝑎𝑡𝑒𝑠 𝑇𝑎𝑘𝑖𝑛𝑔 𝑡ℎ𝑒 𝐴𝑃 𝐸𝑥𝑎𝑚
𝑇𝑜𝑡𝑎𝑙 𝐻𝑖𝑔ℎ 𝑆𝑐ℎ𝑜𝑜𝑙 𝐺𝑟𝑎𝑑𝑢𝑎𝑡𝑒𝑠
Degree Completion Calculation
The degree completion rate is calculated for each high school in the three-year cohort to
determine the highest degree that high school graduates obtained within five years. The
highest award was selected by ranking according to the hierarchy below. A full list of
degree types is listed in Appendix C.
Table 10: Degree/Certificate Ranking
Order Category Diploma Type
1 Master’s or
Higher
Post baccalaureate certificate, Masters, PHD, Doctorate,
Professional, Doctor’s degree – professional practice, First
Professional A, Education Specialist
2 Bachelor’s Bachelor’s degree, Bachelors
3 Associate’s Associates, Associate’s Degree, Postsecondary Diploma,
Diploma, Career Associate
4 Certificate Certificate, Less than 1 Year Certificate, Advanced
Certificate, One-year Vocational = Related Certificate
The overall degree completion rate is calculated by dividing the total degree completers
in all cohorts by the total high school graduates.
𝐹𝑖𝑣𝑒 𝑌𝑒𝑎𝑟 𝐷𝑒𝑔𝑟𝑒𝑒 𝐶𝑜𝑚𝑝𝑙𝑒𝑡𝑖𝑜𝑛 𝑅𝑎𝑡𝑒 = 𝑇𝑜𝑡𝑎𝑙 𝐻𝑖𝑔ℎ 𝑆𝑐ℎ𝑜𝑜𝑙 𝐺𝑟𝑎𝑑𝑢𝑎𝑡𝑒𝑠 𝐶𝑜𝑚𝑝𝑙𝑒𝑡𝑖𝑛𝑔 𝐴 𝐷𝑒𝑔𝑟𝑒𝑒/𝐶𝑟𝑒𝑑𝑒𝑛𝑡𝑖𝑎𝑙
𝑇𝑜𝑡𝑎𝑙 𝐻𝑖𝑔ℎ 𝑆𝑐ℎ𝑜𝑜𝑙 𝐺𝑟𝑎𝑑𝑢𝑎𝑡𝑒𝑠
High School Learning Support Calculation
Learning support information is only available for students who enroll in TCSG and USG
institutions. The learning support calculations were completed by identifying all students
enrolled in learning support courses in TCSG and USG institutions. The numerator for
this calculation is all students at a given high school who enrolled in math or English
learning support within TCSG/USG for up to five years after high school graduation, and
the denominator is all students who enrolled at TCSG or USG from that high school
within five years of high school graduation. Note that this definition is slightly different
from the definition employed by the High School Graduate Outcomes Dashboard. To
access that definition, see the Calculation Guide.

High School Graduate Outcomes
36
Appendix B: High School Code Changes
During the matching process used to aggregate the three high school classes, GOSA
identified nine high schools that changed school codes during the three years. In these
cases, the school codes were updated to reflect the most recent school code. For example,
Brooks High School in Brooks County had both school codes 110 and 2050, but all data
were consolidated under the 2050 school code for calculations for this report. The
majority of the school code changes occurred between 2009 and 2010.
Table 11: High School Code Changes
District High School 2008 School
Code
2009 School
Code
2010 School
Code
Brooks County Brooks High School 614110 614110 6142050
Carroll County Open Campus –
Carroll County
622190 622190 622113
CCAT School CCAT School 795 795 7830103
DeKalb County DeKalb School of the
Arts
644400 644400 644410
Forsyth County Forsyth County
Academy
658306 658306 658218
Laurens County West Laurens High
School
687110 6873054 6873054
Miller County Miller County High
School
700201 700201 700210
Mountain Education
Center
Mountain Education
Center
798108 798108 7820108108
Putnam County Putnam County High
School
717276 717114 717114

High School Graduate Outcomes
37
Appendix C: Degree Ranking
Source
System
Order Academic
Program
Level
Degree
Level
Code
Degree Level Report Category
GICA 0 Unknown 99 Undecided / Unknown Unknown
NSC 0 Unknown X N/A Unknown
NSC 1 Undergraduate C Certificate Certificate
TCSG 1 Undergraduate 1 Certificate Certificate
USG 1 Undergraduate C One-year Vocational - Related Certificate Certificate
USG 1 Undergraduate Z Less than 1 Year Certificate Certificate
GICA 2 Undergraduate 3 Associate's degree Associate’s
NSC 2 Graduate D Postsecondary Diploma Associate’s
NSC 2 Undergraduate A Associates Associate’s
TCSG 2 Undergraduate 2 Diploma Associate’s
TCSG 2 Undergraduate 3 Associate's Degree Associate’s
TCSG 2 Undergraduate 4 Diploma Associate’s
USG 2 Undergraduate A Associate Associate’s
USG 2 Undergraduate V Career Associate Associate’s
GICA 3 Undergraduate 5 Bachelor's degree Bachelor’s
NSC 3 Undergraduate B Bachelors Bachelor’s
USG 3 Undergraduate B Bachelors Bachelor’s
GICA 4 Graduate 18 Doctor's degree - professional practice Master’s or Higher
GICA 4 Graduate 6 Post baccalaureate certificate Master’s or Higher
GICA 4 Graduate 7 Master's degree Master’s or Higher
NSC 4 Graduate M Masters Master’s or Higher
NSC 4 Graduate P PHD Master’s or Higher
NSC 4 Professional F Professional Master’s or Higher
USG 4 Graduate D Doctorate Master’s or Higher