Embed Size (px)
Citation preview

.-
NASA Technical Memorandum 100527
,
High Reynolds Number Transonic Tests of an NACA 0012 Airfoil in the Langley 0.3-Meter Transonic Cryogenic Tunnel
Charles L Ladson and Acquilla S. Rill
(PAS&-TI-100527) I I X E RElfBOLDS IiDEBEB Y88-1E571 f 3 A l S C I I C 'IESIS 01 d IOaCB CO1; AIBPOU I1J
r u b m m ( N A S A ) 150 p CSCL O 1 A Unclas IEB I A P G L E Y 0-3-EBIEB I E B Y S G Y I C CBXCGBNXC
G3/02 0130053
DECEMBER 1987
National Aeronautics and Space Administration
Hampton, Virginia 23665 ---
https://ntrs.nasa.gov/search.jsp?R=19880009187 2020-05-14T05:05:09+00:00Z

SUMMARY
Tests were conducted in the two dimensional test section of the Langley 0.3 meter Transonic
Cryogenic Tunnel on an NACA 0012 airfoil to obtain aerodynamic data as a part of the
Advanced Technology Airfoil Test (ATAT) program. The test program covered a Mach number
range of 0.30 to 0.82 and a Reynolds number range of 3.0 x 10' to 45.0 x 10'. The stagnation
pressure was varied between 1.2 and 6.0 atmospheres and the stagnation temperature was varied
between 300 K and 90 K to obtain these test conditions.
Plots of the spanwise variation of drag coefficient as a function of normal force coefficient and
the variation of the basic aerodynamic characteristics with angle of attack are shown. The data
are presented uncorrected for wall interference effects and without analysis. This data adds to
the existing data base to be used for tunnel comparison purposes as well as assessment of wall
interference and correction procedures.
INTRODUCTION
A comprehensive test program has been undertaken in the Langley Research Center 0.3 meter
transonic cryogenic tunnel (0.3-m TCT) to obtain the static aerodynamic characteristics of a
series of two dimensional airfoils at transonic speeds and flight equivalent Reynolds numbers.
This program, known as the Advanced Technology Airfoil Test program (ATAT), was sponsored
by the Langley Aircraft Energy Efficiency Project Office and the Transonic Aerodynamics
Division. A description and status report on this program was first presented in reference 1.
The primary objectives of this program, as stated in this reference, were to provide the U. S.
transport industry the opportunity to test and compare their most advanced airfoils to the latest
I

NASA design at high Reynolds numbers in the same facility and to provide experience in the
design and construction of models for testing in a cryogenic environment as well as testing
techniques unique to this environment. Included in this test program were four series of tests: (1)
Correlation airfoils, (2) Advanced NASA supercritical airfoil, (3) Industry airfoils, and (4)
Foreign technology airfoils.
This report presents results obtained from tests of the NACA 0012 airfoil which was tested as a
part of the Correlation series of airfoils. Tests were conducted at Mach numbers from 0.30 to
about 0.82 at chord Reynolds numbers from 3 x 10' to 45 x 10'. To obtain these conditions, the
stagnation pressure varied from 1.2 to 6.0 atmospheres and the stagnation temperature from 300
K to about 90 K. Model surface pressures, wake survey pressures, and tunnel wall pressures
were obtained during the test program.
Plots and tabulated values of model surface pressure distributions as well as tabulated values of
the integrated force and moment coefficients obtained in this test program are presented in
reference 2. This paper contains plots of the spanwise variation of drag coefficient as a function
of normal force coefficient and the variation of basic aerodynamic coefficients with angle of
attack. Normal force and pitching moment coefficients were obtained from integration of the
surface pressure distributions and the drag coefficient was obtained from integration of the wake
survey data. The data are uncorrected for wall effects and are presented without analysis. In this
format, the data should be useful for tunnel comparison purposes as well as extending the
existing data base for use in evaluating wall interference and correction procedures.
SYMBOLS
All measurements and calculations were made in U.S. Customary Units; however, the
2
L
measurements are presented with the International System of Units (SI) in parentheses.
a
b
C
‘d
‘d,corrl
‘d,corr2
‘d,corrS
Cd,C01T4
‘d,corrS
cm
cn
M
pt
R
Tt
Y
angle of attack,deg
airfoil model span, 8.00 in (20.32 cm)
airfoil model chord, 6.00 in (1 5.24 cm)
section drag coefficient ( c ~ , ~ ~ ~ ~ if valid data exist, otherwise, c ~ , ~ ~ ~ ~ )
section drag force coefficient from integration of wake total head profile for probe located at y/(b/2) = 0.125
section drag force coefficient from integration of wake total head profile for probe located at y/(b/2) = 0.0
section drag force coefficient from integration of wake total head profile for probe located at y/(b/2) = -0.125
section drag force coefficient from integration of wake total head profile for probe located at y/(b/2) = -0.375
section drag force coefficient from integration of wake total head profile for probe located at y/(b/2) = -0.500
section pitching moment coefficient about model 25-percent chord point from integration of model surface pressure coefficients
section normal force coefficient from integration of model surface pressure coefficients
average free stream Mach number
free stream stagnation pressure
Reynolds number based on model chord
free stream stagnation temperature, K
spanwise distance from tunnel centerline, (positive toward right hand side)
APPARATUS .
The test program was conducted in the 8 in by 24 in (20.32 cm by 60.96 cm) two dimensional test
section of the Langley 0.3-meter transonic cryogenic tunnel. This facility is a continuous flow,
3

fan driven, pressure tunnel which uses nitrogen gas as the test medium. The test section is
rectangular in cross section, has solid sidewalls, and slotted top and bottom walls. Two slots are
located in each of these walls with a spacing of 4.0 in (10.16 cm) and a total open area ratio of
0.05. Further details of this tunnel and test section are contained in reference 3. - d
Data were recorded on a shared, remote central data acquisition system. This system is referred
to as the original data acquisition system for the two dimensional test section of the 0.3-m TCT
in reference 3 and further details of the capability of the system are given in this reference.
MODEL
The model tested was a two dimensional model of the NACA 0012 airfoil with a chord of 6.00 in
(15.24 cm) and a span of 8.00 in (20.32 cm). The equation for the ordinates of this airfoil shape
was first presented in reference 4 and the ordinates for this model were obtained from the
computer program of reference 5.
The model was constructed of A286 stain-dss steel which is an acceptable material for cryogenic
test conditions. To locate all pressure instrumentation tubes internally in the model, it was
constructed in two halves, the tubing installed, and then these two halves were bonded together.
By locating the tubes internally, the model surface can be maintained in a very smooth condition
which is required for high Reynolds number testing. One longitudinal row of pressure orifices
was located on each surface of the model near the mid-span location and three spanwise rows
were located on the upper surface. The ordinates for each orifice location are presented in the
tabulated data. An orifice diameter of 0.010 in (0.25 mm) was used for all locations.
.
Upon completion of model construction and after several cryogenic temperature cycles, the model
4

ordinates were measured and compared to the design values. The maximum deviation from
design was found to be 0.003 in (0.076 mm) with most of the model surface being within the
manufacturing tolerance of 0.001 in (0.025 mm).
c
TESTS
The tests of this airfoil covered a Mach number range from 0.30 to 0.82 and a Reynolds number
range of 3.0 x 10' to 45.0 x lo6. To obtain these test conditions, the tunnel stagnation pressure
varied between 1.2 atm and 6.0 atm and the stagnation temperature varied between 300 K and 90
K. Measurements of model surface pressure, wake total head surveys, sidewall pressures at the
wake survey station, tunnel floor and ceiling pressures, and various tunnel parameters were made
during the tests.
For these tests, the wake surveys were made at a station 1.2 model chords downstream of the
model trailing edge. Data were obtained with both free and fixed locations of boundary layer
transition. For the fixed transition tests, data were obtained only at Reynolds numbers of 3.0 x
10' and 9.0 x 10'. The angle of attack range for all tests was from zero degrees to that for drag
divergence. Limited data were also obtained at negative angles of attack as a check for
asymmetry which could result from flow angularity, model inaccuracies, or incorrect angle of
attack setting.
For the fixed transition data, transition strips were located on both the upper and lower surfaces
of the model at the 5-percent chord station. These strips were about 1-percent chord in length
and consisted of #240 carborundum grit applied with an acrylic spray.
5

TEST PROCEDURES
Model Pressures
All model surface and tunnel floor and ceiling pressures were measured using 48-port scanni-
valves connected to high precision variable capacitance type pressure transducers. Three samples
of data, taken at 0.25 second intervals, were recorded for each port. These readings were
averaged during the data reduction process. To provide for lag in the response time of the
pressure tubing and transducer, a delay time was invoked after each port change before the data
were recorded. This delay time varied from 2.0 seconds near the model leading edge where large
changes in pressure occurred between ports to 0.5 seconds for the aft portion of the model.
Wake Pressures
Surveys of the total pressure in the model wake were made using a traversing rake cantilevered
from one of the tunnel sidewalls. This rake contained five individual probes such that a spanwise
survey could also be obtained. The drive mechanism consisted of an electric stepper motor which
was synchronized with the scannivalve system so that the rake would advance one step in distance
with each scannivalve step. For these tests, approximately 75 steps were made as the rake
traversed the model wake region. Tunnel sidewall static pressure data was obtained at the same
tunnel station as the rake probes for use in data reduction. Individual pressure transducers were
connected to each of the probes as well as the sidewall pressure taps to keep response time to a
minimum, For this test program, the survey probes were located approximately 1.1 model chords
downstream of the model trailing edge.
6

Corrections
c
All data and tunnel parameters were corrected for real gas effects by the method of reference 6.
No corrections have been made for wall interference effects on the data presented herein;
however, these corrections have been made for some of this data and the results presented in
reference 7. These corrections reduce the test angle of attack for all conditions and the free
stream Mach number, mainly at supercritical conditions.
PRESENTATION OF RESULTS
The results of this investigation are presented in this paper as plots of integrated force and
moment coefficients obtained from surface pressure distribution data and wake surveys. These
data are presented for reference purposes only and no analysis of the results is presented. An
index to the various figures for both free and fixed transition data follows.
I. Effects of normal force coefficient on the spanwise variation of drag coefficient for various Mach and Reynolds numbers. Transition free.
Mach number Figure
0.30 0.40 0.50 0.60 0.65 0.70 0.74 0.76 0.78 0.80 0.82
7
1 2 3 4 5 6 7 8 9 10 11
II.
111.
IV.
V.
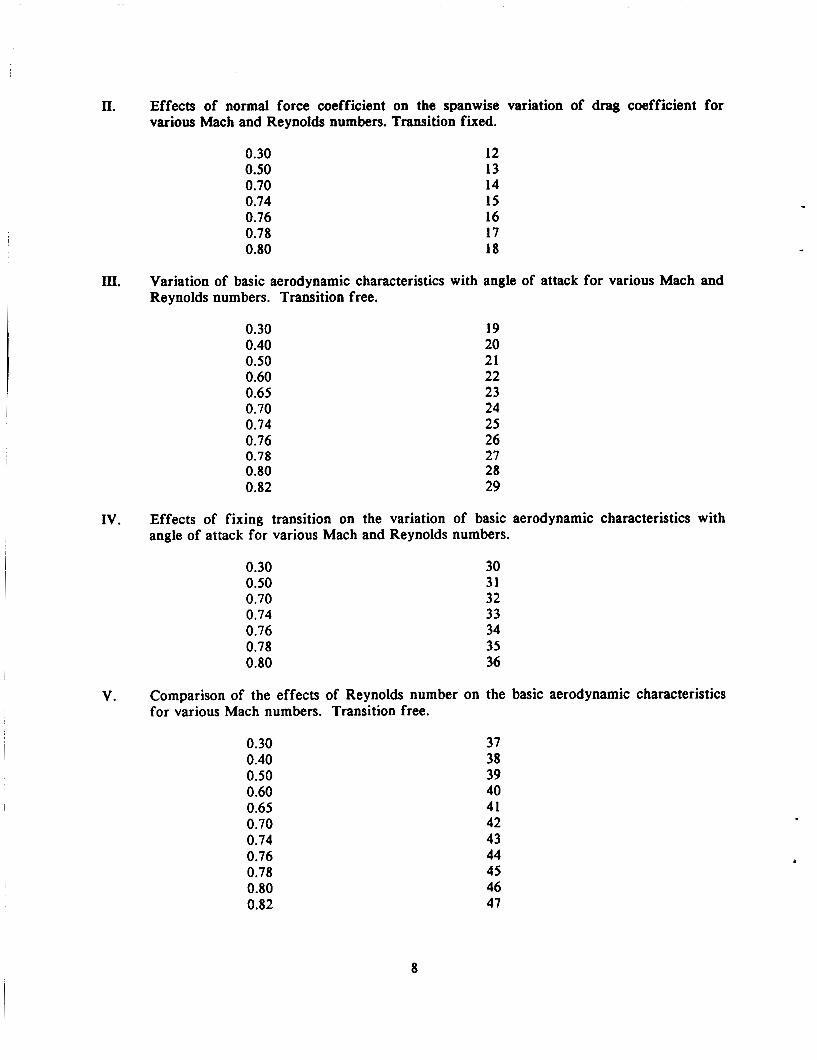
Effects of normal force coefficient on the spanwise variation of drag coefficient for various Mach and Reynolds numbers. Transition fixed.
0.30 0.50 0.70 0.74 0.76 0.78 0.80
12 13 14 15 16 17 18
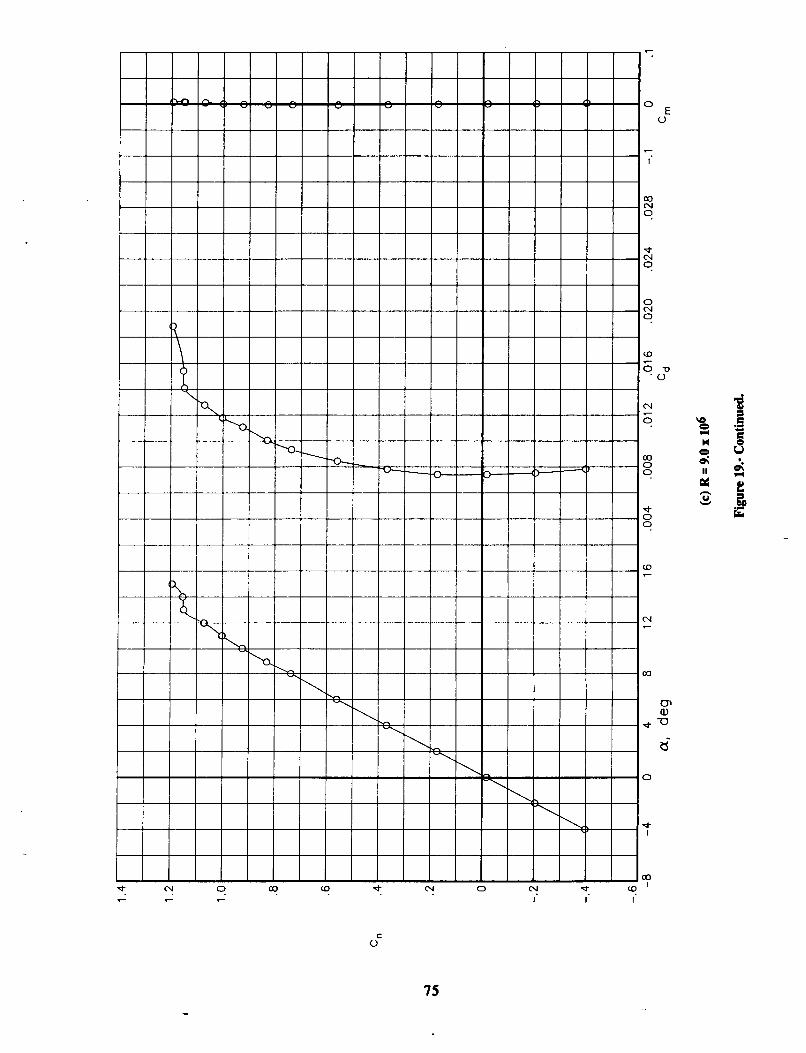
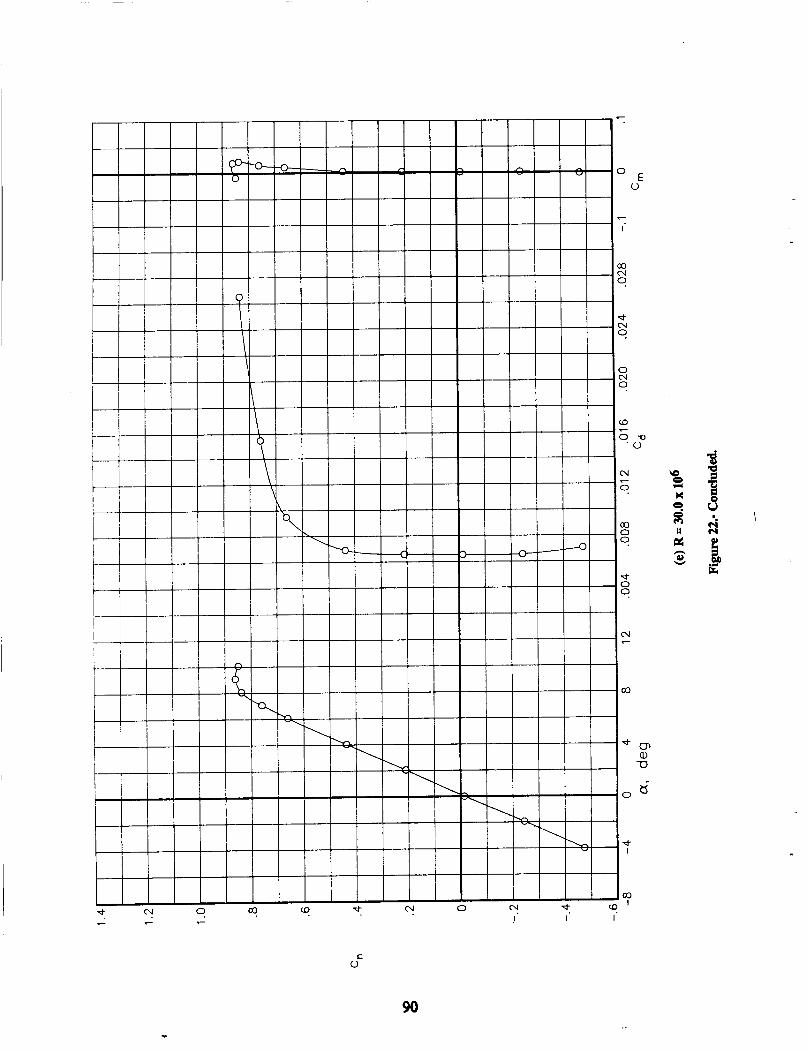
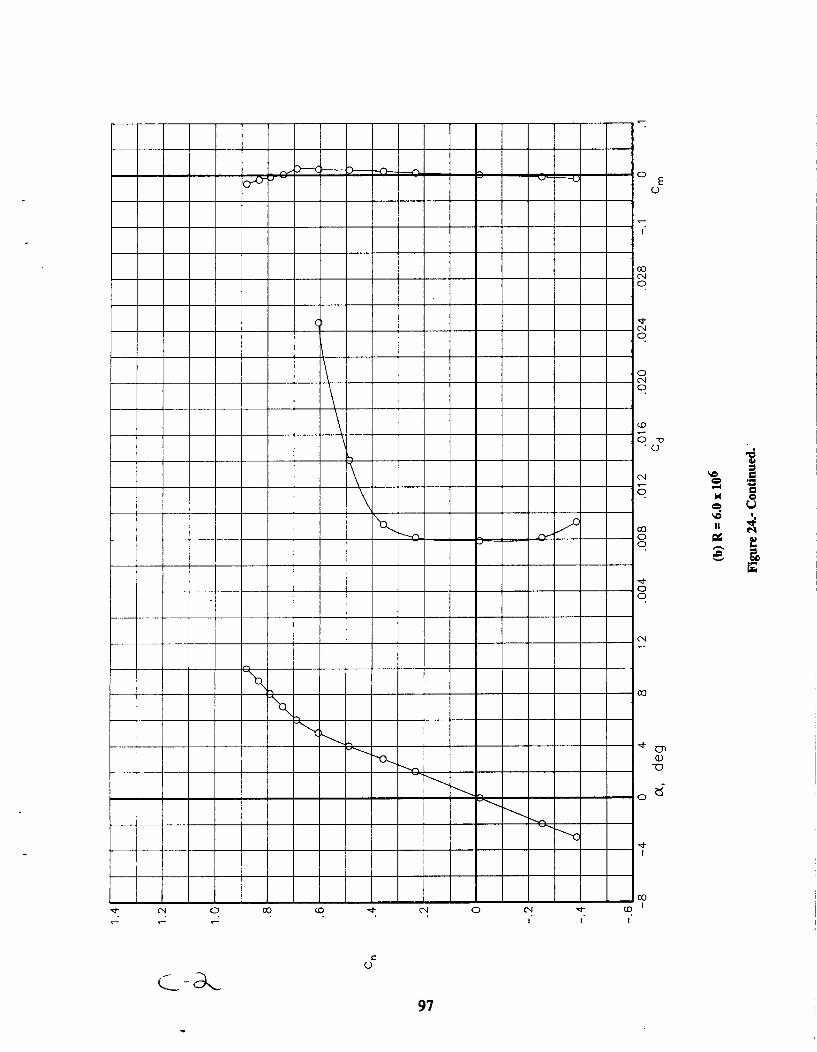
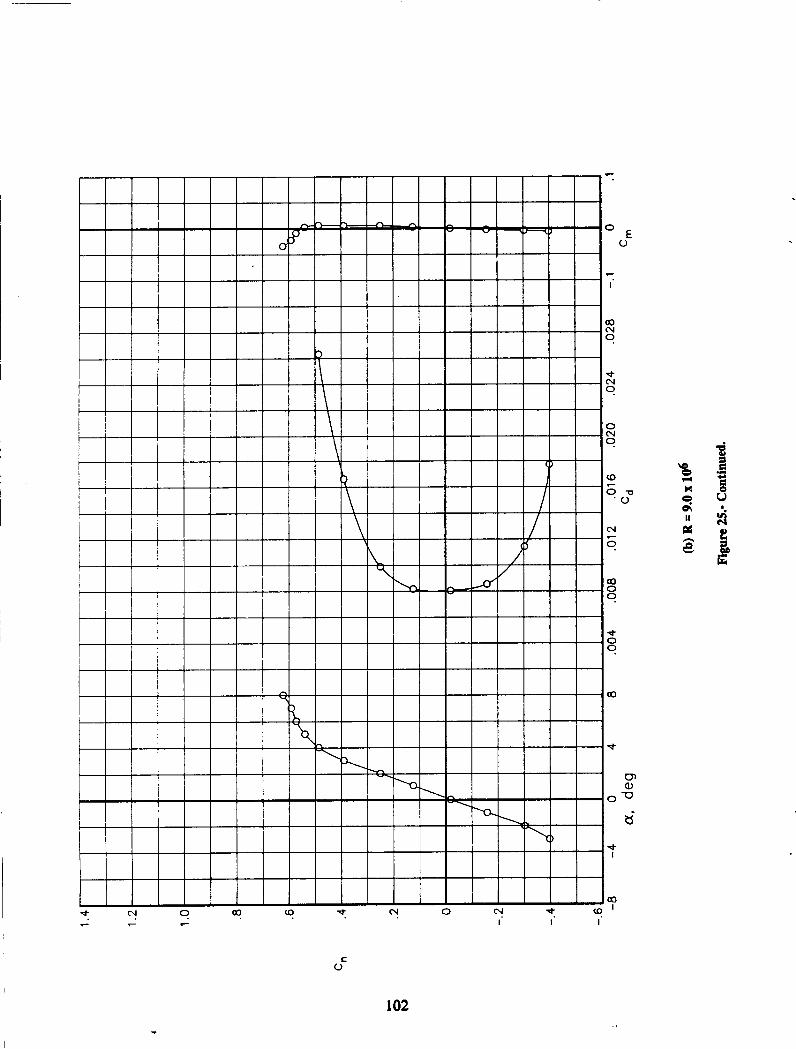
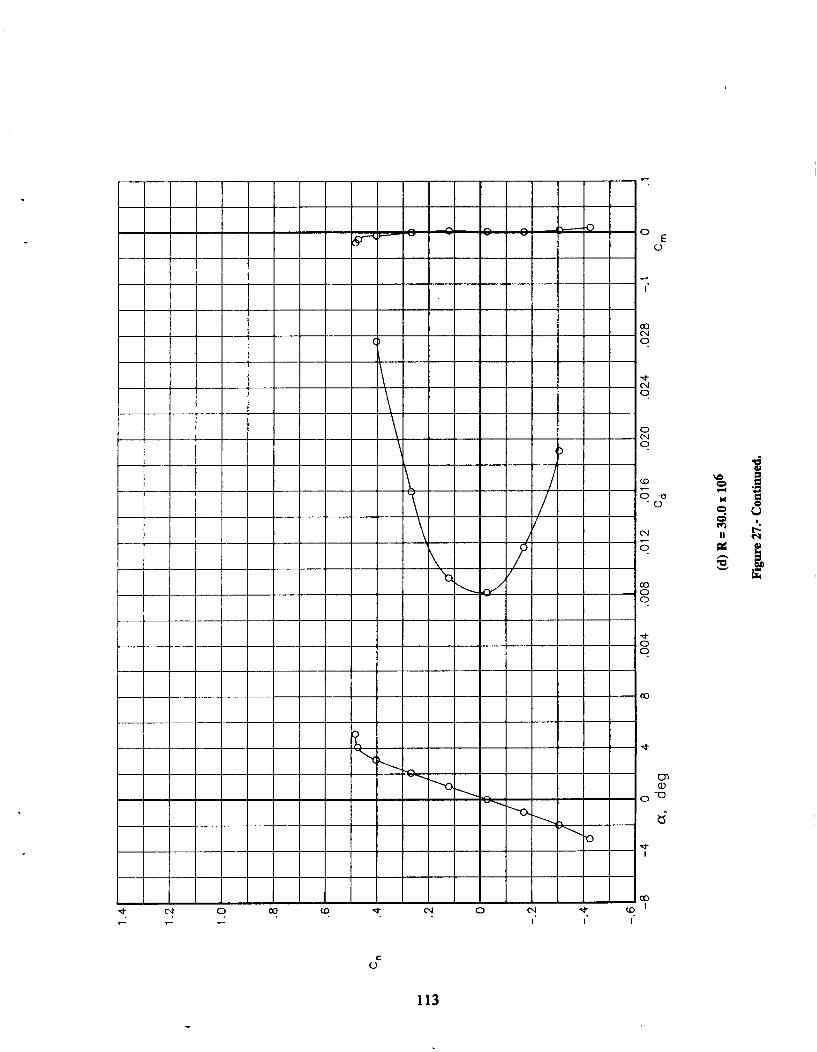
Variation of basic aerodynamic characteristics with angle of attack for various Mach and Reynolds numbers. Transition free.
0.30 0.40 0.50 0.60 0.65 0.70 0.74 0.76 0.78 0.80 0.82
19 20 21 22 23 24 25 26 27 28 29
Effects of fixing transition on the variation of basic aerodynamic characteristics with angle of attack for various Mach and Reynolds numbers.
0.30 0.50 0.70 0.74 0.76 0.78 0.80
30 31 32 33 34 35 36
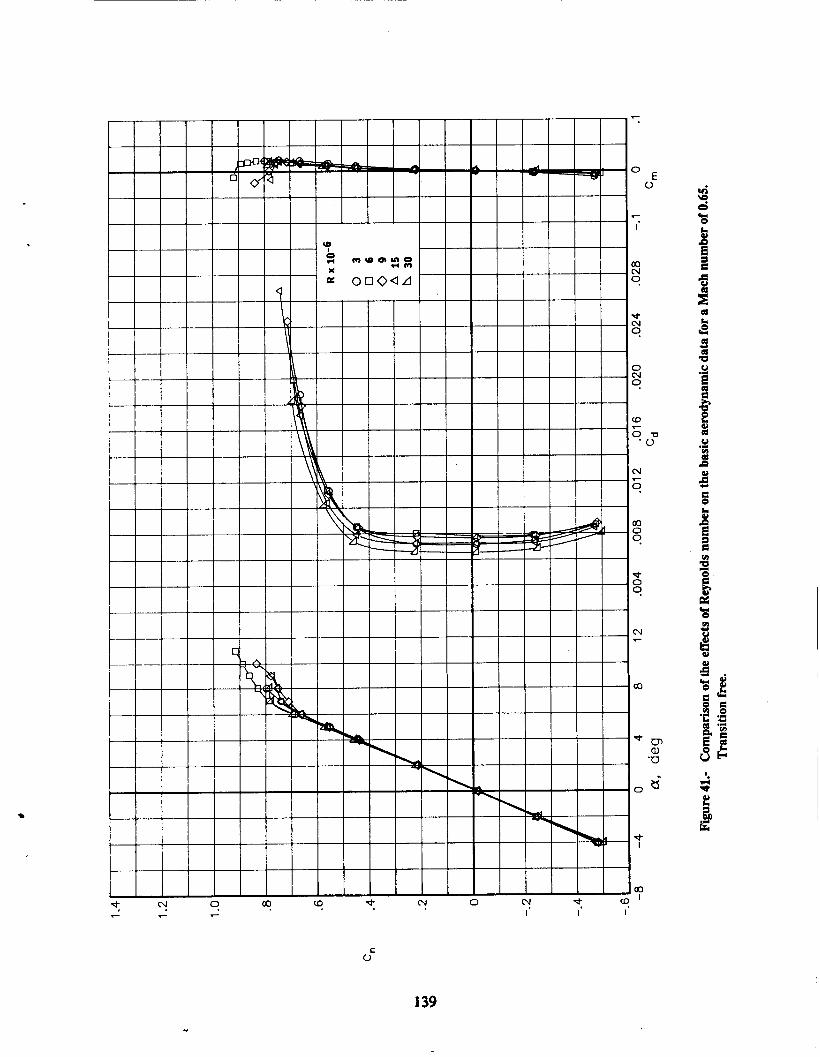
Comparison of the effects of Reynolds number on the basic aerodynamic characteristics for various Mach numbers. Transition free.
0.30 0.40 0.50 0.60 0.65 0.70 0.74 0.76 0.78 0.80 0.82
37 38 39 40 41 42 43 44 45 46 47
8

VI. Comparison of the effects of Reynolds number on the basic aerodynamic characteristics for various Mach numbers. Transition fixed.
0.30 0.50 0.70
48 49 50
9

REFERENCES
1. Ladson, Charles L. and Ray, Edward J.: Status of Advanced Airfoil Tests in the Langley 0.3-Meter Transonic Cryogenic Tunnel. NASA CP-2208, 1981.
2. Ladson, Charles L.; Hill, Acquilla S.; and Johnson, William G., Jr.: Pressure Distributions From High Reynolds Number Tests of an NACA 0012 Airfoil in the Langley 0.3-Meter Transonic Cryogenic Tunnel. NASA TM- 100526, 1987.
3. Ladson, Charles L. and Ray, Edward E.: Evolution, Calibration, and Operational Characteristics of the Two-Dimensional Test Section of the Langley 0.3 Meter Transonic Cryogenic Tunnel. NASA TP-2749, 1987.
4. Jacobs, Eastman N.; Ward, Kenneth E.; and Pinkerton, Robert M.: The Characteristics of 78 Related Airfoil Sections From Tests in the Variable-Density Wind Tunnel. NACA Rep. 460, 1933.
5. Ladson, Charles L.; and Brooks, Cuyler W., Jr.: Development of A Computer Program To Obtain Ordinates for NACA 4-Digit, 4-Digit Modified, 5-Digit, and 16-Series Airfoils. NASA TM X-3284, 1975.
6. Adcock, Jerry B.: Real-Gas Effects Associated With One-Dimensional Transonic Flow of Cryogenic Nitrogen. NASA TN D-8274, 1976.
7. Gumbert, Clyde R., and Newman, Perry A.: Validation of A Wall Interference AssessrnentlCorrection Procedure for Airfoil Tests in the Langley 0.3-m Transonic Cryogenic Tunnel. AIAA-84-2151, 1984.
10

0 -.3860 0 -.1950 0 -.0109 A .1694 h ,3544 b 5351 n .7187 0 ,7983 0 .8859 0 .96oi @ 1.0282
1.0656 0 1.1106 A 1.1575
(a) R = 3.0 x 10⁶
Figure 1.- Effects of normal force Coefficient on the spanwise variation of drag coefficient for various Reynolds numbers at a Mach number of 0.30. Transition free.
11

43
0 0 0 A h 0 a 0 0 n e
e .048
.040
.032
.008
0
-.0113 -.3902 -.2020 -.0163 .1112 .3597 .5488 .7303 .8181 .9054 .9867 1.0672 1.1374
-1 .o -.8 -.6 -. 4 -.2
Y/b/2
(b) R = 6.0 x lo6
Figure 1.- Continued.
0 .2 4

0 0 0 A h n n
0 n
0
e ffl e A
Cn
- -4005 -.2061 -.0174 .1747 .3703 .5641
.7418
.8358
.9301
1.0086
1.0779 1.1558 1.1596 1.2011
.048
.040
.032
Cci corr .024
.016
.008
0 - 1 .o -. 8 -.6 -. 4 -. 2 0 .2 .4
Y/b/2
(c) R = 9.0 x lo6
Figure 1.- Continued.
13

0 -.4025 0 -.2134 O -.0181 A .1724 h .3676 [5 .5604 0 .7459 0 .8319 0 .9107 n .993i
1.0613 BI 11.1123
1.1520 A 1.1873
(d) R = 15.0 x lo6
Figure 1.- Concluded.
14

.048
.040
.032
C, corr -024
.016
.008
0
C n
0 -.0213 0 -.4073 O -.2075 A -.0104 h .1863 b .3708 0 3609 0 .7502 Q .8444 A .9236 @ .9925 a 1.0220
-1 .o -.8 -.6 -. 4 -. 2 0 .2 .4 Y/b/2
(a) R = 3.0 x lo6
Figure 2.- Effects of normal force coefficient on the spanwise variation of drag coefficient for various Reynolds numbers at a Mach number of 0.40. Transition free.
1s

0 -.4077 0 -.2065 0 -.0141 A .1819 h .3772 b .5706 n ,7582 0 .8518 Q ,9462
- n 1.0092 @ 1.0486 a 1.0620 e 1.0558
(b) R = 6.0 x lo6
Figure 2.- Continued.
16

.048
.040
.032
C, corr .024
.016
. ooa
0
-.4138 -.2160
-.0196 ,1783
.3763
3727
.7649
.8530
.9445 1.0173
1.0406
1.0566 1.0573
-1 .o -.a -.6 -. 4 -. 2 0 .2 .4
Y/b/2
(c) R = 9.0 x 10⁶
Figure 2.- Continued.
17
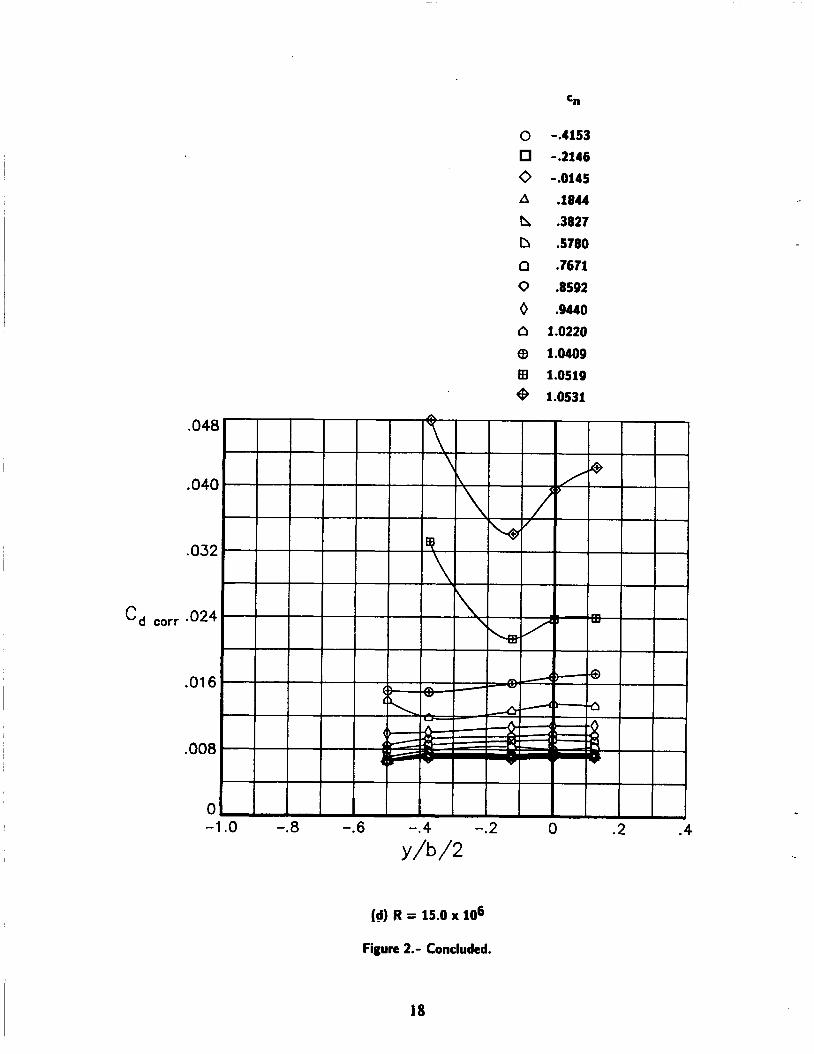
0 -.4153 -.2146
O -.0145 A ,1844 h ,3827 b .5780
n .76n 0 .8592
0 .9440 n 1.0220
(3 1.0409 ffl 1.0519 e 1.0531
C i corr
.
Id) R = 15.0 x lo6
Figure 2.- Concluded.
18

.048
.040
.032
Cci corr -024
.016
.008
0
0
0 A
h c\
0 n
0 n
cn
-.0123
-.4301 -.2235 - ,0144 .1918
,3971
,5989 .7880 .8623
.9125
-1.
(a) R = 3.0 x lo6
Figure 3.- Effects of normal force coeffwient on the spanwise variation of drag coefficient for various Reynolds numbers at a Mach number of 0.50. Transition free.
19

4'
0 -.0099 0 -A300 0 -.2165 A -.0135 h .1936 n .39% n ,6084 0 ,7925 0 .8767 n .93i9 @ .9649
,9754
(b) R = 6.0 x lo6
F i n 3.- Continued.
20

-.4352
-.0176
-.0144 .1946 .4009
.6100
.8030 ,8789
.9647
.9788
(c) R = 9.0 x lo6
Figure 3.- Continued.
21

0 -.4351 -.2232
O -.0158
A .1905 b .4017 h .6073
0 .8728 6 .9314
n ,7999
n .9553
,9515
(d) R = 15.0 x 10⁶
Fiure 3.- Continued.
. 22

3 3
0 0 0 A h 0 n
0 n
0
e
cn
-.0116
-.4385 -.2284 -.0163
.1961
.4107
.6226
.8162
.8193
,8992
,9446
.9594
-1 .o -. 8 -.6 -. 4 -. 2 0 .2 .4
Y / W
(e) R = 30.0 x lo6
Figure 3.- Concluded.
23

Cn
0 -.0234
0 4 5 7 5 0 -.2334
A -.0184
h .2063 0 .4240
n .ti337 0 ,7290
@ ,8118 , A .8520
.048
.040
.032
C, corr .024
.016
.008
0 -1 .o -.8 -.6 -.4 -. 2 0 .2 .4
Y/b/2
(a) R = 3.0 x 10⁶
Figure 4.- Effects of normal force coefficient on the spanwise variation of drag coefficient for various Reynolds numbers at a Mach number of 0.60. Transition free.
24

47
.04E
.04C
.032
Cci corr .024
-01 6
.008
0 -
En
0 -.0203
0 -.4595 0 -.2302 A -.0112 h .2089 b ,4287
Q .6564 . 0 ,7479
9 .8513 n .8987
e .9191
0 -.8 -.6 -.4 -. 2 0 .2 .4
Y/b/2
(b) R = 6.0 x 10⁶
Figure 4.- Continued.

cn
0 -.4654 0 -.2340 0 -.0140 A .2078 h .4315 c\ .6587 Q .7503 0 .8306
. Q .8636 d .8831
.048
.040
.032
C, corr .024
.016
. OOE
C -1
(c) R = 9.0 x lo6
Figure 4.- Continued.
26

cn
0 -.4537 I3 -.2357 0 -.0163 A .2045 b .4287 [5 .6581 0 .7398 0 .E466 0 .8440
.048
.040
.032
C, corr .024
-01 6
.008
0 -1 .o -.a -.6 -. 4 -. 2 0 .2 .4
Y / W
(d) R = 15.0 x lo6
Figure 4.- Continued.
27

0
0 A b
b 0 0 0
0
cor r
-1 .o -.a -.6 -.4 -.2 Y/b/2
(e) R = 30.0 x lo6
Figure 4.- Concluded.
28 ...-
Cn
-.0129 -.4768 -.2448 -.0144 .2113
.4393
.6644
.7631
.8412
.8648
0 .2 .4
Cn
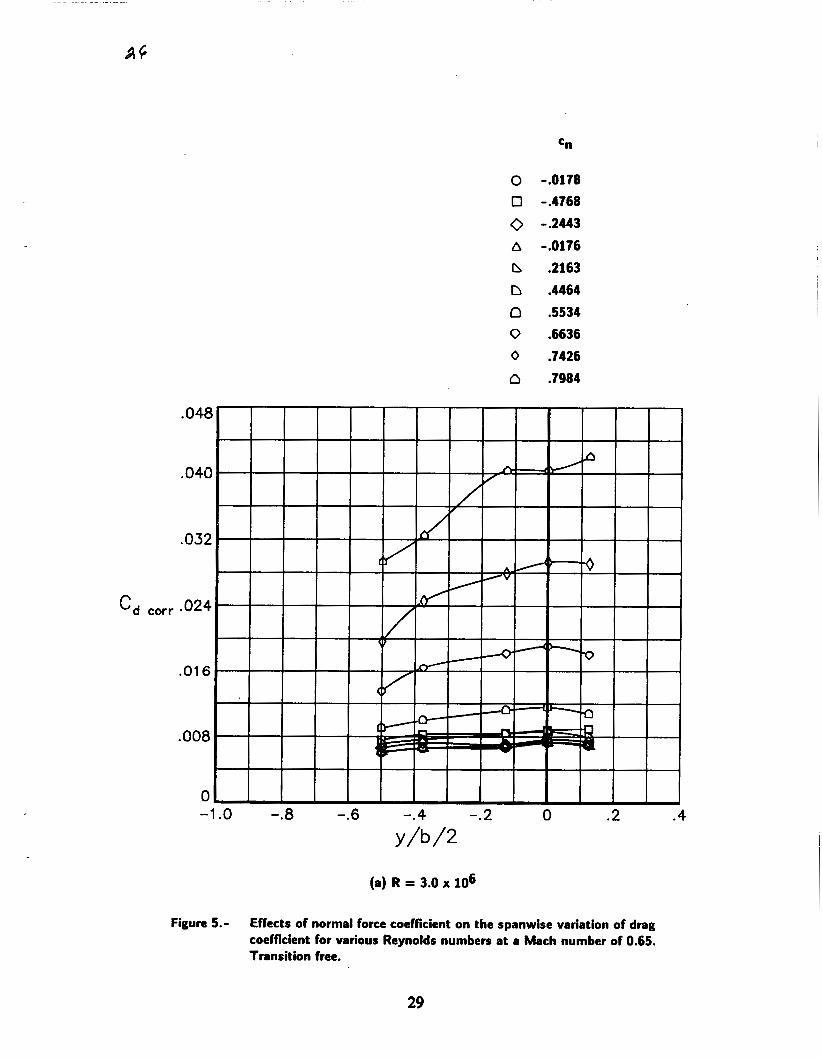
0 -.0178 0 -.4768 Q -.2443 A -.0176 b .2163 b .4464 0 ,5534 0 .6636 0 .7426 0 ,7984
(a) R = 3.0 x lo6
Figure 5.- Effects of normal force coefficient on the sprnwise variation of drag coefficient for various Reynolds numbers at a Mach number of 0.65. Transition free.
29

0 -.0179 0 -.4770 0 -.2386 a -.Oil1 b .2180 D .4471 0 ,5623 0 ,6908 0 .7882 0 .8317
.8648
j (b) R = 6.0 x lo6
Fiiun 5.- Continued.
30

0 0 0 a n 0 0 0 0 0
(c) R = 9.0 x 10⁶
Figure 5.- Continued.
C n
-.4821 -.2457 -.0176 .2136 .4393
.5561 ,6613
.7131
.7538
.7815
31

cn
0 -.4740
0 -.2436 0 -.0163 A .2186
b A 7 4 [5 .5614 0 .6643
0 .7420 0 .7564
0 .7741
.048
.040
-1 .o -.a -.6 -. 4 -. 2 0 .2
Y/b/2
.032
.016
.008
.4
(d) R = 15.0 x 10⁶
Figure 5.- Continued.
32

.048
.040
.032
C, corr .024
.016
.008
0 -
Cn
0 -.0229
0 -SO33
., 0 -.2534 A -.0146 b -.221a D .4603 0 ,5750
0 ,6970
o .7a23 o ~ a 9 0
0 -.8 -.6 -. 4 -.2 0 .2 .4
Y/b/2
(e) R = 30.0 x lo6
Figure 5.- Concluded.
' 33

.048
.040
.032
C, corr .024
.016
.008
a
Cn
0 -.0167
O -.3913
0 -.2611 A -.0219
b .2204
D ,3382 0 .4613
0 .5868
0 .6680
4 -1
Figure 6.- Effects of normal force coefficient on the spanwise variation of drag coefficient for various Reynolds numbers at a Mach number of 0.70. Transition free.
34

(b) R = 6.0 x lo6
Figure 6.- Continued.
35
0 -.0211 0 -.3847 0 -.2531 A -.0139 b .2324 D .3562 n .4879 0 .6019 0 .6053 0 .6889 @ .7417
.7907

Cn
O -.4078 0 -.2687 0 -.1435 A -.0187 n .loo9 b .2222 0 .3613 0 .4944 0 .6067 n .6656
-1 .o -.a -.6 -.4 -.2 0 .2 .4
Y / W
(c) R = 9.0 x lo6
Figure 6.- Continued.
36

.048
.040
.032
C, corr *024
.016
.008
0 -1
0 0 0 a b
0 0 0 0
0 8 B
Cn
-.3782 - .2548 -A341 -.0149 .1040 .2226 .3493 .4739 .5690 ,6535 .6731 .6942
-.a -. 6 -. 4 -. 2 0 .2 .4 Y / W
(d) R = 15.0 x 10⁶
Figure 6.- Continued.
37

.04E
.04C
.032
C, corr -024
-01 6
.008
0 -1
0 0 0 A b n 0 0 0
0
Cn
- ,0244 - .4053 -.2702 -.1392
-.0171
,2326 .3599 .4974
,6147
.6811
(e) R = 30.0 x 10⁶
Figure 6.- Concluded.
38

.048
.040
.032
.008
0
0 0 0 A
0 n n 0 0 0 @
C n
-.4189 -.2763 -.1388 -.0098 .1154 .2477 .3787 .5074 .5785 .6476 .7277
-1 .o -.8 -.6 -.4 -.2 0 .2 .4
Y/b/2
(a) R = 6.0 x lo6
Figure 7.- Effects of normal force coefficient on the spanwisc variation of drag coefficient for various Reynolds numbers at a Mach number of 0.74. Transition free.
39

0 -.3988 0 -.1589 0 -.0191 A .1246 b .2504 0 .3906 0 .4867 0 .5400 0 .5729 0 .5919
-1 .o -.8 -.6 -.4 -.2 0 .2 .4
Y/b/2
(b) R = 9.0 x lo6
Figure 7.- Continued.
40

cn
0 -.4019 O -.2766 0 -A471 A -.0187
b .lo88 b .2495
n .3686 0 .4756 0 .5486 0 .5711
(c) R = 15.0 x lo6
Figure 7.- Continued.
41

37 Cn
0 -.0274 O -.4287 0 -.2891 A -.1517 b -.0170 n ,1154 0 .2560 0 .2587
. 0 .4037 0 .3886
5024 @ 3893 e .6010 A .6215
-1 .o -. 8 -.6 -. 4 -. 2 0 .2 .4
Y/b/2
(d) R = 30.0 x lo6
Fiiure 7.- Concluded.
I 42

Cn
0 -.0201 D -.4206
O -.2861
A -.0107 b .1208
b .2626 0 .3895
0 .4975 0 .5520 0 .6187
.04€
.04C
.032
C, corr .024
.016
.008
0 -1 .o -.8 -. 6 -. 4 -.2 0 .2 .4
Y / W
(a) R = 6.0 x 10⁶
Figure 8.- Effects of normal force coefficient on the spanwise variation of drag coefficient for various Reynolds numbers at a Mach number of 0.76. Transition free.
43 I

0 -.3924 O -.3019 0 -.la1
A -.0238 b .1181
[5 .2521
0 ,3721
0 .4592
0 A945
0 ,5180
-1 .o -.a -.6 -.4 -. 2 0 .2 .4
Y/b/2
(b) R = 9.0 x lo6
Figure 8.- Continued.
44

0 0 0 a b b n 0 0
0 a3
C n
-.4275
-.2887 -.1434 -.0155
.1159 ,2448 .3577
.4545
.4985
.5276 ,5546
(c) R = 15.0 x IO6
Figure 8.- Continued.
45

0
0 0 h 0 D
n 0 0
n a3
cn
-.0329 -.4324 -.2936 -.1595 -.0202 .1206 .2606 .4023 .5187 .5358 .5562
.048
.040
.032
.024
.016
.008
0 -1 .o -.8 -.6 -. 4 -.2 0 .2 .4
Y/b/2
(d) R = 30.0 x lo6
Figure 8.- Continued.
46

Cn
0 -.0278 O -.1552
0 -.2970
A -.0153 b .1204
0 ,2670
n .3775
0 .3764
0 .5066
0 .5489
@ ,6015
B -.4254
.048
.040
.032
.008
0 -1 .o -. 8 -.6 -.4 -.2 0 .2 .4
Y/b/2
(e) R = 45.0 x l o 6
Figure 8.- Concluded.
47

Cn
0 -.0151 0 -.4119 0 -.2950 D -.1678 0 -.0220 n .ii6i 0 .2595 0 .3893 0 .4597 0 3169
,5824
(a) R = 6.0 x lo6
Figure 9.- Effects of normal force coefficient on the spanwise variation of drag coefficient for various Reynolds numbers at a Mach number of 0.78. Transition free.
48

.048
.040
.032
C ~ I corr -024
.016
.008
0
Cn
0 -.4044 O -.3130 0 -.1851 A -.0326 h .1277 0 .2466 0 .3543 0 .4255 0 ,4434 0 .4645
- 1 .o -.8 -.6 -.4 -. 2 0 .2 .4 I
Y/b/2
(b) R = 9.0 x lo6
Figure 9.- Continued.
49

0 0 0 n b
D 0 0 0
0 (3
Cn
-.a181 -.2975
-A551 -.0179
.1190
.2493
.3544
.4329
.4609
.4797
3139
(c) R = 15.0 x lo6
Figure 9.- Continued.
50

.048
.040
.032
C, corr .024
.016
.008
0
O -.0308 O -.4256 0 -.3062 A -.1696 0 -.0267 D .1218 0 .2680 0 .4039 0 .4751 0 .4849
-1 .O -.a -.6 -. 4 -.2 0 .2 .4
Y / W
(d) R = 30.0 x lo6
Figure 9.- Continued.
51

O -.0196 0 -.4319 0 -.2908 A -.1667 b -.0208 I3 .1332 0 ,2750 0 .3933 0 .4914
-1 .o -.a -.6 -. 4 -.2 0 .2 .4
Y/b/2
(e) R = 45.0 x lo6
Figure 9.- Concluded.
52

.041
.04C
0 0 0 A b
D 0 0 0
-.0246
-.2976 -.0127 .1242
.2648
.3658
.4051
.4611
.5331
-1. .2
(a) R = 6.0 x lo6
Figure 10.- Effccts of normal force coefficient on the spanwise variation of drag coefficient for various Reynolds numbers at a Mach number of 0.80. Transition free.
.4
53

.048
-040
.032
C, corr .024
-01 6
.008
0
'0 -.2856 O -.1646 0 -.0288 a .io91 b .2380 D .3332 0 .3823 0 .4026 0 ,4382
-1 .o -.a -.6 -. 4 -. 2
Y/b/2 0 .2 .4
(b) R = 9.0 x lo6
Figure 10.- Continued.
54

.048
.040
.032
C, corr .024
.016
.008
0
cn
0 -.2873 0 -.1539 Q -.0147 A .1182
b .2395 b .3466 0 ,3804 0 .4023 0 .4390
-1 .o -.a -.6 -. 4 -. 2 0 .2 .4
Y/b/2
(c) R = 15.0 x lo6 Figure 10.- Continued.
55

0 0
0 h b n D 0 0
cn
-.0426 -.3030 -.1615 -.0234 .1151 .2615 .3835 .4180 .4169
.048
.040
.032
C, corr .024
.016
.008
0 -1 .o -.a -.6 -.4 -.2 0 .2 .4
Y / W
(d) R = 30.0 x lo6
Figure 10.- Continued.
56

0
0 0 A b
C n
- .0204
-.1514
-.0155
,1351
.2863
.048
.040
.032
C, corr -024
.016
.008
0 -1 .o -.8 -.6 -.4 -. 2 1
Y/b/2 .2 .4
(e) R = 45.0 x 10⁶
Figure 10.- Concluded.
57

--
.048
.040
.032
C, corr .024
.016
C
0 0 0 A b D
D * o
0
C n
-.0132
-.2751 -A513 - .0070 .1185 .2414
.2944
,3563
.43w
-.8 -.6 -. 4 -. 2 0 .2 .4 -1 .o Y / W
(a) R = 6.0 x lo6
Figure 11.- Effects of normal force coefficient on the spanwise variation of drag coefficient for various Reynolds numbers at a Mach number of 0.82. Transition free.
58

. OI a
.040
.032
‘ti corr -024
.016
.008
0
0 0 0 a h n 0 0 0
0
Cn
-.0229 -.2661 -.1354 -.0138 .1073 .2118 .2892 ,3206 ,3455 .4018
-1 .o -.8 -. 6 -. 4 -. 2 0 .2 .4
Y/b/2
(b) R = 9.0 x lo6
Figure 11.- Continued.
59
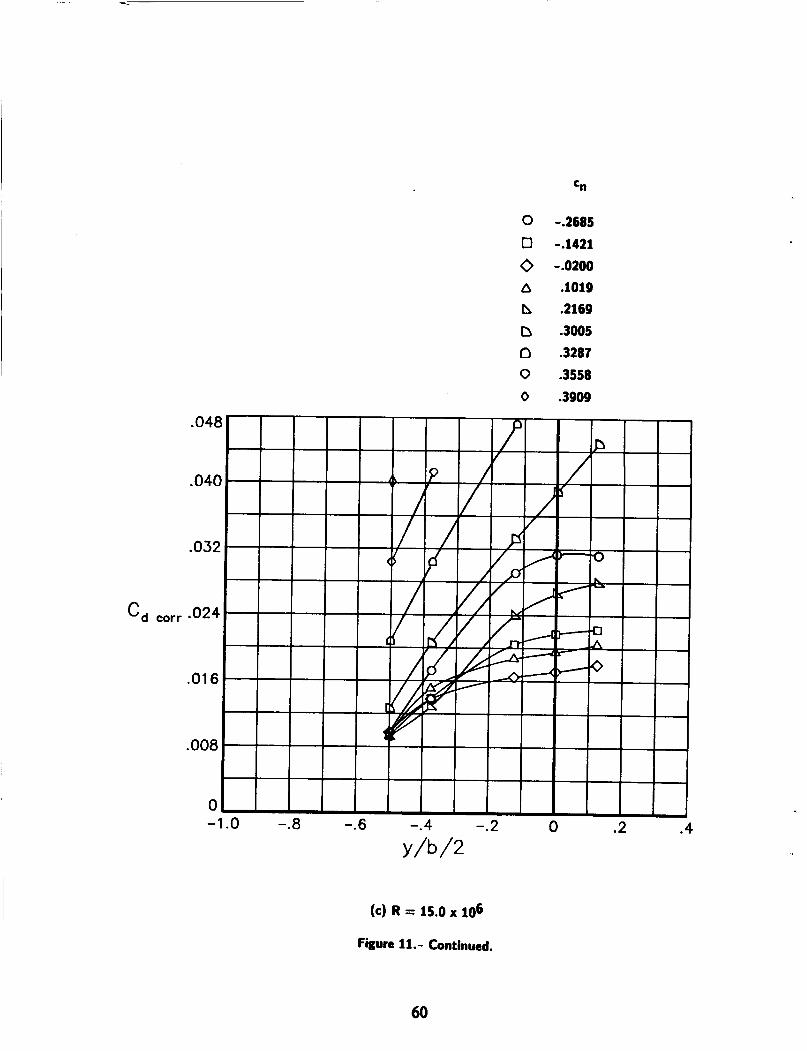
0 -.2685 O -A421 0 -.0200 A .lo19 b .2169 0 ,3005 0 .3287 0 .3558 0 ,3909
(c) R = 15.0 x 10⁶
Fisure 11.- Continued.
60

O -.0226 O -.2847
0 -.0133 h .0909 b ,2542 b .3361 0 .3463
.04€
.04C
.032
C, corr -024
.016
.008
0 -1
(d) R = 30.0 x 10⁶
Figure 11.- Continued.
61

Cn
0 -.0036
-.1472
0 -.0043 A .1145
.048
.040
.032
C, corr .024
.016
.008
0 ~ ~~
-1 .o -.8 -.6 -. 4 -. 2 0 .2 .4
Y/b/2
(e) R = 45.0 x lo6
Figure 11.- Concluded.
62

0 -.3773
0 -.2879
0 -.1%0
-.0115 b ,1744
0 .3607 0 3435 0 .7263 0 .a147 0 .goo0
a 1.0661
Q 1.1387
A 1.2006
e .9a74
(a) R = 3.0 x lo6
Figure 12.- Effects of normal force coefficient on the spanwise variation of drag coefficient for various Reynolds numbers at a Mach number of 0.30. Transition futcd.
63

O -.3876 0 -.2095
, 0 -.0088 A .1914 b .3851 D .5764 0 .7709 0 .8640 0 .9535 0 1.0438 e 1.1215 B 1.1935
1.2447 4 1.2538
-1 .o -. 8 -.6 -. 4 -. 2 0 .2 .4
Y/b/2
(b) R = 9.0 x lo6
@re 12.- Concluded.
64

0 -.4190 a - . m i
. 0 -.0083 h .1995 b .4047 n .6iiz 0 ,8186 0 .8940 0 3377
-1 .o -.a -.6 -.4 -. 2 0 .2 .4
Y/b/2
(a) R = 3.0 x lo6
Figure 13.- Effects of normal force coefficient on the spanwise variation of drag coefficient for various Reynolds numbers at o Mach number of 0.50. Transition fixed.
65

O -.4256
D -.2160
I 0 -.0028 15 ,2109 b .4213
[5 .6325
0 .8393 0 .9120
. 0 .%72
' 0 .9809
.048
.040
.032
.008
0 -1 .o -.8 -.6 -. 4 -.2 0 .2 .4
Y/b/2
(b) R = 9.0 x lo6
Figure 13.- Concluded.
66

0 -.3838
O -.2536
0 -.0095
h .2378 b .3661 0 .5043 0 ,6230
Cci corr
I I -1 .o -.8 -.6 -.4 -. 2 0 .2 .4
Y/b/2
( I ) R = 3.0 x lo6
Figure 14.- Effects of normal force coefficient on the epanwise variation of drag coefficient for various Reynolds numbers at a Mach number of 0.70. Transition fixed.
67 I

0 -.4175 0 -.2589
0 -.0059
h .2545
b . a 2
0 A245
0 ,6354
0 .6428
(b) R = 9.0 x lo6
Figure 14.- Concluded.
68

0 -.4423 0 -.2847 Q -.1405 A -.0019 b .1346 n 0 .4360 0 .5351
Figure 15.- Effects of normal force coefficient on the spanwise variation of drag coefficient for a Reynolds number of 9.0 x lo6 and a Mach number of 0.74. Transition fixed.
69

O -.1526
O -.3047
0 - .a74 A -.0022
b ,1428
e .2947
0 A369
1 9 A935
0 A933
Figure 16.- Effects of normal force coefficient on the spanwise variation of drag coefficient for I Reynolds number of 9.0 x lo6 and a Mach number of 0.76. Transition fixed.
70

Cn
O -.1748 0 -.3209 0 -.0028 0 ,1627 B 3162 D .4155
.048
.04C
.032
‘d corr
.016
.008
0 -1 .o -.8 -.6 -. 4 -. 2 0 .2 .4
Y/b/2
Figure 17.- Effects of normal force coefficient on the spanwise variation of drag coefficient for a Reynolds number of 9.0 x lo6 and a Mach number of 0.78. Transition fixed.
71

.048
.040
.032
C, corr .024
.016
.008
0
C n
0 -.1788 0 -.0045 0 A714 A .3112 fh .3531
-1 .o -.8 -.6 -.4 -.2 0 .2 .4
Y/b/2
Figure 18.- Effects of normal force coeffiient on the spanwise variation of drag coefficient for a Reynolds number of 9.0 x lo6 and a Mach number of 0.80. Transition fixed.
r 72

c
E 0
0
c
I
03 N 9
-J- N 9
0 N 9
CD 7
9
N c
9
a 9 0
0 9
(D c
N - m
0 Q)
tu d
3
* I

c u
74
c
E 0
o
c
I
a3 N 0
d cu 9
0 rJ 9
(D .-- 9 om
m
I '4 I
t I
9 '4 t 0 -! I c
7 c
t c
C o
75

7
E 0
0
7
I
a3 cv 9
d (v
9
0 (v
9
U J c
9
(v c
9
03 0 9
d 0 9
UJ .--
(v c
a3
0 Q)
d U
d
0
d I
a3
I t I
9 d: c'! 0 c'! 7
c'! 7
d: c
C 0
16


C 0
78

79

C 0
80

E 0
0
Y
I
a3 cu 9
d- cu 9
0 cu 9
W v
9
N .-- 9
a3 0 9
d- 0 9
W - cu 7
a3
0 al d-73
d 0
d- I
a3
'4 I
t I
03 '4 t v 0 ? I
C 0
81

C 0
.82 -

C u
83

C 0
84

c 0
85

E >
0
- I
0 \I ?
* \I ?
3 u ?
D - ? "" N r
?
n 3 ?
0 9
CJ 7
co
d0-l a, U
0 a"
d I
co I
C 0
86

C 0
87

I ' 9 ' I
9 '9 t 0 v t I .--
v c
t T--

C u
E 0
0 u ?
f u ?
? "" N r
?
n 3 ?
0 9
0 d
d I

C u
91
-
E 3
0
- I
x) U ?
if U ?
3 ; 0 7
?
N r-
?
n 3 ?
d- 3 ?
N 7
m
* c n a, U
0 d
* I
03 I

C 0
92

E 0
0
a3 hl 9
d- hl 9
0 N 9
3
C 0
93


-
E 3
0
- l
a u ?
$
0 N 9
(D c
9 "" c\1 c
9
a3 0 9
d- 0 9
(u .--
a3
e0-l Q) TI
0 d
c c
K 0
96
C 0
c-a, 97

C 0
90

t 0
99


101 ..

C 0
103

104

C 0
105

C 0
106

107
I
d N

c 0
108

C 0
109

VC
110

I I I
C 0
111

C 0
112
7
E 0
0
c
I
a3 N 9
d. N 9
0 CJ 9
(D .-. "0" N 7
ct 0 9
d.
0 al 0-0
d d I
E 0
0
Y
I
m
9 N
* N 9
0 N 9
N
0 .--
m
9 0
* 0 9
m
* I
m 4 ' I

t 0
114


c c c
c 0
116

t u
117

C 0
118

C 0
119

c u
120
-
E 0
u
- I
m (v
9
* @4 9
0 N 9
u) c
9 o”
(v c
9
m 0 9
* 0 9
03
d-
CY 0
o m
d d-
I
m I

-
E 0
0
v
I
Qo hl 9
t N 9
0 N 9
d- I
3 I ? I
10 I
* I
3 I

C u
122

' 4 ' I
-? I
0 I
'4
C 0
123

c 0
E > 0
0 - ?
v - ?
a G k ' i z a
3 ?
d- 3 ?
I '4 I
124

7
E 0
0
7
I
m
9 N
N 9
0 N 9
CD 7
9
N 7
9
a3 0 9
-t 0 9
(0 .--
N c
a
0 Q)
tu d
0
t I
C 0
125

F
E 0
0
c
I
00 N 9
=t N 9
0 N 9
(D 7
9 "" N 7
9
m 9 0
d- 0 9
a r
N F
x)
0 a,
b-t)
d
3
d- I
0 I
126

I
'4 I
t I
9 03 '4 t Y 0 c? I
7
Y .-- t c
C 0
127

c
E 0
0
c
I
a 9 N
-I- rJ 0
0 rJ 0
CD 0 0 c
0
rJ
0 7
a 0 0
-I- O 0
(D 7
N c
a
cn al -I-m
d
0
d- I
a I '4
I -t c'! 9 '4 t 0 ?
I c c c
C u
128

c 0
I29


2
C u
131

C 0
132
I

133

C 0
134

C 0
135

t rl ?
0 3 ?
D 7
0
f d (r 0
L I
c 0
136

7
I'
a3 N 9
N 9
0 N 9
W 7
9 ""
6 (v
a3 0 9
d. 0 9
(D 7
lv F
03
0 a,
d 3
4 I
0 I

cr 0
F
138
= onoao
0 t
C 0
139

0 c'. 0 cr 0
& E
C 0
140

*
o? I
d; 1
9 09 '0 d; r'! 0 r'! I T-
c? T-
d; T-
C 0
141
T-
E 0
0
T-
I.
a3 N 9
cf hl 9
0 @4 9
(D T-
9 "" hl T-
9
a3 0 9
d- 0 9
03
d.
cn Q)
0 7 3
d cf I
a3 I

I
7
E 3
0
r
I
x)
$
; *
0 N ?
0 r-
9 ”” N r-
9
m 9 0
* 0 9
m
* m a
O m d
I
m I
142

.
T-
E 0
0
7
I
03 N 9
-J- N 9
0 N 9
(D v-
9 "" N v-
9
03 0 9
3 ?
a
f
0 a,
1 -
a- t
I
0'
I43

d 0 c 0
. . c 0
144

. L
a
I I I
C 0
145

r
3
(
r
I
XI N ?
d. N ?
3 N ?
0 r
? "" N r
?
P 3 ?
d 0 9
ul F
N F
x3
m a dm
d 3
I
P I
C 0
146

C 0
147
0 v! 0
(P L 8

- E 0
0
F
I
03 N 9
cf N 9
0 N 9
W - 9 "" N 7
9
00 0 9
cf 0 9
(v 7
03
* m Q) -0
o d
cf I
m
148
(D

Report Documentation Page 1 Report No
NASA TM-100527 _____
2 Government Accession No 3 Recipient's Cdtalog No
- -____ ---____
Charles L . I i idson and AcquiLIa S . H i L 1
4 Title and Subtitle
High Reynolds Number Transon ic T e s t s on a n NACA 0012 A i r f o i l i n t h e Langley 0.3-Meter T ranson ic Cryogenic Tunne 1
I 10 Work Unit No.
-
5. Report Date
December 1987 6 Performing Organization Code
505-61-01-07 ___-- --i - _ _ __ _____ ~
9 Performirig Orgarmation Name and Address
_____-__I_---
12 Sponsoring Agmcy Name and Address
N a t i o n a l Aeronau t i c s and Space A d m i n i s t r a t i o n Washington, DC 20546
____ __ __-._ [ 11 Contract or Grant No NASA i . s n p l e y Research Cen te r
13 Type of Report and Period Covered
Tcchni r a 1 Nc~morandurr, - -__-__
14 Sponsoring Agency Code
19. Security Classif. (of this reportt 20. Security Classif. (of this page1 21. No. of pages
U n c l a s s i f i e d U n c l a s s i f i e d 149
- 16. Abstract
22. Price
A0 7
T e s t s were c o n d u c t e d i n t h e two d imens iona l t e s t s e c t i o n of t h e LangLey 0.3-meter T ranson ic Cryogenic Tunnel on an NACA 0012 a i r f o i l t o o b t a i n aerodynamic d a t a as a p a r t of t h e Advanced Technology A i r f o i l T e s t (ATAT) !)rngram. a Reynolds number range of 3 . 0 x 10 t o 45.0 x 10 . The s t a g n a t i o n p r e s s u r e was v a r i e d between 1.2 and 6.0 atmospheres and t h e s t a g n a t i o n t empera tu re w a s v a r i e d between 300 K and 90 K t o o b t a i n t h e s e t e s t c o n d i t i o n s . P l o t s of t h e spanwise v a r i a t i o n of d r a g c o e f f i c i e n t as a f u n c t i o n of normal f o r c e c o e f f i c i e n t and the v a r i a t i o n of t h e b a s i c aerodynamic c h a r a c t e r i s t i c s w i t h a n g l e o f a t t a c k a r e shown. The d a t a are p r e s e n t e d u n c o r r e c t e d f o r w a l l i n t e r f e r e n c e e f I e c t s and w i t h o u t a n a l y s i s .
The t e s t program covered 8 Mach number gange of 0.30 to 0 . 8 2 and
17. Key Words (Suggested by Authorls)) I 18. Distribution Statement
U n c l a s s i f i e d - Unlimited A i r f o i l s High Reynolds numbers Cryogenic wind t u n n e l s S u b j e c t Category - 02
b
i
1
d
NASA FORM 1626 OCT 86


![ウィルソン・フィロソフィー、ここに凝縮。 - AXISSSabrina [Specifications] ウーファー : 8 インチ (20.32 cm) ペーパー・コーン ミッドレンジ :](https://img.dokumen.tips/doc/110x75/5fe1ecba49c5d274614e73f3/fffffffc-sabrina-specifications.jpg)


![ARMARIOS DE PARED DE ACERO FUNDIDO PARA … · Adjust door to the desired height. 3. Tighten the screws. Reverse Door (24" [60.96 cm] wall cabinet only) Style 1 - Magnetic Latch 1](https://img.dokumen.tips/doc/110x75/5f4cf28536705c65aa0eb9fb/armarios-de-pared-de-acero-fundido-para-adjust-door-to-the-desired-height-3-tighten.jpg)