Embed Size (px)
Citation preview

1
High-resolution synchrotron imaging shows that root hairs influence 1
rhizosphere soil structure formation 2
Nicolai Koebernick1, Keith R. Daly1, Samuel D. Keyes1, Timothy S. George2, Lawrie K. 3
Brown2, Annette Raffan
3, Laura J. Cooper
1, Muhammad Naveed
3, Anthony G. Bengough
2,4, 4
Ian Sinclair1, Paul D. Hallett3 and Tiina Roose1,$ 5
1 Bioengineering Sciences Research Group, Engineering Sciences Academic Unit, Faculty of 6
Engineering and the Environment, University of Southampton, Southampton SO17 1BJ, United 7
Kingdom 8
2 Ecological Sciences Group, The James Hutton Institute, Invergowrie, Dundee DD2 5DA, United 9
Kingdom 10
3 Institute of Biological and Environmental Science, University of Aberdeen, Aberdeen AB24 3UU , 11
United Kingdom 12
4School of Science and Engineering, University of Dundee, Dundee DD1 4HN, United Kingdom 13
$ corresponding author: Tel: +44 23 8059 2374, [email protected], Tiina Roose, Bioengineering 14
Sciences Research Group, Engineering Sciences Academic Unit, Faculty of Engineering and 15
Environment, University of Southampton, University Road, SO17 1BJ Southampton, United Kingdom. 16
17
Total word count: 6496 18
Introduction: 1433 19
Materials and Methods: 1700 20
Results: 1472 21
Discussion: 1694 22
Acknowledgments: 166 23
Number of figures: 9 24
Number of tables: 2 25
Supporting information: 2 Figures, 1 Method description, 1 Table 26
27
Summary 28
- In this paper, we provide direct evidence of the importance of root hairs on pore 29
structure development at the root-soil interface during the early stage of crop 30
establishment. 31
Page 1 of 36 New Phytologist
2
- This was achieved by use of high resolution (~5 µm) synchrotron radiation computed 32
tomography (SRCT) to visualise both the structure of root hairs and the soil pore 33
structure in plant-soil microcosms. Two contrasting genotypes of barley (Hordeum 34
vulgare L.), with and without root hairs, were grown for 8 days in microcosms packed 35
with sandy loam soil at 1.2 g cm-3 dry bulk density. Root hairs were visualised within 36
air filled pore spaces, but not in the fine-textured soil regions. 37
- We found that the genotype with root hairs significantly altered the porosity and 38
connectivity of the detectable pore space (> 5 µm) in the rhizosphere, as compared 39
with the no-hair mutants. Both genotypes showed decreasing pore-space between 0.8 40
mm and 0.1 mm from the root surface. Interestingly the root-hair-bearing genotype 41
had a significantly greater soil pore volume-fraction at the root-soil interface. 42
- Effects of pore structure on diffusion and permeability were estimated to be 43
functionally insignificant under saturated conditions when simulated using image 44
based modelling. 45
Abbreviations 46
Keywords 47
image-based modelling, non-invasive imaging, rhizosphere, root hairs, soil structure, 48
synchrotron, Hordeum vulgareL. 49
Introduction 50
Plant roots use a range of mechanisms to alter the physical properties of the soil adjacent to 51
roots known as the rhizosphere (Hinsinger et al. 2009). Various soil physical stresses and 52
interactions occur during root growth that can be affected by a range of root traits (Bengough 53
et al., 2011). Soil compaction around roots has been extensively studied (Dexter, 1987; 54
Bruand et al., 1996; Young, 1998; Vollsnes et al., 2010; Aravena et al., 2011; Aravena et al., 55
2014). Based on these studies the rhizosphere is expected to have both less porosity and 56
smaller pore-sizes than bulk soil. However, as roots mature, soil structure is significantly 57
altered by the interplay between root exudates, microbial activity, and variations in soil water 58
potential (Hinsinger et al., 2009). Consequently, soil in the rhizosphere may have similar or 59
greater porosity and larger pore sizes than bulk soil (Whalley et al., 2005; Feeney et al., 2006; 60
Hallett et al., 2009). 61
Page 2 of 36New Phytologist
3
Rhizosphere soil can form a rhizosheath, a layer of strongly bound and more aggregate soil 62
that adheres firmly to the root surface. The size and adherence of the rhizosheath varies 63
significantly between species (Brown et al., 2017), and between genotypes of the same 64
species (George et al., 2014; Delhaize et al., 2015). The formation of a rhizosheath is thought 65
to be driven by root exudates and soil water regime (Watt et al., 1994), and by the presence of 66
root hairs (Haling et al., 2010 and 2014). Some root and microbially-derived exudates affect 67
soil structure by binding soil particles and increasing the stability of the rhizosphere (Czarnes 68
et al., 2000; Hallett et al., 2009). Aggregation of soil particles results from the interplay 69
between these exudates and wetting-drying cycles imposed by plant transpiration 70
(Albalasmeh & Ghezzehei, 2014). Caravaca et al. (2005) found that plant species and 71
rhizosphere microbial community affected aggregate stability. Moreno-Espíndola et al. (2007) 72
showed that root hairs increased soil adhesion to roots in sandy soils. These results emphasize 73
the importance of plant genotype on rhizosphere formation. While there has been a wealth of 74
research on how plant genotype affects the rhizosphere microbial community (Ehrenfeld et al., 75
2005; Berg & Smalla, 2009), a thorough understanding of the physical function of the 76
rhizosphere has lagged behind. There is, for instance, an ongoing debate as to whether 77
rhizosphere soil can hold more water than bulk soil (Carminati et al., 2010). There is evidence 78
for both lower (Brown et al., 1990; Grose et al., 1996; Daly et al., 2015) as well as higher 79
water content in the rhizosphere compared to bulk soil (Young, 1995; Carminati et al., 2010). 80
This is partly due to the difficulty of disentangling the biophysical and chemical factors that 81
drive rhizosphere function. Additionally, rhizosphere properties are dynamic in time and 82
depend upon root age (Hinsinger et al., 2005; Carminati & Vetterlein, 2013). The structure of 83
the pore space around roots has major implications for hydraulic properties, gas permeability, 84
and microbial habitats. Therefore, there is clearly potential for plant breeders to select 85
genotypes with improved root traits (White et al., 2013). 86
One set of root traits that offers significant potential for breeding is the density and length of 87
root hairs (Brown et al., 2013). Root hairs are thought to improve soil penetration and root 88
soil contact (Haling et al., 2013; Bengough et al., 2016). It is also commonly estimated that 89
they play a major role in efficient phosphorus uptake, particularly under limited P availability 90
(Bates & Lynch, 2001; Brown et al., 2013; Haling et al., 2013; Keyes et al., 2013). The 91
density and length of root hairs shows considerable variability in response to P availability 92
(Bates & Lynch, 1996; Ma et al., 2001), soil water regime, and soil compression (Haling et al., 93
2014). Despite their role in exudation (Head, 1964; Czarnota et al. 2003) and their potential 94
Page 3 of 36 New Phytologist
4
impact on microbial community structure (Bulgarelli et al., 2012; Bulgarelli et al., 2013) the 95
impact of root hairs on soil structure has received little attention. There is, however, evidence 96
that root hairs increase soil aggregation (Moreno-Espíndola et al., 2007) and are closely 97
linked to rhizosheath formation (George et al., 2014; Haling et al., 2014; Delhaize et al., 98
2015). 99
Root hair interactions with soil structure can now be investigated in situ with sufficient 100
resolution due to recent advances in non-invasive synchrotron radiation computed 101
tomography (SRCT). Keyes et al. (2013) used SRCT to image living root hairs growing in 102
soil. The 3D root and soil images can be used to build numerical models of water and solute 103
movement enabling soil structural changes to be linked to root uptake functions. The 104
combination of non-invasive imaging and mathematical modelling has been used to 105
understand the effect of root induced compaction on water flow in the rhizosphere (Aravena 106
et al., 2011; Aravena et al., 2014). Daly et al. (2015) used image-based modelling to assess 107
the influence of the rhizosphere on soil hydraulic properties. The effect of root hairs on P 108
uptake has been analysed with image based models by Keyes et al. (2013) and Daly et al. 109
(2016). These studies predict that, contrary to common past assumptions (e.g. Nye, 1966), 110
root hairs contribute less or equal to P uptake than the root surface. 111
In this paper we present an imaging study in which we analyse root hair interactions with 112
rhizosphere soil. The main goal of this study was to visualise and quantify soil structural 113
changes induced by roots with distinct root hair morphology to document the impact of root 114
hairs on soil structure. We tested two hypotheses: (i) that root hairs influence the pore 115
structure in the rhizosphere leading to a more structured soil and that (ii) these changes are 116
amplified by pore water fluctuations. To test these hypotheses we used the same hairless 117
barley (Hordeum vulgare cv. ‘Optic’) mutant studied by Haling et al. (2013) and Brown et al. 118
(2013), alongside its wildtype parent. A root growth experiment contrasted these genotypes 119
(hairs vs. no hairs) using small growth microcosms that enabled high resolution SRCT 120
imaging of root hairs and rhizosphere structure. We also used two contrasting water 121
treatments; a wetting-drying cycle (WD) and a single drying treatment (D) on the wildtype 122
plants to investigate the interactions between root hairs and soil water regime. Digital image 123
analysis was used to document and quantify the interactions between root hairs and soil 124
structure. As the link between structural and functional parameters remains a challenge, 125
numerical models were applied to the imaged geometries to simulate water and solute 126
movement in the rhizospheres of the contrasting genotypes. Our findings enhance our 127
Page 4 of 36New Phytologist

5
understanding of how rhizosphere formation is impacted by genotypic variations in root hair 128
density, and how these changes affect fundamental plant uptake processes. 129
130
Page 5 of 36 New Phytologist
6
Materials and Methods 131
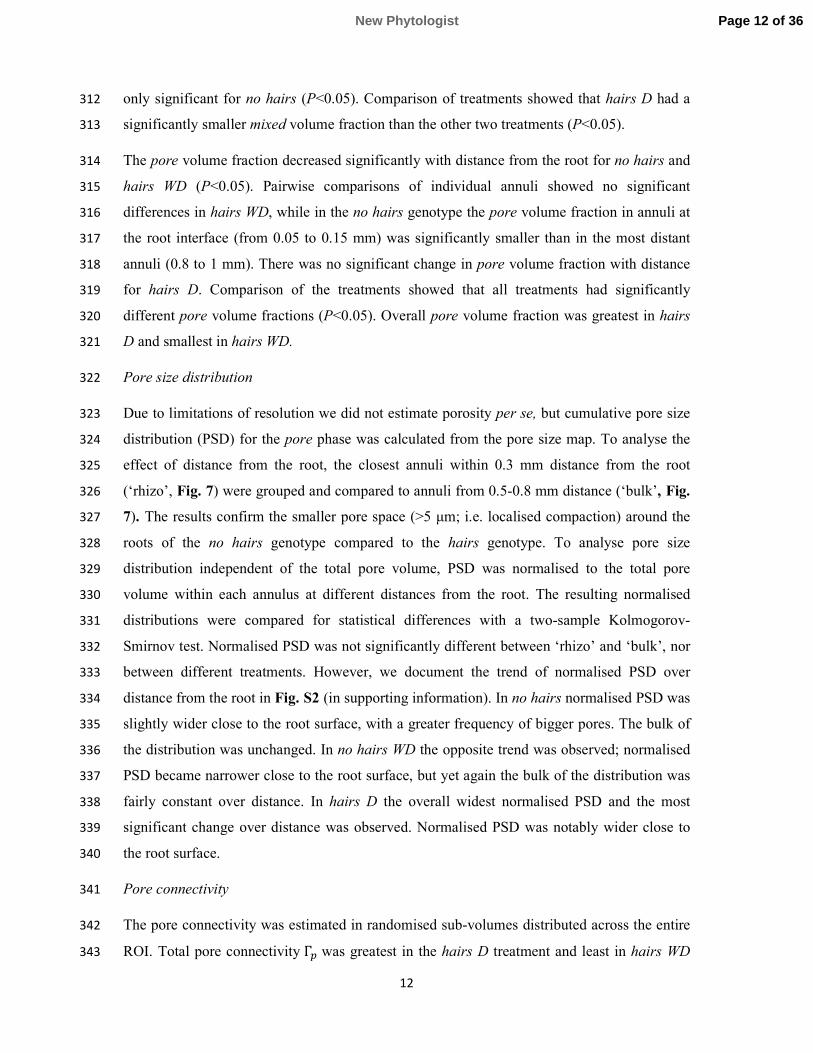
Plant growth and sample preparation 132
Individual barley plants (Hordeum vulgare cv. ‘Optic’) were grown in 3D printed seedling 133
holder microcosms, first used in Keyes et al. (2013). A root-hair bearing wildtype (henceforth 134
referred to as hairs) and a plant line with greatly decreased root hair growth (no hairs) as 135
described in Brown et al. (2012) were selected from the barley mutant population at The 136
James Hutton Institute (Caldwell et al., 2004). Seeds were pre-germinated on 1% distilled 137
water agar for 48 h. Seven 1 ml syringe barrels (h=80 mm, ØID = 4.2 mm) were inserted into 138
a larger tube of 30 mm diameter, and filled with sandy loam textured soil (Dystric Cambisol, 139
sieved to < 1 mm) to a density of 1.2 g cm-3. This soil was collected from the South 140
Bullionfield at the James Hutton Institute. Syringe barrels were connected to the microcosms 141
such that individual roots could grow into the syringe barrels (Fig. 1). A single barley 142
seedling was planted in each assembly. Plants were grown in a glasshouse (at approximately 143
20°C during the day) for 8 d before harvest. A preliminary experiment observed roots 144
growing through the tip of the syringe after 10 days. Tubes were connected to the base of each 145
syringe barrel, which were filled with water and connected to a reservoir that could be raised 146
or lowered. A wetting/drying (θ ~ 0.22 – 0.25 g g-1
) treatment (WD) was applied by lifting the 147
water table to saturation every 2 d and subsequently leaving samples to drain. An additional 148
drying (D) treatment (θ ~ 0.18 g g-1) was applied for the hairs genotype to explore the effect 149
of hydrological stresses on structure development within the rhizosphere. In the drying 150
treatment, plants were gently watered from the top with sufficient water to prevent desiccation, 151
with the tube removed from the base of the syringe barrel. Plants were transported live to the 152
Synchrotron and after harvest, individual syringe barrels were excised from the assemblies 153
and sealed with Parafilm. A total of 34 replicate roots were imaged. 154
Synchrotron radiation computed tomography (SRCT) 155
After plant growth, SRCT scanning was carried out at the I13 beamline at the Diamond Light 156
Source, Oxfordshire, UK. Individual syringe barrels were scanned at 3 different heights (3.5 157
mm apart) starting near the upper end of the syringe barrel to maximise the chance of finding 158
roots. This resulted in a total vertical extension of the scanned region of 10.5 mm, which 159
ensured that the scanned roots had comparable age. SRCT was performed using “pink light” 160
at energies of ~15-20 keV. In total, 1601 equiangular projections through 180 degrees were 161
recorded with an exposure time of 0.15 s per projection. The total duration of an individual 162
Page 6 of 36New Phytologist
7
scan was 4 min. X-rays were scintillated using a 500 µm Cadmium Tungstate (CdWO4) 163
scintillator, with a PCO edge 5.5 CMOS detector used to image the generated light. A 164
microscope system with a 4-fold optical magnification was used, resulting in a field of view 165
of 4 x 3.5 mm at 1.6 µm pixel size. The propagation distance was 63.5 mm leading to an 166
intermediate amount of phase contrast. Edge enhancement was estimated to be 20% of the 167
dynamic range, which complicated soil segmentation, but improved the visibility of root hairs. 168
Reconstruction of 3D images from the attenuation data was carried out with a filtered back-169
projection algorithm and converted to stacks of 2160 slices each comprising 2560 x 2560 170
pixels with 32 bit dynamic range. 171
172
Image pre-processing 173
Image analysis was performed in ImageJ and Avizo 9.0.1 (FEI Visualization Sciences Group, 174
USA). The contrast was enhanced using histogram equalisation, reconstructed images were 175
then converted to 8 bit to reduce the computational cost of image analysis. Since not all 34 176
replicates produced results viable for further analysis, a set of criteria for sample selection was 177
defined. Roots had to be closer to the centre of the syringe barrel than to the barrel wall to 178
reduce edge effects. Scans containing major macropores (N=6) in the analysed region or more 179
than one main root axis per syringe barrel (N=6) were removed. Additionally, shrunken and 180
potentially desiccated roots (N=6) were removed. This reduced the number of useful images 181
to 5 reps each for no hairs WD and hairs D, and 4 reps for hairs WD. In each viable image a 182
smaller region of interest (ROI) of 2 x 2 x 1 mm with a root in the centre was cropped for 183
further analysis (Fig. 2a). A rotational transformation was performed to ensure the root was in 184
the centre along the entire ROI height. 185
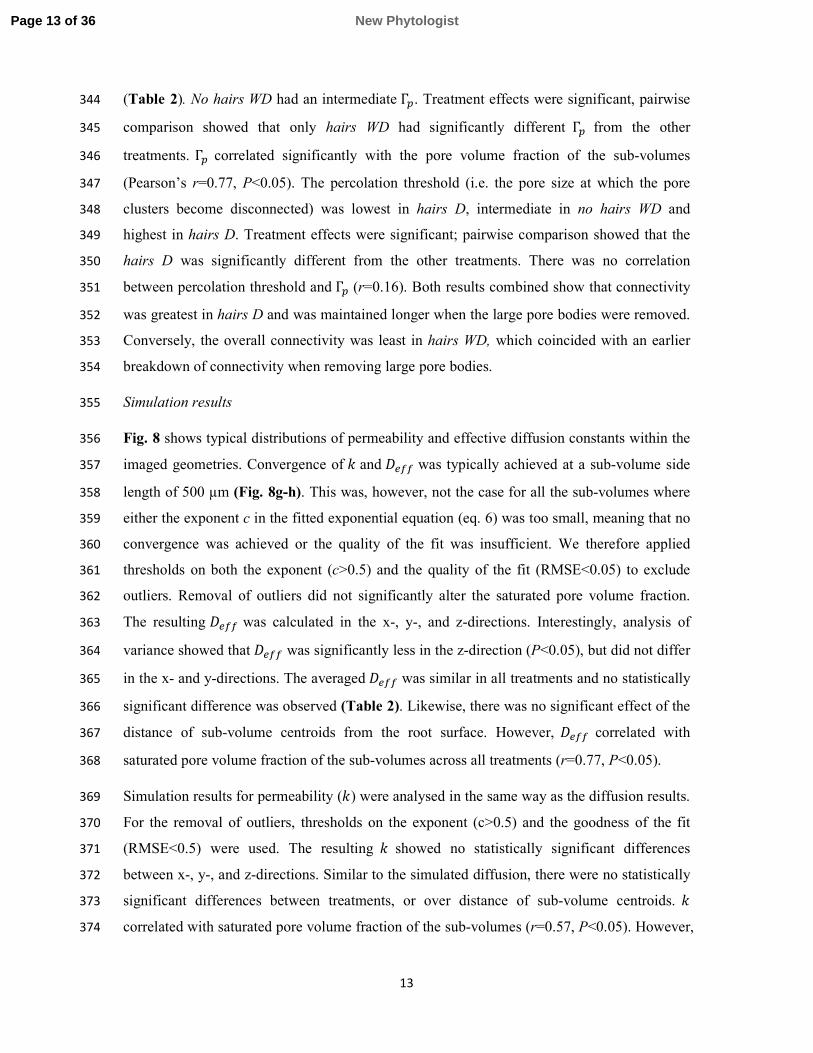
Segmentation 186
Roots and root hairs were segmented manually in Avizo 9.0.1 using a graphical tablet and 187
scrolling through horizontal slices. Soil was segmented into three different phases (Fig. 2b): 188
Primary minerals (Solid), air-filled pores (Pore), and a mixed phase comprising small, water 189
filled pores and silt/clay sized solid particles below resolution (Mixed). A detailed description 190
of the segmentation procedure is available as supporting information in the online version of 191
this article (Methods S1, Fig. S1, Table S1). 192
Quantification of structural parameters 193
Page 7 of 36 New Phytologist
8
Pore size distribution (PSD) was measured using the local thickness tool from “BoneJ” plugin 194
in ImageJ. The method generates a pore size map (Fig. 2c), where the grey value of each 195
point of the pore space represents the diameter of the largest ball that fits entirely into the pore 196
space and includes this point. PSD is given by the histogram of the resulting image. This 197
definition of PSD is closely related to the hydraulic behaviour of pores (Vogel et al., 2010). 198
The Euclidean distance transform of the binary root image was generated and segmented into 199
annuli (thickness = 50 µm) with increasing distance from the root surface. Root hair density 200
was calculated by skeletonising the root hairs and measuring the skeleton length density 201
within discrete annuli. Volume fractions of the distinct soil phases were calculated as the 202
volume of the considered phase within an annulus divided by the total annulus volume. 203
For measurement of pore connectivity and image-based modelling, N=20 cubic sub-volumes 204
of 500 µm side length were generated in each image. The size of the sub-volumes was chosen 205
based on convergence of simulated diffusion and permeability data (see the following section). 206
Coordinates of the sub-volumes were randomly selected with the constraint that a) the sub-207
volume had to be outside of the main root axis, and b) the maximum overlap between two 208
sub-volumes was 250 µm on any axis. 209
Pore connectivity was measured by labelling connected pore clusters (using the 18-connected 210
neighbourhood, i.e. any pixel that touches one of the faces or edges of the original pixel) and 211
calculating a dimensionless connectivity index (Renard & Allard, 2013) 212
Γ� =�
���∑
��� � , (1) 213
where any cluster of the pore phase � has a volume , �� is the number of clusters and �� is 214
the total volume of the pore phase. For the calculation of Γ� the volume of each individual 215
cluster and the total pore volume within each subvolume were determined and Equation 1 was 216
solved. This was subsequently repeated for subsets of the pore space which included only 217
pores of decreasing maximum diameter. This was done by thresholding the pore size map at 218
incrementally reduced thresholds with steps of 10 µm. This procedure simulates a drying 219
experiment and gives an estimation of pore connectivity at decreasing soil matric potentials. 220
To calculate the percolation threshold, i.e. the pore size at which the pore clusters become 221
disconnected, a logistic equation was fitted to the data 222
����� = ��,���
�����������, (2) 223
Page 8 of 36New Phytologist
9
where Γ�, !" is the connectivity of the entire pore space, � is maximum pore diameter and �# 224
is the maximum pore diameter at the percolation threshold. 225
226
Image based modelling of effective diffusion and permeability 227
For the image based modelling the same set of sub-volumes created for the connectivity 228
measurement was used. For each sub-volume an STL surface mesh was generated using 229
ScanIP (Simpleware Ltd, Exeter, UK). We used saturated conditions, i.e. pore and mixed 230
phases were combined to produce the fluid phase. For every sub-volume, 7 smaller test-231
volumes of different sizes were generated. This was done to ensure that the final sub-volumes 232
were representative elementary volumes (REV), i.e. their pore geometry is representative for 233
the pore geometry of the entire sample. These were numbered 0 to 6. The side length of the 234
test-volumes can be calculated using 235
$% =&�'
�(, (3) 236
where $ is the test-volume side length, $# is the original sub-volume side length and ) is the 237
test-volume number ()=0 corresponds to the largest and )=6 corresponds to the smallest). 238
For each test-volume, separate simulations were carried out to measure the impedance to 239
solute diffusion and the hydraulic permeability in the x, y, and z directions, respectively. 240
Impedance to diffusion presented by the soil was calculated in terms of an effective diffusion 241
constant *��� from the soil geometry using the method described in detail in Daly et al. 242
(2016). 243
If the sub-volume qualifies as a REV solute diffusion in the soil is thus described by: 244
+,
-.= / ∙ �* ∙ *���/1�, (4) 245
where * is diffusion constant in pure water, and 1 is solute concentration. 246
Likewise, the hydraulic permeability 2 offered by soil geometry was calculated. The detailed 247
method is described in Tracy et al. (2015). Given an external fluid pressure gradient, the 248
resulting velocity is 249
3 = −5
6�/� − 789:;�, (5) 250
Page 9 of 36 New Phytologist
10
where < is the viscosity of the fluid, � is the applied pressure, 7 is the density of the fluid and 251
8=9.8 is the acceleration due to gravity, and 9:; is the unit vector in the vertical direction. 252
Numerical simulations (N=5880 for each 2 and *���) were carried out using OpenFOAM, an 253
open source fluid dynamics toolbox on IRIDIS, the High Performance Computing Facility at 254
the University of Southampton. *��� and 2 are soil properties; however, if the domain is too 255
small to qualify as an REV they are also a function of the domain size. To overcome this, 2 256
and *��� were fitted with the functions 257
*��� = = + ?@AB&, or 2 = = + ?@AB&, (6) 258
Where =, ? and C are fitting parameters and $ is the side length of the domain. The fitted 259
diffusion coefficient is the limit of this equation as $ tends to infinity, i.e., *��� = =. 260
Statistical analysis was carried out in Matlab 2015a (The MathWorks Inc, Natick, USA). We 261
used ANOVA for normally distributed variables and Kruskal Wallis Test for non-parametric 262
data. For pairwise post hoc comparison the Dunn-Bonferroni approach was used. 263
Results 264
Overall plant performance 265
The no hairs genotype had a significantly greater fresh shoot mass and plant height, while the 266
drying treatment had no significant effect on shoot mass or plant height (Table 1). Where 267
roots had grown into syringe barrels, they generally extended along the entire length of the 268
barrels (8 cm), but in some cases roots escaped the lower end of the barrels. 269
In the SRCT images roots could be clearly distinguished from soil, including root internal 270
structure, i.e. intercellular and aerenchymous spaces. Root diameter, obtained by measuring 271
the area of the segmented root in each slice and assuming a cylindrical shape, showed no 272
significant difference between genotypes (Table 1). 273
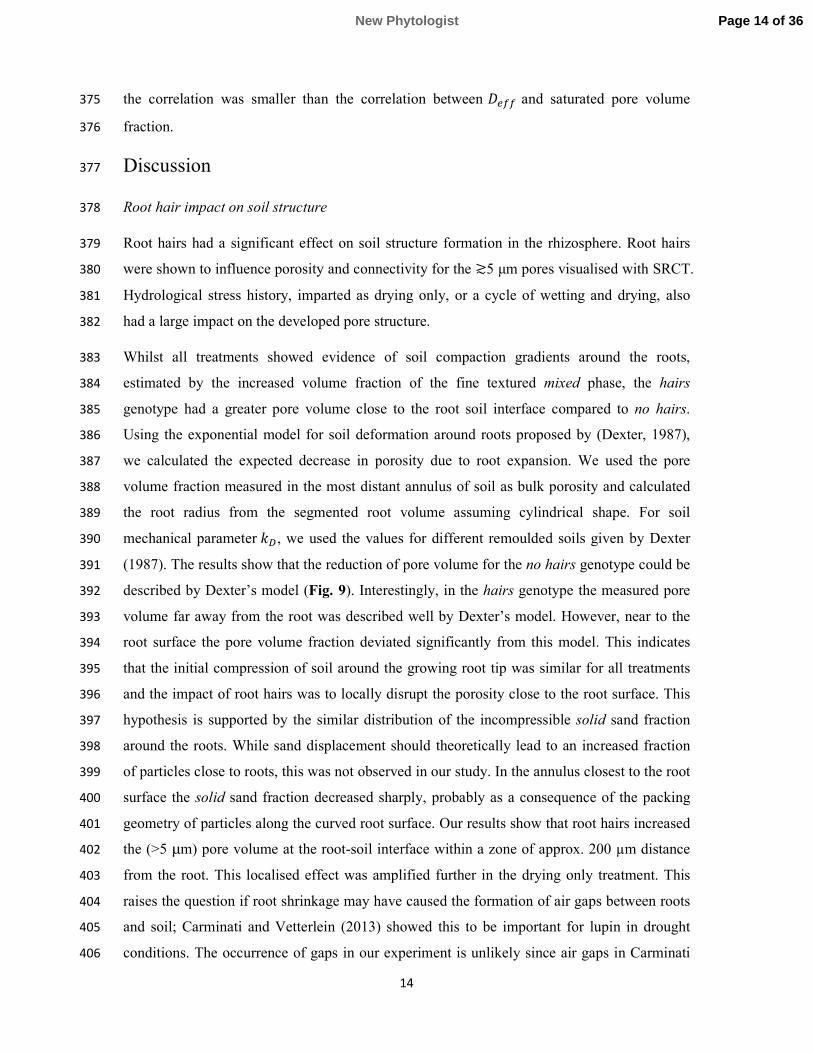
Root hair density 274
Root hairs were clearly visualised in air-filled pores, but they were more difficult to detect 275
within the mixed phase. To avoid error induced by subjective user interpretation, only clearly 276
visible root hairs were segmented. Some of the resulting root hair structures were fragmented 277
and disconnected (Fig. 3) indicating that root hairs grew into both the air-filled pore phase 278
and the mixed phase. The average number of root hairs counted at the immediate root surface 279
Page 10 of 36New Phytologist
11
along a 1 mm root segment (derived from counting discrete skeletons) was 24, ranging from 0 280
in the no hairs genotype to 60 in the hairs genotype and D treatment. The resulting mean root 281
hair densities (RHD) at the immediate root surface were highly variable, ranging from 5.4 mm 282
mm-3
to 94.2 mm mm-3
in the hairs genotype. RHD decreased exponentially with distance 283
from the root surface (Fig. 4) and was not significantly different between D and WD 284
treatments. To explain the larger variability of RHD close to the root, we calculated the 285
correlation coefficient between RHD and pore volume fraction within each distance class. 286
RHD was significantly correlated with pore volume fraction within the 0.3 mm volume 287
closest to the root (Pearson’s r>0.7, P<0.05), but further away from the root no correlation 288
between hair density and pore volume was found. 289
The no hairs genotypes bore short root hair stumps, which only grew within the innermost 290
0.05 mm from the root surface. Further away from the root no hairs were found for the no-291
hairs genotype. RHD within the innermost annulus was 3.6 mm mm-3 for no hairs, which was 292
significantly less than for hairs D (P<0.05) but not hairs WD (probably due to the large 293
variability in hair length density within this narrow zone). 294
Soil structure 295
The soil segmentation resulted in images consisting of three phases; the pore phase, 296
consisting of air-filled pores ≳5 µm, a mixed phase consisting of smaller water filled pores 297
and solid particles of the silt and clay fractions, and a solid phase consisting of larger particles 298
with undetectable internal porosity. As previously noted, the segmentation results showed a 299
slight over-estimation of the mixed phase caused by partial volume effects. There was 300
substantial overlap of the grey values of the different phases (Fig. 5), which was intensified 301
by the edge enhancement due to phase contrast. This was especially true for the mixed phase, 302
which had a large impact from edges that causes a broad grey-value histogram. 303
Volume fractions of the different phases were analysed with distance from the root surface to 304
quantify the impact of root activity on soil structure (Fig. 6). Solid volume fraction was 305
uniform across the ROI, but sharply decreased close to the root surface, although the effect of 306
distance was only significant for no hairs and hairs D (P<0.05). There was no significant 307
difference in solid volume between treatments. 308
The mixed phase showed an increased volume fraction close to the root surface for all 309
treatments. In the no hairs genotype this increase was larger and extended further away from 310
the root surface. The effect of distance on mixed phase volume fraction was consequently 311
Page 11 of 36 New Phytologist
12
only significant for no hairs (P<0.05). Comparison of treatments showed that hairs D had a 312
significantly smaller mixed volume fraction than the other two treatments (P<0.05). 313
The pore volume fraction decreased significantly with distance from the root for no hairs and 314
hairs WD (P<0.05). Pairwise comparisons of individual annuli showed no significant 315
differences in hairs WD, while in the no hairs genotype the pore volume fraction in annuli at 316
the root interface (from 0.05 to 0.15 mm) was significantly smaller than in the most distant 317
annuli (0.8 to 1 mm). There was no significant change in pore volume fraction with distance 318
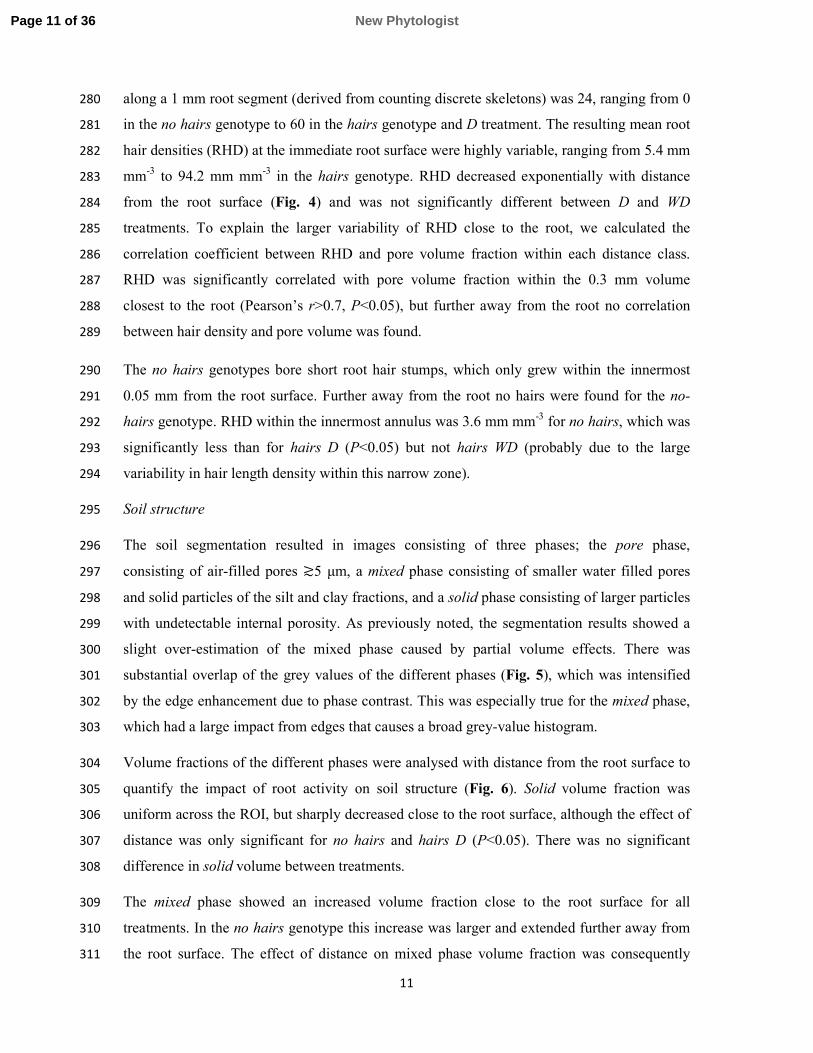
for hairs D. Comparison of the treatments showed that all treatments had significantly 319
different pore volume fractions (P<0.05). Overall pore volume fraction was greatest in hairs 320
D and smallest in hairs WD. 321
Pore size distribution 322
Due to limitations of resolution we did not estimate porosity per se, but cumulative pore size 323
distribution (PSD) for the pore phase was calculated from the pore size map. To analyse the 324
effect of distance from the root, the closest annuli within 0.3 mm distance from the root 325
(‘rhizo’, Fig. 7) were grouped and compared to annuli from 0.5-0.8 mm distance (‘bulk’, Fig. 326
7). The results confirm the smaller pore space (>5 µm; i.e. localised compaction) around the 327
roots of the no hairs genotype compared to the hairs genotype. To analyse pore size 328
distribution independent of the total pore volume, PSD was normalised to the total pore 329
volume within each annulus at different distances from the root. The resulting normalised 330
distributions were compared for statistical differences with a two-sample Kolmogorov-331
Smirnov test. Normalised PSD was not significantly different between ‘rhizo’ and ‘bulk’, nor 332
between different treatments. However, we document the trend of normalised PSD over 333
distance from the root in Fig. S2 (in supporting information). In no hairs normalised PSD was 334
slightly wider close to the root surface, with a greater frequency of bigger pores. The bulk of 335
the distribution was unchanged. In no hairs WD the opposite trend was observed; normalised 336
PSD became narrower close to the root surface, but yet again the bulk of the distribution was 337
fairly constant over distance. In hairs D the overall widest normalised PSD and the most 338
significant change over distance was observed. Normalised PSD was notably wider close to 339
the root surface. 340
Pore connectivity 341
The pore connectivity was estimated in randomised sub-volumes distributed across the entire 342
ROI. Total pore connectivity Γ� was greatest in the hairs D treatment and least in hairs WD 343
Page 12 of 36New Phytologist
13
(Table 2). No hairs WD had an intermediate Γ�. Treatment effects were significant, pairwise 344
comparison showed that only hairs WD had significantly different Γ� from the other 345
treatments. Γ� correlated significantly with the pore volume fraction of the sub-volumes 346
(Pearson’s r=0.77, P<0.05). The percolation threshold (i.e. the pore size at which the pore 347
clusters become disconnected) was lowest in hairs D, intermediate in no hairs WD and 348
highest in hairs D. Treatment effects were significant; pairwise comparison showed that the 349
hairs D was significantly different from the other treatments. There was no correlation 350
between percolation threshold and Γ� (r=0.16). Both results combined show that connectivity 351
was greatest in hairs D and was maintained longer when the large pore bodies were removed. 352
Conversely, the overall connectivity was least in hairs WD, which coincided with an earlier 353
breakdown of connectivity when removing large pore bodies. 354
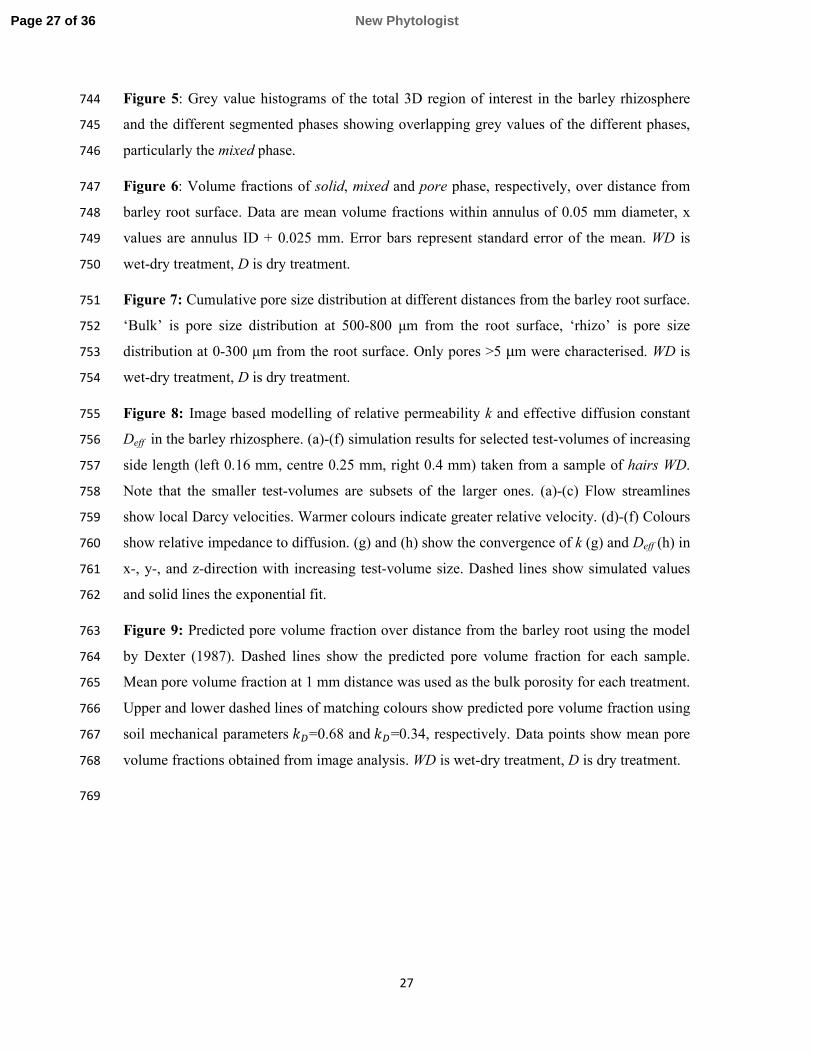
Simulation results 355
Fig. 8 shows typical distributions of permeability and effective diffusion constants within the 356
imaged geometries. Convergence of 2 and *��� was typically achieved at a sub-volume side 357
length of 500 µm (Fig. 8g-h). This was, however, not the case for all the sub-volumes where 358
either the exponent c in the fitted exponential equation (eq. 6) was too small, meaning that no 359
convergence was achieved or the quality of the fit was insufficient. We therefore applied 360
thresholds on both the exponent (c>0.5) and the quality of the fit (RMSE<0.05) to exclude 361
outliers. Removal of outliers did not significantly alter the saturated pore volume fraction. 362
The resulting *��� was calculated in the x-, y-, and z-directions. Interestingly, analysis of 363
variance showed that *��� was significantly less in the z-direction (P<0.05), but did not differ 364
in the x- and y-directions. The averaged *��� was similar in all treatments and no statistically 365
significant difference was observed (Table 2). Likewise, there was no significant effect of the 366
distance of sub-volume centroids from the root surface. However, *��� correlated with 367
saturated pore volume fraction of the sub-volumes across all treatments (r=0.77, P<0.05). 368
Simulation results for permeability (2) were analysed in the same way as the diffusion results. 369
For the removal of outliers, thresholds on the exponent (c>0.5) and the goodness of the fit 370
(RMSE<0.5) were used. The resulting 2 showed no statistically significant differences 371
between x-, y-, and z-directions. Similar to the simulated diffusion, there were no statistically 372
significant differences between treatments, or over distance of sub-volume centroids. 2 373
correlated with saturated pore volume fraction of the sub-volumes (r=0.57, P<0.05). However, 374
Page 13 of 36 New Phytologist
14
the correlation was smaller than the correlation between *��� and saturated pore volume 375
fraction. 376
Discussion 377
Root hair impact on soil structure 378
Root hairs had a significant effect on soil structure formation in the rhizosphere. Root hairs 379
were shown to influence porosity and connectivity for the ≳5 µm pores visualised with SRCT. 380
Hydrological stress history, imparted as drying only, or a cycle of wetting and drying, also 381
had a large impact on the developed pore structure. 382
Whilst all treatments showed evidence of soil compaction gradients around the roots, 383
estimated by the increased volume fraction of the fine textured mixed phase, the hairs 384
genotype had a greater pore volume close to the root soil interface compared to no hairs. 385
Using the exponential model for soil deformation around roots proposed by (Dexter, 1987), 386
we calculated the expected decrease in porosity due to root expansion. We used the pore 387
volume fraction measured in the most distant annulus of soil as bulk porosity and calculated 388
the root radius from the segmented root volume assuming cylindrical shape. For soil 389
mechanical parameter 2E, we used the values for different remoulded soils given by Dexter 390
(1987). The results show that the reduction of pore volume for the no hairs genotype could be 391
described by Dexter’s model (Fig. 9). Interestingly, in the hairs genotype the measured pore 392
volume far away from the root was described well by Dexter’s model. However, near to the 393
root surface the pore volume fraction deviated significantly from this model. This indicates 394
that the initial compression of soil around the growing root tip was similar for all treatments 395
and the impact of root hairs was to locally disrupt the porosity close to the root surface. This 396
hypothesis is supported by the similar distribution of the incompressible solid sand fraction 397
around the roots. While sand displacement should theoretically lead to an increased fraction 398
of particles close to roots, this was not observed in our study. In the annulus closest to the root 399
surface the solid sand fraction decreased sharply, probably as a consequence of the packing 400
geometry of particles along the curved root surface. Our results show that root hairs increased 401
the (>5 µm) pore volume at the root-soil interface within a zone of approx. 200 µm distance 402
from the root. This localised effect was amplified further in the drying only treatment. This 403
raises the question if root shrinkage may have caused the formation of air gaps between roots 404
and soil; Carminati and Vetterlein (2013) showed this to be important for lupin in drought 405
conditions. The occurrence of gaps in our experiment is unlikely since air gaps in Carminati 406
Page 14 of 36New Phytologist
15
and Vetterlein (2013) appear after prolonged drought conditions not present in our study. 407
Note that we did not measure porosity per se, as the imaging resolution did not permit the 408
identification of pores < 5 µm. 409
Soil porosity is often divided into a textural and a structural component, where the textural 410
component is determined by the distribution of primary soil minerals, and the remaining 411
porosity is the structural component (Nimmo, 1997). In our study, the air filled pore phase is 412
roughly identical to the structural component. The volume of the structural component is 413
expected to decrease upon soil compression (Kutílek et al., 2006), which matches our 414
observation in the no hairs genotype. However, in the hairs genotype we observed a 415
secondary increase in detectable pore structure, signifying a shift from smaller to larger pores. 416
Interestingly, pore size distributions were fairly stable and did not show an obvious pattern for 417
either treatment. Upon compression, the fraction of large pores is expected to decrease, but in 418
no hairs a decrease of the largest pore fraction was only observed within 200 µm distance 419
from the root surface, where a local maximum was observed. Further away from the root the 420
fraction of larger pores decreased again, which is counterintuitive. We point out that the initial 421
soil conditions were fairly heterogeneous as evidenced by the large variability of pore size 422
distribution, which may explain this observation. In the hairs genotype a similar pattern was 423
observed for the WD treatment only which indicates an impact of the multiple drying and 424
rewetting cycles. The frequency of smaller structural pores is expected to increase with each 425
drying cycle at the expense of larger pores (Leij et al., 2002). Drying cycles will be more 426
severe close to the root surface, hence this effect could only be observed close to the root. 427
The results suggest greater pore structure formation away from the root for the plants with 428
root hairs. It is likely that this is driven by the expansion of the hydraulic gradient from the 429
root surface due to root hair activity as suggested by Segal et al. (2008). Figs. 7 and 9 430
demonstrate the combined importance of the hydraulic stress and root hairs on the 431
development of pore structure. Many studies have demonstrated the importance of wetting-432
drying cycles, and the presence of biological exudates, to soil structure formation (Peng et al., 433
2011). Direct physical rearrangement of soil particles by growing root hairs is another 434
plausible mechanism, as it has been shown that root hairs are able to deform moderately 435
resistant clays (Champion & Barley, 1969) and are able to transmit tensile forces between 436
root and soil (Bengough et al., 2016). 437
Page 15 of 36 New Phytologist
16
While structural differences between the hairs and no hairs genotypes were generally 438
confined to a volume of approx. 200 µm diameter around the root, we observed significant 439
differences in the overall connectivity of the pore phase between the genotypes. However, 440
connectivity is a function of pore size (Vogel, 1997) and the differences observed in this study 441
were mostly explained by differences in pore volume fraction of the measured sub-volumes. 442
The biggest differences were observed between the different wetting treatments. The 443
percolation threshold was unaffected by the genotype but was significantly smaller in the 444
drying only treatment, which indicates a higher pore-neck connectivity. Both results 445
emphasize the impact of hydraulic drivers on pore structure. 446
Image based modelling 447
Simulation results showed that the effective saturated diffusion and permeability were 448
unaffected by both genotype and water treatment. Likewise, the centroid distance of the sub-449
volumes from the root surface had no significant effect on both *��� and 2. The sub-volume 450
size which qualified as a REV was ≈ 500 µm. This was too large to measure the effect of 451
distance to the root surface. Since diffusion and permeability were simulated in saturated 452
conditions, no significant differences were to be expected, because the combined pore and 453
mixed fractions were unaffected by the treatment. However, both *��� and 2 correlated with 454
tsaturated pore volume fraction, which allowed their behaviour to be predicted in unsaturated 455
conditions, i.e. when water and solute flow are constrained to the mixed phase. Assuming that 456
the unresolved internal porosity within the mixed phase was similar between treatments, the 457
resistance to water and solute flow should be related to the volume fraction of the mixed 458
phase, which was greater close to roots in the no hairs genotype. This suggests that root hairs 459
may decrease unsaturated hydraulic conductivity and solute diffusivity in the rhizosphere 460
compared to hairless genotypes. Although this suggests that both water and nutrient uptake by 461
the root would be impeded in unsaturated conditions in the hairs genotype, uptake by hairs 462
might counteract this impact. The role of root hairs in resource capture remains poorly 463
understood, although Segal et al. (2008) found that no hairs mutants were less effective at 464
drying rhizosphere soil. Even if root hairs do not take up water directly, they may provide 465
film flow pathways for water by bridging air-filled pores. While previous image based 466
modelling studies showed that greater inter-aggregate contacts caused by root-induced 467
compaction allow plants to extract more water from the soil (Aravena et al., 2011; Aravena et 468
al., 2014) we show that root hairs may significantly alter this effect. 469
Page 16 of 36New Phytologist
17
Root hair quantification 470
In agreement with Keyes et al. (2013) we show that SRCT is appropriate to visualise how 471
pore morphology is affected by root hair – soil interactions. However, there are some 472
limitations. Root hairs were clearly visible within air-filled pores, but when they were 473
growing along soil minerals or within the mixed phase they were rendered invisible due to the 474
smaller contrast to the surrounding medium. This is an important limitation, which leads to an 475
underestimation of root hair density. This may potentially be overcome by increasing 476
propagation distance between scintillator and detector to increase edge enhancement or by 477
using simultaneous phase and amplitude extraction algorithms (Paganin et al., 2002). The 478
observed root hair densities were less than the numbers reported for rice roots (Daly et al., 479
2016), which may be related to species differences or to the open textured growth medium 480
that these authors used. We clearly show that root hair density correlated with air-filled pore 481
volume within 300 µm from the root surface, which can indicate both a lower detection rate 482
and a smaller actual root hair density. While no significant difference in hair density was 483
found between the D and WD treatments, we note that the detection rate of root hairs may be 484
lower in hairs WD as a consequence of the lower pore volume fraction at the surface 485
compared with hairs D. On the other hand, undetected root hairs may potentially increase the 486
volume fraction of the mixed soil phase and consequently decrease the pore phase. Given the 487
small volume of root hairs, the effect would be small compared to the observed differences in 488
pore volume. Assuming a low hair detection rate of 10%, average root hair density at the 489
immediate soil-root interface would be 270 mm mm-3
, which would translate to a difference 490
in pore volume fraction of 1.4 % for hairs of 8 µm diameter. 491
The fragmentation of the visualised root hairs clearly shows that they grew in both the air-492
filled pore phase and the mixed phase, with transitions between these phases. Notwithstanding 493
the limitations, comparison with destructive root hair measurements allows an estimation of 494
the fraction of root hairs growing in air-filled pores. Light microscope measurements of root 495
hair density in different barley lines have shown densities of up to 240 hairs mm-1
(Haling et 496
al., 2010), which is an order of magnitude higher than the average measured in this study (24 497
hairs mm-1). This suggests that the majority of hairs are found within the fine textured mixed 498
phase. Additionally, root hair counts were based on skeletonisation, which is unable to 499
distinguish root hairs that are entangled. However, Daly et al. (2016) reported that root hair 500
densities measured in SRCT images were greater than those found in destructive analysis. 501
Clearly, direct comparisons of SRCT images and microscope measurements of the same root 502
Page 17 of 36 New Phytologist
18
sections are needed to confirm this. We found root hairs at distances of up to 800 µm away 503
from the root, which was the maximum distance we analysed. This is not surprising, as 504
previous work with the same genotype had determined that average root hair length was 505
around 800 µm in similar soil conditions (Brown et al., 2012). The absence of root hairs at 506
greater distances than 50 µm from the root surface in the no hairs genotype confirms that the 507
structures we found were indeed root hairs and not fungal hyphae, which can have similar size 508
and shape. 509
In conclusion, the present study confirms that SRCT is a suitable technique to visualise root 510
hair interactions with soil. The technique offers sufficient contrast and resolution to segment 511
soil and root structures including root hairs that grow in air-filled pores. However, hairs 512
growing in fine textured regions are not readily detectable. We showed that root hairs can 513
counteract the effect of root-induced soil compaction by significantly increasing pore volume 514
fraction at the root-soil interface. Image based modelling predicted that these alterations 515
would not significantly affect diffusion and hydraulic conductivity under saturated conditions, 516
and are therefore estimated to have negligible impact on root water and solute uptake. 517
However, it is likely that the mixed phase containing fine pores will have a substantial effect 518
on transport into the root under a wide range of unsaturated conditions. The present study 519
focused on local changes within short segments of roots at the same soil depth with 520
comparable developmental stage. Changes of rhizosphere structure over root length or age 521
and comparing roots of different diameters were beyond the scope of this work. As part of our 522
research program our follow-on studies focus on dynamics of rhizosphere formation. 523
524
Acknowledgments 525
L.J.C., N.K. I.S and T.R. are funded by BBSRC SARISA BB/L025620/1. K.R.D is funded by 526
ERC 646809DIMR. L.K.B, P.D.H., T.S.G., M.N., and A.R. are funded by BBSRC 527
BB/J00868/1 and A.G.B. is funded by BB/L025825/1. The James Hutton Institute receives 528
financial support from the Rural & Environment Science & Analytical Services Division of 529
the Scottish Government. I.S. and T.R. are also funded by EPSRC EP/M020355/1. T.R. is 530
also funded by ERC 646809DIMR, BBSRC SARIC BB/P004180/1 and NERC NE/L00237/1. 531
The authors acknowledge the use of the I13 beamline at Diamond Light Source, Oxfordshire, 532
UK (Session ID: MT9659). We would like to thank beamline scientist Dr Mirian Garcia 533
Page 18 of 36New Phytologist
19
Fernandez, who provided considerable help during our beamtime. Additionally, Diamond 534
Light Source funded travel for 3 people. 535
The authors acknowledge the use of the IRIDIS High Performance Computing Facility, and 536
associated support services at the University of Southampton, in the completion of this work. 537
All data supporting this study are available on request from the University of Southampton 538
repository at http://dx.doi.org/10.5258/SOTON/D0116 539
Author contributions 540
Design of the study: N.K., S.D.K. P.D.H., T.S.G., A.G.B., and T.R. 541
Data collection: S.D.K., A.R., P.D.H., A.G.B., T.S.G., and L.K.B. 542
Data analysis and interpreatation: N.K. 543
Modelling: K.R.D. 544
Drafting the manuscript: N.K. 545
Critical revision and approval of publication: N.K., K.R.D., S.D.K., T.S.G., L.K.B., A. R., 546
L.J.C., M.N., A.G.B., I.S., P.D.H. and T.R. 547
548
549
Page 19 of 36 New Phytologist
20
References 550
Albalasmeh AA, Ghezzehei TA. 2014. Interplay between soil drying and root exudation in 551
rhizosheath development. Plant and Soil 374: 739-751. 552
Aravena JE, Berli M, Ghezzehei TA, Tyler SW. 2011. Effects of Root-Induced 553
Compaction on Rhizosphere Hydraulic Properties - X-ray Microtomography Imaging 554
and Numerical Simulations. Environmental Science & Technology 45: 425-431. 555
Aravena JE, Berli M, Ruiz S, Suárez F, Ghezzehei TA, Tyler SW. 2014. Quantifying 556
coupled deformation and water flow in the rhizosphere using X-ray microtomography 557
and numerical simulations. Plant and Soil 376: 95-110. 558
Bates TR, Lynch JP. 1996. Stimulation of root hair elongation in Arabidopsis thaliana by 559
low phosphorus availability. Plant, Cell & Environment 19: 529-538. 560
Bates TR, Lynch JP. 2001. Root hairs confer a competitive advantage under low phosphorus 561
availability. Plant and Soil 236: 243-250. 562
Bengough AG, Loades K, McKenzie BM. 2016. Root hairs aid soil penetration by 563
anchoring the root surface to pore walls. Journal of Experimental Botany 67: 1071-564
1078. 565
Bengough AG, McKenzie BM, Hallett PD, Valentine TA. 2011. Root elongation, water 566
stress, and mechanical impedance: a review of limiting stresses and beneficial root tip 567
traits. Journal of Experimental Botany 62: 59-68. 568
Berg G, Smalla K. 2009. Plant species and soil type cooperatively shape the structure and 569
function of microbial communities in the rhizosphere. FEMS Microbiology Ecology 570
68: 1-13. 571
Brown JM, Kramer PJ, Cofer GP, Johnson GA. 1990. Use of nuclear magnetic resonance 572
microscopy for noninvasive observations of root-soil water relations. Theoretical and 573
Applied Climatology 42: 229-236. 574
Brown LK, George TS, Dupuy LX, White PJ. 2013. A conceptual model of root hair 575
ideotypes for future agricultural environments: what combination of traits should be 576
targeted to cope with limited P availability? Annals of Botany 112: 317-330. 577
Brown LK, George TS, Neugebauer K, White PJ. 2017. The Rhizosheath – A potential 578
trait for future agricultural sustainability occurs in orders throughout the Angiosperms. 579
Plant and Soil, in press. doi:10.1007/s11104-017-3220-2 580
Brown LK, George TS, Thompson JA, Wright G, Lyon J, Dupuy L, Hubbard SF, White 581
PJ. 2012. What are the implications of variation in root hair length on tolerance to 582
Page 20 of 36New Phytologist
21
phosphorus deficiency in combination with water stress in barley (Hordeum vulgare)? 583
Annals of Botany 110: 319-328. 584
Bruand A, Cousin I, Nicoullaud B, Duval O, Bégon JC. 1996. Backscattered Electron 585
Scanning Images of Soil Porosity for Analyzing Soil Compaction around Roots. Soil 586
Science Society of America Journal 60: 895-901. 587
Bulgarelli D, Rott M, Schlaeppi K, Ver Loren van Themaat E, Ahmadinejad N, Assenza 588
F, Rauf P, Huettel B, Reinhardt R, Schmelzer E, et al. 2012. Revealing structure 589
and assembly cues for Arabidopsis root-inhabiting bacterial microbiota. Nature 488: 590
91-95. 591
Bulgarelli D, Schlaeppi K, Spaepen S, van Themaat EVL, Schulze-Lefert P. 2013. 592
Structure and functions of the bacterial microbiota of plants. Annual Review of Plant 593
Biology 64: 807-838. 594
Caldwell DG, McCallum N, Shaw P, Muehlbauer GJ, Marshall DF, Waugh R. 2004. A 595
structured mutant population for forward and reverse genetics in Barley (Hordeum 596
vulgare L.). The Plant Journal 40: 143-150. 597
Caravaca F, Alguacil MM, Torres P, Roldán A. 2005. Plant type mediates rhizospheric 598
microbial activities and soil aggregation in a semiarid Mediterranean salt marsh. 599
Geoderma 124: 375-382. 600
Carminati A, Moradi AB, Vetterlein D, Vontobel P, Lehmann E, Weller U, Vogel H-J, 601
Oswald SE. 2010. Dynamics of soil water content in the rhizosphere. Plant and Soil 602
332: 163-176. 603
Carminati A, Vetterlein D. 2013. Plasticity of rhizosphere hydraulic properties as a key for 604
efficient utilization of scarce resources. Annals of Botany 112: 277-290. 605
Champion RA, Barley KP. 1969. Penetration of Clay by Root Hairs. Soil Science 108: 402-606
407. 607
Czarnes S, Hallett PD, Bengough AG, Young IM. 2000. Root- and microbial-derived 608
mucilages affect soil structure and water transport. European Journal of Soil Science 609
51: 435-443. 610
Czarnota MA, Paul RN, Weston LA, Duke SO. 2003. Anatomy of Sorgoleone‐Secreting 611
Root Hairs of Sorghum Species. International Journal of Plant Sciences 164: 861-866. 612
Daly KR, Keyes SD, Masum S, Roose T. 2016. Image-based modelling of nutrient 613
movement in and around the rhizosphere. Journal of Experimental Botany 67: 1059-614
1070. 615
Page 21 of 36 New Phytologist
22
Daly KR, Mooney SJ, Bennett MJ, Crout NMJ, Roose T, Tracy SR. 2015. Assessing the 616
influence of the rhizosphere on soil hydraulic properties using X-ray computed 617
tomography and numerical modelling. Journal of Experimental Botany 66: 2305-2314. 618
Delhaize E, Rathjen TM, Cavanagh CR. 2015. The genetics of rhizosheath size in a 619
multiparent mapping population of wheat. Journal of Experimental Botany 66: 4527-620
4536. 621
Dexter AR. 1987. Compression of soil around roots. Plant and Soil 97: 401-406. 622
Ehrenfeld JG, Ravit B, Elgersma K. 2005. Feedback in the plant soil system. Annual 623
Review of Environment and Resources 30: 75-115. 624
Feeney DS, Crawford JW, Daniell T, Hallett PD, Nunan N, Ritz K, Rivers M, Young IM. 625
2006. Three-dimensional Microorganization of the Soil–Root–Microbe System. 626
Microbial Ecology 52: 151-158. 627
George TS, Brown LK, Ramsay L, White PJ, Newton AC, Bengough AG, Russell J, 628
Thomas WTB. 2014. Understanding the genetic control and physiological traits 629
associated with rhizosheath production by barley (Hordeum vulgare). New Phytologist 630
203: 195-205. 631
Grose MJ, Gilligan CA, Spencer D, Goddard BVD. 1996. Spatial heterogeneity of soil 632
water around single roots: use of CT-scanning to predict fungal growth in the 633
rhizosphere. New Phytologist 133: 261-272. 634
Haling RE, Brown LK, Bengough AG, Valentine TA, White PJ, Young IM, George TS. 635
2014. Root hair length and rhizosheath mass depend on soil porosity, strength and 636
water content in barley genotypes. Planta 239: 643-651. 637
Haling RE, Brown LK, Bengough AG, Young IM, Hallett PD, White PJ, George TS. 638
2013. Root hairs improve root penetration, root–soil contact, and phosphorus 639
acquisition in soils of different strength. Journal of Experimental Botany 64: 3711-640
3721. 641
Haling RE, Simpson RJ, Delhaize E, Hocking PJ, Richardson AE. 2010. Effect of lime on 642
root growth, morphology and the rhizosheath of cereal seedlings growing in an acid 643
soil. Plant and Soil 327: 199-212. 644
Hallett PD, Feeney DS, Bengough AG, Rillig MC, Scrimgeour CM, Young IM. 2009. 645
Disentangling the impact of AM fungi versus roots on soil structure and water 646
transport. Plant and Soil 314: 183-196. 647
Head GC. 1964. A Study of ‘Exudation’ from the Root Hairs of Apple Roots by Time-lapse 648
Cine-photomicrography. Annals of Botany 28: 495-498. 649
Page 22 of 36New Phytologist
23
Hinsinger P, Bengough AG, Vetterlein D, Young IM. 2009. Rhizosphere: biophysics, 650
biogeochemistry and ecological relevance. Plant and Soil 321: 117-152. 651
Hinsinger P, Gobran GR, Gregory PJ, Wenzel WW. 2005. Rhizosphere geometry and 652
heterogeneity arising from root-mediated physical and chemical processes. New 653
Phytologist 168: 293-303. 654
Keyes SD, Daly KR, Gostling NJ, Jones DL, Talboys P, Pinzer BR, Boardman R, 655
Sinclair I, Marchant A, Roose T. 2013. High resolution synchrotron imaging of 656
wheat root hairs growing in soil and image based modelling of phosphate uptake. New 657
Phytologist 198: 1023-1029. 658
Kutílek M, Jendele L, Panayiotopoulos KP. 2006. The influence of uniaxial compression 659
upon pore size distribution in bi-modal soils. Soil and Tillage Research 86: 27-37. 660
Leij FJ, Ghezzehei TA, Or D. 2002. Modeling the dynamics of the soil pore-size distribution. 661
Soil and Tillage Research 64: 61-78. 662
Ma Z, Bielenberg DG, Brown KM, Lynch JP. 2001. Regulation of root hair density by 663
phosphorus availability in Arabidopsis thaliana. Plant, Cell & Environment 24: 459-664
467. 665
Moreno-Espíndola IP, Rivera-Becerril F, de Jesús Ferrara-Guerrero M, De León-666
González F. 2007. Role of root-hairs and hyphae in adhesion of sand particles. Soil 667
Biology and Biochemistry 39: 2520-2526. 668
Nimmo JR. 1997. Modeling structural influences on soil water retention. Soil Science Society 669
of America Journal 61: 712-719. 670
Nye PH. 1966. The effect of the nutrient intensity and buffering power of a soil, and the 671
absorbing power, size and root hairs of a root, on nutrient absorption by diffusion. 672
Plant and Soil 25: 81-105. 673
Paganin D, Mayo SC, Gureyev TE, Miller PR, Wilkins SW. 2002. Simultaneous phase and 674
amplitude extraction from a single defocused image of a homogeneous object. Journal 675
of Microscopy 206: 33-40. 676
Peng X, Hallett PD, Zhang B, Horn R. 2011. Physical response of rigid and non-rigid soils 677
to analogues of biological exudates. European Journal of Soil Science 62: 676-684. 678
Renard P, Allard D. 2013. Connectivity metrics for subsurface flow and transport. Advances 679
in Water Resources 51: 168-196. 680
Segal, E, Kushnir, T, Mualem, Y, Shani, U. 2008. Water uptake and hydraulics of the root 681
hair rhizosphere. Vadose Zone Journal 7: 1027-1034. 682
Page 23 of 36 New Phytologist
24
Tracy SR, Daly KR, Sturrock CJ, Crout NMJ, Mooney SJ, Roose T. 2015. Three-683
dimensional quantification of soil hydraulic properties using X-ray Computed 684
Tomography and image-based modeling. Water Resources Research 51: 1006-1022. 685
Vogel HJ. 1997. Morphological determination of pore connectivity as a function of pore size 686
using serial sections. European Journal of Soil Science 48: 365-377. 687
Vogel HJ, Weller U, Schlüter S. 2010. Quantification of soil structure based on Minkowski 688
functions. Computers & Geosciences 36: 1236-1245. 689
Vollsnes AV, Futsaether CM, Bengough AG. 2010. Quantifying rhizosphere particle 690
movement around mutant maize roots using time-lapse imaging and particle image 691
velocimetry. European Journal of Soil Science 61: 926-939. 692
Watt M, McCully ME, Canny MJ. 1994. Formation and Stabilization of Rhizosheaths of 693
Zea mays L. (Effect of Soil Water Content). Plant Physiology 106: 179-186. 694
Whalley WR, Riseley B, Leeds-Harrison PB, Bird NRA, Leech PK, Adderley WP. 2005. 695
Structural differences between bulk and rhizosphere soil. European Journal of Soil 696
Science 56: 353-360. 697
White PJ, George TS, Gregory PJ, Bengough AG, Hallett PD, McKenzie BM. 2013. 698
Matching roots to their environment. Annals of Botany 112: 207-222. 699
Young IM. 1995. Variation in moisture contents between bulk soil and the rhizosheath of 700
wheat (Triticum-aestivum L. cv Wembley). New Phytologist 130: 135-139. 701
Young IM. 1998. Biophysical interactions at the root–soil interface: a review. The Journal of 702
Agricultural Science 130: 1-7. 703
704
Page 24 of 36New Phytologist
25
Supporting Information 705
Fig. S1: Assessment of WEKA segmentation process 706
Table S1: Performance of iterative WEKA segmentation process 707
Methods S1: Segmentation procedure 708
Fig. S2: Normalised cumulative pore size distribution (PSD) over distance from the root 709
surface. 710
711
Tables 712
713
Table 1:Measured parametersof barley plants. 714
Plant height
[cm]
Fresh shoot
mass
[g]
# roots analysed Root diameter
[mm]
hairs WD 7.3 ± 2.1 64.5 ± 25.2 4 0.47 ± 0.02
hairs D 8.0 ± 0.6 65.3 ± 11.1 5 0.47 ± 0.03
no hairs WD 10.4 ± 1.3* 107.3 ± 23.9* 5 0.49 ± 0.02
715
Data are mean ± standard deviation. Asterisks denote significant differences between 716
treatments (P<0.05). WD denotes wet-dry treatment, D denotes dry treatment. 717
Table 2: Connectivity parameters and simulation results of barley rhizosphere. 718
Treatment FG total
Percolation threshold
[µm pore size]
Pore volume fraction
(Saturated pore volume
fraction)
[-]
Simulated
H9II
[-]
Simulated J
[X 10-6 cm2]
No hairs
WD
0.81 ± 0.23 53 ± 13 0.22 ± 0.07 (0.69 ±
0.08)
0.78 ± 0.12 1.48 ± 0.83
Hairs WD 0.73 ± 55 ± 14 0.19 ± 0.07 (0.70 ± 0.80 ± 0.07 1.47 ± 0.95
Page 25 of 36 New Phytologist
26
0.24* 0.06)
Hairs D 0.86 ± 0.21 48 ± 14* 0.23 ± 0.07 (0.71 ±
0.08)
0.80 ± 0.06 1.60 ± 0.99
Data are mean ± standard deviation in N=100 sub-volumes (80 in the case of hairs WD) per 719
treatment. *��� is the average relative effective diffusion coefficient in fully saturated soil, 2 720
is average saturated permeability, and Γ� is the dimensionless connectivity index described in 721
Equation 1. Asterisks denote statistical differences between treatments. WD denotes wet-dry 722
treatment, D denotes dry treatment. Size of the individual sub-volumes was 500 x 500 x 500 723
mm. 724
Captions to figures 725
Figure 1: Schematic drawing of the root growth assembly used for barley roots in this study. 726
The bottom of the seed compartment was designed to guide individual roots into syringe 727
barrels. There were seven syringe barrels connected to each seed compartment. 728
Figure 2: (a) Cross-section of barley root (no hairs) growing in soil. Internal root structures 729
and the surrounding soil structure could be clearly visualised. Scale bar = 1mm. (b): Soil 730
classification using trainable Weka segmentation. Black represents solid phase, white the 731
mixed phase, and grey air filled pore space. Note, that the root was segmented independently. 732
(c): Pore size classification around the root. Segmented root is shown in white. Colours 733
indicate local pore diameter in microns. 734
Figure 3: 3D rendered barley root (hairs wet-dry) and hairs including a region of interest 735
showing the surrounding soil. Light blue structure is the segmented root, dark blue structures 736
are segmented root hairs within a ROI of 2x2x1 mm. Vertical length of the root is 1 mm. Only 737
root hairs growing in air filled pores could be seen, hence root hair structures are fragmented. 738
Figure 4: Mean root hair density of barley roots over distance from the root surface. Each 739
value represents mean root hair density within an annulus of thickness 0.05 mm about the root 740
centre. X values represent the ID + 0.025 mm of each annulus. Error bars represent standard 741
error of the mean. No hairs genotype only had short hairs in the innermost annulus. WD is 742
wet-dry treatment, D is dry treatment. 743
Page 26 of 36New Phytologist
27
Figure 5: Grey value histograms of the total 3D region of interest in the barley rhizosphere 744
and the different segmented phases showing overlapping grey values of the different phases, 745
particularly the mixed phase. 746
Figure 6: Volume fractions of solid, mixed and pore phase, respectively, over distance from 747
barley root surface. Data are mean volume fractions within annulus of 0.05 mm diameter, x 748
values are annulus ID + 0.025 mm. Error bars represent standard error of the mean. WD is 749
wet-dry treatment, D is dry treatment. 750
Figure 7: Cumulative pore size distribution at different distances from the barley root surface. 751
‘Bulk’ is pore size distribution at 500-800 µm from the root surface, ‘rhizo’ is pore size 752
distribution at 0-300 µm from the root surface. Only pores >5 µm were characterised. WD is 753
wet-dry treatment, D is dry treatment. 754
Figure 8: Image based modelling of relative permeability k and effective diffusion constant 755
Deff in the barley rhizosphere. (a)-(f) simulation results for selected test-volumes of increasing 756
side length (left 0.16 mm, centre 0.25 mm, right 0.4 mm) taken from a sample of hairs WD. 757
Note that the smaller test-volumes are subsets of the larger ones. (a)-(c) Flow streamlines 758
show local Darcy velocities. Warmer colours indicate greater relative velocity. (d)-(f) Colours 759
show relative impedance to diffusion. (g) and (h) show the convergence of k (g) and Deff (h) in 760
x-, y-, and z-direction with increasing test-volume size. Dashed lines show simulated values 761
and solid lines the exponential fit. 762
Figure 9: Predicted pore volume fraction over distance from the barley root using the model 763
by Dexter (1987). Dashed lines show the predicted pore volume fraction for each sample. 764
Mean pore volume fraction at 1 mm distance was used as the bulk porosity for each treatment. 765
Upper and lower dashed lines of matching colours show predicted pore volume fraction using 766
soil mechanical parameters 2E=0.68 and 2E=0.34, respectively. Data points show mean pore 767
volume fractions obtained from image analysis. WD is wet-dry treatment, D is dry treatment. 768
769
Page 27 of 36 New Phytologist
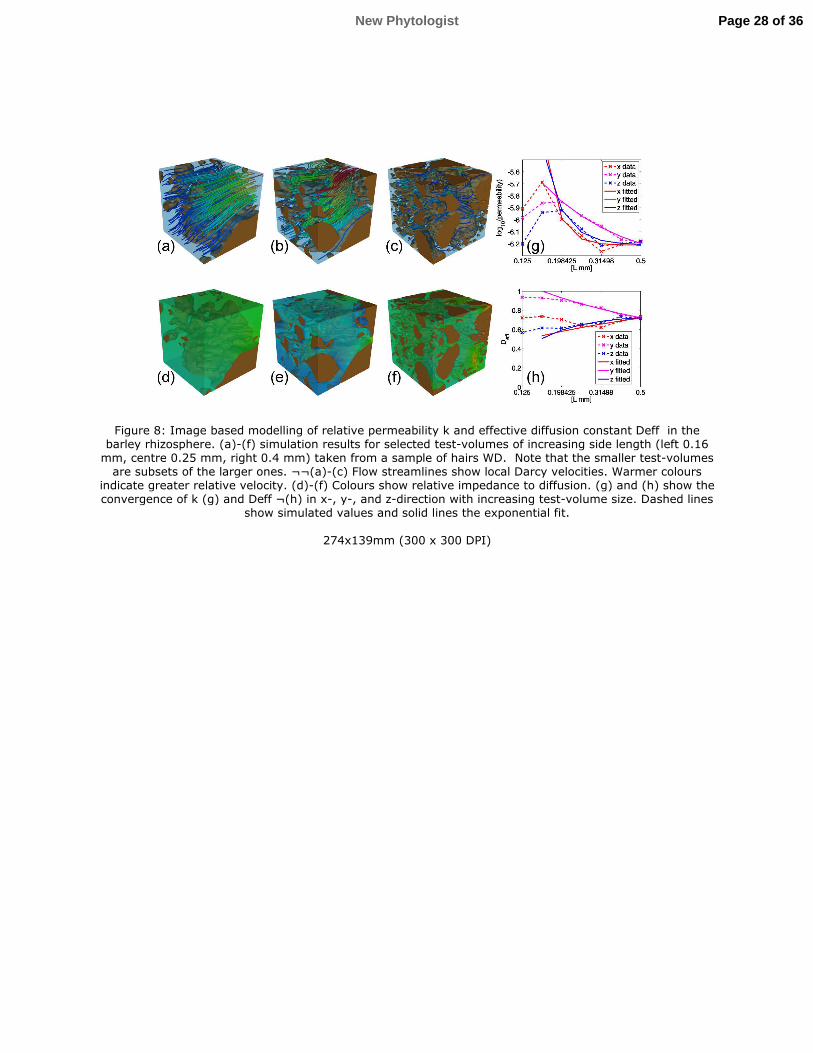
Figure 8: Image based modelling of relative permeability k and effective diffusion constant Deff in the barley rhizosphere. (a)-(f) simulation results for selected test-volumes of increasing side length (left 0.16 mm, centre 0.25 mm, right 0.4 mm) taken from a sample of hairs WD. Note that the smaller test-volumes
are subsets of the larger ones. ¬¬(a)-(c) Flow streamlines show local Darcy velocities. Warmer colours indicate greater relative velocity. (d)-(f) Colours show relative impedance to diffusion. (g) and (h) show the convergence of k (g) and Deff ¬(h) in x-, y-, and z-direction with increasing test-volume size. Dashed lines
show simulated values and solid lines the exponential fit.
274x139mm (300 x 300 DPI)
Page 28 of 36New Phytologist
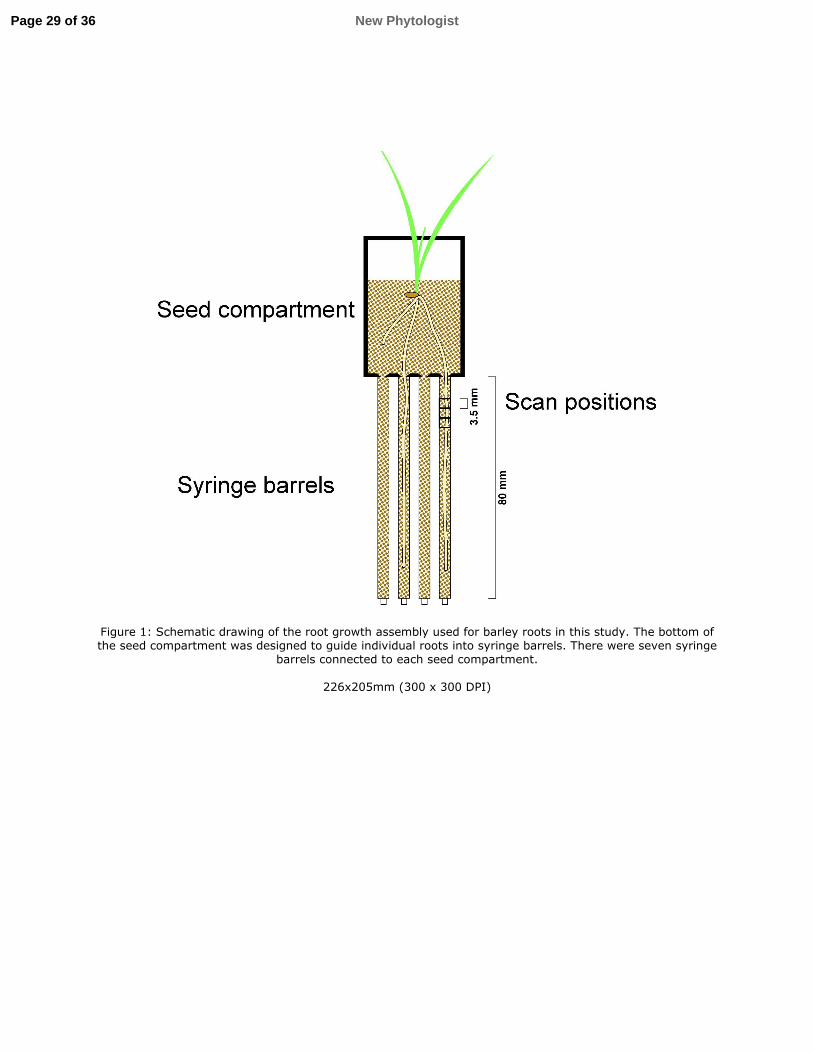
Figure 1: Schematic drawing of the root growth assembly used for barley roots in this study. The bottom of the seed compartment was designed to guide individual roots into syringe barrels. There were seven syringe
barrels connected to each seed compartment.
226x205mm (300 x 300 DPI)
Page 29 of 36 New Phytologist
Figure 2: (a) Cross-section of barley root (no hairs) growing in soil. Internal root structures and the surrounding soil structure could be clearly visualised. Scale bar = 1mm. (b): Soil classification using
trainable Weka segmentation. Black represents solid phase, white the mixed phase, and grey air filled pore space. Note, that the root was segmented independently. (c): Pore size classification around the root.
Segmented root is shown in white. Colours indicate local pore diameter in microns.
296x209mm (300 x 300 DPI)
Page 30 of 36New Phytologist
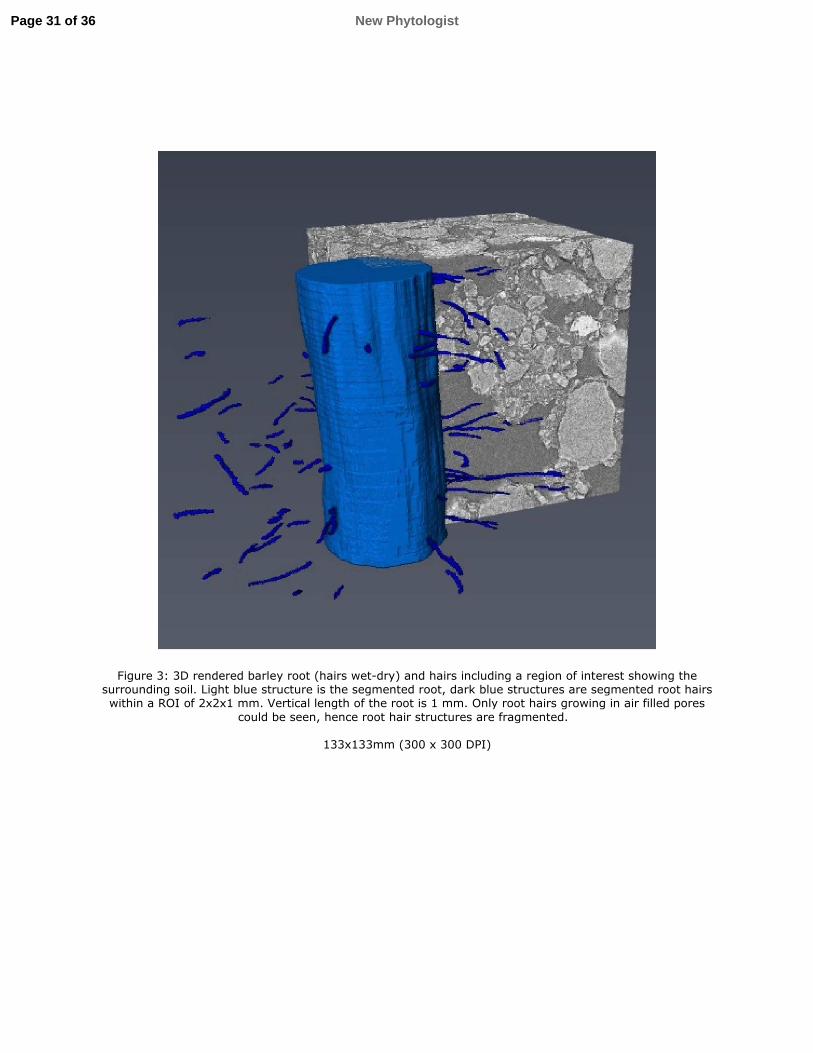
Figure 3: 3D rendered barley root (hairs wet-dry) and hairs including a region of interest showing the surrounding soil. Light blue structure is the segmented root, dark blue structures are segmented root hairs within a ROI of 2x2x1 mm. Vertical length of the root is 1 mm. Only root hairs growing in air filled pores
could be seen, hence root hair structures are fragmented.
133x133mm (300 x 300 DPI)
Page 31 of 36 New Phytologist
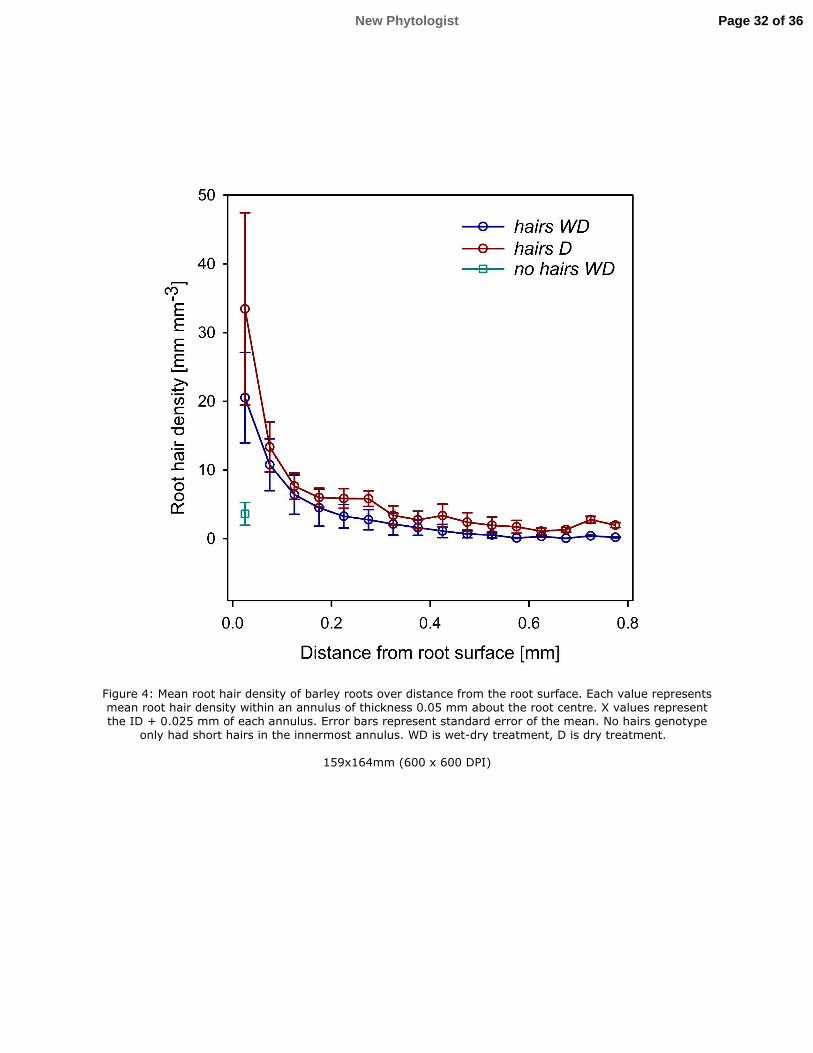
Figure 4: Mean root hair density of barley roots over distance from the root surface. Each value represents mean root hair density within an annulus of thickness 0.05 mm about the root centre. X values represent the ID + 0.025 mm of each annulus. Error bars represent standard error of the mean. No hairs genotype
only had short hairs in the innermost annulus. WD is wet-dry treatment, D is dry treatment.
159x164mm (600 x 600 DPI)
Page 32 of 36New Phytologist
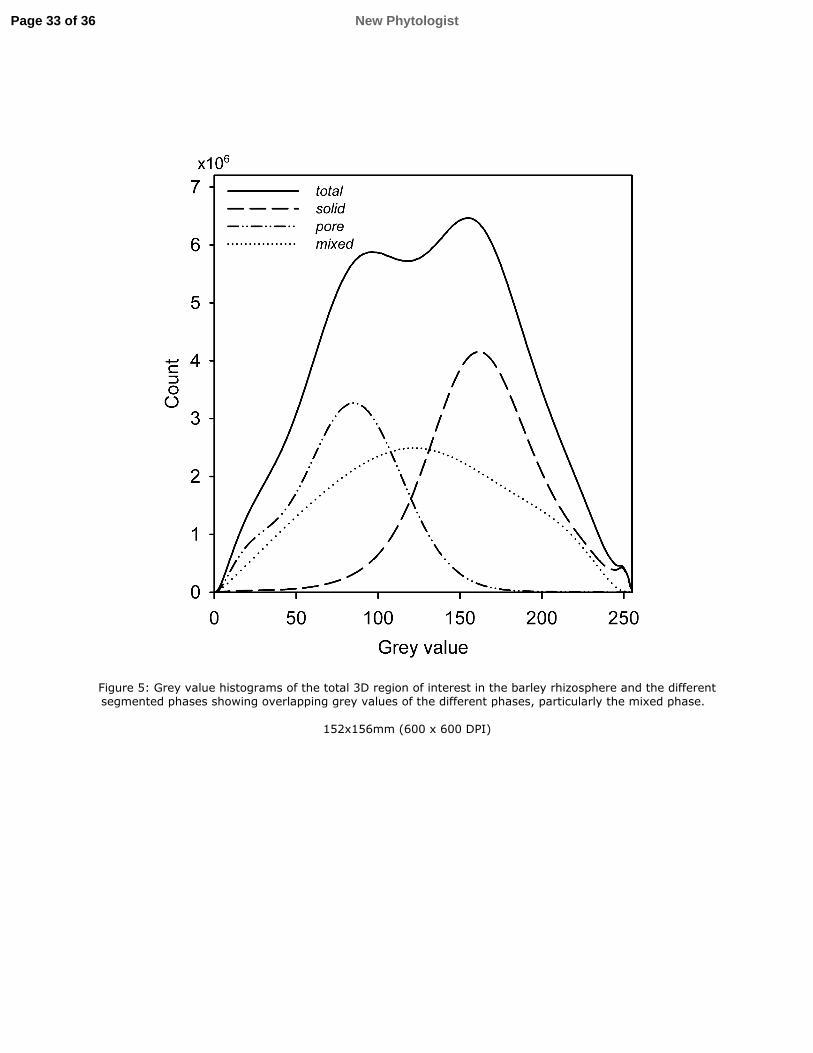
Figure 5: Grey value histograms of the total 3D region of interest in the barley rhizosphere and the different segmented phases showing overlapping grey values of the different phases, particularly the mixed phase.
152x156mm (600 x 600 DPI)
Page 33 of 36 New Phytologist
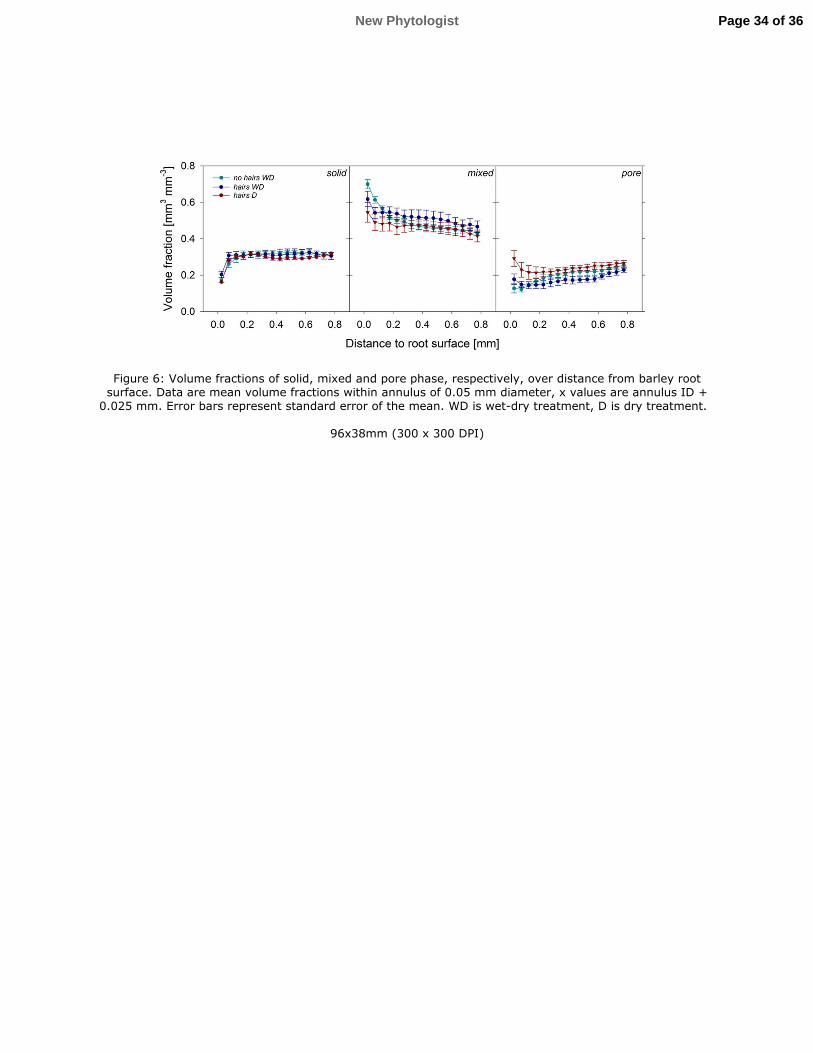
Figure 6: Volume fractions of solid, mixed and pore phase, respectively, over distance from barley root surface. Data are mean volume fractions within annulus of 0.05 mm diameter, x values are annulus ID +
0.025 mm. Error bars represent standard error of the mean. WD is wet-dry treatment, D is dry treatment.
96x38mm (300 x 300 DPI)
Page 34 of 36New Phytologist
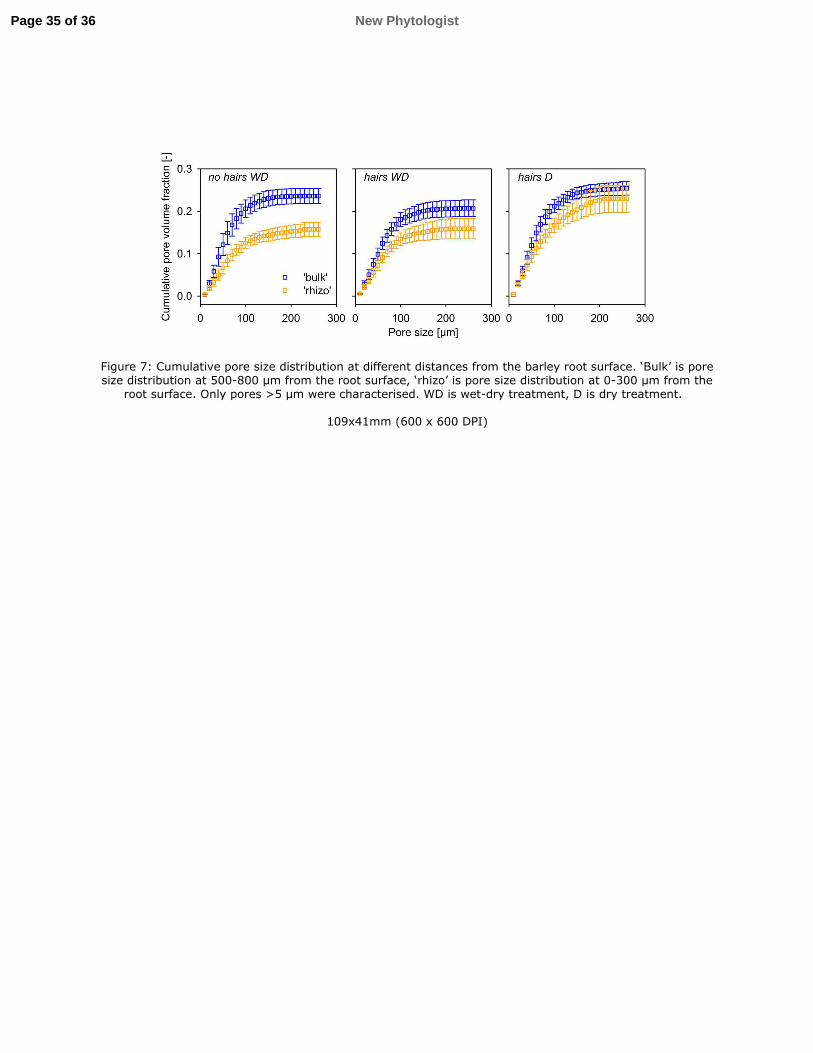
Figure 7: Cumulative pore size distribution at different distances from the barley root surface. ‘Bulk’ is pore size distribution at 500-800 µm from the root surface, ‘rhizo’ is pore size distribution at 0-300 µm from the
root surface. Only pores >5 µm were characterised. WD is wet-dry treatment, D is dry treatment.
109x41mm (600 x 600 DPI)
Page 35 of 36 New Phytologist
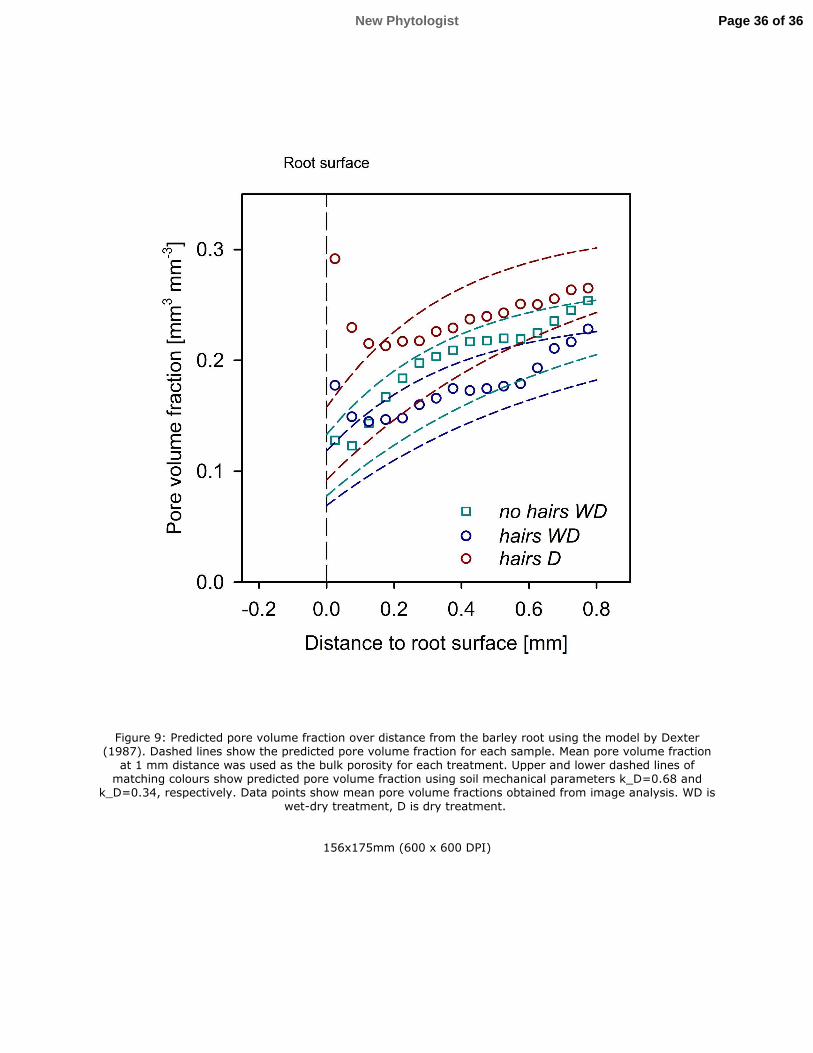
Figure 9: Predicted pore volume fraction over distance from the barley root using the model by Dexter (1987). Dashed lines show the predicted pore volume fraction for each sample. Mean pore volume fraction
at 1 mm distance was used as the bulk porosity for each treatment. Upper and lower dashed lines of matching colours show predicted pore volume fraction using soil mechanical parameters k_D=0.68 and
k_D=0.34, respectively. Data points show mean pore volume fractions obtained from image analysis. WD is wet-dry treatment, D is dry treatment.
156x175mm (600 x 600 DPI)
Page 36 of 36New Phytologist