Embed Size (px)
Citation preview

High-Resolution Polarimetric Radar Observations of Snow-Generating Cells
MATTHEW R. KUMJIAN*
Advanced Study Program, National Center for Atmospheric Research,1 Boulder, Colorado
STEVEN A. RUTLEDGE
Department of Atmospheric Science, Colorado State University, Fort Collins, Colorado
ROY M. RASMUSSEN
Research Applications Laboratory, National Center for Atmospheric Research, Boulder, Colorado
PATRICK C. KENNEDY
Department of Atmospheric Science, Colorado State University, Fort Collins, Colorado
MIKE DIXON
Research Applications Laboratory, National Center for Atmospheric Research, Boulder, Colorado
(Manuscript received 9 October 2013, in final form 30 January 2014)
ABSTRACT
High-resolution X-band polarimetric radar data were collected in 19 snowstorms over northern Colorado in
early 2013 as part of the Front Range Orographic Storms (FROST) project. In each case, small, vertically erect
convective turrets were observed near the echo top. These ‘‘generating cells’’ are similar to those reported in the
literature and are characterized by ;1-km horizontal and vertical dimensions, vertical velocities of 1–2ms21,
and lifetimes of at least 10min. In some cases, these generating cells are enshrouded by enhanced differential
reflectivity ZDR, indicating a ‘‘shroud’’ of pristine crystals enveloping the larger, more isotropic particles. The
anticorrelation of radar reflectivity factor at horizontal polarization ZH and ZDR suggests ongoing aggregation
or riming of particles in the core of generating cells. For cases in which radiosonde datawere collected, potential
instability was found within the layer in which generating cells were observed. The persistence of these layers
suggests that radiative effects are important, perhaps by some combination of cloud-top cooling and release of
latent enthalpy through depositional and riming growth of particles within the cloud. The implications for the
ubiquity of generating cells and their role as a mechanism for ice crystal initiation and growth are discussed.
1. Introduction
During the 2013 snow season in north-central Colorado
(January–May), scientists at the National Center for
Atmospheric Research (NCAR) and Colorado State
University (CSU) ran a pilot field experiment to study
the finescale structure of winter storms. Called the Front
Range Orographic Storms (FROST) project, the study
involved intensive radar measurements that were taken
during winter precipitation events. FROST leveraged the
ongoing Solid Precipitation Intercomparison Experi-
ment (SPICE; http://www.wmo.int/pages/prog/www/IMOP/
intercomparisons.html), which aims to quantify uncertainty
associated with snow gauge measurements of winter pre-
cipitation, with the eventual goal of improving quantitative
precipitation estimates. As part of SPICE, NCAR has
deployed a suite of automated snow gauges at its Marshall
Field Site (MFS) in north-central Colorado (Rasmussen
*Current affiliation: Department of Meteorology, The Penn-
sylvania State University, University Park, Pennsylvania.1The National Center for Atmospheric Research is sponsored
by the National Science Foundation.
Corresponding author address: Dr. Matthew R. Kumjian, Dept.
of Meteorology, The Pennsylvania State University, 513 Walker,
University Park, PA 16802.
E-mail: [email protected]
1636 JOURNAL OF APPL IED METEOROLOGY AND CL IMATOLOGY VOLUME 53
DOI: 10.1175/JAMC-D-13-0312.1
� 2014 American Meteorological Society
et al. 2012; Fig. 1). MFS, nestled against the Front Range
of theRockyMountains, also served as the central facility
for operations during FROST.
Themain goals of FROST-2013 were to investigate the
finescale structure of winter storms along the Colorado
Front Range, to document and quantify the microphysi-
cal processes occurring in such storms, and to relate re-
motely sensed quantities to the surface precipitation
type and intensity, capitalizing on the rich surface datasets
available from SPICE. FROST employed two X-band
polarimetric radars with specialized scanning strategies.
The two X-band radars used were CSU’s University of
Chicago–Illinois State Water Survey radar (CSU-CHILL;
Bringi et al. 2011) and NCAR’s mobile X-band polari-
metric radar (NCAR-XPOL; see the appendix for de-
tails). In addition to these research radars, routine
surveillance scan data from theNationalWeather Service
Weather Surveillance Radar-1988 Doppler (WSR-88D)
near Denver, Colorado (KFTG), were available. All ra-
dars used for FROST are dual polarization, operating in
the mode of simultaneous transmission and reception of
horizontally and vertically polarized waves. This mode of
operation allows for the measurements of radar re-
flectivity factor at horizontal polarization ZH; differ-
ential reflectivity ZDR; differential propagation phase
shift FDP, from which the specific differential phase
KDP is calculated by following the method ofWang and
Chandrasekar (2009); and the copolar correlation co-
efficient rhy. More information on the polarimetric radar
variables can be found in the textbooks of Doviak and
Zrni�c (1993) and Bringi and Chandrasekar (2001), as wel
as the studies by Zrni�c and Ryzhkov (1999), Straka et al.
(2000), Ryzhkov et al. (2005), and Kumjian (2013a–c). In
addition to the radar data, special radiosondes were
launched from MFS during storm events. These supple-
mented the regular National Weather Service soundings
taken two times per day from near Denver (DNR). Fig-
ure 1 shows the relative locations of the X-band radars
(NCAR-XPOL is at MFS), KFTG, and DNR.
CSU-CHILL was recently outfitted to have dual-
wavelength capabilities by adding an X-band trans-
mitter to the preexisting S-band transmitter (e.g.,
Junyent et al. 2013; F. Junyent et al. 2014, manuscript
submitted toBull. Amer.Meteor. Soc.). For the purposes
of this study, we selected the use of ‘‘X-band only’’
mode, which features a very narrow beamwidth (0.38),large antenna gain (54.3 dB; the CHILL antenna is
8.5m in diameter), and extreme cross-polar isolation
(245 dB). These characteristics allow for high quality,
very finescale observations of winter precipitation.
The X-band mode was chosen because 1) attenuation
and non-Rayleigh scattering effects that often plague
X-band radar observations in warm-season precipitation
events are not as prevalent in winter snowstorms and 2)
the shorter wavelength results in largerKDP, allowing for
better detection of dendritic growth zones (e.g., Kennedy
and Rutledge 2011; Andri�c et al. 2013; Schneebeli et al.
2013; Bechini et al. 2013). The dual-PRF strategy em-
ployed during FROST allowed for a good maximum
range (.90km) and a Nyquist interval of 623.9m s21
(F. Junyent et al. 2014, manuscript submitted to Bull.
Amer. Meteor. Soc.).
FIG. 1. Map of the FROST domain in northeastern Colorado, with facilities noted: the
CSU-CHILL radar, MFS, the WSR-88D radar at KFTG, and the sounding site at DNR. The
gray dashed line shows the edge of the Front Range of the Rocky Mountains.
JUNE 2014 KUMJ IAN ET AL . 1637
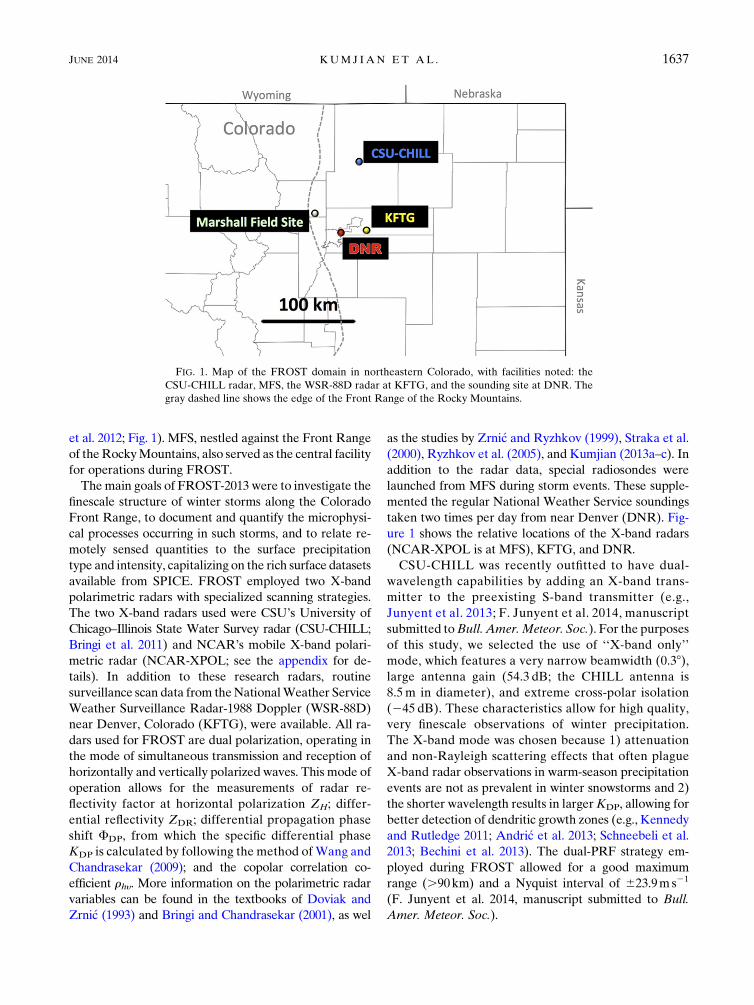
The FROST-2013 experiment collected data during
a total of 19 cases, although not all instrumentation was
available for each case (see Table 1 for details). Formost
of these cases, the research radars operated using spec-
ified scanning strategies. The scanning strategy for the
NCAR-XPOL radar involved 10 PPI scans at constant
elevation angles, 10 RHI scans at constant azimuth an-
gles, and 3min of vertically pointing or ‘‘birdbath’’
scans. CSU-CHILL volume scans comprised six PPI
sweeps followed by four RHIs (including one over
MFS). Table 2 has the details of each radar’s scanning
strategy. Note that in some cases the scanning strategies
were changed at the discretion of the radar operator
and/or the principal investigators (PIs) in an effort to
capture targets of opportunity, including continuous
RHIs to capture more rapid updates on the evolution of
features of interest.
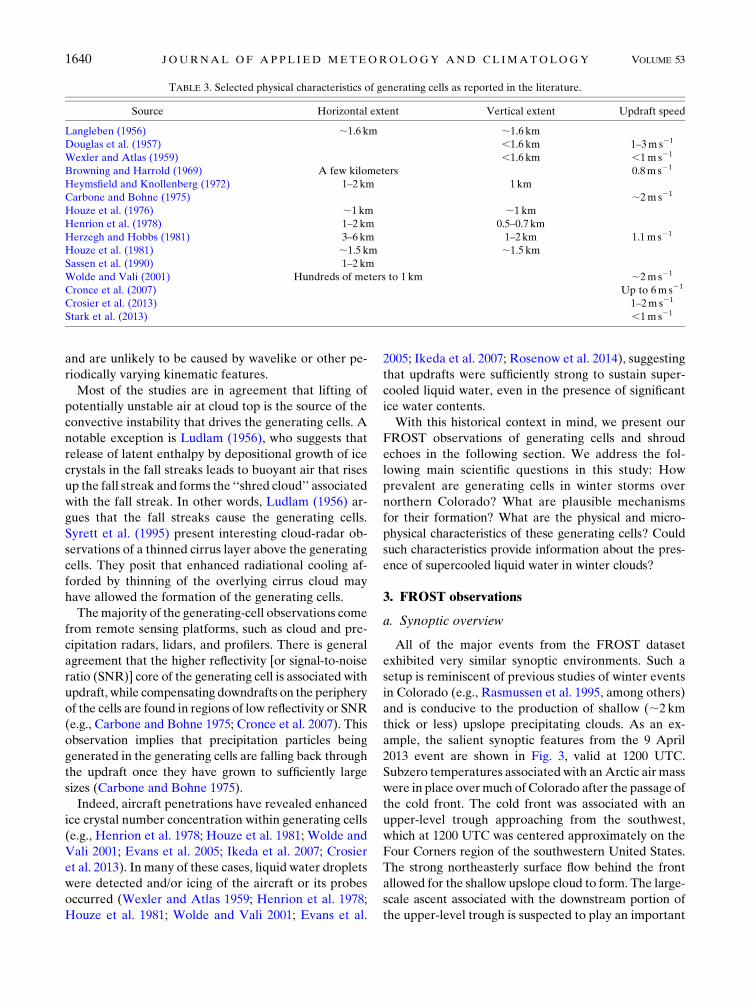
One such feature of interest that was observed in ev-
ery case during FROST is a collection of small-scale,
vertically erect turrets located near echo top (Fig. 2).
These turrets are reminiscent of so-called generating
cells that produce high concentrations of ice crystals near
cloud top. Such generating cells near cloud top have been
documented in the literature for over 50 years, as
discussed in detail in the next section. However, the
unique high-resolution polarimetric radar measure-
ments coupled with in situ thermodynamic data from
the radiosondes provide a detailed look at the structure
and evolution of these generating cells—and in a larger
number of cases than previously documented. In addition,
the use of polarimetric radar data in this study reveals
added information regarding the microphysical composi-
tion of generating cells, including what we term a ‘‘shroud
echo’’ surrounding some of the generating cells.
The next section reviews previous studies that have
documented generating cells. Section 3 presents obser-
vational data from FROST of generating cells and
shroud echoes and provides microphysical explanations
for their appearance. The practical implications of
generating cells and shroud echoes are discussed in
section 4, which is followed by a summary of our main
conclusions in section 5.
2. Background
For over half of a century, observations of so-called
generating cells of cloud and precipitation particles and
their associated fall streaks have been presented in the
TABLE 1. Data-collection times (UTC) of the CSU-CHILL radar, NCAR-XPOL radar at MFS, and the special radiosondes launched
from MFS for events from the FROST-2013 experiment.
CSU-CHILL NCAR-XPOL MFS radiosondes
1536–2314 11 Jan — —
1916 28 Jan–1624 29 Jan — —
2100–2137 31 Jan — —
2224–2355 6 Feb 0009–2359 6 Feb —
2150 9 Feb–0906 10 Feb 0000 9 Feb–2359 10 Feb —
2150–2206 11 Feb 0000–2359 11 Feb —
1712 14 Feb–0036 15 Feb 1815 14 Feb–1859 15 Feb —
1616 20 Feb–1914 21 Feb 1658 20 Feb–0226 21 Feb; 1618–2359 21 Feb 2022 and 2250 20 Feb; 0017 21 Feb
0006 24 Feb–0307 25 Feb 0000 24 Feb–2359 25 Feb —
1653–2115 4 Mar 1922–2359 4 Mar —
1757–1825 8 Mar — —
0248–2259 9 Mar 0300–2359 9 Mar 0415, 0605, 1057, 1242, and 1319 9 Mar
2013 22 Mar–1739 23 Mar 1713 22 Mar–2359 23 Mar —
2139 8 Apr–2234 9 Apr — 0148, 0323, and 0820 9 Apr
1805–2007 12 Apr — —
1530 15 Apr– 1300 16 Apr — —
1514 17 Apr–0233 18 Apr — —
1556 22 Apr–0635 23 Apr — —
0000–2246 1 May 0000–2359 1 May —
TABLE 2. Standard scanning strategies for the research radars during FROST. Scanning strategies were subject to change at the discretion
of the PIs and radar operators.
Radar PPIs (8) RHIs (8) Birdbath scans
NCAR-XPOL 1.1, 2.1, 3.1, 4.1, 5.1, 6.0, 7.0, 8.1, 9.0,
and 9.9
95.0, 105.0, 115.0, 125.0, 135.0, 145.0, 155.0, 165.0, 175.0,
and 180.0
3min
CSU-CHILL 0.4, 0.9, 1.7, 2.8, 3.9, and 5.0 235.8, 220.7, 214.4, and 181.8 None
1638 JOURNAL OF APPL IED METEOROLOGY AND CL IMATOLOGY VOLUME 53

literature (e.g.,Marshall 1953;Gunn et al. 1954; Langleben
1956; Miles 1956; Ludlam 1956; Douglas et al. 1957;
Wexler and Atlas 1959, and many others). These cells
seem to play an important role in the production of pre-
cipitation that eventually reaches the surface (e.g.,Douglas
et al. 1957; Hobbs and Locatelli 1978; Matejka et al. 1980;
Herzegh andHobbs 1981; Houze et al. 1981; Rutledge and
Hobbs 1983). The generating cells are small-scale con-
vective towers that are often located at or near cloud top.
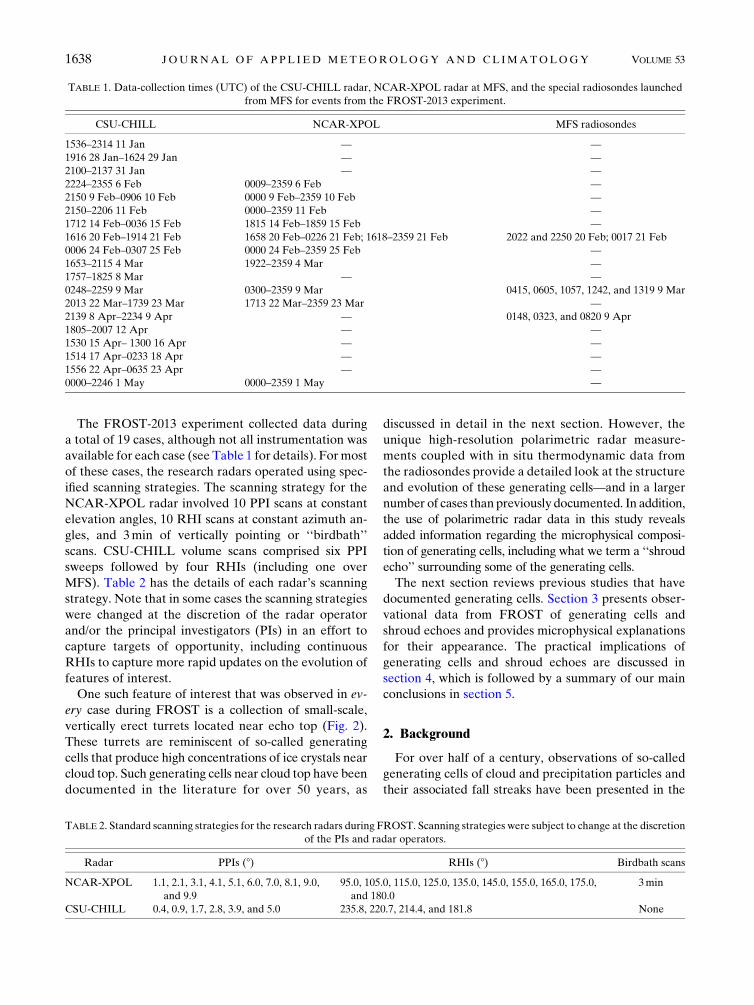
Most previous studies are consistent in reporting hori-
zontal dimensions on the order of 1–2km, with vertical
extents of slightly less than that (see Table 3). Updraft
speeds have been estimated or inferred from measure-
ments in various ways but have been consistently re-
ported at about 1ms21. Cronce et al. (2007) report a
maximumupdraft speed in awinter snowbandof;6ms21;
however, they also show that only 9% of their profiler
observations revealed updrafts exceeding 2ms21.
In contrast to the width, depth, and intensity of gen-
erating cells, there appears to be no preferred height or
temperature level at which they form (e.g., Douglas
et al. 1957). For example, Crosier et al. (2013) found
them at temperatures that were colder than 2408C,whereas Henrion et al. (1978) found them near 2128C.Evans et al. (2005) even found generating cells located at
two different levels during the same event (at about
2218C and at temperatures below 2408C). In a similar
way, the literature is inconsistent regarding the charac-
teristic spacing between generating cells, with a range of
values between about 5 (Wexler and Atlas 1959; Sassen
et al. 1990) and 32 (Marshall 1953) km. One study
(Syrett et al. 1995) even found the spacing to change
from 1.8 to 12km after the passage of an upper-level
trough. The apparent lack of preferred spacing or location
implies that the physical processes producing generating
cells are not dependent on temperature or microphysics
FIG. 2. Examples of generating cells observed by CSU-CHILL RHIs of ZH on four different
days: (a) 2327:15 UTC 20 Feb 2013 along azimuth 1808, (b) 1347:48 UTC 9 Mar 2013 along
azimuth 1808, (c) 1706:04 UTC 9Apr 2013 along azimuth 1628, and (d) 2144:44 UTC 22 Apr 2013
along azimuth 2548. Arrows in each panel indicate the locations of some of the generating cells.
JUNE 2014 KUMJ IAN ET AL . 1639
and are unlikely to be caused by wavelike or other pe-
riodically varying kinematic features.
Most of the studies are in agreement that lifting of
potentially unstable air at cloud top is the source of the
convective instability that drives the generating cells. A
notable exception is Ludlam (1956), who suggests that
release of latent enthalpy by depositional growth of ice
crystals in the fall streaks leads to buoyant air that rises
up the fall streak and forms the ‘‘shred cloud’’ associated
with the fall streak. In other words, Ludlam (1956) ar-
gues that the fall streaks cause the generating cells.
Syrett et al. (1995) present interesting cloud-radar ob-
servations of a thinned cirrus layer above the generating
cells. They posit that enhanced radiational cooling af-
forded by thinning of the overlying cirrus cloud may
have allowed the formation of the generating cells.
Themajority of the generating-cell observations come
from remote sensing platforms, such as cloud and pre-
cipitation radars, lidars, and profilers. There is general
agreement that the higher reflectivity [or signal-to-noise
ratio (SNR)] core of the generating cell is associated with
updraft, while compensating downdrafts on the periphery
of the cells are found in regions of low reflectivity or SNR
(e.g., Carbone and Bohne 1975; Cronce et al. 2007). This
observation implies that precipitation particles being
generated in the generating cells are falling back through
the updraft once they have grown to sufficiently large
sizes (Carbone and Bohne 1975).
Indeed, aircraft penetrations have revealed enhanced
ice crystal number concentration within generating cells
(e.g., Henrion et al. 1978; Houze et al. 1981; Wolde and
Vali 2001; Evans et al. 2005; Ikeda et al. 2007; Crosier
et al. 2013). In many of these cases, liquid water droplets
were detected and/or icing of the aircraft or its probes
occurred (Wexler and Atlas 1959; Henrion et al. 1978;
Houze et al. 1981; Wolde and Vali 2001; Evans et al.
2005; Ikeda et al. 2007; Rosenow et al. 2014), suggesting
that updrafts were sufficiently strong to sustain super-
cooled liquid water, even in the presence of significant
ice water contents.
With this historical context in mind, we present our
FROST observations of generating cells and shroud
echoes in the following section. We address the fol-
lowing main scientific questions in this study: How
prevalent are generating cells in winter storms over
northern Colorado? What are plausible mechanisms
for their formation? What are the physical and micro-
physical characteristics of these generating cells? Could
such characteristics provide information about the pres-
ence of supercooled liquid water in winter clouds?
3. FROST observations
a. Synoptic overview
All of the major events from the FROST dataset
exhibited very similar synoptic environments. Such a
setup is reminiscent of previous studies of winter events
in Colorado (e.g., Rasmussen et al. 1995, among others)
and is conducive to the production of shallow (;2 km
thick or less) upslope precipitating clouds. As an ex-
ample, the salient synoptic features from the 9 April
2013 event are shown in Fig. 3, valid at 1200 UTC.
Subzero temperatures associated with anArctic air mass
were in place overmuch of Colorado after the passage of
the cold front. The cold front was associated with an
upper-level trough approaching from the southwest,
which at 1200 UTC was centered approximately on the
Four Corners region of the southwestern United States.
The strong northeasterly surface flow behind the front
allowed for the shallow upslope cloud to form. The large-
scale ascent associated with the downstream portion of
the upper-level trough is suspected to play an important
TABLE 3. Selected physical characteristics of generating cells as reported in the literature.
Source Horizontal extent Vertical extent Updraft speed
Langleben (1956) ;1.6 km ;1.6 km
Douglas et al. (1957) ,1.6 km 1–3m s21
Wexler and Atlas (1959) ,1.6 km ,1m s21
Browning and Harrold (1969) A few kilometers 0.8m s21
Heymsfield and Knollenberg (1972) 1–2 km 1km
Carbone and Bohne (1975) ;2m s21
Houze et al. (1976) ;1 km ;1 km
Henrion et al. (1978) 1–2 km 0.5–0.7 km
Herzegh and Hobbs (1981) 3–6 km 1–2km 1.1m s21
Houze et al. (1981) ;1.5 km ;1.5 km
Sassen et al. (1990) 1–2 km
Wolde and Vali (2001) Hundreds of meters to 1 km ;2m s21
Cronce et al. (2007) Up to 6m s21
Crosier et al. (2013) 1–2m s21
Stark et al. (2013) ,1m s21
1640 JOURNAL OF APPL IED METEOROLOGY AND CL IMATOLOGY VOLUME 53

role in triggering the generating cells, which are de-
scribed next.
b. Generating cells
Despite using predetermined scanning strategies
during most of the data collection efforts as well as
overnight unattended operations by both X-band ra-
dars, generating cells were found in every case in
FROST, evident in the limited number of RHI scanning
directions selected. This means that they are likely very
common in winter precipitation, if not ubiquitous. In
agreement with Douglas et al. (1957) and the literature
review presented in the previous section, there was no
preferred height or temperature level at which the gen-
erating cells appeared; they were observed at heights
ranging from 3.0 to 8.0 km (cf. Fig. 2), which corresponds
to temperatures ranging from approximately 2128C to
colder than 2408C. Figure 2 also reveals that their fre-
quency and spacing varied considerably as well.
The widths of individual turrets generally was less
variable, withmost on the order of;1 kmor less in girth,
as visually estimated from the ZH field in RHI scans. In
some cases, the individual turrets remained distinct in
theZH field for up to;1 km in height (e.g., Fig. 4). Note
that at least some of the variability in these character-
istics can be attributed to differences in how the radar
cross sections intersected the generating cells in the dif-
ferent cases. In addition, the radar may not give a com-
plete picture, as there may be portions of generating cells
without particles large enough to be detectable by radar.
Such regions (e.g., supercooled cloud droplets) could
still be microphysically important.
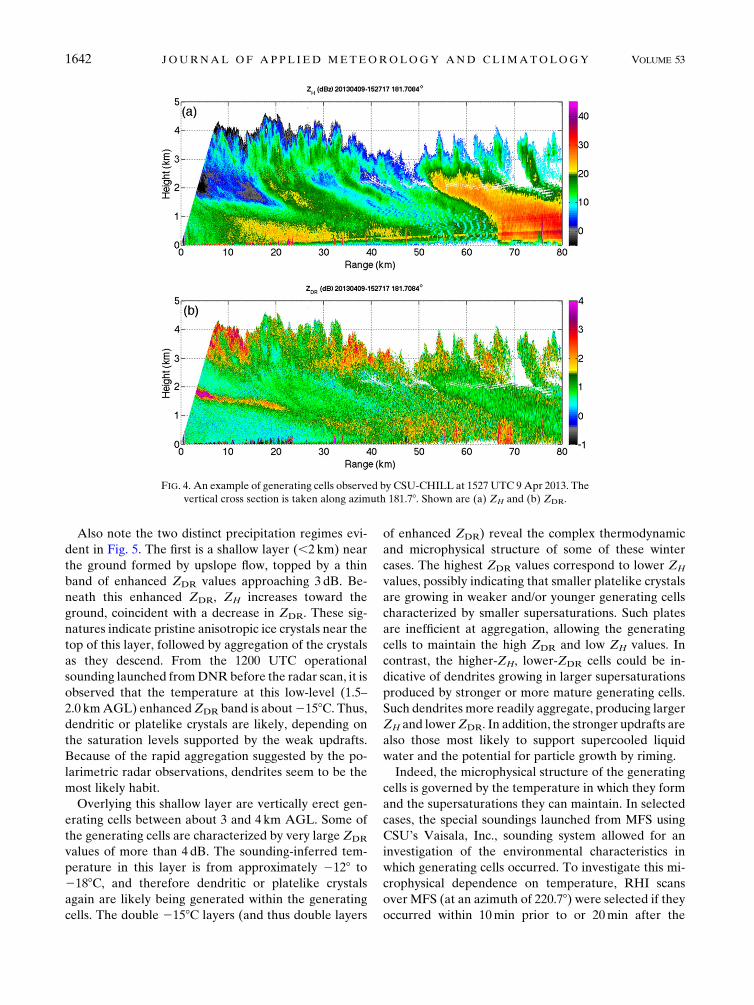
The ZDR field in Fig. 4 also shows that microphysical
variability is possible even at the same height or tem-
perature level within a given case, strongly suggesting
that differences in supersaturation, riming, aggregation,
and so on may occur within different generating cells. In
a typical case, fall streaks were observed descending
from the more mature generating cells as snow fell into
the underlying layer of sheared flow.
Figures 5a and 5c are of a PPI scan taken at a higher
elevation angle (4.998) such that the beam transects the
generating cells. An RHI overlaid with the beam prop-
agation path through some of the generating cells at that
elevation angle is provided in Figs. 5b and 5d. It dem-
onstrates the lack of preferred spacing or orientation of
the generating cells in plan view, as well as their con-
vective appearance. As mentioned in the previous sec-
tion, the lack of any well-defined periodic structure or
orientation to their spacing strongly suggests that the
generating cells are convective in nature and are not
forced by any wavelike kinematic features. The PPI scan
also reveals that the generating cells are roughly iso-
tropic in the horizontal plane. Thus, the characteristic
scales inferred from the RHI scans (which provide
a better view of their horizontal dimension) should not
depend on viewing angle and should be valid for both
horizontal dimensions of the generating cells.
FIG. 3. Synoptic overview of the 9Apr 2013 case, showing salient features valid at 1200UTC.
The gray contours show the objectively analyzed 500-hPa heights in dekameters. Also shown
are subjectively analyzed surface fronts, surface pressure centers, and the surface 08 and258Cisotherms. Subjective analysis of the surface features is based on analyses by the Hydrome-
teorological Prediction Center and the Storm Prediction Center.
JUNE 2014 KUMJ IAN ET AL . 1641
Also note the two distinct precipitation regimes evi-
dent in Fig. 5. The first is a shallow layer (,2 km) near
the ground formed by upslope flow, topped by a thin
band of enhanced ZDR values approaching 3 dB. Be-
neath this enhanced ZDR, ZH increases toward the
ground, coincident with a decrease in ZDR. These sig-
natures indicate pristine anisotropic ice crystals near the
top of this layer, followed by aggregation of the crystals
as they descend. From the 1200 UTC operational
sounding launched fromDNRbefore the radar scan, it is
observed that the temperature at this low-level (1.5–
2.0 kmAGL) enhancedZDR band is about2158C. Thus,dendritic or platelike crystals are likely, depending on
the saturation levels supported by the weak updrafts.
Because of the rapid aggregation suggested by the po-
larimetric radar observations, dendrites seem to be the
most likely habit.
Overlying this shallow layer are vertically erect gen-
erating cells between about 3 and 4 km AGL. Some of
the generating cells are characterized by very large ZDR
values of more than 4 dB. The sounding-inferred tem-
perature in this layer is from approximately 2128 to
2188C, and therefore dendritic or platelike crystals
again are likely being generated within the generating
cells. The double 2158C layers (and thus double layers
of enhanced ZDR) reveal the complex thermodynamic
and microphysical structure of some of these winter
cases. The highest ZDR values correspond to lower ZH
values, possibly indicating that smaller platelike crystals
are growing in weaker and/or younger generating cells
characterized by smaller supersaturations. Such plates
are inefficient at aggregation, allowing the generating
cells to maintain the high ZDR and low ZH values. In
contrast, the higher-ZH, lower-ZDR cells could be in-
dicative of dendrites growing in larger supersaturations
produced by stronger or more mature generating cells.
Such dendrites more readily aggregate, producing larger
ZH and lowerZDR. In addition, the stronger updrafts are
also those most likely to support supercooled liquid
water and the potential for particle growth by riming.
Indeed, the microphysical structure of the generating
cells is governed by the temperature in which they form
and the supersaturations they can maintain. In selected
cases, the special soundings launched from MFS using
CSU’s Vaisala, Inc., sounding system allowed for an
investigation of the environmental characteristics in
which generating cells occurred. To investigate this mi-
crophysical dependence on temperature, RHI scans
over MFS (at an azimuth of 220.78) were selected if they
occurred within 10min prior to or 20min after the
FIG. 4. An example of generating cells observed by CSU-CHILL at 1527 UTC 9Apr 2013. The
vertical cross section is taken along azimuth 181.78. Shown are (a) ZH and (b) ZDR.
1642 JOURNAL OF APPL IED METEOROLOGY AND CL IMATOLOGY VOLUME 53

sounding launch time. These selection criteria were
chosen in an attempt tomaximize the representativeness
of the sounding-observed temperatures; there is no
guarantee, however, that the sounding is entirely rep-
resentative over the large area sampled by the RHI
scans. The data from altitudes of greater than 1 kmAGL
and between 10- and 80-km range were chosen to mini-
mize contamination from ground clutter, beam blockage,
and the terrain at far ranges. In addition, a normalized
coherent power threshold of 0.25 was chosen to ensure
radar volumes of sufficiently good quality. The re-
sulting radar volumes were binned according to the
MFS-sounding-observed temperature in 0.28C bins, for
each of which the median ZDR and 0.05 and 0.95 quan-
tiles of ZDR were computed. Also, the ZDR data were
put into 0.2-dB bins, and a normalized frequency dis-
tribution was constructed (normalized by the largest
frequency within a 0.28C bin such that the maximum
frequency in each 0.28C bin is 1.0). The results for the 9
March 2013 case are shown in Fig. 6.
It is clear that a much wider distribution is found
centered on a temperature of approximately 2158C,corresponding to platelike or dendritic growth. The
distribution around this temperature is strongly skewed
toward larger ZDR values. The median and 5%–95%
bounds are also slightly shifted to larger ZDR values at
FIG. 5. The 4.998-elevation-angle PPI scans showing (a)ZH and (c)ZDR at 1402:31UTC 9Apr 2013, taken by CSU-
CHILL.Range rings are provided every 20 km. The black line indicates the azimuth alongwhich theRHIs in the right
column were taken. RHIs show fields of (b) ZH and (d) ZDR along azimuth 220.78 taken by CSU-CHILL at
1404:41UTC 9Apr 2013. The solid line indicates the approximate beampath at 4.998 elevation angle, with the dashedlines indicating the top and bottom of the 0.38 beam.
JUNE 2014 KUMJ IAN ET AL . 1643

these temperatures. The radar volumes recording ZDR
values in excess of 4–5 dB require the presence of high-
density crystals such as plates, whereas dendrites tend to
produce more modest (but still enhanced) ZDR values
(e.g., Hogan et al. 2002; Kennedy and Rutledge 2011;
Andri�c et al. 2013; Schneebeli et al. 2013). At colder
temperatures, the distribution is remarkably flat, cen-
tered on much lower ZDR values—a situation that is
indicative of more isometric crystals. At temperatures
that are warmer than approximately2158C, the median
ZDR and peak of the ZDR distribution drop to lower
values, likely indicative of aggregation of the dendritic
crystals located above.
This analysis was repeated for each sounding time.
The expanded distribution at 2158C was not as pro-
nounced or sometimes not even present in each case;
rather, the distribution was similar to that at colder
temperatures (not shown). This may be because crystals
were initiated and grown at colder temperatures and
simply descended into warmer temperatures without
growth (i.e., conditions were not favorable for ice crystal
growth at these levels at these times).
Selected data from radiosondes launched from MFS
during snowstorms are shown in Fig. 7. In each instance,
small dewpoint depressions characterize the majority of
the troposphere, suggesting the storms were character-
ized by deep clouds at the times of the soundings. In at
least two of the cases (21 February and 9 April), an in-
dication of shallow upslope flow is present, suggested by
the low-level cold layer with northeasterly flow over-
topped by a strong inversion. As discussed above, many
of the previous studies have posited lifting of con-
vectively unstable parcels as the mechanism by which
generating cells form. To diagnose regions of potential
instability, the vertical profile of equivalent potential
temperature ue and its vertical gradient are computed
(Fig. 8) from the sounding measurements by following
themethod of Lamb andVerlinde (2011). (Note that use
of the equivalent potential temperature with respect to
ice, or uei, may also be used for snowstorms. We chose to
use the more conservative ue, which provides a more
stringent criterion for the detection of regions of potential
instability.) Potential instability exists where ue decreases
with increasing height (i.e., where ›ue/›z , 0). In the
20–21 February 2013 case (Figs. 8a,b), there are several
regions of potential instability in the layer between ap-
proximately 3.75 and 7.0km, with the largest magnitude
of just below 2Kkm21 being located at ;3.75km.
Vertical cross sections from CSU-CHILL (Fig. 9) re-
veal generating cells in this layer, which is consistent
with the sounding-observed regions of potential in-
stability. Note that the vertical extent of generating cells
at farther ranges (.70 km) is likely underestimated, as
the top portions of the cells fall below the minimum
detectable reflectivity at those ranges. Enhancements of
ZDR and KDP are evident in the top portions of the
generating cells (Figs. 9b,c), roughly centered at;3–4-km
height. Maximum KDP values exceeded 1.58km21, in-
dicating sufficiently large concentrations of anisotropic
crystals. The 0017 UTC sounding at MFS (cf. Fig. 7a)
indicated a temperature at 3 km (4 km)AGL of218.38C(226.38C). Thus, the enhanced polarimetric signatures
at these temperatures are consistent with growth of
platelike or dendritic snow crystals (e.g., Kennedy and
Rutledge 2011; Andri�c et al. 2013; Bechini et al. 2013).
Indeed, near this time the sounding crew at MFS ob-
served small (,2mm) dendrites at the surface, mixed
with small, irregular crystals.
A time–height display of vertically pointing NCAR-
XPOL ZH and Doppler velocity measurements over
a 3-min period beginning at 2355 UTC (Fig. 10) reveals
positive Doppler velocities (up to 1m s21) associated
with weak ZH (,5 dBZ) above ;3.75 km, consistent
with the depth (diagnosed from the sounding) con-
taining potential instability. The mean Doppler velocity
over the 3-min period was positive above ;4.4 km (Fig.
10c). Note that the measured vertical Doppler velocity is
a combination of particle fall speed and air motion; thus,
the actual vertical air motion is somewhat higher than
measured (i.e.,.1ms21). This vertical velocity estimate is
consistent with the values reported in the literature re-
viewed above.
FIG. 6. Normalized frequency distribution of CSU-CHILL-
observedZDR values vs the temperature for those radar volumes as
observed by the MFS soundings launched at 1057 and 1319 UTC
9Mar 2013. Only radar data collected along the azimuth over MFS
from within 10min prior to and 20min after the sounding launch
time are used in the analysis. Data are binned into 0.28C 3 0.2 dB
bins. Overlaid are the median ZDR (dark blue line) and 5th and
95th percentiles of ZDR (thin cyan lines) for each 0.28C bin.
1644 JOURNAL OF APPL IED METEOROLOGY AND CL IMATOLOGY VOLUME 53

FIG. 7. Observed soundings fromMFS at (a),(b) 0017 UTC 21 Feb 2013, (c),(d) 1319 UTC 9 Mar 2013, and (e),(f)
0820 UTC 9 Apr 2013, showing (left) skew-T plots [with the vertical axis showing heights above the ground level,
and with temperature (blue lines) and dewpoint temperature (orange lines) plotted along with selected mixing
ratio lines, adiabats, and pseudoadiabats] and (right) vertical profiles of the u (black lines) and y (gray lines)
components of the wind.
JUNE 2014 KUMJ IAN ET AL . 1645

Another example of ue and ›ue/›z profiles computed
from the sounding launched at 0017 UTC 9 March
2013 is shown in Figs. 8c and 8d. Again, regions of po-
tential instability are identified, this time in the layer
between approximately 5.0 and 6.5 km AGL (from
230.68 to 244.98C). The most negative values of ›ue/›z
are approximately 22Kkm21. A CSU-CHILL vertical
cross-sectional scan (RHI) taken in the direction of
FIG. 8. (left) Raw (black lines) and smoothed (red lines) vertical profiles of ue and (right) raw (black lines) and
smoothed (blue lines) vertical profiles of the vertical gradient of ue for the three soundings shown inFig. 7: (a),(b) 0017UTC21
Feb 2013, (c),(d) 1319 UTC 9 Mar 2013, and (e),(f) 0820 UTC 9 Apr 2013. Note the extended abscissa scale in (e).
1646 JOURNAL OF APPL IED METEOROLOGY AND CL IMATOLOGY VOLUME 53

MFS (Fig. 11) reveals generating cells that extend up to
;6.5 km AGL at the range of MFS (approximately
72 km), consistent with the diagnosed heights of po-
tential instability from the sounding. Vertically point-
ing NCAR-XPOL data from about this time (Fig. 12)
reveal positive vertical velocities from approximately
5 to 6 km, near the echo top, where ZH values are
generally less than 5 dBZ. The mean vertical profile of
Doppler velocity over the 3-min birdbath-scanning pe-
riod shows positive vertical velocities above 5 km, in-
dicating upward motion. Again, because of particle fall
speeds, the actual vertical air motion likely is somewhat
higher than 1.0m s21. During these observations, the
sounding crew made observations of ‘‘tiny graupel’’ and
FIG. 9. CSU-CHILL RHI along the azimuth 181.78, taken at 0001:39 UTC 21 Feb 2013: (a) ZH,
(b) ZDR, and (c) KDP.
JUNE 2014 KUMJ IAN ET AL . 1647

heavily rimed dendritic or stellar snowflakes that retained
some semblance of shape, along with small aggregates.
A final example of potential instability associated with
observed generating cells comes from a snow storm that
occurred on 9 April 2013. The vertical profile of ue de-
rived from an MFS sounding and the computed ›ue/›z
profile at 0820 UTC are shown in Figs. 8e and 8f. The
layer between approximately 3.0 and 5.0km (from211.18to 226.48C) reveals negative ›ue/›z, with minimum
values approaching 24Kkm21 at ;4.75km AGL
(224.58C). This corresponds well to the generating cells
observed at this time with CSU-CHILL (Fig. 13) in the 4–
6-kmAGL layer. Unfortunately, vertically pointing radar
data are not available for this case because of a power
supply failure to the NCAR-XPOL. At the time of the
sounding (and for at least 30min afterward), very small
(;1mmor less), high-density rimed particles were falling;
the sounding crew could hear the sounds of the particles
striking the sounding trailer. (Note that strong flow at low
levels coupled with small terminal velocities of ice crystals
means that substantial horizontal advection is possible.)
The FROST observations of generating cells occur-
ring within or near layers of sounding-inferred potential
instability along with coincident vertically pointing radar
data indicating upward motion in these same regions
provide strong evidence to support the notion that gen-
erating cells are convective in nature, realizing potential
instability often near echo top in winter storms. The
observations presented herein of ;1-km horizontal and
vertical dimensions of generating cells and estimated
vertical velocities up to (and possibly exceeding) 1m s21
within them are in excellent agreement with generating-
cell characteristics that have been reported in the liter-
ature. The presence of rimed particles in at least three of
the cases indicates that supercooled liquid water was
present in some portion of the cloud.With the additional
information provided by the polarimetric radar vari-
ables, we can explore the microphysical structure of
generating cells. In the next section, we report on an
interesting structure found in our dataset.
c. Shroud echoes
In several of the FROST cases, the generating cells
are enshrouded by a thin layer of enhanced ZDR values
that sometimes exceed 4 dB (Fig. 14). These enhance-
ments in ZDR appear on the periphery of the generating
FIG. 10. Vertically pointing NCAR-XPOL data collected from 2355:22 to 2358:30 UTC 20 Feb 2013: (a) ZH, (b) Doppler velocity, and
(c) mean Doppler velocity over the 3-min scanning period, which corresponds to a translational distance of about 0.5–0.75 km for the
generating cells as based on sounding-measured wind speeds.
1648 JOURNAL OF APPL IED METEOROLOGY AND CL IMATOLOGY VOLUME 53
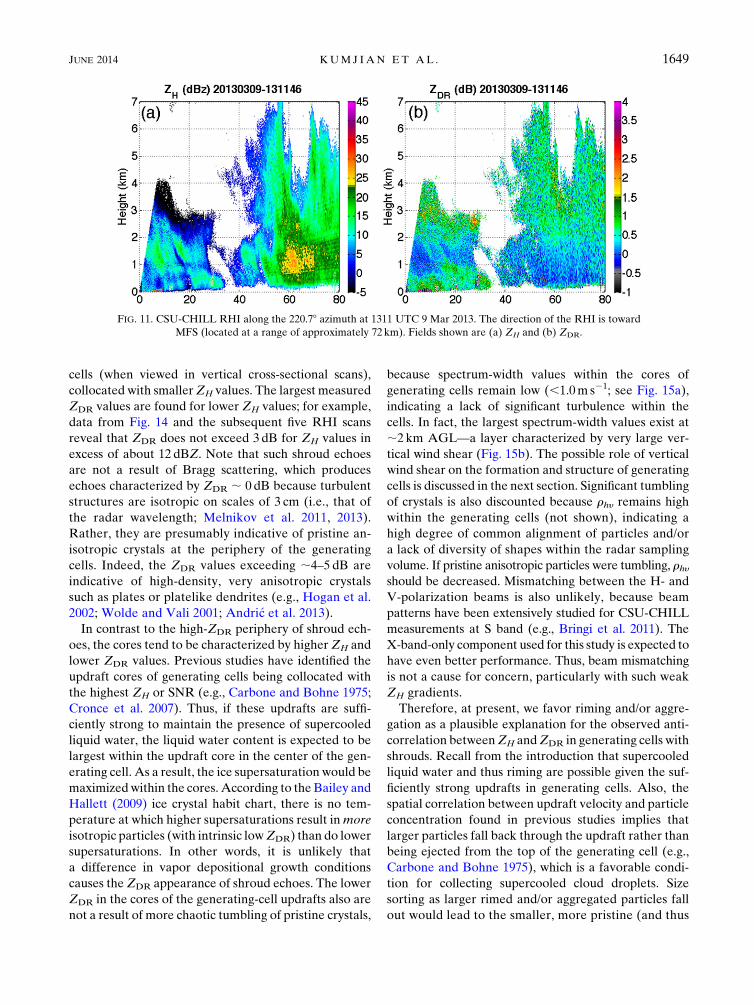
cells (when viewed in vertical cross-sectional scans),
collocated with smallerZH values. The largest measured
ZDR values are found for lower ZH values; for example,
data from Fig. 14 and the subsequent five RHI scans
reveal that ZDR does not exceed 3 dB for ZH values in
excess of about 12 dBZ. Note that such shroud echoes
are not a result of Bragg scattering, which produces
echoes characterized by ZDR ; 0 dB because turbulent
structures are isotropic on scales of 3 cm (i.e., that of
the radar wavelength; Melnikov et al. 2011, 2013).
Rather, they are presumably indicative of pristine an-
isotropic crystals at the periphery of the generating
cells. Indeed, the ZDR values exceeding ;4–5 dB are
indicative of high-density, very anisotropic crystals
such as plates or platelike dendrites (e.g., Hogan et al.
2002; Wolde and Vali 2001; Andri�c et al. 2013).
In contrast to the high-ZDR periphery of shroud ech-
oes, the cores tend to be characterized by higher ZH and
lower ZDR values. Previous studies have identified the
updraft cores of generating cells being collocated with
the highest ZH or SNR (e.g., Carbone and Bohne 1975;
Cronce et al. 2007). Thus, if these updrafts are suffi-
ciently strong to maintain the presence of supercooled
liquid water, the liquid water content is expected to be
largest within the updraft core in the center of the gen-
erating cell. As a result, the ice supersaturation would be
maximizedwithin the cores. According to theBailey and
Hallett (2009) ice crystal habit chart, there is no tem-
perature at which higher supersaturations result inmore
isotropic particles (with intrinsic lowZDR) than do lower
supersaturations. In other words, it is unlikely that
a difference in vapor depositional growth conditions
causes theZDR appearance of shroud echoes. The lower
ZDR in the cores of the generating-cell updrafts also are
not a result of more chaotic tumbling of pristine crystals,
because spectrum-width values within the cores of
generating cells remain low (,1.0m s21; see Fig. 15a),
indicating a lack of significant turbulence within the
cells. In fact, the largest spectrum-width values exist at
;2 km AGL—a layer characterized by very large ver-
tical wind shear (Fig. 15b). The possible role of vertical
wind shear on the formation and structure of generating
cells is discussed in the next section. Significant tumbling
of crystals is also discounted because rhy remains high
within the generating cells (not shown), indicating a
high degree of common alignment of particles and/or
a lack of diversity of shapes within the radar sampling
volume. If pristine anisotropic particles were tumbling, rhyshould be decreased. Mismatching between the H- and
V-polarization beams is also unlikely, because beam
patterns have been extensively studied for CSU-CHILL
measurements at S band (e.g., Bringi et al. 2011). The
X-band-only component used for this study is expected to
have even better performance. Thus, beam mismatching
is not a cause for concern, particularly with such weak
ZH gradients.
Therefore, at present, we favor riming and/or aggre-
gation as a plausible explanation for the observed anti-
correlation betweenZH andZDR in generating cells with
shrouds. Recall from the introduction that supercooled
liquid water and thus riming are possible given the suf-
ficiently strong updrafts in generating cells. Also, the
spatial correlation between updraft velocity and particle
concentration found in previous studies implies that
larger particles fall back through the updraft rather than
being ejected from the top of the generating cell (e.g.,
Carbone and Bohne 1975), which is a favorable condi-
tion for collecting supercooled cloud droplets. Size
sorting as larger rimed and/or aggregated particles fall
out would lead to the smaller, more pristine (and thus
FIG. 11. CSU-CHILL RHI along the 220.78 azimuth at 1311 UTC 9 Mar 2013. The direction of the RHI is toward
MFS (located at a range of approximately 72 km). Fields shown are (a) ZH and (b) ZDR.
JUNE 2014 KUMJ IAN ET AL . 1649

more anisotropic) crystals being left behind. The ob-
servations of rimed particles at MFS in each of the
cases presented above demonstrate that riming of snow
crystals was ongoing in the cloud. When ice crystals
initiated in generating cells are of dendritic habit (which is
expected around 2158C), rapid aggregation is also possi-
ble. There exists some ambiguity, because the polarimetric
signatures of small rimed particles and aggregated
snowflakes are very similar. Because both small graupel
and aggregates were observed at the ground during
FROST cases, we cannot say conclusively which micro-
physical process is dominant in each case. Thus, future
studies employing in situ observations may be able to
elucidate the particle types present in generating cells and
allow for this important microphysical distinction.
These ZDR shrouds around generating cells are not
always observed. The habit of crystals grown in gener-
ating cells is dependent on the temperature and ice su-
persaturation attained. Thus, in some cases, the pristine
crystals may not be sufficiently anisotropic to produce
observable enhancements ofZDR. In other cases, distance
from the radar may preclude observations of enhanced
ZDR because of beam broadening (and thus signal domi-
nation by larger rimed particles and/or aggregates) or
because of the shroud echo being below the minimum
detectable reflectivity, which increases with increasing
distance from the radar (e.g., Doviak and Zrni�c 1993).
d. Evolution of generating cells
In addition to the standard scanning strategies
employed during FROST, special series of RHI scans
were collected using CSU-CHILL during a select few
cases. These consecutive RHI scans were chosen to
capture how the generating cells evolve rather than
simply observing them at a ‘‘snapshot’’ in time (as in
those cases above). One such implementation of con-
secutive RHI scans happened on 9 April 2013. Figure 16
shows the evolution of a particularly vigorous generat-
ing cell over a 10-min period starting at 2106:22 UTC.
The radar operator admirably attempted to take RHI
scans along the direction of the mean cell motion. Given
the difficulty of this in practice, however, we caution that
it is possible that the generating-cell motion had a com-
ponent normal to the plane of the vertical cross section.
FIG. 12. Vertically pointing NCAR-XPOL data starting at 1306:12 UTC and ending at 1309:20 UTC 9 Mar 2013: (a) ZH, (b) Doppler
velocity, and (c) mean Doppler velocity over the 3-min birdbath-scanning period, which corresponds to a translational distance of about
1.3 km for the generating cells as based on sounding-measured wind speeds.
1650 JOURNAL OF APPL IED METEOROLOGY AND CL IMATOLOGY VOLUME 53

Nonetheless, if we assume that the generating cell re-
mains perfectly within the cross-sectional plane over this
10-min period, we may compute the ascent rate of the
echo top and attribute it solely to lofting of particles by
the updraft. Figure 17 shows the measurable echo top as
well as the heights of the 10- and 20-dBZ contours
throughout this period. A simple calculation provides an
estimate of the average ascent rate of 2m s21 over the
first few scans, followed by leveling off, and finally de-
scent. This estimate of updraft speed is consistent with
previous observations from other FROST cases (de-
scribed above) as well as those reported in the literature.
While the echo top remains quasi stationary from
about 2109 through 2112 UTC the 10-dBZ contour
continues to move upward (Fig. 17). This situation has
the effect of sharpening the vertical gradient of ZH over
this time period. One possible interpretation of this
tightening ZH gradient is that particles within the gen-
erating cell are undergoing growth (perhaps through
riming), whereas the updraft velocity of the cell is not
increasing. This is also the time that a 20-dBZ contour
appears in the cell, also signifying the growth of particles
(and/or an increase in their concentration) in the lower
portion of the cell. Between 2112:48 and 2114:24 UTC,
the echo top remains nearly constant while the 10-dBZ
contour descends by ;200m, which in effect relaxes
the ZH gradient. This is consistent with fallout of the
larger particles that have grown heavy enough to de-
scend through the updraft (i.e., size sorting is ongoing,
as suggested above for shroud echoes) in the absence
of any significant change in updraft strength. After
2114:24 UTC, the generating cell diminishes in vertical
extent, possibly as a result of updraft weakening and/or
the cell moving out of the cross-sectional plane. The data
presented in Figs. 16 and 17 suggest a lifetime on the
order of at least 10min for the generating cells.
The increase of ZH toward the ground observed
within this cell is consistent with the fingerprint of
growth of particles through riming and/or aggregation.
The ZDR in this particular generating cell remained
low throughout this period (not shown), implying the
presence of rimed and/or aggregated particles. Be-
cause the top of the echo never displayed enhanced
ZDR, we favor the hypothesis that riming was ongoing.
If aggregation was the dominant process in the gen-
erating cell, it must be occurring very rapidly, sug-
gesting that dendrites would have to be the most likely
pristine crystal type. The lack of a ZDR or KDP en-
hancement associated with the lower ZH values at the
periphery of the echoes (i.e., no shroud) indicates that
FIG. 13. CSU-CHILL RHI along the 181.998 azimuth at 0852 UTC 9 Apr 2013 for (a) ZH and
(b) ZDR. Arrows show the locations of generating cells.
JUNE 2014 KUMJ IAN ET AL . 1651

dendrites were not present in significant concentra-
tions. Indeed, the generating cell appeared at tem-
perature levels inferred from the DNR sounding that
are too cold for dendritic growth (i.e., colder than
2228C; Fig. 17). These temperatures are more consis-
tent with the growth of crossed plates or assemblages
of large plates and side planes (e.g., Bailey and Hallett
2009), which are more isometric ‘‘polycrystals’’ that
tend to produce lower ZDR and are less efficient at
aggregation (e.g., Andri�c et al. 2013).
4. Discussion
There are at least two distinct modes of precipitation
generation observed in the FROST cases. The first is
shallow upslope flow, in which precipitation echoes are
typically confined to a layer that is less than 2km deep
and is topped with a band of enhanced ZDR (cf. Fig. 5).
The vertical motion produced by upslope flow is typically
only a few centimeters per second. The vertical structure
of the polarimetric radar variables suggests initial de-
positional growth of dendritic crystals at the top of the
layer, followed by rapid aggregation beneath (e.g.,
Kennedy and Rutledge 2011; Andri�c et al. 2013). The
second mode is the generating cells that are the subject
of this study. As seen above, updraft speeds in the gen-
erating cells are much larger than in the upslope flow
cases, exceeding 1m s21. A natural question is, What
proportion of the snow reaching the surface is produced by
each of these two modes? In other words, How important
is the role of ice nucleation in generating cells in compar-
ison with shallower upslope flow layers? The stronger
vertical velocities in generating cells are expected to be
more efficient at activating ice nuclei; the available con-
centration of ice nuclei generally decreases with height in
the troposphere, however, and generating cells tend to be
located above the shallow upslope flow layer.
Previous studies have found that 20%–30% of the
precipitation content reaching the ground is produced in
generating cells, depending on their vertical velocity
(Hobbs et al. 1980;Houze et al. 1981;Rutledge andHobbs
1983). In our study, the limited radar data unfortunately
prohibit reconstruction of the full three-dimensional
structure of the storms. It is difficult to estimate the
relative proportion of snow production from generating
cells as compared with other parts of the storm from just
a sample of RHI scans and PPI scans in each case. Al-
though predominantly used for studying fast-evolving
FIG. 14. CSU-CHILL RHI at 1534:48 UTC 9 Apr 2013, showing shroud echoes. Fields shown
are (a) ZH and (b) ZDR.
1652 JOURNAL OF APPL IED METEOROLOGY AND CL IMATOLOGY VOLUME 53

severe convective storms and tropical cyclones, rapid-
scanning polarimetric radars (e.g., Pazmany et al. 2013)
could be used to provide high-resolution, volumetric
scans of winter storms to investigate the precipitation
efficiency and microphysical evolution of generating
cells within such storms. Such research could have im-
portant implications for numerical weather prediction
models, particularly winter quantitative precipitation
estimation. If a nonnegligible portion of snowfall is
generated by sub-1-km-scale structures, typical opera-
tional models employing comparatively coarse resolution
may not be able to adequately resolve an important part
of precipitation formation in winter storms. In addition,
the riming and/or aggregation inferred from the radar
measurements indicates that snow particles growing in
generating cells will have larger fall speeds than crystals
grown through vapor deposition, possibly contributing to
a larger net precipitation flux to the surface. The possible
presence of supercooled liquid water and the variety of
particle types present within generating cells inferred
from polarimetric radar measurements also should be
understood in the context of their contributions to the
radiative budget of winter storm clouds, particularly if
not well simulated in traditional numerical models.
As we saw above, there was no preferred height or
temperature level at which generating cells appeared in
each of the FROST cases. The only common characteristic
about the location of their appearance is that they oc-
curred near echo top. In the cases in whichMFS soundings
could corroborate the presence of potential instability, it
was found to be in the same layers as the generating cells.
Thus, one wonders why the potential instability exists in
each case. The routine soundings from Denver (0000 and
1200 UTC) did not always show layers of potential in-
stability. This may be because of the coarser resolution of
these operational soundings, the representativeness of the
environment, or other factors. The fact that the MFS
soundings (launched into the snowing clouds) did show
potential instability hints at the possibility that radiative
effects at cloud top may be important for producing or
maintaining generating cells. For example, we speculate
that cloud-top cooling paired with heating associated with
depositional and riming growth of snow crystals within the
cloud could be a mechanism by which lapse rates are able
to remain steep enough to maintain convection. In addi-
tion, advection of drier and/or cooler (i.e., lower ue) air
aloft as a result of the synoptic pattern in most of these
cases could play a role in producing the potential in-
stability. Analysis of the evolution of the thermodynamic
profiles from consecutive MFS soundings does indicate
small decreases in ue values over time in the layers con-
taining potential instability and generating cells, although
FIG. 15. As in Fig. 4, but for (a) Doppler spectrum width and (b) Doppler velocity.
JUNE 2014 KUMJ IAN ET AL . 1653

the observations are inconclusive as to whether this is
because of advection or other effects. Potential instability
is not found at the top of the shallowupslope layer because
often there is a sharp inversion overlying this layer; thus,
it is too stable for radiative effects to generate or maintain
potential instability. In contrast, the environmental lapse
rate above the upslope layer was always near moist
adiabatic (because of radiative–convective equilibrium);
therefore, it would not take much heating/cooling or ad-
vection of low-ue air to generate convective instability near
cloud top. Future modeling studies should pay attention
to radiative effects and the large-scale forcing to ex-
plore their possible roles in generating and/or main-
taining potential instability at cloud top.
Another factor to consider is the possible role of
vertical wind shear. Inmost of the cases, a large amount of
vertical wind shear existed near the layer with the in-
version (cf. Figs. 7 and 15) where winds change from
predominantly northerly at low levels to southerly aloft.
Houze and Medina (2005) found cellular updrafts above
the melting layer in their study of winter midlatitude
frontal systems in the PacificNorthwest. They suggest that
shear-induced turbulence may serve as a source for the
rising motion. In addition, the authors suggest that a layer
of turbulence may also affect the hydrometeors passing
through by increased aggregation and possible riming.
The appearance of the generating cells themselves
suggests that they are not strongly influenced by vertical
FIG. 16. Fields of ZH from consecutive CSU-CHILL RHI scans
over a 10-min period starting at 2106:22 UTC 9 Apr 2013 along the
azimuth 329.78. The arrow annotates the vigorous generating cell of
interest.
FIG. 17. Trace of the maximum vertical extent of selected con-
tours of interest from the generating cell shown in Fig. 16. Scan
times are annotated next to the markers. Contours shown are for
the measurable echo top (black solid curve), the 10-dBZ contour
(dark-gray solid curve), and the 20-dBZ contour (gray dashed
curve). Corresponding temperatures from each height are taken
from the 0000 UTC 10 Apr 2013 operational DNR sounding.
1654 JOURNAL OF APPL IED METEOROLOGY AND CL IMATOLOGY VOLUME 53

wind shear, as the cells are upright in every case (i.e.,
there is no evidence for tilting). Also, the soundings in
Fig. 7 demonstrate that wind shear is considerably
smaller in the layers in which generating cells occurred,
at least in those three cases. Thus, it appears unlikely
that vertical wind shear plays a role in the structure or
appearance of the generating cells. Note that the verti-
cally pointingDoppler radar data revealed updrafts near
cloud top, up to several kilometers above the shear
layer. The shear layers themselves did not exhibit sub-
stantial upward vertical motion. We cannot, however,
rule out the possibility that some mechanism similar to
that proposed by Houze and Medina (2005) may be
acting on the hydrometeors formed aloft that sub-
sequently descend through the shear layer.
Recent observations from the Profiling of Winter
Storms (PLOWS) experiment using the high-resolution,
vertically pointing, airborne ‘‘Wyoming Cloud Radar’’
system have shown a frequent occurrence of generating
cells in midlatitude cyclones (e.g., Plummer et al. 2013;
Rosenow et al. 2014). Generating-cell characteristics
found in those cases are in very good agreement with
those found in our Colorado storm cases analyzed here.
This result suggests that generating cells have charac-
teristic scales (width, height, and updraft speed) that do
not vary much, even in different geographical areas. In
addition, it demonstrates that generating cells indeed
are very common in all types of snowstorms, in various
parts of the United States. Future studies employing
high-resolution radar in other regions may confirm the
common presence of generating cells in snowstorms.
The frequent occurrence of updraft turrets near echo
tops found in this study is important for aviation con-
cerns. In addition to the possible turbulence generated
by convective motions at echo top, generating cells
may provide a possible sustained source of supercooled
liquid water that may pose an icing hazard to aircraft.
Indeed, the radar data suggest ongoing riming in some
of the generating cells, providing strong evidence that
supercooled liquid water was present in at least some
of the FROST cases. Aircraft or other in situ obser-
vations can help to clarify the particle types and
amount of supercooled liquid water present in gener-
ating cells. If supercooled liquid water is a common
occurrence within generating cells, soundings may be
used to identify layers of potential instability where
generating cells are likely to grow so as to forecast
potential icing hazards.
5. Summary
Coordinated observations in 19 winter-storm cases
were obtained during the 2013 Front Range Orographic
Storms project. Measurements included special sound-
ings and radar observations from two research X-band
polarimetric radars: NCAR-XPOL and CSU-CHILL.
We present some of the high-resolution polarimetric
radar data of snow-generating cells collected during
FROST. The main conclusions of this study may be
summarized as follow:
1) Generating cells were found in every FROST case
(19 total), indicating that they are very common (if
not ubiquitous) in snowstorms. In a typical case,
these generating cells were located in deeper clouds,
often overlying a shallow layer of upslope flow.
2) Characteristics of generating cells include ;1-km
horizontal and vertical dimensions and updraft speeds
on the order of 1–2ms21. These scales are in good
accordwith previous studies. In addition, ‘‘rapid scan’’
observations revealed lifetimes of individual convec-
tive turrets that are on the order of at least ;10min.
3) When corroborating soundings were available, the
locations of generating cells were found within
cloud-top layers containing potential instability.
We speculate that radiative effects are important
for the maintenance of such instability (and thus
generating cells).
4) At present, our observations suggest that vertical
wind shear may play only a limited role in the
appearance or structure of generating cells. High-
resolution numerical simulations may be used to
further explore the role of vertical shear.
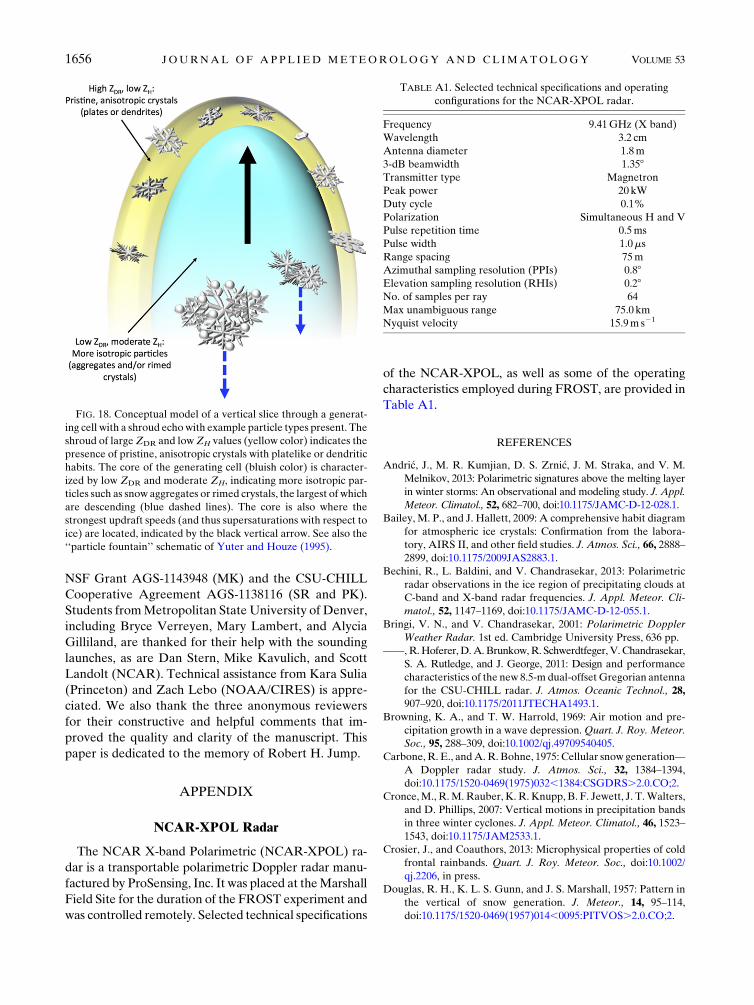
5) In some cases, the generating cells were enshrouded
by a thin layer of enhancedZDR indicative of pristine,
anisotropic ice crystals such as plates or dendrites. The
anticorrelation between ZH and ZDR in these shroud
echoes is suggestive of ongoing riming and/or aggre-
gation within the core of the generating cells. Rimed
particles were observed at the ground in at least three
of these cases. Figure 18 is a conceptual model of
a generating cell with a shroud echo.
6) The implied presence of supercooled liquid water
within generating cells and their frequency of occur-
rence have important implications for numerical
modeling efforts and for aviation icing concerns.
Acknowledgments. The authors thank Francesc
Junyent, Jim George, and Dave Brunkow (CSU) for
their help with the CSU-CHILL data processing and
transfer, as well as Nancy Rehak (NCAR) for assistance
in operating the NCAR-XPOL radar.We are grateful to
Chris Davis (NCAR) and the Advanced Study Program
for funding that supported the radiosondes and to Paul
Ciesielski (CSU) for lending us the CSU radiosonde
system. Additional funding for this project comes from
JUNE 2014 KUMJ IAN ET AL . 1655
NSF Grant AGS-1143948 (MK) and the CSU-CHILL
Cooperative Agreement AGS-1138116 (SR and PK).
Students fromMetropolitan State University of Denver,
including Bryce Verreyen, Mary Lambert, and Alycia
Gilliland, are thanked for their help with the sounding
launches, as are Dan Stern, Mike Kavulich, and Scott
Landolt (NCAR). Technical assistance from Kara Sulia
(Princeton) and Zach Lebo (NOAA/CIRES) is appre-
ciated. We also thank the three anonymous reviewers
for their constructive and helpful comments that im-
proved the quality and clarity of the manuscript. This
paper is dedicated to the memory of Robert H. Jump.
APPENDIX
NCAR-XPOL Radar
The NCAR X-band Polarimetric (NCAR-XPOL) ra-
dar is a transportable polarimetric Doppler radar manu-
factured by ProSensing, Inc. It was placed at theMarshall
Field Site for the duration of the FROST experiment and
was controlled remotely. Selected technical specifications
of the NCAR-XPOL, as well as some of the operating
characteristics employed during FROST, are provided in
Table A1.
REFERENCES
Andri�c, J., M. R. Kumjian, D. S. Zrni�c, J. M. Straka, and V. M.
Melnikov, 2013: Polarimetric signatures above the melting layer
in winter storms: An observational and modeling study. J. Appl.
Meteor. Climatol., 52, 682–700, doi:10.1175/JAMC-D-12-028.1.
Bailey, M. P., and J. Hallett, 2009: A comprehensive habit diagram
for atmospheric ice crystals: Confirmation from the labora-
tory, AIRS II, and other field studies. J. Atmos. Sci., 66, 2888–
2899, doi:10.1175/2009JAS2883.1.
Bechini, R., L. Baldini, and V. Chandrasekar, 2013: Polarimetric
radar observations in the ice region of precipitating clouds at
C-band and X-band radar frequencies. J. Appl. Meteor. Cli-
matol., 52, 1147–1169, doi:10.1175/JAMC-D-12-055.1.
Bringi, V. N., and V. Chandrasekar, 2001: Polarimetric Doppler
Weather Radar. 1st ed. Cambridge University Press, 636 pp.
——,R.Hoferer,D.A.Brunkow,R. Schwerdtfeger, V.Chandrasekar,
S. A. Rutledge, and J. George, 2011: Design and performance
characteristics of the new 8.5-m dual-offset Gregorian antenna
for the CSU-CHILL radar. J. Atmos. Oceanic Technol., 28,907–920, doi:10.1175/2011JTECHA1493.1.
Browning, K. A., and T. W. Harrold, 1969: Air motion and pre-
cipitation growth in a wave depression.Quart. J. Roy. Meteor.
Soc., 95, 288–309, doi:10.1002/qj.49709540405.
Carbone,R. E., andA.R. Bohne, 1975: Cellular snow generation—
A Doppler radar study. J. Atmos. Sci., 32, 1384–1394,
doi:10.1175/1520-0469(1975)032,1384:CSGDRS.2.0.CO;2.
Cronce,M., R.M. Rauber, K. R. Knupp, B. F. Jewett, J. T.Walters,
and D. Phillips, 2007: Vertical motions in precipitation bands
in three winter cyclones. J. Appl. Meteor. Climatol., 46, 1523–
1543, doi:10.1175/JAM2533.1.
Crosier, J., and Coauthors, 2013: Microphysical properties of cold
frontal rainbands. Quart. J. Roy. Meteor. Soc., doi:10.1002/
qj.2206, in press.
Douglas, R. H., K. L. S. Gunn, and J. S. Marshall, 1957: Pattern in
the vertical of snow generation. J. Meteor., 14, 95–114,
doi:10.1175/1520-0469(1957)014,0095:PITVOS.2.0.CO;2.
FIG. 18. Conceptual model of a vertical slice through a generat-
ing cell with a shroud echowith example particle types present. The
shroud of largeZDR and lowZH values (yellow color) indicates the
presence of pristine, anisotropic crystals with platelike or dendritic
habits. The core of the generating cell (bluish color) is character-
ized by low ZDR and moderate ZH, indicating more isotropic par-
ticles such as snow aggregates or rimed crystals, the largest of which
are descending (blue dashed lines). The core is also where the
strongest updraft speeds (and thus supersaturations with respect to
ice) are located, indicated by the black vertical arrow. See also the
‘‘particle fountain’’ schematic of Yuter and Houze (1995).
TABLE A1. Selected technical specifications and operating
configurations for the NCAR-XPOL radar.
Frequency 9.41GHz (X band)
Wavelength 3.2 cm
Antenna diameter 1.8m
3-dB beamwidth 1.358Transmitter type Magnetron
Peak power 20 kW
Duty cycle 0.1%
Polarization Simultaneous H and V
Pulse repetition time 0.5ms
Pulse width 1.0ms
Range spacing 75m
Azimuthal sampling resolution (PPIs) 0.88Elevation sampling resolution (RHIs) 0.28No. of samples per ray 64
Max unambiguous range 75.0 km
Nyquist velocity 15.9m s21
1656 JOURNAL OF APPL IED METEOROLOGY AND CL IMATOLOGY VOLUME 53
Doviak, R. J., and D. S. Zrni�c, 1993: Doppler Radar and Weather
Observations. 2nd ed. Academic Press, 562 pp.
Evans, A. G., J. D. Locatelli, M. T. Stoelinga, and P. V. Hobbs,
2005: The IMPROVE-1 storm of 1–2 February 2001. Part II:
Cloud structures and the growth of precipitation. J. Atmos.
Sci., 62, 3456–3473, doi:10.1175/JAS3547.1.
Gunn, K. L. S., M. P. Langleben, A. S. Dennis, and B. A. Power,
1954: Radar evidence of a generating level for snow. J. Me-
teor., 11, 20–26, doi:10.1175/1520-0469(1954)011,0020:
REOAGL.2.0.CO;2.
Henrion, X., H. Sauvageot, and D. Ramond, 1978: Fines-
tructure of precipitation and temperature in a stratocu-
mulus cloud. J. Atmos. Sci., 35, 2315–2324, doi:10.1175/
1520-0469(1978)035,2315:FOPATI.2.0.CO;2.
Herzegh, P. H., and P. V. Hobbs, 1981: The mesoscale and mi-
croscale structure and organization of clouds and precipitation
in midlatitude cyclones. IV: Vertical air motions and mi-
crophysical structures of prefrontal surge clouds and cold-
frontal clouds. J. Atmos. Sci., 38, 1771–1784, doi:10.1175/
1520-0469(1981)038,1771:TMAMSA.2.0.CO;2.
Heymsfield, A. J., andR.G.Knollenberg, 1972: Properties of cirrus
generating cells. J. Atmos. Sci., 29, 1358–1366, doi:10.1175/
1520-0469(1972)029,1358:POCGC.2.0.CO;2.
Hobbs, P. V., and J. D. Locatelli, 1978: Rainbands, precipitation
cores, and generating cells in a cyclonic storm. J. Atmos. Sci.,
35, 230–241.——, T. J. Matejka, P. H. Herzegh, J. D. Locatelli, and R. A.
Houze Jr., 1980: The mesoscale and microscale structure
and organization of clouds and precipitation in mid-
latitude cyclones. I: A case study of a cold front. J. Atmos.
Sci., 37, 568–596, doi:10.1175/1520-0469(1980)037,0568:
TMAMSA.2.0.CO;2.
Hogan, R., P. Field, A. Illingworth, R. Cotton, and T. Choularton,
2002: Properties of embedded convection in warm-frontal
mixed-phase cloud from aircraft and polarimetric radar.
Quart. J. Roy. Meteor. Soc., 128, 451–476, doi:10.1256/
003590002321042054.
Houze, R. A., Jr., and S. Medina, 2005: Turbulence as a mechanism
for orographic precipitation enhancement. J. Atmos. Sci., 62,
3599–3623, doi:10.1175/JAS3555.1.
——, J. D. Locatelli, and P. V. Hobbs, 1976: Dynamics and
cloud microphysics of the rainbands in an occluded fron-
tal system. J. Atmos. Sci., 33, 1921–1936, doi:10.1175/
1520-0469(1976)033,1921:DACMOT.2.0.CO;2.
——, S. A. Rutledge, T. J. Matejka, and P. V. Hobbs, 1981: The
mesoscale andmicroscale structure and organization of clouds
and precipitation in midlatitude cyclones. III: Air motions
and precipitation growth in a warm-frontal rainband. J. At-
mos. Sci., 38, 639–649, doi:10.1175/1520-0469(1981)038,0639:
TMAMSA.2.0.CO;2.
Ikeda, K., R. M. Rasmussen, W. D. Hall, and G. Thompson, 2007:
Observations of freezing drizzle in extratropical cyclonic
storms during IMPROVE-2. J. Atmos. Sci., 64, 3016–3043,
doi:10.1175/JAS3999.1.
Junyent, F., V. Chandrasekar, P. Kennedy, S. Rutledge, V. Bringi,
J. George, andD. Brunkow, 2013: Salient features of the CSU-
CHILL radar X-band channel upgrade. Proc. 36th Conf. on
Radar Meteorology, Breckenridge, CO, Amer. Meteor. Soc.,
2B.6. [Available online at https://ams.confex.com/ams/36Radar/
webprogram/Paper229162.html.]
Kennedy, P. C., and S. A. Rutledge, 2011: S-band dual-polarization
radar observations of winter storms. J. Appl. Meteor. Clima-
tol., 50, 844–858, doi:10.1175/2010JAMC2558.1.
Kumjian, M. R., 2013a: Principles and applications of dual-
polarization weather radar. Part I: Description of the polari-
metric radar variables. J.Oper.Meteor., 1, 226–242, doi:10.15191/
nwajom.2013.0119.
——, 2013b: Principles and applications of dual-polarization
weather radar. Part II: Warm and cold season applications.
J. Oper. Meteor., 1, 243–264, doi:10.15191/nwajom.2013.0120.
——, 2013c: Principles and applications of dual-polarization
weather radar. Part III: Artifacts. J. Oper. Meteor., 1, 265–
274, doi:10.15191/nwajom.2013.0121.
Lamb, D., and J. Verlinde, 2011: Physics and Chemistry of Clouds.
1st ed. Cambridge University Press, 584 pp.
Langleben, M. P., 1956: The plan pattern of snow echoes at
the generating level. J. Meteor., 13, 554–560, doi:10.1175/
1520-0469(1956)013,0554:TPPOSE.2.0.CO;2.
Ludlam, F. H., 1956: The form of ice clouds: II. Quart. J. Roy.
Meteor. Soc., 82, 257–265, doi:10.1002/qj.49708235302.
Marshall, J. S., 1953: Precipitation trajectories and patterns.
J. Atmos. Sci., 10, 25–29, doi:10.1175/1520-0469(1953)010,0025:
PTAP.2.0.CO;2.
Matejka, T. J., R. A. Houze Jr., and P. V. Hobbs, 1980: Micro-
physics and dynamics of clouds associated with mesoscale
rainbands in extratropical cyclones. Quart. J. Roy. Meteor.
Soc., 106, 29–56, doi:10.1002/qj.49710644704.
Melnikov, V. M., R. J. Doviak, D. S. Zrni�c, and D. J. Stensrud,
2011: Mapping Bragg scatter with a polarimetric WSR-88D.
J. Atmos. Oceanic Technol., 28, 1273–1285, doi:10.1175/
JTECH-D-10-05048.1.
——, ——, ——, and ——, 2013: Structures of Bragg scatter ob-
served with the polarimetric WSR-88D. J. Atmos. Oceanic
Technol., 30, 1253–1258, doi:10.1175/JTECH-D-12-00210.1.
Miles, V. G., 1956: Interpretation of the height-versus-time pre-
sentation of radar echoes. J. Meteor., 13, 362–368, doi:10.1175/
1520-0469(1956)013,0362:IOTHVT.2.0.CO;2.
Pazmany, A. L., J. B. Mead, H. B. Bluestein, J. C. Snyder, and J. B.
Houser, 2013: A mobile rapid-scanning X-band polarimetric
(RaXPol) Doppler radar system. J. Atmos. Oceanic Technol.,
30, 1398–1413, doi:10.1175/JTECH-D-12-00166.1.
Plummer, D. M., R. M. Rauber, G. M. McFarquhar, B. F. Jewett,
and D. Leon, 2013: The structure and role of generating cells
and precipitation bands in cold-season midlatitude cyclones.
Proc. 25th Conf. on Mesoscale Meteorology, Portland, OR,
Amer. Meteor. Soc., 11.3. [Available online at https://ams.
confex.com/ams/15MESO/webprogram/Paper227744.html.]
Rasmussen, R.M., B. C. Bernstein, M.Murakami, G. Stossmeister,
and J. Reisner, 1995: The 1990 Valentine’s Day Arctic out-
break. Part I: Mesoscale andmicroscale structure and evolution
of a Colorado Front Range shallow upslope cloud. J. Appl.
Meteor., 34, 1481–1511, doi:10.1175/1520-0450-34.7.1481.——, and Coauthors, 2012: How well are we measuring snow: The
NOAA/FAA/NCARwinter precipitation test bed.Bull. Amer.
Meteor. Soc., 93, 811–829, doi:10.1175/BAMS-D-11-00052.1.
Rosenow,A.A.,D.M. Plummer, R.M.Rauber,G.M.McFarquhar,
B. F. Jewett, and D. C. Leon, 2014: Vertical velocity and
physical structure of generating cells and convection in the
comma head region of continental winter cyclones. J. Atmos.
Sci., doi:10.1175/JAS-D-13-0249.1, in press.
Rutledge, S. A., and P. V. Hobbs, 1983: The mesoscale and mi-
croscale structure and organization of clouds and precip-
itation in midlatitude cyclones. VIII: A model for the
‘‘seeder-feeder’’ process in warm-frontal rainbands. J. Atmos.
Sci., 40, 1185–1206, doi:10.1175/1520-0469(1983)040,1185:
TMAMSA.2.0.CO;2.
JUNE 2014 KUMJ IAN ET AL . 1657

Ryzhkov, A. V., T. J. Schuur, D. W. Burgess, P. L. Heinselman,
S. E. Giangrande, andD. S. Zrni�c, 2005: The Joint Polarization
Experiment: Polarimetric rainfall measurements and hydro-
meteor classification. Bull. Amer. Meteor. Soc., 86, 809–824,doi:10.1175/BAMS-86-6-809.
Sassen, K. C., J. Grund, J. D. Spinhirne, M. M. Hardesty, and
J. M. Alvarez, 1990: The 27–28 October 1986 FIRE IFO
cirrus case study: A five lidar overview of cloud structure
and evolution. Mon. Wea. Rev., 118, 2288–2311, doi:10.1175/
1520-0493(1990)118,2288:TOFICC.2.0.CO;2.
Schneebeli, M., N. Dawes, M. Lehning, and A. Berne, 2013: High-
resolution vertical profiles of X-band polarimetric radar ob-
servables during snowfall in the Swiss Alps. J. Appl. Meteor.
Climatol., 52, 378–394, doi:10.1175/JAMC-D-12-015.1.
Stark, D., B. A. Colle, and S. E. Yuter, 2013: Observed micro-
physical evolution for two East Coast winter storms and the
associated snow bands. Mon. Wea. Rev., 141, 2037–2057,
doi:10.1175/MWR-D-12-00276.1.
Straka, J. M., D. S. Zrni�c, and A. V. Ryzhkov, 2000: Bulk hydrome-
teor classification and quantification using polarimetric radar
data: Synthesis of relations. J. Appl. Meteor., 39, 1341–1372,
doi:10.1175/1520-0450(2000)039,1341:BHCAQU.2.0.CO;2.
Syrett, W. J., B. A. Albrecht, and E. E. Clothiaux, 1995: Ver-
tical cloud structure in a midlatitude cyclone from a
94-GHz radar. Mon. Wea. Rev., 123, 3393–3407, doi:10.1175/
1520-0493(1995)123,3393:VCSIAM.2.0.CO;2.
Wang, Y., and V. Chandrasekar, 2009: Algorithm for estimation of
the specific differential phase. J. Atmos. Oceanic Technol., 26,
2565–2578, doi:10.1175/2009JTECHA1358.1.
Wexler, R., and D. Atlas, 1959: Precipitation generating cells.
J.Atmos. Sci., 16, 327–332, doi:10.1175/1520-0469(1959)016,0327:
PGC.2.0.CO;2.
Wolde, M., and G. Vali, 2001: Polarimetric signatures from ice
crystals observed at 95GHz in winter clouds. Part II: Fre-
quencies of occurrence. J. Atmos. Sci., 58, 842–849, doi:10.1175/
1520-0469(2001)058,0842:PSFICO.2.0.CO;2.
Yuter, S. E., and R. A. Houze Jr., 1995: Three-dimensional ki-
nematic and microphysical evolution of Florida cumulo-
nimbus. Part III: Vertical mass transport, mass divergence,
and synthesis. Mon. Wea. Rev., 123, 1964–1983, doi:10.1175/
1520-0493(1995)123,1964:TDKAME.2.0.CO;2.
Zrni�c, D. S., and A. V. Ryzhkov, 1999: Polarimetry for weather
surveillance radars. Bull. Amer. Meteor. Soc., 80, 389–406,
doi:10.1175/1520-0477(1999)080,0389:PFWSR.2.0.CO;2.
1658 JOURNAL OF APPL IED METEOROLOGY AND CL IMATOLOGY VOLUME 53