Embed Size (px)
Citation preview
Eric L. PetersenDepartment of Mechanical Engineering
Texas A&M University
High-Pressure Turbulent Flame Speeds and Chemical Kinetics of Syngas Blends With and
Without Impurities
2015 University Turbine Systems Research WorkshopAtlanta, GA
3-5 November, 2015

3-Year Project Began in October, 2013
Project Overview
Project Highlights:
1. Duration: Oct. 1, 2013 – Sept. 30, 2016
2. DOE NETL Award DE-FE0011778
3. Budget: $498,382 DOE + $124,595 Cost Share
4. Principal Investigator: Dr. Eric L. Petersen

Project Overview
This Project Addresses Several Problems for HHC Fuels
1. Improve NOx kinetics for High-Hydrogen Fuels at Engine Conditions
2. Effect of Contaminant Species on Ignition and Flame Speed
3. Impact of Diluents on Ignition Kinetics and Flame Speeds
4. Data on Turbulent Flame Speeds at Engine Pressures

Project Overview
There are Five Main Work Tasks for the Project
Work Tasks:
Task 1 – Project Management and Program Planning
Task 2 – Turbulent Flame Speed Measurements at Atmospheric Pressure
Task 3 – Experiments and Kinetics of Syngas Blends with Impurities
Task 4 – Design and Construction of a High-Pressure Turbulent Flame Speed Facility
Task 5 – High-Pressure Turbulent Flame Speed Measurements
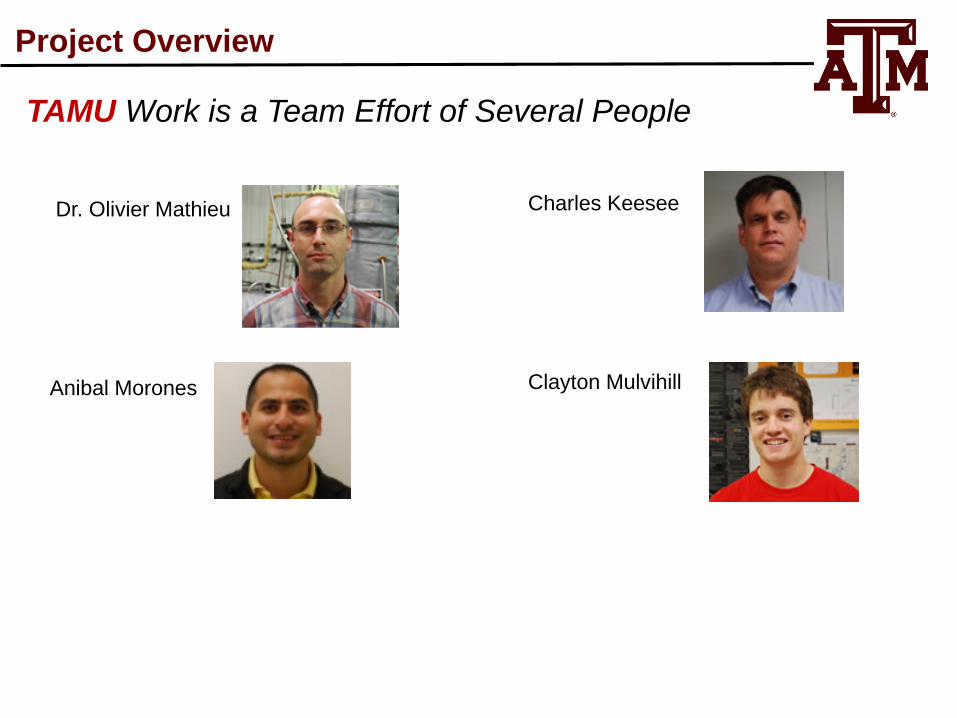
TAMU Work is a Team Effort of Several People
Dr. Olivier Mathieu
Anibal Morones
Charles Keesee
Clayton Mulvihill
5
Project Overview
Task 2 – Turbulent Flame Speed Measurements at Atmospheric Pressure

1-atm Turbulent Flame Speed Measurement will Build Upon Tests Done in Previous UTSR Project
• Utilize Existing Turbulent Flame Speed Hardware
• Extend Test Conditions to a Range of u' and Length Scale Values
• Detailed Characterization of Existing Conditions with LDV
• Perform Experiments for Syngas Blends at 1 atm Conditions
Task 2 – Turbulent Speeds

Existing 1-atm Rig Characterized for 1 Main Condition
Task 2 – Turbulent Speeds
Features:
• 7075-T6 Heat-Treated Aluminum
• 4 radial impellers
• Diameter: 30.5 cm
• Length: 35.6 cm
• Window Port Diameter: 12.7 cm
• Maximum initial pressure: 1 atm
• Maximum initial temperature: 298 K
Turbulence:
• Intensity: 1.5 m/s rms
• Integral length scale: 27 mm

Gasket
Wi ndow
Spacer
(De Vries 2009)
Task 2 – Turbulent SpeedsExisting Rig Has 4 Fans Centrally Located, Added toOriginal Rig of de Vries (2009)

Device Model
Transceiver PowerSight TR-SS-2D
Signal processor FSA4000-2
Traverse Isel T3DH
Photomultiplier PDM1000-2SS
Particle Generator 9306
Computer Dell Precision T7600
Task 2 – Turbulent SpeedsLDV Setup from TSI
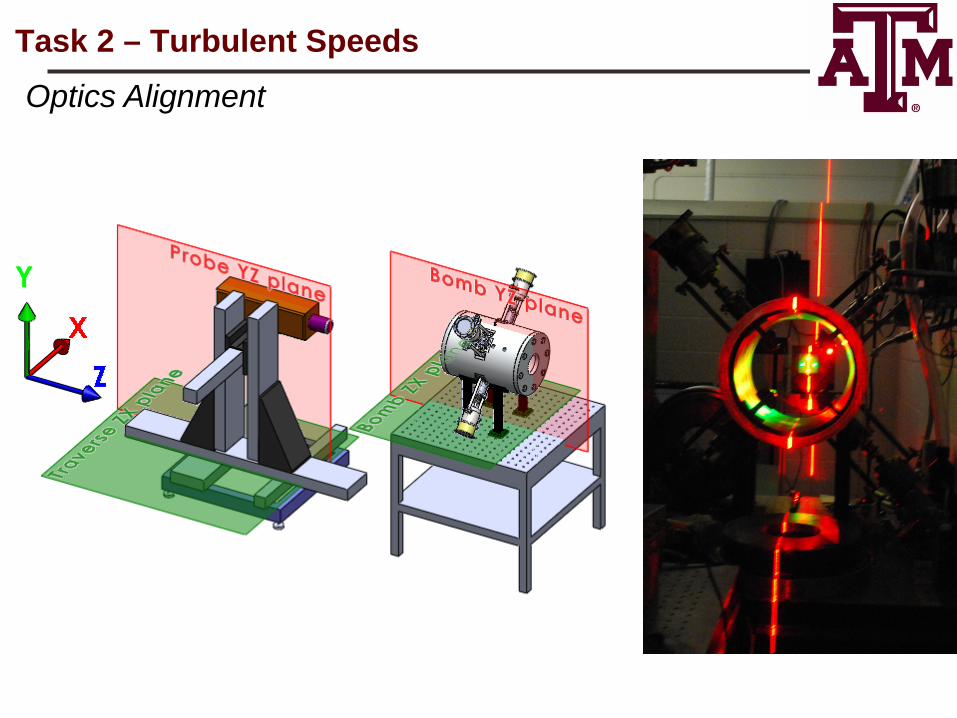
Task 2 – Turbulent SpeedsOptics Alignment

Collocating the probe volume and the receiving optics
LDV transceiverfocusing lens
Window assembly
Focal length or standoff
Task 2 – Turbulent Speeds

Test region6×6×6 cm3
Task 2 – Turbulent SpeedsTiming Sequence Controlled to Capture Turbulence
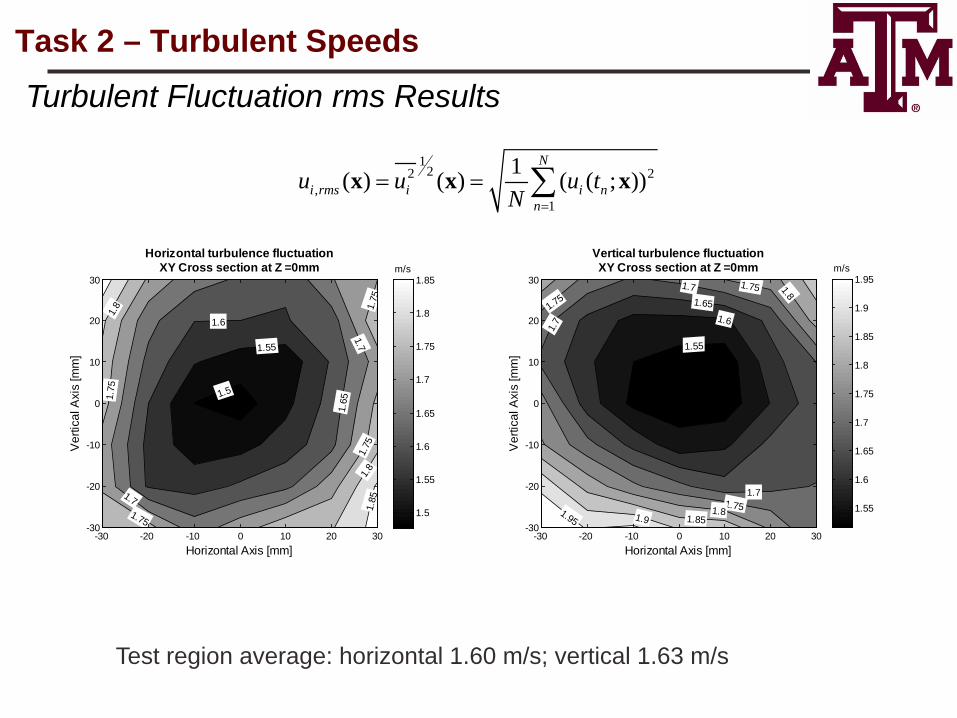
Test region average: horizontal 1.60 m/s; vertical 1.63 m/s
1.65
1.6
1.55
1.7
1.7
1.75
1.75
1.8
1.5
1.75
1.8 1.
751.
85
Horizontal Axis [mm]
Ver
tical
Axi
s [m
m]
Horizontal turbulence fluctuationXY Cross section at Z =0mm
-30 -20 -10 0 10 20 30-30
-20
-10
0
10
20
30m/s
1.5
1.55
1.6
1.65
1.7
1.75
1.8
1.85
1.651.6
1.71.75
1.55
1.81.85
1.7
1.9
1.75
1.7
1.8
1.95
1.75
Horizontal Axis [mm]
Ver
tical
Axi
s [m
m]
Vertical turbulence fluctuationXY Cross section at Z =0mm
-30 -20 -10 0 10 20 30-30
-20
-10
0
10
20
30m/s
1.55
1.6
1.65
1.7
1.75
1.8
1.85
1.9
1.95
122 2
,1
1( ) ( ) ( ( ; ))N
i rms i i nn
u u u tN =
= = ∑x x x
Task 2 – Turbulent SpeedsTurbulent Fluctuation rms Results

USC simulationsAgreement with numerical model
Reference Technique Turbulencefluctuation
Averagevelocity
(Ravi, Peltier et al. 2013) PIV 1.48 0.03
(Davani and Ronney 2015) Simulation 1.63 0.12
This work LDV 1.62 0.40* *axial

Isotropy test region average 0.98
,
,
( )( ) i rms
ii rms
uH
u=
xx ,
,
( )( )
( )x rms
xyy rms
uI
u=
xx
x
1
1.05
1.05
0.951.
1
1.1
1.1
1.15
1.1
Horizontal Axis [mm]
Ver
tical
Axi
s [m
m]
Horizontal turbulence fluctuation homogeneityXY Cross section at Z =0mm
-30 -20 -10 0 10 20 30-30
-20
-10
0
10
20
30
0.94
0.96
0.98
1
1.02
1.04
1.06
1.08
1.1
1.12
1.14
, ,1
1 ( )M
i rms i rms mu uM
= ∑ x
0.9
0.95
0.95
1
1
1
1.05
1.05
0.9
Horizontal Axis [mm]
Ver
tical
Axi
s [m
m]
Turbulence fluctuation isotropyXY Cross section at Z =0mm
-30 -20 -10 0 10 20 30-30
-20
-10
0
10
20
30
0.86
0.88
0.9
0.92
0.94
0.96
0.98
1
1.02
1.04
Task 2 – Turbulent SpeedsTurbulence Homogeneity and Isotropy

Run # LocationIntegral time scale [ms] Taylor microscale [ms]
Horizontal Vertical Horizontal Vertical285 0, 0, 0 13.5 12.5 0.60 0.45
1112 30, 0, 0 10.2 8.5 0.53 0.38943 -30, 0, 0 10.5 8.8 1.66 0.46
1015 0, 30, 0 11.3 11.6 1.36 2.091040 0, -30, 0 13.2 15.9 1.9 1.95
436 0, 0, 30 12.4 11.4 1.85 1.951592 0, 0, -30 10.1 9.9 1.43 1.43
Integral time scale comparable to flame experiment duration
0
( )t r dτ τ∞
Λ ≡ ∫2
22
0
2tr
τ
λτ
=
∂≡ −
∂
Task 2 – Turbulent Speeds

-40 -30 -20 -10 0 10 20 30 40-40
-30
-20
-10
0
10
20
30
40
Average velocityXY Cross section at Z =0mm
Horizontal (X) Axis [mm]
Ver
tical
(Y) A
xis
[mm
]
Task 2 – Turbulent SpeedsResults Indicate a (Slow) Overall Vortex Pattern

• Radial pattern
• Test region average 0.58 m/s
0.50.6
0.7
0.4
0.80.9
0.3
0.2
0.8
1
0.8
1.1
Horizontal Axis [mm]
Ver
tical
Axi
s [m
m]
2D average velocityXY Cross section at Z =0mm
-30 -20 -10 0 10 20 30-30
-20
-10
0
10
20
30m/s
0.2
0.3
0.4
0.5
0.6
0.7
0.8
0.9
1
1.1
Task 2 – Turbulent Speeds2-D Average Velocity Results
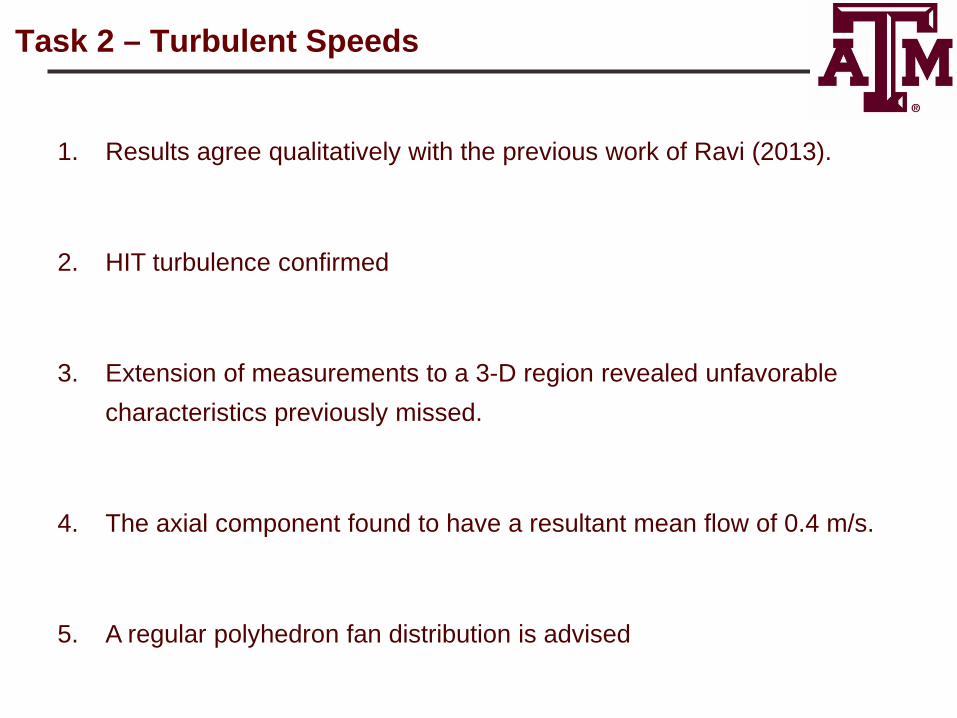
1. Results agree qualitatively with the previous work of Ravi (2013).
2. HIT turbulence confirmed
3. Extension of measurements to a 3-D region revealed unfavorable characteristics previously missed.
4. The axial component found to have a resultant mean flow of 0.4 m/s.
5. A regular polyhedron fan distribution is advised
Task 2 – Turbulent Speeds

Task 3 – Experiments and Kinetics of Syngas Blends with Impurities
1. Study Impurity Composition Effect
• Ignition delay time (τign) measurements in a shock tube
• Laminar flame speed measurements
• Large range of P, T
2. Kinetics Modeling of Impurities
Overall Task Has 2 Main Goals
Task 3 – Impurity Effects

1. H2S Impurity Effect on Laminar Flame Speeds for Coal Syngas
2. H2S Oxidation Kinetics and Shock-Tube Measurements
Update Today Will Focus on 2 Main ProjectsTask 3 – Impurity Effects

Vessel Internal Dimensions:
31.8 cm Diameter
28 cm Length
12.7 cm Window Diameter
High-Temperature, High-Pressure Vessel Used forLaminar Flame Experiments
Task 3 – Impurity Effects

Laminar Flame Speed Measurements PerformedWith H2S Impurity
• Baseline “coal” syngas: 60% CO / 40% H2
• Equivalence ratio Sweep
• Pressure: 1 atm
• H2S: 1% by Volume
• Argon instead of N2
Task 3 – Impurity Effects

Mixtures Investigated (Mole Fraction)
Mixture Fuel Oxidizer
CO H2 H2S O2 N2 Ar
Coal - Neat, Air 0.6 0.4 - 0.21 0.79 -
Coal - Neat, Argon 0.6 0.4 - 0.145 - 0.855
Coal - 1% H2S, Argon 0.594 0.396 0.01 0.145 - 0.855
Mixtures Investigated for Flame Speed Study
Task 3 – Impurity Effects
O2/Ar ratio chosen to match Flame Temp with air over same φ range

0.5 1.0 1.5 2.0 2.5 3.00
20
40
60
80
100
120
140
160
1% H2S
S°L,
u (cm
/s)
φ
NEAT
Model: NUIG mechanism with TAMU H2S kinetics
H2S Has Small Effect and Only for Rich Mixtures
Task 3 – Impurity Effects

0.5 1.0 1.5 2.0 2.5 3.00
20
40
60
80
100
120
140
160
180
1% H2S, Ar
NEAT, Ar
S°L,
u (cm
/s)
φ
NEAT, Air
Argon-Based Flame Speeds Noticeably Lower than N2-Based Ones
Task 3 – Impurity Effects

Argon-Diluted Mixture Markstein Lengths
0.5 1.0 1.5 2.0 2.5 3.0-0.08
-0.06
-0.04
-0.02
0.00
0.02
0.04
0.06
0.08
Coal, Ar - Neat, Markstein Coal, Ar 1% H2S, Markstein
L b (c
m)
φ
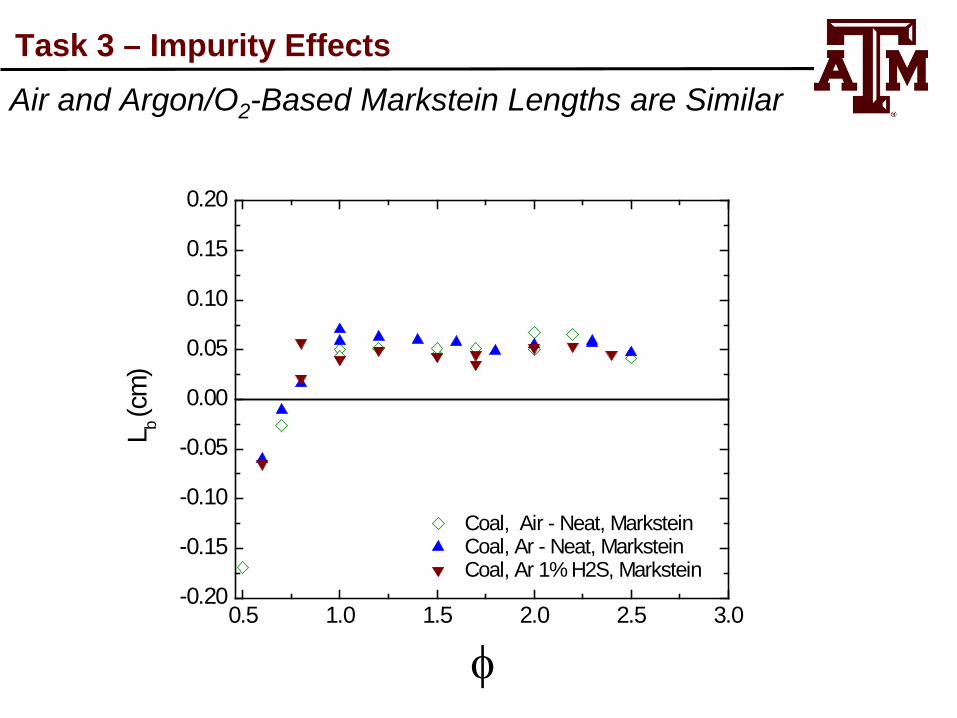
0.5 1.0 1.5 2.0 2.5 3.0-0.20
-0.15
-0.10
-0.05
0.00
0.05
0.10
0.15
0.20
L b
(cm
)
φ
Coal, Air - Neat, Markstein Coal, Ar - Neat, Markstein Coal, Ar 1% H2S, Markstein
Air and Argon/O2-Based Markstein Lengths are Similar
Task 3 – Impurity Effects

Shock-Tube Experiments Focused on H2S Oxidation
• H2S – O2 – Argon mixtures (98% Ar dilution)
• Equivalence ratios: 0.5, 1.0, 1.5
• Pressure: 1.7 atm
• Ignition delay times
• Water concentration time histories
Task 3 – Impurity Effects

High-Pressure Shock-Tube Facility
• 1 – 100 atm Capability
• 600 – 4000 K Test Temperature
• Up to 20 ms Test Time
• 2.46 m Driver and 4.72 m Driven
• 15.24 cm Driven Inner Diameter
Time-Interval Measurement
Vacuum System
Driven Section (4.72 m) Driver Section (2.46 m)
Expansion Section / Diaphragm Location
Access PortWeldless Flange6
High pressure shock-tube facility at Texas A&M
Task 3 – Impurity Effects

0 0.0004 0.0008 0.0012Time (s)
0
0.4
0.8
1.2
Nor
mal
ized
OH
* em
issi
on
0
1
2
3
Pres
sure
(atm
)τign
Ignition Delay Time Obtained from OH* Time History
Concave Reflecting Mirror (f)
Adjustable width slit
Optical Window
PMT
Shock tube
OH*
• A2 Σ+ (OH*) light at 307 nm
• Highly Diluted Mixtures (98% Ar)
Task 3 – Impurity Effects

• Control and monitoring of laser‒ Toptica Photonics DL 100: CW, narrow width laser ‒ Toptica Photonics DC 110: current and temperature control‒ Burleigh WA-1000: monitoring of laser wavelength
• Common mode rejection
• Lexan enclosures‒ Purged by N2
‒ Monitored by hygrometer‒ < 0.1% RH for all experiments
Tunable laser diagnostic used for transient H2O concentrations
Reacting gases Endwall
Reflected shock N2-flooded
environment
Lens I detector
Iris and BP filter
Laser
I0 detector
50/50 BS
90/10 BS To wavemeter
Task 3 – Impurity Effects
Hygrometer
Transmitted side (𝑰)
Laser
Laser controller Wavemeter
Incident side (𝑰𝟎)
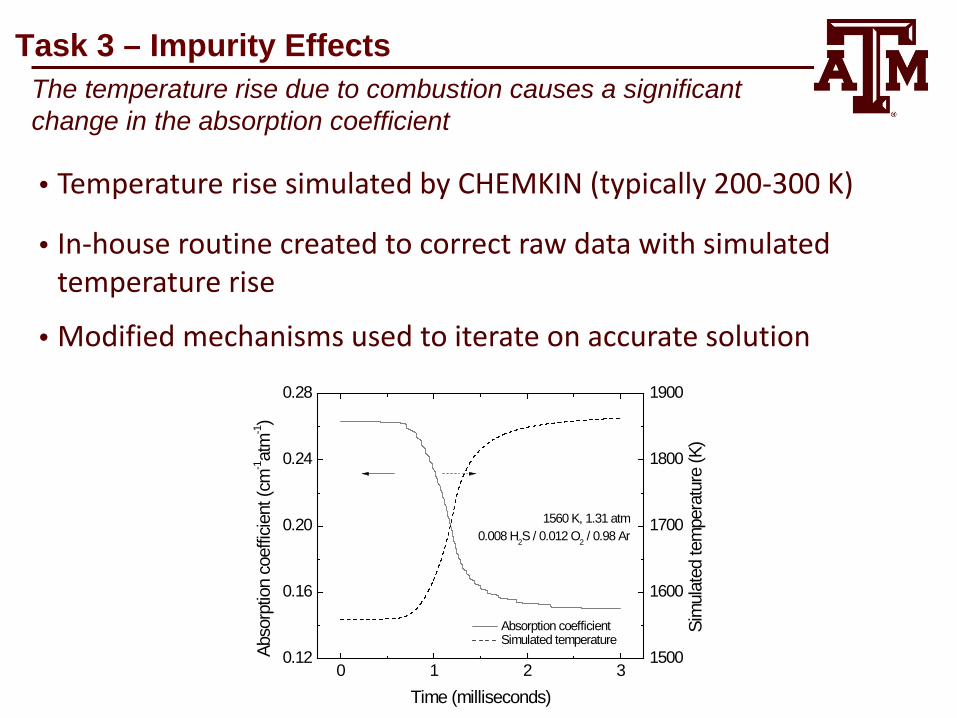
• Temperature rise simulated by CHEMKIN (typically 200-300 K)
• In-house routine created to correct raw data with simulated temperature rise
• Modified mechanisms used to iterate on accurate solution
The temperature rise due to combustion causes a significant change in the absorption coefficient
0 1 2 30.12
0.16
0.20
0.24
0.28
Absorption coefficient Simulated temperature
Time (milliseconds)
Abso
rptio
n co
effic
ient
(cm
-1at
m-1)
1560 K, 1.31 atm0.008 H2S / 0.012 O2 / 0.98 Ar
1500
1600
1700
1800
1900
Sim
ulat
ed te
mpe
ratu
re (K
)
Task 3 – Impurity Effects

Typical OH* and H2S Time Histories Show Main IgnitionDuring Middle of Water Formation
Task 3 – Impurity Effects
0 500 1000 1500 2000
0.000
0.002
0.004
0.006
0.008 H2S in 98% Ar, φ=1.0
H2O (1611 K, 1.29 atm)
OH* (1620 K, 1.07 atm)
Time (µs)
X wa
ter
0.0
0.2
0.4
0.6
0.8
1.0
Nor
mal
ized
OH*
sig
nal

4.5 5.0 5.5 6.0 6.5 7.0100
1000
H2S in 98% Ar, 1 atmφ = 0.5φ = 1.0φ = 1.5Ig
nitio
n de
lay
time
(µs)
10000/T (K-1)
First Ignition Delay Time Results Obtained for H2SOxidation
Task 3 – Impurity Effects

• All recent literature based on model from Zhou, Haynes, et al., 2013
• Original model from Zhou et al. not in good agreement with the new set of data.
• Model from Mathieu, Petersen et al. (2014) not working well here.
• This study: fair agreement with new data and w/ former literature ST data => new meas. helpful
• Not possible to reconcile both shock tube and flow reactor data w/ current models.
5 6 710
100
1000
H2S in 98% Ar, φ = 1.0, 1 atm
Experimental data Zhou et al. (2013) Mathieu et al. (2014) Bongartz and Ghoniem (2015) Bongartz and Ghoniem (2015) - optimized for ST Mohammed et al. (2015) This study (optimized for ignition time results only)
Igni
tion
dela
y tim
e (µ
s)
10,000/T5 (K-1)
Kinetics Modeling of Ignition is Ongoing…
Task 3 – Impurity Effects

Kinetics Model Predicts Shape of OH* Time History Rather Well
Task 3 – Impurity Effects
0 500 1000 1500 2000 25000.0
0.5
1.0
Norm
alize
d O
H*
Time (µs)
Normalized signal Zhou et al. (2013) This study

0 500 1000 1500 2000 2500
0.000
0.002
0.004
0.006
0.008
H2S in 98% Ar, φ = 1.0
X H2
O
Time (µs)
1515 K, 1.35 atm 1685 K, 1.29 atm 1784 K, 1.25 atm
0 500 1000 1500 2000 2500
0.000
0.002
0.004
0.006
0.008
H2S in 98% Ar
X H2
O
Time (µs)
1774 K, φ = 0.5 1784 K, φ = 1.0 1776 K, φ = 1.5
Water Time Histories Provide Valuable Information forImproving H2S Kinetics Mechanism
Task 3 – Impurity Effects
Effect of Temperature
Effect of φ
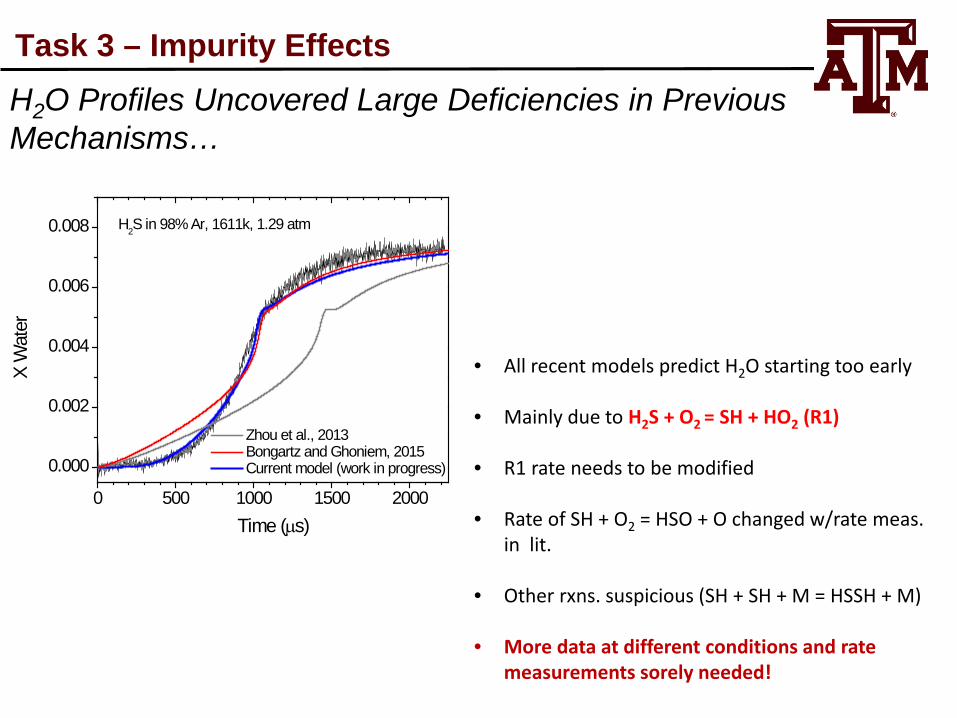
• All recent models predict H2O starting too early
• Mainly due to H2S + O2 = SH + HO2 (R1)
• R1 rate needs to be modified
• Rate of SH + O2 = HSO + O changed w/rate meas. in lit.
• Other rxns. suspicious (SH + SH + M = HSSH + M)
• More data at different conditions and rate measurements sorely needed!
0 500 1000 1500 2000
0.000
0.002
0.004
0.006
0.008
H2S in 98% Ar, 1611k, 1.29 atm
X W
ater
Time (µs)
Zhou et al., 2013 Bongartz and Ghoniem, 2015 Current model (work in progress)
H2O Profiles Uncovered Large Deficiencies in PreviousMechanisms…
Task 3 – Impurity Effects
Task 4 – Design and Construction of a Turbulent Flame Speed Facility
Task 4 – New Facility
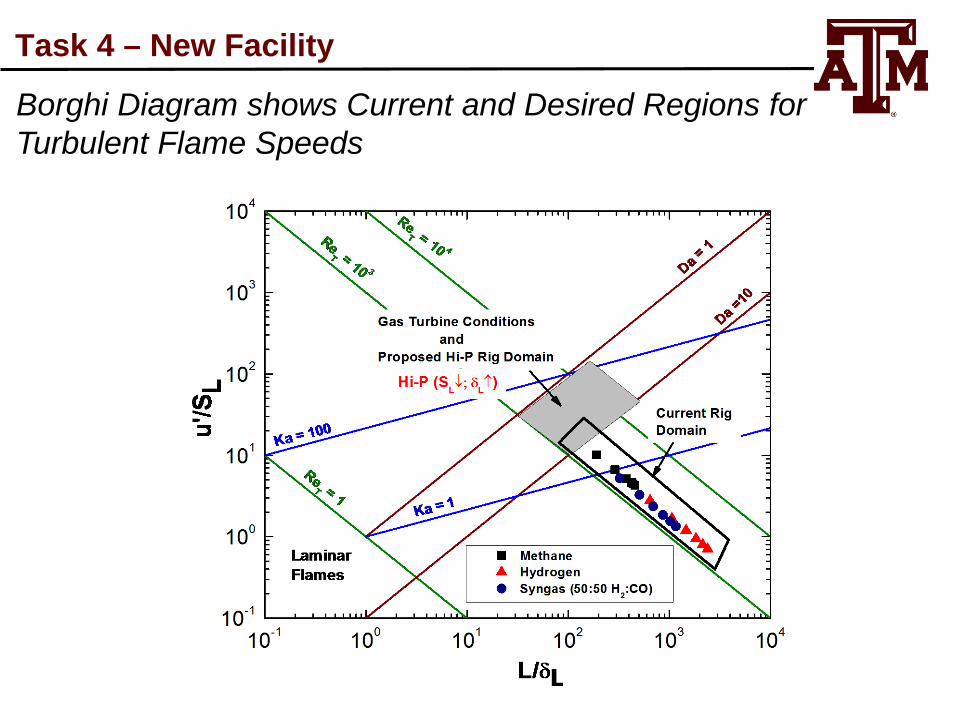
Borghi Diagram shows Current and Desired Regions for Turbulent Flame Speeds
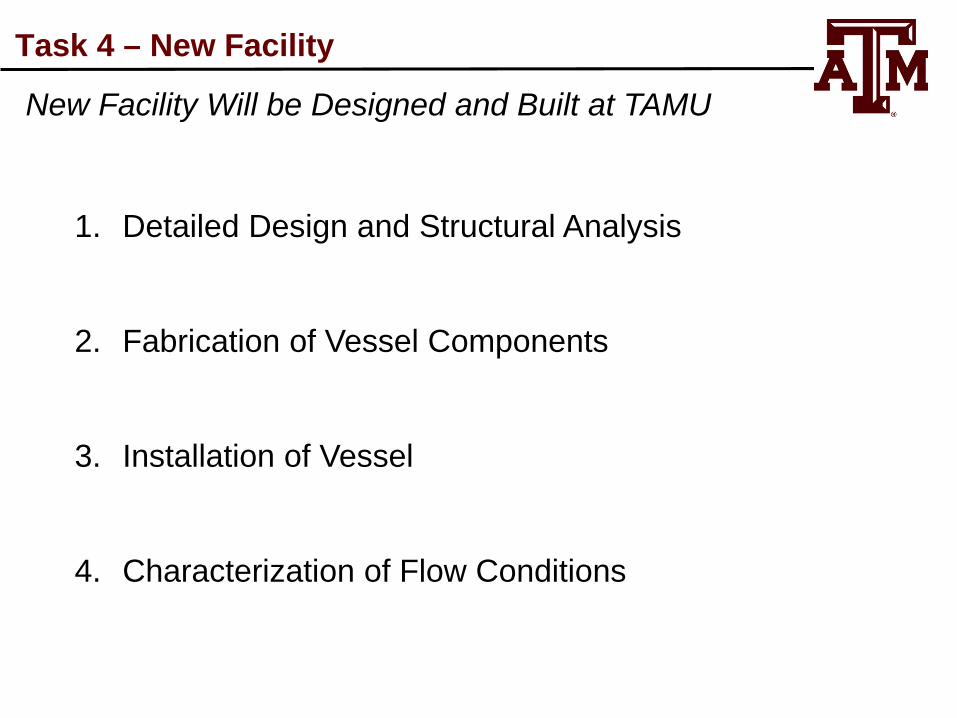
New Facility Will be Designed and Built at TAMU
1. Detailed Design and Structural Analysis
2. Fabrication of Vessel Components
3. Installation of Vessel
4. Characterization of Flow Conditions
Task 4 – New Facility

Task 4 Design and Installation is Underway
• Survey of Existing Turbulent Flame Speed Facilities Completed
• Trade-off Study for Final Design Finished
• Critical Aspect is how to Handle or Reduce the Overpressure
• Will Move Toward a Design that Involves a Blowout Disk and Reservoir for Overpressure
• Detail Design is Complete
• Fabrication is Underway
Task 4 – New Facility
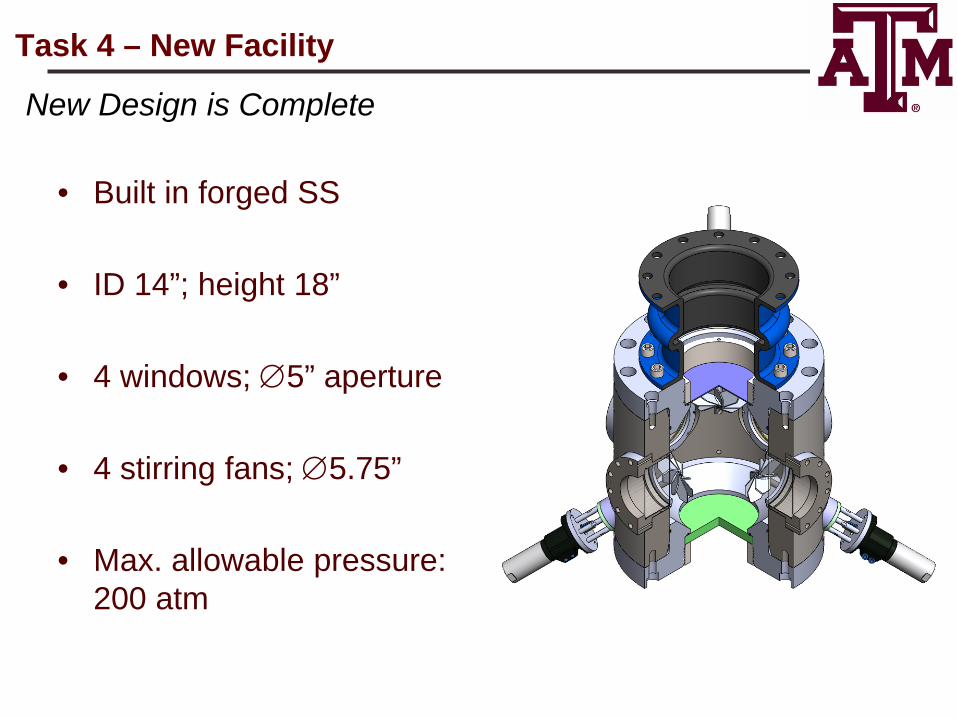
• Built in forged SS
• ID 14”; height 18”
• 4 windows; ∅5” aperture
• 4 stirring fans; ∅5.75”
• Max. allowable pressure: 200 atm
Task 4 – New Facility
New Design is Complete

• Breach ∅8”
• Vented deflagration through diaphragm (top)
• Bottom breach is reconfigurable:– Heater– Injection port– Spark plug gland
Task 4 – New Facility
Breach and Diaphragm Method Selected for Venting
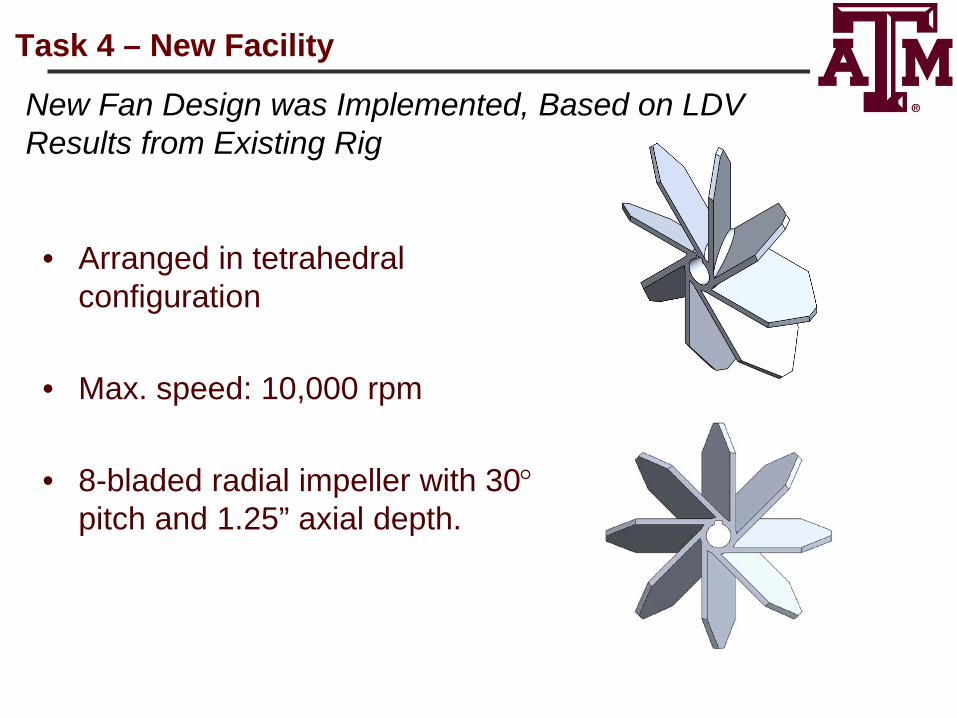
• Arranged in tetrahedral configuration
• Max. speed: 10,000 rpm
• 8-bladed radial impeller with 30°pitch and 1.25” axial depth.
Task 4 – New Facility
New Fan Design was Implemented, Based on LDVResults from Existing Rig

• Fused quartz substrate
• Two orthogonal lines of sight
• Size and proportions of window and vessel have been proven to produce data free of ignition and confinement effects.
Task 4 – New Facility
Optical Access Allows 2 Lines of Sight and Based on Prior Experience

Task 5 – High-Pressure Turbulent Flame Speed Measurements

High-Pressure Experiments Will be Performed for Selected Syngas Blends
• Identify Two Test Matrices (Fuel Blends) for Study
• Utilize Results from Tasks 2 and 3 for Guidance
• Perform Experiments at Elevated Pressures
• Parallel High-Pressure Laminar Tests Should also be Done
Task 5 – High-Pressure Turbulence
Progress on the Five Main Work Tasks for the Project Was Presented
Task 1 – Project Management and Program Planning
Task 2 – Turbulent Flame Speed Measurements at Atmospheric Pressure
Task 3 – Experiments and Kinetics of Syngas Blends with Impurities
Task 4 – Design and Construction of a High-Pressure Turbulent Flame Speed Facility
Task 5 – High-Pressure Turbulent Flame Speed Measurements
Summary


Recent Data Cover a Wide Range of Flamelet Regions
Task 2 – Turbulent Speeds
10-1 100 101 102 103 10410-1
100
101
102
103
CH4
Syngas50-50 CH4-H2
H2
Distributed Reactions
Thin Reaction Zone
Corrugated Flamelet
Wrinkled Flamelet
Da =1
u'
/SL
L/δl
Ka = 1Re
L = 1
u' = SLLaminarFlame


![Scaling Turbulent Flame Speeds of Negative Markstein ... · measurements have shown that pressure both increases and has no effect on turbulent burning velocities [10, 12]; a Markstein](https://img.dokumen.tips/doc/110x75/5b62f97c7f8b9a6c178b696a/scaling-turbulent-flame-speeds-of-negative-markstein-measurements-have-shown.jpg)