Embed Size (px)
Citation preview

HIGH-PRESSURE GH2/GO2 COMBUSTION DYNAMICS
By
CLARK ALEXANDER CONLEY
A THESIS PRESENTED TO THE GRADUATE SCHOOL OF THE UNIVERSITY OF FLORIDA IN PARTIAL FULFILLMENT
OF THE REQUIREMENTS FOR THE DEGREE OF MASTER OF SCIENCE
UNIVERSITY OF FLORIDA
2006

Copyright 2006
by
Clark Alexander Conley

I dedicate this thesis to my wonderful wife Wendy and my very supportive and loving family: Mom, Dad, Ben, and Julie.

iv
ACKNOWLEDGMENTS
I thank my wife, Wendy, for being so supportive and loving. I thank my parents
for supporting me and keeping me out of trouble. I thank my brother, Ben, and my sister,
Julie, for getting me into trouble. I thank Dr. Corin Segal for guiding me in this research
and providing this wonderful opportunity to progress my education and research abilities.
I thank all of my fellow researchers in the combustion lab that assisted me in this
research. Finally, I thank NASA Marshall for its support in this research.

v
TABLE OF CONTENTS page
ACKNOWLEDGMENTS ................................................................................................. iv
LIST OF TABLES............................................................................................................ vii
LIST OF FIGURES ......................................................................................................... viii
LIST OF OBJECTS ......................................................................................................... xvi
NOMENCLATURE ....................................................................................................... xvii
ABSTRACT..................................................................................................................... xix
CHAPTER
1 INTRODUCTION ........................................................................................................1
Safer, Cheaper, and More Reliable Rocket Engines.....................................................2 Literature Review .........................................................................................................4
2 METHODS.................................................................................................................10
The H2/O2 Injection/Combustion Process ..................................................................10 H2-O2 Reaction Chemistry ..................................................................................11 Propellant Flow Properties and Calculations ......................................................12 Heat Flux Calculations ........................................................................................15
Data Processing Methodologies .................................................................................17 The Role of Matlab..............................................................................................17 Standardized filenames........................................................................................17 Data processing programs ...................................................................................17
3 HIGH-PRESSURE COMBUSTION FACILITY.......................................................20
Combustor System......................................................................................................20 Combustion Chamber..........................................................................................20
Chamber material .........................................................................................21 Chamber geometry .......................................................................................21 Optical access ...............................................................................................22 Other chamber features ................................................................................25

vi
Injector.................................................................................................................26 Injector material ...........................................................................................26 Injector geometry .........................................................................................27
Other Combustor System Components ...............................................................28 Exhaust nozzle..............................................................................................28 Chamber extensions .....................................................................................29 Igniter ...........................................................................................................29
Propellant Feed System ..............................................................................................30 Control/DAQ System..................................................................................................35
Electronics system...............................................................................................36 Control/DAQ Hardware ......................................................................................36
Computer hardware ......................................................................................37 DAQ sensors ................................................................................................37 Laser and imaging systems ..........................................................................42
Labview GUI .......................................................................................................43 HPCF Assembly and Operation..................................................................................44
4 RESULTS...................................................................................................................59
5 DISCUSSION AND CONCLUSION ......................................................................102
High-Pressure Combustion Facility Obstacles and Improvements ..........................102 High-Pressure GH2/GO2 Combustion Dynamics .....................................................104
Initial Unstable/Unsteady Flow.........................................................................105 Pressure Effect on Wall Heat Flux ....................................................................106 Effect of Chamber Length .................................................................................110 High-Frequency Pressure Transducer ...............................................................110 Imaging Discussion ...........................................................................................111
Conclusion ................................................................................................................112
APPENDIX
A LABVIEW AND MATLAB CODES ......................................................................114
B OPERATIONAL PROCEDURE AND ASSEMBLY INSTRUCTIONS FOR UF HPCF ........................................................................................................................116
C CALIBRATION CURVES AND EQUATIONS.....................................................124
LIST OF REFERENCES.................................................................................................131
BIOGRAPHICAL SKETCH ...........................................................................................134

vii
LIST OF TABLES
Table page 1-1 Coaxial-shear injector features comparison. Includes UF injectors, Penn State
injectors, Space Shuttle Main Engine injectors, and Gas-Gas Injector Technology Injectors..................................................................................................9
3-1 Distances from the injector face to the heat flux sensors for all injector position/chamber arrangement combinations. All dimensions in inches. ...............54
3-2 Description of each component on the HPCF Control Interface and HPCF-HFPT Interface front panels (Labview GUI’s). Numbers are referenced to Figures 3-15 and 3-16...............................................................................................................57
4-1 Combustion test configurations, operating conditions, and included figures. .........61
B-1 Extension stem sleeve designation for the three different injector positions. ........121
B-2 List of DAQ channel/thermocouple usage. ............................................................123
C-1 Table of calibration factors for the chamber and propellant line pressure transducers..............................................................................................................130
viii
LIST OF FIGURES
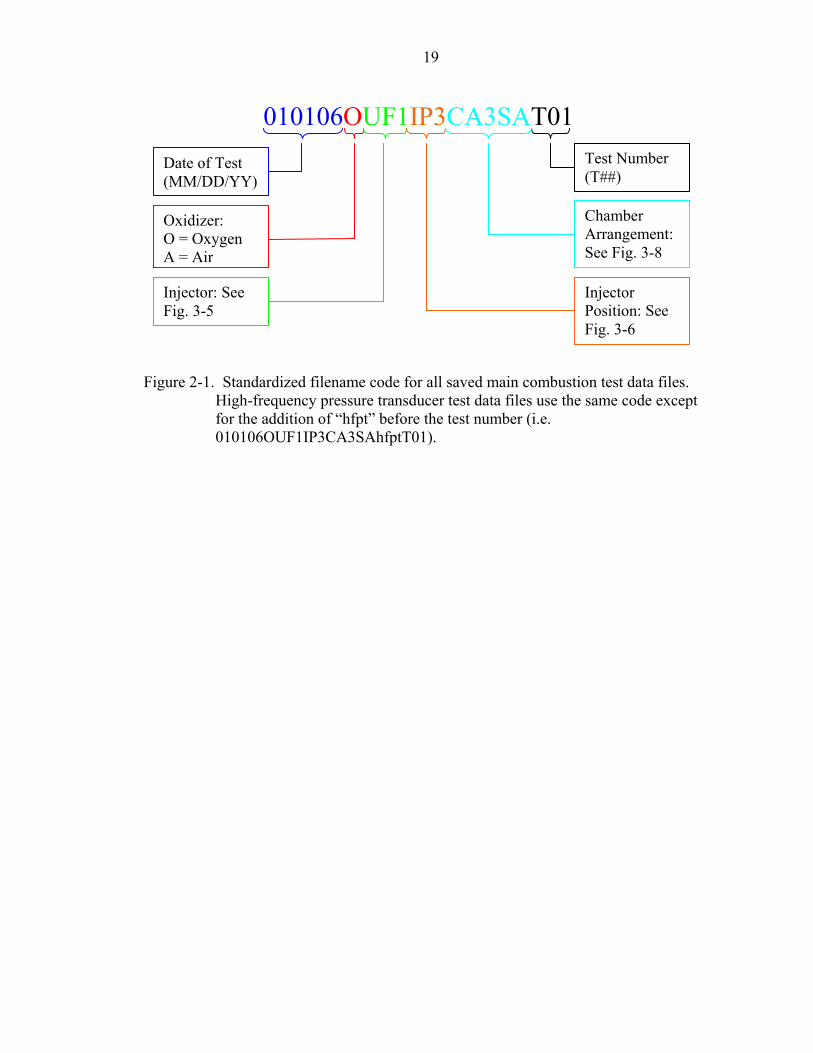
Figure page 2-1 Standardized filename code for all saved main combustion test data files. High-
frequency pressure transducer test data files use the same code except for the addition of “hfpt” before the test number (i.e., 010106UF1IP3CA3SAhfptT01)....19
3-1 ProEngineer/ProMechanica stress models for the combustion chamber loaded at 10 MPa internal pressure. A) is the normal stress (MPa). B) is the shear stress (MPa)........................................................................................................................45
3-2 ProEngineer/ProMechanica transient thermal analysis on the combustion chamber with heat flux conditions based on a stoichiometric flame. Maximum temperature (y-axis) represents the hottest point anywhere in the chamber. ...........46
3-3 Cross sectional drawing of the combustion chamber and chamber extensions. All dimensions are in inches. The thermocouple holes at the top of the figure are for the pair of thermocouples that form each heat flux sensor (HFS). ...............46
3-4 Cross-sectional CAD image of the window mounting. The two o-ring grooves completely circumnavigate the window. The viewable diameter through the window is 0.81”........................................................................................................47
3-5 Cross-sectional CAD image of the injector assembly. Indicates various components as well as the dimensions of the 3 UF HPCF injectors: UF0 (GH2/Air), UF1 (GH2/GO2), UF2 (GH2/GO2). ........................................................47
3-6 Cross-sectional drawing of injector indicating the distance from the outer face of the chamber/chamber extension to the face of the injector for the three injector positions IP1, IP2, and IP3. ......................................................................................48
3-7 Cross-sectional CAD image of the injector assembly and the exhaust nozzle assembly attached to the combustion chamber. .......................................................48
3-8 Pictorial of the different chamber arrangements possible for the HPCF. Flow path is left to right. CC – combustion chamber. SE – short chamber extension. LE – long chamber extension...................................................................................49
3-9 Drawing of the injector face, indicating notable dimensions of the injector assembly face and locations of the injector face thermocouples. Dimensions in inches........................................................................................................................50
ix
3-10 Schematic drawing of the HPCF propellant/purge feed system. Number on bottles indicates the number of bottles in the array for that gas...............................51
3-11 Flowchart of the control/DAQ system. ....................................................................52
3-12 Circuit diagram for the electronics system...............................................................53
3-13 Circuit diagram for the non-inverting operational amplifier....................................55
3-14 Picture of the combustor system assembled, including the combustion chamber, injector assembly, exhaust nozzle assembly, two short chamber extensions, and instrumentation.........................................................................................................55
3-15 HPCF Control Interface front panel (Labview GUI). Numbers referenced to Table 3-2. .................................................................................................................56
3-16 HPCF-HFPT Interface front panel (Labview GUI). Numbers are referenced to Table 3-2. .................................................................................................................57
4-1 Chamber pressure versus time for a GH2/GO2 combustion test with Pchamber = 6.21 MPa, mO2/mH2 = 3.97, and vO2/vH2 = 0.46 (Ф = 2.0, mO2 = 1.565 g/s, mH2 = 0.396 g/s, vH2 = 144.2 m/s). Injector = UF1. Injector position = IP3. Chamber arrangement = CA3SA. Ignition and shutdown times indicated for this full data set. ............................................................................................................................62
4-2 Heat flux versus time for a GH2/GO2 combustion test with Pchamber = 6.21 MPa, mO2/mH2 = 3.97, and vO2/vH2 = 0.46 (Ф = 2.0, mO2 = 1.565 g/s, mH2 = 0.396 g/s, vH2 = 144.2 m/s). Injector = UF1. Injector position = IP3. Chamber arrangement = CA3SA. Legend indicates distance from injector face to heat flux sensor. Ignition and shutdown times indicated for this full data set. Heat flux calculations performed using steady state heat flux equation (Equation 2.15)..........................................................................................................................63
4-3 Injector face temperatures, behind injector temperature, and exhaust nozzle temperature versus time for a GH2/GO2 combustion test with Pchamber = 6.21 MPa, mO2/mH2 = 3.97, and vO2/vH2 = 0.46 (Ф = 2.0, mO2 = 1.565 g/s, mH2 = 0.396 g/s, vH2 = 144.2 m/s). Injector = UF1. Injector position = IP3. Chamber arrangement = CA3SA. The legend indicates r as the radial distance from the injector center axis to the injector face thermocouple. Ignition and shutdown times indicated for this full data set. ........................................................................64
4-4 Chamber pressure versus time for a GH2/GO2 combustion test with Pchamber = 4.86 MPa, mO2/mH2 = 3.97, and vO2/vH2 = 0.46 (Ф = 2.0, mO2 = 1.565 g/s, mH2 = 0.396 g/s, vH2 = 197.4 m/s). Injector = UF1. Injector position = IP3. Chamber arrangement = CA3SA. ............................................................................................65
x
4-5 Heat flux versus time for a GH2/GO2 combustion test with Pchamber = 4.86 MPa, mO2/mH2 = 3.97, and vO2/vH2 = 0.46 (Ф = 2.0, mO2 = 1.565 g/s, mH2 = 0.396 g/s, vH2 = 197.4 m/s). Injector = UF1. Injector position = IP3. Chamber arrangement = CA3SA. Legend indicates distance from injector face to heat flux sensor. Heat flux calculations performed using steady state heat flux equation (Equation 2.15). .........................................................................................66
4-6 Injector face temperatures, behind injector temperature, and exhaust nozzle temperature versus time for a GH2/GO2 combustion test with Pchamber = 4.86 MPa, mO2/mH2 = 3.97, and vO2/vH2 = 0.46 (Ф = 2.0, mO2 = 1.565 g/s, mH2 = 0.396 g/s, vH2 = 197.4 m/s). Injector = UF1. Injector position = IP3. Chamber arrangement = CA3SA. The legend indicates r as the radial distance from the injector center axis to the injector face thermocouple..............................................67
4-7 Chamber pressure versus time for a GH2/GO2 combustion test with Pchamber = 4.55 MPa, mO2/mH2 = 3.97, and vO2/vH2 = 0.46 (Ф = 2.0, mO2 = 1.565 g/s, mH2 = 0.396 g/s, vH2 = 235.0 m/s). Injector = UF1. Injector position = IP3. Chamber arrangement = CA3SA. ............................................................................................68
4-8 Heat flux versus time for a GH2/GO2 combustion test with Pchamber = 4.55 MPa, mO2/mH2 = 3.97, and vO2/vH2 = 0.46 (Ф = 2.0, mO2 = 1.565 g/s, mH2 = 0.396 g/s, vH2 = 235.0 m/s). Injector = UF1. Injector position = IP3. Chamber arrangement = CA3SA. Legend indicates distance from injector face to heat flux sensor. Heat flux calculations performed using steady state heat flux equation (Equation 2.15). .........................................................................................69
4-9 Injector face temperatures, behind injector temperature, and exhaust nozzle temperature versus time for a GH2/GO2 combustion test with Pchamber = 4.55 MPa, mO2/mH2 = 3.97, and vO2/vH2 = 0.46 (Ф = 2.0, mO2 = 1.565 g/s, mH2 = 0.396 g/s, vH2 = 235.0 m/s). Injector = UF1. Injector position = IP3. Chamber arrangement = CA3SA. The legend indicates r as the radial distance from the injector center axis to the injector face thermocouple..............................................70
4-10 Chamber pressure versus time for a GH2/GO2 combustion test with Pchamber = 2.76 MPa, Ф mO2/mH2 = 3.97, and vO2/vH2 = 0.46 (Ф = 2.0, mO2 = 1.565 g/s, mH2 = 0.396 g/s, vH2 = 468.3 m/s). Injector = UF1. Injector position = IP3. Chamber arrangement = CA3SA. ............................................................................71
4-11 Heat flux versus time for a GH2/GO2 combustion test with Pchamber = 2.76 MPa, Ф mO2/mH2 = 3.97, and vO2/vH2 = 0.46 (Ф = 2.0, mO2 = 1.565 g/s, mH2 = 0.396 g/s, vH2 = 468.3 m/s). Injector = UF1. Injector position = IP3. Chamber arrangement = CA3SA. Legend indicates distance from injector face to heat flux sensor. Heat flux calculations performed using steady state heat flux equation (Equation 2.15). .........................................................................................72

xi
4-12 Injector face temperatures, behind injector temperature, and exhaust nozzle temperature versus time for a GH2/GO2 combustion test with Pchamber = 2.76 MPa, mO2/mH2 = 3.97, and vO2/vH2 = 0.46 (Ф = 2.0, mO2 = 1.565 g/s, mH2 = 0.396 g/s, vH2 = 468.3 m/s). Injector = UF1. Injector position = IP3. Chamber arrangement = CA3SA. The legend indicates r as the radial distance from the injector center axis to the injector face thermocouple..............................................73
4-13 Chamber pressure versus time for a GH2/GO2 combustion test with Pchamber = 6.21 MPa, mO2/mH2 = 5.97, and vO2/vH2 = 0.70 (Ф = 1.33, mO2 = 1.693 g/s, mH2 = 0.285 g/s, vH2 = 102.5 m/s). Injector = UF1. Injector position = IP3. Chamber arrangement = CA3SA. ............................................................................74
4-14 Heat flux versus time for a GH2/GO2 combustion test with Pchamber = 6.21 MPa, mO2/mH2 = 5.97, and vO2/vH2 = 0.70 (Ф = 1.33, mO2 = 1.693 g/s, mH2 = 0.285 g/s, vH2 = 102.5 m/s). Injector = UF1. Injector position = IP3. Chamber arrangement = CA3SA. Legend indicates distance from injector face to heat flux sensor. Heat flux calculations performed using steady state heat flux equation (Equation 2.15). .........................................................................................75
4-15 Injector face temperatures, behind injector temperature, and exhaust nozzle temperature versus time for a GH2/GO2 combustion test with Pchamber = 6.21 MPa, mO2/mH2 = 5.97, and vO2/vH2 = 0.70 (Ф = 1.33, mO2 = 1.693 g/s, mH2 = 0.285 g/s, vH2 = 102.5 m/s). Injector = UF1. Injector position = IP3. Chamber arrangement = CA3SA. The legend indicates r as the radial distance from the injector center axis to the injector face thermocouple..............................................76
4-16 Chamber pressure versus time for a GH2/GO2 combustion test with Pchamber = 4.86 MPa, mO2/mH2 = 5.97, and vO2/vH2 = 0.70 (Ф = 1.33, mO2 = 1.693 g/s, mH2 = 0.285 g/s, vH2 = 140.0 m/s). Injector = UF1. Injector position = IP3. Chamber arrangement = CA3SA. ............................................................................77
4-17 Heat flux versus time for a GH2/GO2 combustion test with Pchamber = 4.86 MPa, mO2/mH2 = 5.97, and vO2/vH2 = 0.70 (Ф = 1.33, mO2 = 1.693 g/s, mH2 = 0.285 g/s, vH2 = 140.0 m/s). Injector = UF1. Injector position = IP3. Chamber arrangement = CA3SA. Legend indicates distance from injector face to heat flux sensor. Heat flux calculations performed using steady state heat flux equation (Equation 2.15). .........................................................................................78
4-18 Injector face temperatures, behind injector temperature, and exhaust nozzle temperature versus time for a GH2/GO2 combustion test with Pchamber = 4.86 MPa, mO2/mH2 = 5.97, and vO2/vH2 = 0.70 (Ф = 1.33, mO2 = 1.693 g/s, mH2 = 0.285 g/s, vH2 = 140.0 m/s). Injector = UF1. Injector position = IP3. Chamber arrangement = CA3SA. The legend indicates r as the radial distance from the injector center axis to the injector face thermocouple..............................................79
xii
4-19 Chamber pressure versus time for a GH2/GO2 combustion test with Pchamber = 4.55 MPa, mO2/mH2 = 5.97, and vO2/vH2 = 0.70 (Ф = 1.33, mO2 = 1.693 g/s, mH2 = 0.285 g/s, vH2 = 166.1 m/s). Injector = UF1. Injector position = IP3. Chamber arrangement = CA3SA. ............................................................................80
4-20 Heat flux versus time for a GH2/GO2 combustion test with Pchamber = 4.55 MPa, mO2/mH2 = 5.97, and vO2/vH2 = 0.70 (Ф = 1.33, mO2 = 1.693 g/s, mH2 = 0.285 g/s, vH2 = 166.1 m/s). Injector = UF1. Injector position = IP3. Chamber arrangement = CA3SA. Legend indicates distance from injector face to heat flux sensor. Heat flux calculations performed using steady state heat flux equation (Equation 2.15). .........................................................................................81
4-21 Injector face temperatures, behind injector temperature, and exhaust nozzle temperature versus time for a GH2/GO2 combustion test with Pchamber = 4.55 MPa, mO2/mH2 = 5.97, and vO2/vH2 = 0.70 (Ф = 1.33, mO2 = 1.693 g/s, mH2 = 0.285 g/s, vH2 = 166.1 m/s). Injector = UF1. Injector position = IP3. Chamber arrangement = CA3SA. The legend indicates r as the radial distance from the injector center axis to the injector face thermocouple..............................................82
4-22 Chamber pressure versus time for a GH2/GO2 combustion test with Pchamber = 2.76 MPa, mO2/mH2 = 5.97, and vO2/vH2 = 0.70 (Ф = 1.33, mO2 = 1.693 g/s, mH2 = 0.285 g/s, vH2 = 322.9 m/s). Injector = UF1. Injector position = IP3. Chamber arrangement = CA3SA. ............................................................................83
4-23 Heat flux versus time for a GH2/GO2 combustion test with Pchamber = 2.76 MPa, mO2/mH2 = 5.97, and vO2/vH2 = 0.70 (Ф = 1.33, mO2 = 1.693 g/s, mH2 = 0.285 g/s, vH2 = 322.9 m/s). Injector = UF1. Injector position = IP3. Chamber arrangement = CA3SA. Legend indicates distance from injector face to heat flux sensor. Heat flux calculations performed using steady state heat flux equation (Equation 2.15). .........................................................................................84
4-24 Injector face temperatures, behind injector temperature, and exhaust nozzle temperature versus time for a GH2/GO2 combustion test with Pchamber = 2.76 MPa, mO2/mH2 = 5.97, and vO2/vH2 = 0.70 (Ф = 1.33, mO2 = 1.693 g/s, mH2 = 0.285 g/s, vH2 = 322.9 m/s). Injector = UF1. Injector position = IP3. Chamber arrangement = CA3SA. The legend indicates r as the radial distance from the injector center axis to the injector face thermocouple..............................................85
4-25 Heat flux versus distance from injector face for GH2/GO2 combustion tests with mO2/mH2 = 3.97 and four different chamber pressures: 6.21 MPa, 4.86 MPa, 4.55 MPa, and 2.76 MPa (Ф = 2.0, mO2 = 1.565 g/s, mH2 = 0.396 g/s). Injector = UF1. Injector position = IP3. Chamber arrangement = CA3SA. Error bars indicate +/- the standard deviation for the averaged test data. Chamber pressures increased by decreasing exhaust nozzle diameter. Heat flux calculations performed using steady state heat equation (Equation 2.15). ..................................86
xiii
4-26 Heat flux versus distance from injector face for GH2/GO2 combustion tests with mO2/mH2 = 3.97 and four different chamber pressures: 6.21 MPa, 4.86 MPa, 4.55 MPa, and 2.76 MPa (Ф = 2.0, mO2 = 1.565 g/s, mH2 = 0.396 g/s). Injector = UF1. Injector position = IP3. Chamber arrangement = CA3SA. Chamber pressures increased by decreasing exhaust nozzle diameter. Heat flux calculations performed using steady state heat flux plus heat absorption equation (Equation 2.16).........................................................................................................87
4-27 Heat flux versus distance from injector face for GH2/GO2 combustion tests with mO2/mH2 = 5.97 and four different chamber pressures: 6.21 MPa, 4.86 MPa, 4.55 MPa, and 2.76 MPa (Ф = 1.33, mO2 = 1.693 g/s, mH2 = 0.285 g/s). Injector = UF1. Injector position = IP3. Chamber arrangement = CA3SA. Error bars indicate +/- the standard deviation for the averaged test data. Chamber pressures increased by decreasing exhaust nozzle diameter. Heat flux calculations performed using steady state heat flux equation (Equation 2.15). ...........................88
4-28 Heat flux versus distance from injector face for GH2/GO2 combustion tests with mO2/mH2 = 5.97 and four different chamber pressures: 6.21 MPa, 4.86 MPa, 4.55 MPa, and 2.76 MPa (Ф = 1.33, mO2 = 1.693 g/s, mH2 = 0.285 g/s). Injector = UF1. Injector position = IP3. Chamber arrangement = CA3SA. Chamber pressures increased by decreasing exhaust nozzle diameter. Heat flux calculations performed using steady state heat flux plus heat absorption equation (Equation 2.16).........................................................................................................89
4-29 Chamber wall temperature versus distance from injector face for GH2/GO2 combustion tests with mO2/mH2 = 3.97 and four different chamber pressures: 6.21 MPa, 4.86 MPa, 4.55 MPa, and 2.76 MPa (Ф = 2.0, mO2 = 1.565 g/s, mH2 = 0.396 g/s). Injector = UF1. Injector position = IP3. Chamber arrangement = CA3SA. Error bars indicate +/- the standard deviation for the averaged test data. Chamber pressures increased by decreasing exhaust nozzle diameter. Wall temperature calculations performed using Equation 2.17. ..............................90
4-30 Chamber wall temperature versus distance from injector face for GH2/GO2 combustion tests with mO2/mH2 = 5.97 and four different chamber pressures: 6.21 MPa, 4.86 MPa, 4.55 MPa, and 2.76 MPa (Ф = 1.33, mO2 = 1.693 g/s, mH2 = 0.285 g/s). Injector = UF1. Injector position = IP3. Chamber arrangement = CA3SA. Error bars indicate +/- the standard deviation for the averaged test data. Chamber pressures increased by decreasing exhaust nozzle diameter. Wall temperature calculations performed using Equation 2.17. ..............................91
4-31 Injector face temperature versus chamber pressure for GH2/GO2 combustion tests with mO2/mH2 = 3.97 (Ф = 2.0, mO2 = 1.565 g/s, mH2 = 0.396 g/s). Injector = UF1. Injector position = IP3. Chamber arrangement = CA3SA. Legend indicates r as the radial distance from the injector center axis to the injector face thermocouple. Bars indicate +/- the standard fluctuation from the average temperature. Chamber pressures increased by decreasing exhaust nozzle diameter. ...................................................................................................................92
xiv
4-32 Injector face temperature versus chamber pressure for GH2/GO2 combustion tests with mO2/mH2 = 5.97 (Ф = 1.33, mO2 = 1.693 g/s, mH2 = 0.285 g/s). Injector = UF1. Injector position = IP3. Chamber arrangement = CA3SA. Legend indicates r as the radial distance from the injector center axis to the injector face thermocouple. Bars indicate +/- the standard fluctuation from the average temperature. Chamber pressures increased by decreasing exhaust nozzle diameter. ...................................................................................................................93
4-33 Injector face temperatures versus radial distance from injector center axis for GH2/GO2 combustion tests at mO2/mH2 = 3.97 and 5.97 and Pchamber = 6.21 MPa, 4.86 MPa, 4.55 MPa, and 2.76 MPa. Chamber pressures increased by decreasing exhaust nozzle diameter. ........................................................................94
4-34 Injector face temperature versus chamber length for GH2/GO2 combustion tests with Pchamber = 4.86 MPa, mO2/mH2 = 3.97, and vO2/vH2 = 0.46 (Ф = 2.0, mO2 = 1.565 g/s, mH2 = 0.396 g/s). Injector = UF1. Injector position = IP3. Legend indicates r as the radial distance from the injector center axis to the injector face thermocouple. Error bars indicate +/- the standard deviation for the averaged test data.....................................................................................................................94
4-35 Heat flux versus distance from injector face for GH2/GO2 combustion tests with mO2/mH2 = 3.97 (Φ = 2.0), vO2/vH2 = 0.46, vH2 = 207.4 m/s, and a variety of chamber pressures. Chamber pressure increased by increasing flow rates. Exhaust nozzle diameter = 1.70 mm (0.670 in.). Injector = UF1. Injector position = IP3. Chamber arrangement = CA3SA. Heat flux values calculated using steady state heat flux plus heat absorption equation (Equation 2.16).............95
4-36 Normalized heat flux versus distance from injector face for GH2/GO2 combustion tests with mO2/mH2 = 3.97 (Φ = 2.0), vO2/vH2 = 0.46, vH2 = 207.4 m/s, and a variety of chamber pressures. Chamber pressure increased by increasing flow rates. Exhaust nozzle diameter = 1.70 mm (0.670 in.). Injector = UF1. Injector position = IP3. Chamber arrangement = CA3SA. Heat flux values calculated using steady state heat flux plus heat absorption equation (Equation 2.16). Heat flux values normalized by (2.75 MPa/Pc)0.8.........................96
4-37 Normalized heat flux versus distance from injector face for GH2/GO2 combustion tests with mO2/mH2 = 3.97 (Φ = 2.0), vO2/vH2 = 0.46, vH2 = 207.4 m/s, and a variety of chamber pressures. Chamber pressure increased by increasing flow rates. Exhaust nozzle diameter = 1.70 mm (0.670 in.). Injector = UF1. Injector position = IP3. Chamber arrangement = CA3SA. Heat flux values calculated using steady state heat flux plus heat absorption equation (Equation 2.16). Heat flux values normalized by (2.75 MPa/Pc)0.6.........................97
xv
4-38 Normalized heat flux versus distance from injector face for GH2/GO2 combustion tests with mO2/mH2 = 3.97 (Φ = 2.0), vO2/vH2 = 0.46, vH2 = 207.4 m/s, and a variety of chamber pressures. Chamber pressure increased by increasing flow rates. Exhaust nozzle diameter = 1.70 mm (0.670 in.). Injector = UF1. Injector position = IP3. Chamber arrangement = CA3SA. Heat flux values calculated using steady state heat flux plus heat absorption equation (Equation 2.16). Heat flux values normalized by (0.187 g/s / mH2)0.5. ...................98
4-39 High-frequency pressure transducer data (chamber pressure versus time) for a 1.8 second window of a GH2/GO2 combustion test with Ф = 2.0, mO2 = 1.565 g/s, and mH2 = 0.396 g/s. Injector = UF1. Injector position = IP3. Chamber arrangement = CA3SA. Sample rate = 50 kHz. ......................................................99
4-40 Power spectrum analysis of high-frequency pressure data shown in Figure 4-33. Analysis performed via Fast-Fourier Transform method.........................................99
4-41 0-3500 Hz window of power spectrum shown in Figure 4-34...............................100
4-42 Average flame profile of a GH2/GO2 flame with operating conditions of Pchamber = 4.86 MPa, Ф = 2.0, mO2 = 1.565 g/s, mH2 = 0.396 g/s, and vO2/vH2 = 0.46. Images of broadband flame emission. Exposure time = 500 ns. Average of 132 images. Injector center axis located at y = 0 and injector face located at x = 0. ...100
4-43 Instantaneous flame image of a GH2/GO2 flame with operating conditions of Pchamber = 4.86 MPa, Ф = 2.0, mO2 = 1.565 g/s, mH2 = 0.396 g/s, and vO2/vH2 = 0.46. Image of broadband flame emission. Exposure time = 500 ns. Injector center axis located at y = 0 and injector face located at x = 0................................101
C-1 Calibration curve (Cv versus number of turns) for the B-SS4 and SS-SS4-VH metering valves. .....................................................................................................125
C-2 Calibration curve (Cv versus number of turns) for the SS-31RS4 and SS-31RF4 metering valves. .....................................................................................................126
C-3 Calibration curve (Cv versus number of turns) for the SS-1RS4 needle valve, which has a 0.172 inch orifice................................................................................127
C-4 Calibration curve (Cv versus number of turns) for the SS-1RF4 neele valve, which has a 0.250 inch orifice................................................................................128
C-5 Calibration curve (amplification factor versus output voltage) for the operational amplifier. ................................................................................................................129

xvi
LIST OF OBJECTS
Object page A-1 Complete Labview code (block diagram) for Labview GUI “HPCF Control
Interface” (5.52 MB, object-a1.pdf).......................................................................114
A-2 Complete Labview code (block diagram) for Labview GUI “HPCF-HFPT Interface” (565 KB, object-a2.pdf). .......................................................................115
A-3 Matlab code for “HPCF_Data_Proceessor” (19 KB, object-a3.txt).......................115
A-4 Matlab code for “HFPT_Compare” (5 KB, object-a4.txt). ....................................115
A-5 Matlab code for “HPCF_Image_Processor” (1 KB, object-a5.txt). .......................115
A-6 Matlab code for “HPCF_AvgFlameSpeed” (3 KB, object-a6.txt).........................115

xvii
NOMENCLATURE
A area [m2]
c heat capacity [J kg-1 K-1]
Cv flow coefficient [1]
Gg specific gravity [1]
GO2 gaseous oxygen
GH2 gaseous hydrogen
GUI Graphical User Interface
HFPT High-Frequency Pressure Transducer
k thermal conductivity [W m-1 K-1]
M Mach number [1]
m& mass flow rate [kg/s]
m mass [kg]
mO2 oxygen mass flow rate [g/s]
mH2 hydrogen flow rate [g/s]
OH-PLIF Hydroxyl Planar Laser-Induced Fluorescence
p pressure [Pa]
Pchamber chamber pressure [Pa]
p0 stagnation pressure [Pa]
q volumetric flow rate [scfm]
qA heat flux per unit area [W m-2]

xviii
R gas constant [m2 s-2 T-1]
T temperature [K, oC]
T0 stagnation temperature [K, oC]
Twall chamber wall temperature [K, oC]
u velocity [m/s]
UF-HPCF High Pressure Combustion Facility
∆T temperature difference [K, oC]
∆t time difference [s]
∆x distance between temperature measurement locations [m]
Φ ( )( )
2 2
2 2
O H actual
O H stoichiometric
m mm m= , equivalence ratio [1]
ρ density [kg m-3]
γ specific heat ratio [1]

xix
Abstract of Thesis Presented to the Graduate School
of the University of Florida in Partial Fulfillment of the Requirements for the Degree of Master of Science
HIGH-PRESSURE GH2/GO2 COMBUSTION DYNAMICS
By
Clark Alexander Conley
August 2006
Chair: Corin Segal Major Department: Mechanical and Aerospace Engineering
A high-pressure combustion facility was designed at the University of Florida
Mechanical and Aerospace Engineering Combustion Lab. Features of the facility include
optical access into the combustor during operation, a full set of temperature and pressure
diagnostic capabilities, remote control through a graphical user interface, and run times
upwards of 10 seconds. The facility is capable of operating pressure from 0.1 MPa to
6.25 MPa. Propellants used include gaseous hydrogen as the fuel and oxygen as the
oxidizer, although other fuels and oxidizer can be adapted to the facility. Current
injectors investigated are of coaxial shear jet type. Diagnostic capabilities include
chamber wall heat flux measurements along the length of the chamber, injector face
temperature measurements, exhaust nozzle temperature measurements, high-frequency
pressure measurements, and flame imaging. Through operation of the facility, several
key obstacles were identified which warrant future improvements. An injector
incorporating an ignition torch and propellant injection temperature/pressure
measurements is one such improvement, which is currently being designed. Integration

xx
of a water-cooled nozzle will allow combustion test times beyond the current maximum
of 10 seconds. Finally, maintaining a proper seat between the heat flux sensors and the
chamber needs further addressing.
The facility was used to investigate the dynamics of high-pressure GH2/GO2, with
operating conditions typical of rocket engines. Namely, two oxygen to hydrogen mass
flow ratios of 3.97 and 5.97 (Φ = 2.0 and Φ = 1.33, respectively) were investigated. Fuel
flow rates ranged from 0.187g/s to 0.470 g/s. Operational chamber pressures of 6.21,
4.86, 4.55, and 2.76 MPa were investigated by keeping the propellant mass flow rates
constant and changing the exhaust nozzle diameter. In addition, four operational
chamber pressures of 5.87, 4.93, 3.90, and 2.75 MPa were investigated by keeping the
exhaust nozzle diameter constant and changing the propellant mass flow rates. A period
of instability seems to exist in the combusting flow for the first 4 or 5 seconds after
ignition due to the increasing chamber pressure and the corresponding decrease in gas
injection velocities. Maximum heat release occurs 60 mm (2.35 in.) from the injector
face. In general, the injector face temperatures have little to no dependence on chamber
pressure. The profiles of heat flux and chamber wall temperatures seem to have no
pressure dependence and only a slight dependence on propellant injection velocities. A
scaling of heat flux values based on fuel mass flow rate, instead of chamber pressure, is
suggested. The lack of pressure dependence and only slight dependence on the propellant
injection velocities, as shown by the similarity in heat flux profiles, suggest that the basic
dynamic structures of the combusting flow are mainly dominated by geometrical effects.

1
CHAPTER 1 INTRODUCTION
The goals of this research were (i) to design and construct a combustion facility
capable of operating pressures from 0.1 to 6.25 MPa (1 to 62 atm), designated the
University of Florida High Pressure Combustion Facility (UF HPCF), and (ii) to
experimentally investigate the high-pressure combustion dynamics of GH2/GO2 flames at
operating conditions in the aforementioned pressure range, mO2/mH2 = 3.97 and 5.97 (Φ =
2.0 and 1.33, respectively) and a range of velocity ratios. Other capabilities of the facility
include optical access to the chamber, temperature and pressure diagnostic capabilities,
imaging systems, and controllability via graphical user interface (GUI). Diagnostic
capabilities include combustion chamber wall heat fluxes, injector face temperatures, exit
nozzle temperatures, flame temperatures, and chamber pressure fluctuations, all of which
were obtained for a variety of hot-fire tests in the aforementioned operational conditions.
In addition, instantaneous broadband flame emission images and average broadband
flame emission images were obtained for a few combustion tests. These images are
useful in determining such characteristics as flame lift-off distance, shear layer growth,
instantaneous flame propagation phenomena, and average flame speeds. Furthermore,
preliminary investigation into the use of OH Planar Laser Induced Fluorescence (OH-
PLIF) laser-based diagnostic technique was conducted. This thesis presents the described
research, including the facility design/construction stages, future improvements to the
facility, data from high-pressure GH2/GO2 combustion tests, and discussion on the
implication of the data to the dynamics of the combustion process.

2
Safer, Cheaper, and More Reliable Rocket Engines
Although the research presnted has applicability to many different types of
combustion engines, it is directed more toward study of the heat characteristics related to
rocket engines. More specifically, this research is directed at rocket engines employing
hydrogen and oxygen as the propellants and a shear coaxial jet injector. Rocket engines
are mainly used in satellite deployment, missile technologies, and space exploration, all
of which involve the transport of expensive equipment and/or human life. Therefore,
there is a constant drive for safer, cheaper, and more reliable rocket engines. In order to
build such rocket engines, the dynamics of the rocket engine combustion process need to
be better understood. However, the very nature of rocket engines makes this goal hard to
accomplish. The high-pressure and high-heat operational conditions of a rocket engine
make in-situ measurements inside the combustion environment difficult. Also, testing on
full size prototypes or actual engines can be time consuming and costly once all
development factors, materials, and testing facility costs are factored in.
One common away around this problem is through the use of Computational Fluid
Dynamics (CFD). CFD allows engineers to model the rocket engine in a computer to
determine design flaws and improvements, eliminating much time, effort, and cost in
building and testing physical prototypes. CFD essentially allows a rocket engine to be
safely designed to a final or near-final stage before a physical model must be built for
actual hot-fire testing. Unfortunately, two main problems have limited the application of
CFD in the rocket engine design process. First, in the past solutions have required huge
amounts of time and computer power to provide valid results for even simple models, not
to mention more complicated multi-element injector and intricate cooling systems.
Secondly, the CFD models at present lack abundant validation from actual combustion

3
data, especially for the higher pressures at which rocket engines operate. With computer
technology improving by leaps and bounds every day, the problems with computationally
expensive models are becoming fewer, meaning that more CFD results can be produced
quicker than ever. Unfortunately, the second problem has not been sufficiently
addressed. More validation of the CFD models means more trust in the model results,
giving way to quicker and cheaper design/build times for many components of the rocket
engines, including injectors, combustors, and cooling systems.1
To compound these difficulties, only recently has investigation into unsteady
combustion systems begun. Most CFD model results in the past have been based on
steady state 1-D analyses, when the combustion process inside rocket engines is largely
unsteady and 3-D. Furthermore, heat transfer into the combustor walls has rarely been
addressed, even though the strength, lifecycle, and cooling system effectiveness of the
combustor are heavily dependent on the heat transfer into and out of the chamber wall.2
This lack of research also applies to experimental investigation, with the only notable
study, by Marshall et al.,3 appearing only recently.
Therefore, it is worthwhile to not only experimentally investigate high-pressure
combustion dynamics, but to also work alongside CFD researchers to optimize
interaction between experimental testing and CFD modeling so that reliable rocket engine
models can be produced efficiently. This research seeks to advance the understanding of
high-pressure combustion dynamics through experimental testing and present the data for
CFD model validation so that cheaper, safer, and more reliable rocket engines become a
reality.

4
Literature Review
Before designing the UF HPCF, a literature search was conducted for other high-
pressure combustion diagnostic facilities, including those of the university, government,
and industry sectors. The goal of this search was to see what current high-pressure
combustion research existed, avoid potential road blocks that others had encountered and
documented, and verify that this research was unique and necessary for the aerospace
industry. Many key topics were searched for within the literature, including chamber
design, injector design, optical access design for imaging diagnostic purposes, non-
optical diagnostics for high-pressure combustion, and laser diagnostic techniques in high-
pressure combustion.
Several high-pressure combustion diagnostic facilities with optical access were
reviewed for different aspects of their designs.4-8 These facilities encompass gas turbine
combustors and rocket engine combustors, although other high-pressure combustion
diagnostic facilities exist for other uses, such as internal combustion engines. Allen and
Miller4 of Physical Sciences, Inc. present an optically accessible high-pressure gas
turbine combustor. While this facility is designed for gas turbine studies, the injector and
propellants are practically the only difference from the facilities for rocket engine studies.
Their facility can operate up to 50 atm and is equipped with a heater that can deliver air at
530 K at maximum pressure and a flow rate of 1 kg/s. The development of the high-
pressure gaseous burner at NASA’s Glenn Research Center is presented in the Kojima
and Nguyen5 study. This facility is capable of running non-premixed and premixed
propellants at operating pressures up to 60 atm. Optical access and adaptability for
different fuels gives the ability for calibration of different optical diagnostic techniques.
Purdue University’s high-pressure combustion facility, presented by Carter et al.,6

5
employs a flat flame burner for spectroscopic studies. Locke et al.7 briefly present the
high-pressure combustor facility at NASA’s Glenn Research Center. This facility burns
JP-5, incorporates a ceramic liner, and is equipped with a nitrogen cooling film over the
windows. Finally, the facility at Pennsylvania State University is described the paper by
Foust et al.8 This high-pressure combustion facility is similar in design and use as the UF
HPCF, comprised of a modular combustor section with optical access and pressure-fed
propellant supplies. This facility uses a shear coaxial injector and has the capability for
liquid oxygen supply, in addition to gaseous propellants.
While many design aspects of the UF HPCF were covered from the aforementioned
papers, there was not enough information there to finalize the injector parameters. In
fact, Penn State’s facility was the only one of those reviewed above that explicitly
incorporated a shear coaxial injector. Therefore further review was necessary to
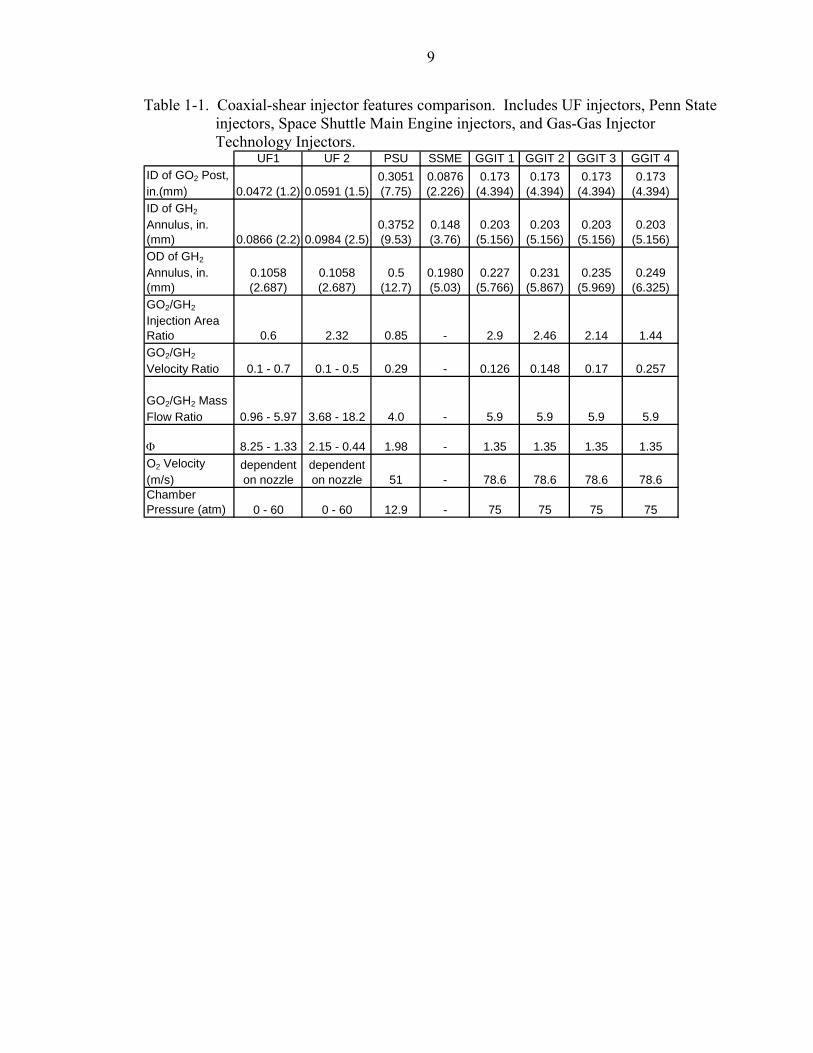
determine proper injector characteristics. As mentioned, Foust et al.8 reported the
dimensions of their injector and their flow parameters for use with GH2/GO2 at Penn
State’s facility, which are presented in Table 1-1. The injector designs that came out of
the Gas-Gas Injector Technology (GGIT) study for the Reusable Launch Vehicle (RLV)
are reported by Tucker et al.9 These four injector designs and corresponding flow
conditions are also presented in Table 1-1. In addition, the injector and flow parameters
of the Space Shuttle Main Engine (SSME) fuel preburner are presented in Table 1-1,
which were reported in Ferraro et al.10 The current phase of this research is only
concerned with shear coaxial injectors, and hence no studies of swirl injectors, impinging
injectors, or other injector designs are reviewed here.
6
Laser-based diagnostics as applied to high-pressure combustion were also reviewed
for this research to understand facility requirements and prepare for the facility design
phase. Laser-Induced Fluorescence (LIF) is one such diagnostic technique. The LIF
technique has been extensively validated for atmospheric and sub-atmospheric
combustion, but the amount of LIF data available decreases rapidly as the pressure
increases. This is largely due to the difficulties in obtaining meaningful results because
of high-pressure effects on LIF. Because OH Planar Laser Induced Fluorescence (OH
PLIF) is the preferred species/technique for this research, it was reviewed in this
research. First and foremost, two extensive publications, Kohse-Hoinghaus and Jeffries11
and Eckbreth,12 provide ample information on laser-based diagnostic techniques as
applied to combustion through technical detail about the techniques themselves and
extensive referencing. Santoro13 provides a brief, but informative description of several
laser-based diagnostic techniques as applied to rocket and gas turbine combustors,
including Laser Doppler Velocimetry (LDV), Raman spectroscopy, and LIF at the Penn
State facility. The LIF setup described includes excitation of the Q1(8) transition of the
OH radical with 2 mJ/pulse at a pressure of 0.47 MPa and the resulting images were
compared to CFD results.
Frank et al.14 report OH PLIF measurements in a spray flame of heptane and Jet-A
fuel at pressures up to 20 atm using the facility at Physical Sciences, Inc. The PLIF setup
is described as excitation of the Q1(8) transition (λ=283.55 nm) with a 3 mJ/pulse and
detection centered at 313 nm using a narrow bandpass interference filter (FWHM=25
nm). Significant laser attenuation and beam steering was noted as the pressures
increased. Edwards et al.15 report their investigation of OH LIF in high-pressure solid

7
propellant flames. Excitation was at 306.42 nm with 300 mJ/pulse and detection at 310.6
nm and 315.1 nm. The authors suggest that high-pressure effects on excitation/detection
strategies for LIF are less of a problem than the lack of high pressure kinetic and
spectroscopic data. Arnold et al.16 report quantitative measurements of OH concentration
fields using two-dimensional LIF of laminar, premixed methane/air flat flames at
pressures up to 20 atm. Excitation was at 290 nm with 1 mJ/pulse and detection at 314
nm. The authors report significant decrease in OH fluorescence signal with higher
pressures due to absorption line width broadening, increase of electronic quenching, and
increase in beam steering. Atakan et al.17 report the LIF spectra of OH in the exhaust of a
laminar premixed methane/air flame at pressures from 5 bar to 36 bar. Excitation was at
280 nm with 14 mJ/pulse and detection was centered around 309 nm.
Allen et al.18 report OH PLIF in high-pressure spray-flames burning heptane,
ethanol, and methanol at pressures from 0.1 to 1.0 MPa. Excitation was at 283 nm with 3
mJ/pulse and detection was in the range of 316 nm to 371 nm. The authors provide an in-
depth study of the high-pressure effects on PLIF, both through theoretical analysis and
through experimental validation. Stocker et al.19 report OH LIF in atmospheric pressure
flames for both a methane/air Bunsen burner and a hydrogen/oxygen welding torch with
excitation provided by an tunable OPO (type II) laser system. This in-depth study
thoroughly investigated four OH excitation wavelength ranges, all within the range of
321.0 nm to 241.1 nm, with detection between 305 nm and 330 nm and 5 mJ/pulse. This
study shows excitation of OH in the 280 nm to 285 nm to be reasonable. Singla et al.20
report OH PLIF of cryogenic Lox/GH2 jet flames at 6.3 MPa. Excitation is at 284 nm
with 42 mJ/pulse and detection is in the range of 306-320 nm. Much effort is presented

8
in imaging of the injector post lip flame holding region and the unsteadiness that the flow
exhibits there.
While this sample of reported literature in no way represents the entirety of
research on laser-based diagnostics, or even OH LIF for that matter, it does fairly
represent the spectrum of the research foci. This shows that while there is a fair amount
of research focused on high-pressure combustion OH LIF, a small percentage seems to be
focused on typical rocket engine injectors, such as shear coaxial jet and swirl injectors.
Furthermore, while considerable effort is being put towards the development of the LIF
technique, there seems to be very little effort put toward understanding other aspects of
rocket combustion, such as characterization of injector face temperatures and combustion
chamber wall heat fluxes. As mentioned earlier, only recently has wall heat flux data for
a GH2/GO2 combustor been presented. This benchmark study, by Marshall et al.,3
investigates the nature of heat flux inside a single element combustor, similar to that of
the UF HPCF. Unfortunately, this study is the first of its kind and still leaves many
questions about the dynamics of high-pressure GH2/GO2 combustion. The UF HPCF
aims to support this effort by providing a reliable, repeatable and safe combustion
environment to investigate all aspects of high-pressure combustion, including the
development and application of laser-based diagnostic and non-optical diagnostic
techniques to support the CFD modeling efforts.
9
Table 1-1. Coaxial-shear injector features comparison. Includes UF injectors, Penn State injectors, Space Shuttle Main Engine injectors, and Gas-Gas Injector Technology Injectors.
UF1 UF 2 PSU SSME GGIT 1 GGIT 2 GGIT 3 GGIT 4ID of GO2 Post, in.(mm) 0.0472 (1.2) 0.0591 (1.5)
0.3051 (7.75)
0.0876 (2.226)
0.173 (4.394)
0.173 (4.394)
0.173 (4.394)
0.173 (4.394)
ID of GH2
Annulus, in. (mm) 0.0866 (2.2) 0.0984 (2.5)
0.3752 (9.53)
0.148 (3.76)
0.203 (5.156)
0.203 (5.156)
0.203 (5.156)
0.203 (5.156)
OD of GH2
Annulus, in. (mm)
0.1058 (2.687)
0.1058 (2.687)
0.5 (12.7)
0.1980 (5.03)
0.227 (5.766)
0.231 (5.867)
0.235 (5.969)
0.249 (6.325)
GO2/GH2
Injection Area Ratio 0.6 2.32 0.85 - 2.9 2.46 2.14 1.44GO2/GH2
Velocity Ratio 0.1 - 0.7 0.1 - 0.5 0.29 - 0.126 0.148 0.17 0.257
GO2/GH2 Mass Flow Ratio 0.96 - 5.97 3.68 - 18.2 4.0 - 5.9 5.9 5.9 5.9
Φ 8.25 - 1.33 2.15 - 0.44 1.98 - 1.35 1.35 1.35 1.35O2 Velocity (m/s)
dependent on nozzle
dependent on nozzle 51 - 78.6 78.6 78.6 78.6
Chamber Pressure (atm) 0 - 60 0 - 60 12.9 - 75 75 75 75

10
CHAPTER 2 METHODS
This chapter discusses the H2/O2 injection/combustion process, including reaction
chemistry, propellant flow rate calculations, and combustion test operation methodology.
This will give a complete understanding behind the control of the HPCF operating
conditions. Furthermore, the data processing methodology is presented within this
chapter, including the use of Matlab in this research for calibration, data processing, and
data organization.
The H2/O2 Injection/Combustion Process
Fundamental understanding of the propellant reaction chemistry and flow
parameters is necessary for the control of the HPCF and understanding the data. The
HPCF uses gaseous hydrogen and gaseous oxygen for propellants and a coaxial shear
injector. The coaxial shear injector injects the hydrogen annularly around a center-stream
of oxygen. The two propellants are injected from equal pressure lines into a chamber
having some operational pressure nominally equal to the propellant line pressures.
Because the pressure difference between the two streams is small, the mixing process
between the hydrogen and oxygen is due to the shear occurring at the interface of the two
unequal velocity propellants. This shear causes the propellants to mix together in the
shear layer, where the combustion process occurs. Although the injection equivalence
ratio of the propellants may be non-stoichiometric, the reaction at the shear layer occurs
at stoichiometric conditions. Using the propellant chemistry and flow parameters allows

11
control of the HPCF operational conditions from one test to the next and processing of
the data.
H2-O2 Reaction Chemistry
The reaction between hydrogen and oxygen can be written for a single reaction
mechanism, as shown in Equation 2-1.
2 2 2 2 2aH bO cH O dH eO+ ⇔ + + (2-1)
The coefficients in Equation 2-1 are determined from the reacting mixture composition.
A rich reaction (Φ>1.0) will result in excess hydrogen (e = 0), while a lean reaction
(Φ<1.0) will result in excess oxygen (d = 0). In a perfectly stoichiometric reaction
(Φ=1.0), all of the hydrogen and oxygen reacts together, leaving only water as the final
product (d = 0, e = 0). The chemical equation for the stoichiometric reaction of H2/O2 is
given in Equation 2-2.
2 2 21 0.5H O H O+ ⇔ (2-2)
STANJAN,21 a reaction chemistry program, was used in this research for determining the
properties of the exhaust gas assuming complete combustion based on the injection
equivalence ratio. This information is then used in the injection flow property
calculations presented in the next section to get an approximate value for desired
propellant flow rates.
Another important aspect of the propellant reaction is the inter-combustion species
that appear mid-reaction. The complete H2-O2 reaction process is much more
complicated than Equations 2-1 and 2-2. In between the initial and final states reside
intermediate chain-reacting and chain-terminating reactions involving inter-combustion
species. A complete review of the H2-O2 reaction is beyond the scope of this discussion,

12
however a more complete review is presented in Turns.22 One such inter-combustion
species for the H2-O2 reaction is hydroxyl (OH). OH predominantly appears in the
reaction zone, meaning it is an excellent indicator of the shear reacting layer, or flame
region. The presence of OH in the shear reacting layer enables the use of laser based
diagnostic technique OH-Planar Laser Induced Fluorescence (OH-PLIF), a heavily
researched tool in investigating combusting H2/O2 flows.
Propellant Flow Properties and Calculations
The propellants are injected into the chamber at a certain injection equivalence
ratio. The injection equivalence ratio is a measure of the ratio between the mass flow rate
of the hydrogen to the mass flow rate of the oxygen for the actual experimental
conditions compared to the stoichiometric conditions, as shown in Equations 2-3 and 2-4.
( )( )( )( )
2
2
1 2 / 2 0.1250.5 31.999 / 16
H
O stoichiometric
m mol g mol gm mol g mol g
⎛ ⎞ ⎛ ⎞ ⎛ ⎞= = =⎜ ⎟ ⎜ ⎟ ⎜ ⎟⎜ ⎟⎜ ⎟ ⎝ ⎠⎝ ⎠⎝ ⎠
&
& (2-3)
2 22 2
2 2 2 2
H HH H
O O O Oactual stoichiometric actual stoichiometric
m mm mm m m m
φ φ⎛ ⎞ ⎛ ⎞⎛ ⎞ ⎛ ⎞
= → =⎜ ⎟ ⎜ ⎟⎜ ⎟ ⎜ ⎟⎜ ⎟ ⎜ ⎟ ⎜ ⎟ ⎜ ⎟⎝ ⎠ ⎝ ⎠ ⎝ ⎠ ⎝ ⎠
& && &
& & & & (2-4)
This gives a numerical basis for how rich or lean the propellant injection is. Therefore,
the equivalence ratio is an important parameter in the HPCF operating conditions,
specifically in the determination of the propellant mass flow rates.
Because the operation of the chamber relies on the exhaust gases choking at the
exhaust nozzle at a certain pressure, it is convenient to specify an operational chamber
pressure and equivalence ratio for the propellants and work backwards to the propellant
flow rates. An equation can be derived that is dependent only on the exhaust gas
properties, exhaust nozzle geometry, and operational chamber pressure as follows. First,

13
a simple form for mass flow rate and gas velocity is given in Equation 2-5 and Equation
2-6, respectively.
m uAρ=& (2-5)
u M RTγ= (2-6)
In addition, the ideal gas law and several isentropic flow equations, given in Equations
2-7 through 2-9, are used.
p RTρ= (2-7)
20
112
T T Mγ −⎛ ⎞= +⎜ ⎟⎝ ⎠
(2-8)
1
20
112
p p Mγγγ −−⎛ ⎞= +⎜ ⎟
⎝ ⎠ (2-9)
Substituting Equations 2-8 and 2-9 into Equation 2-7 gives Equation 2-10.
( )
11
20
0
112
p MRT
γγρ−
−−⎛ ⎞= +⎜ ⎟⎝ ⎠
(2-10)
Substituting Equation 2-8 into Equation 2-6 gives Equation 2-11.
1
22
011
2u M RT Mγγ
−−⎛ ⎞= +⎜ ⎟
⎝ ⎠ (2-11)
Finally, substituting Equations 2-10 and 2-11 into Equation 2-5 and simplifying gives
Equation 2-12.
( )( )
01
0 2 1211
2
p Mm AR T
Mγ
γ
γ
γ+
−
=−⎛ ⎞+⎜ ⎟
⎝ ⎠
& (2-12)
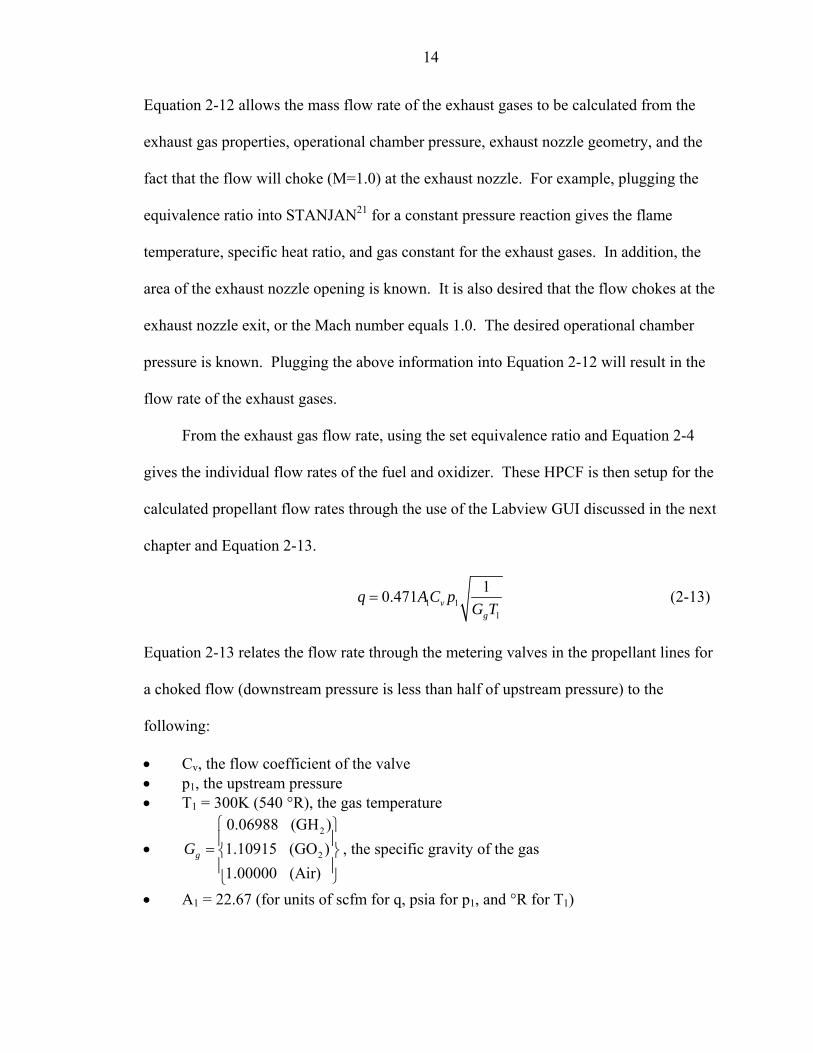
14
Equation 2-12 allows the mass flow rate of the exhaust gases to be calculated from the
exhaust gas properties, operational chamber pressure, exhaust nozzle geometry, and the
fact that the flow will choke (M=1.0) at the exhaust nozzle. For example, plugging the
equivalence ratio into STANJAN21 for a constant pressure reaction gives the flame
temperature, specific heat ratio, and gas constant for the exhaust gases. In addition, the
area of the exhaust nozzle opening is known. It is also desired that the flow chokes at the
exhaust nozzle exit, or the Mach number equals 1.0. The desired operational chamber
pressure is known. Plugging the above information into Equation 2-12 will result in the
flow rate of the exhaust gases.
From the exhaust gas flow rate, using the set equivalence ratio and Equation 2-4
gives the individual flow rates of the fuel and oxidizer. These HPCF is then setup for the
calculated propellant flow rates through the use of the Labview GUI discussed in the next
chapter and Equation 2-13.
1 11
10.471 vg
q AC pG T
= (2-13)
Equation 2-13 relates the flow rate through the metering valves in the propellant lines for
a choked flow (downstream pressure is less than half of upstream pressure) to the
following:
• Cv, the flow coefficient of the valve • p1, the upstream pressure • T1 = 300K (540 °R), the gas temperature
• 2
2
0.06988 (GH )1.10915 (GO )1.00000 (Air)
gG⎧ ⎫⎪ ⎪= ⎨ ⎬⎪ ⎪
⎭⎩
, the specific gravity of the gas
• A1 = 22.67 (for units of scfm for q, psia for p1, and °R for T1)
15
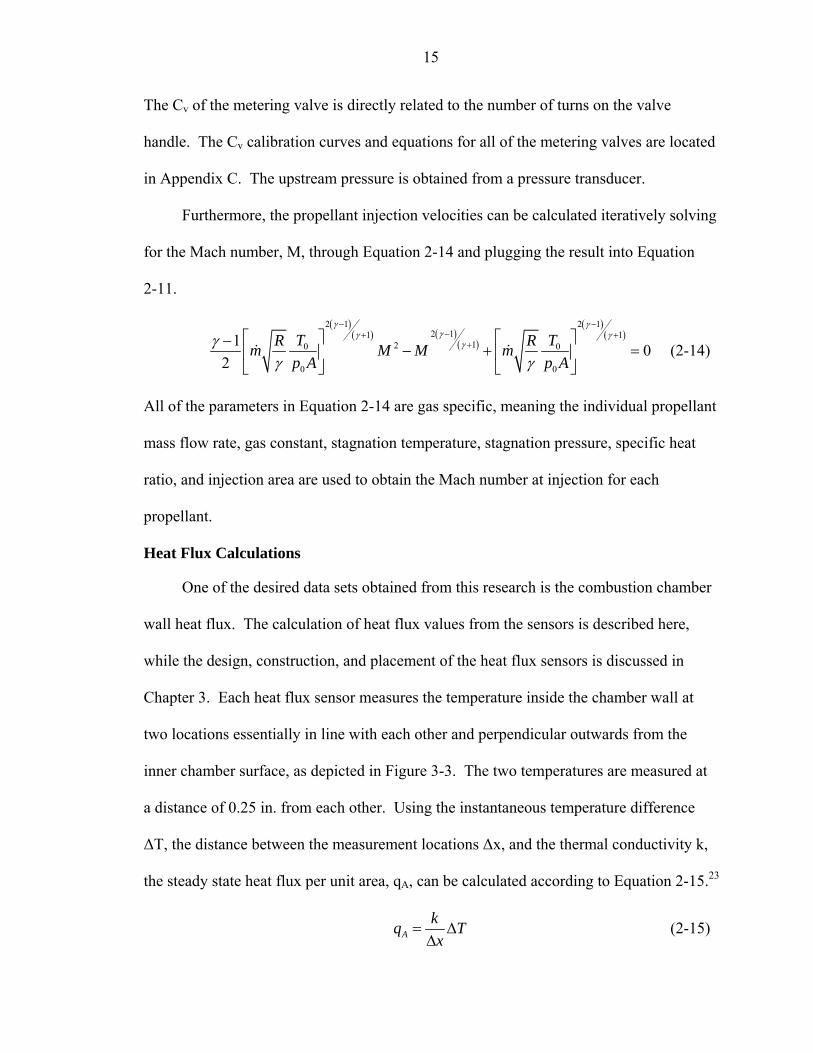
The Cv of the metering valve is directly related to the number of turns on the valve
handle. The Cv calibration curves and equations for all of the metering valves are located
in Appendix C. The upstream pressure is obtained from a pressure transducer.
Furthermore, the propellant injection velocities can be calculated iteratively solving
for the Mach number, M, through Equation 2-14 and plugging the result into Equation
2-11.
( )( ) ( )
( )
( )( )
2 1 2 12 11 1
120 0
0 0
1 02
T TR Rm M M mp A p A
γ γγγ γ
γγγ γ
− −−+ +
+⎡ ⎤ ⎡ ⎤−− + =⎢ ⎥ ⎢ ⎥
⎣ ⎦ ⎣ ⎦& & (2-14)
All of the parameters in Equation 2-14 are gas specific, meaning the individual propellant
mass flow rate, gas constant, stagnation temperature, stagnation pressure, specific heat
ratio, and injection area are used to obtain the Mach number at injection for each
propellant.
Heat Flux Calculations
One of the desired data sets obtained from this research is the combustion chamber
wall heat flux. The calculation of heat flux values from the sensors is described here,
while the design, construction, and placement of the heat flux sensors is discussed in
Chapter 3. Each heat flux sensor measures the temperature inside the chamber wall at
two locations essentially in line with each other and perpendicular outwards from the
inner chamber surface, as depicted in Figure 3-3. The two temperatures are measured at
a distance of 0.25 in. from each other. Using the instantaneous temperature difference
∆T, the distance between the measurement locations ∆x, and the thermal conductivity k,
the steady state heat flux per unit area, qA, can be calculated according to Equation 2-15.23
Akq Tx
= ∆∆
(2-15)
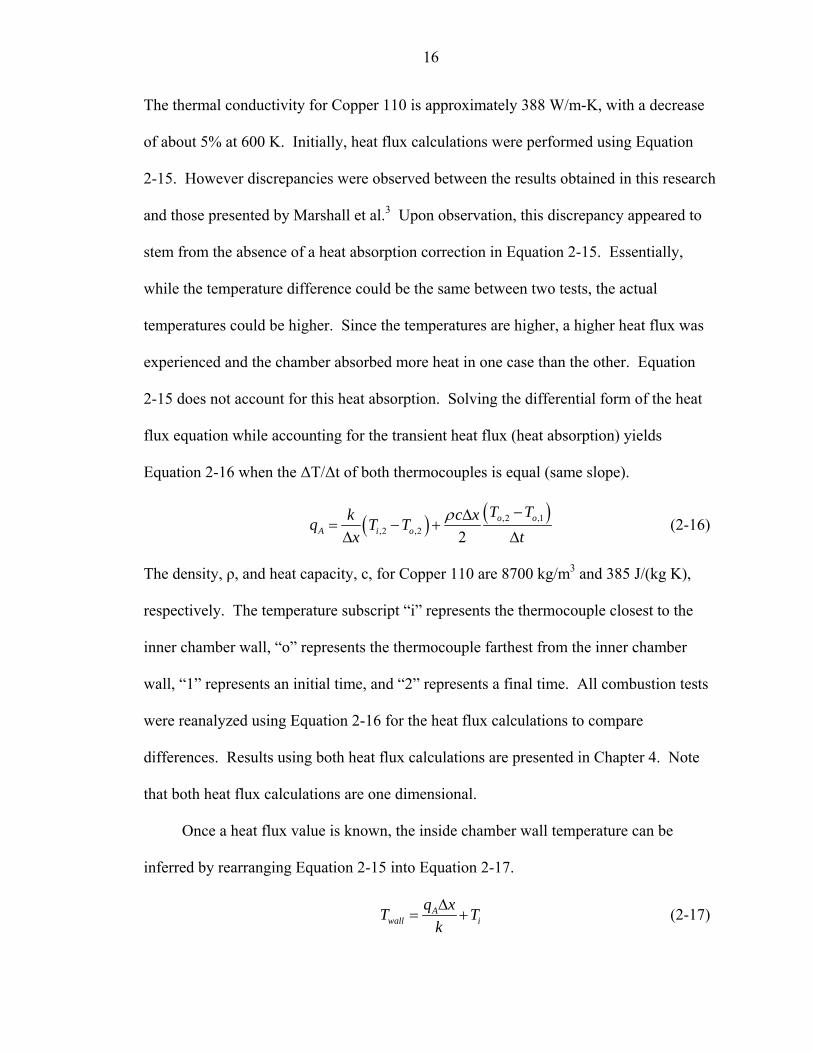
16
The thermal conductivity for Copper 110 is approximately 388 W/m-K, with a decrease
of about 5% at 600 K. Initially, heat flux calculations were performed using Equation
2-15. However discrepancies were observed between the results obtained in this research
and those presented by Marshall et al.3 Upon observation, this discrepancy appeared to
stem from the absence of a heat absorption correction in Equation 2-15. Essentially,
while the temperature difference could be the same between two tests, the actual
temperatures could be higher. Since the temperatures are higher, a higher heat flux was
experienced and the chamber absorbed more heat in one case than the other. Equation
2-15 does not account for this heat absorption. Solving the differential form of the heat
flux equation while accounting for the transient heat flux (heat absorption) yields
Equation 2-16 when the ∆T/∆t of both thermocouples is equal (same slope).
( ) ( ),2 ,1,2 ,2 2
o oA i o
T Tk c xq T Tx t
ρ −∆= − +∆ ∆
(2-16)
The density, ρ, and heat capacity, c, for Copper 110 are 8700 kg/m3 and 385 J/(kg K),
respectively. The temperature subscript “i” represents the thermocouple closest to the
inner chamber wall, “o” represents the thermocouple farthest from the inner chamber
wall, “1” represents an initial time, and “2” represents a final time. All combustion tests
were reanalyzed using Equation 2-16 for the heat flux calculations to compare
differences. Results using both heat flux calculations are presented in Chapter 4. Note
that both heat flux calculations are one dimensional.
Once a heat flux value is known, the inside chamber wall temperature can be
inferred by rearranging Equation 2-15 into Equation 2-17.
Awall i
q xT Tk∆
= + (2-17)

17
In Equation 2.15, qA is the heat flux per unit area obtained from the experiment, ∆x is the
distance between the deeper thermocouple detection point and the inner chamber wall,
and Ti is the temperature measured by the deeper thermocouple.
Data Processing Methodologies
Each combustion test can provide data from five thermocouples, 14 heat flux
sensors, and three pressure transducers at 40 Hz, in conjunction with large amounts of
images and high-frequency pressure transducer (HFPT) data at 50 kHz. This large
amount of data from each combustion test necessitates a sophisticated data processing
methodology for clarity and efficiency. The data processing package built-up for the
HPCF is extensive, employing Matlab to perform the majority of the processing.
The Role of Matlab
Each combustion test can provide two text files produced by the Labview GUIs and
a batch of images from the intensified CCD camera. Because of the extensive amount of
data, several Matlab programs were written to help quicken and ease the data processing.
Standardized filenames
The HPCF has the ability to operate in many different configurations. These
options include two oxidizer choices, three different injector positions, and 26 different
chamber arrangements. The filename for the saved data sets is standardized to allow easy
recognition of the operating configuration for the user and Matlab program. The
standardized filename code is presented in Figure 2-1.
Data processing programs
Several Matlab data processing programs were developed for the HPCF. The main
Matlab program for the HPCF is titled “HPCF_Data_Processor” and performs processing
on both the main data file from the Labview GUI “HPCF Control Interface” and the high-

18
frequency pressure transducer data from the Labview GUI “HPCF-HFPT Interface”.
This program reads in the main data file, reads in the HFPT data file, sorts the data sets,
calculates the heat fluxes from the thermocouple readings, plots many operational
parameters versus time, performs frequency analysis on the data, and logs the test into the
“Combustion Test Master Log” file. The tests are logged in the master log file by
filename and include other test information such as operational chamber pressure,
equivalence ratio, propellant flow rates, and confirmation of availability of HFPT and
image data for the test. This makes finding old tests based on desired operation
parameters easy.
In addition, there were several other Matlab programs developed to aid in various
aspects of the HPCF. First, there is program titled “HFPT_Compare” that directly
compares the high-frequency pressure transducer data from several different tests via
plots of the data versus time and frequency analysis. A program titled
“HPCF_Image_Processor” reads the images from the combustion test and allows further
analysis from the user, such as average flame profile calculation. A program titled
“HPCF_AvgFlameSpeed” reads the image pairs from the combustion test and calculates
the average flame speed through a correlation analysis of the high speed image pairs.
The codes for all of these Matlab programs are presented in Appendix A. Several other
programs were developed as well, but are not presented here. They include programs
used to determine laser intensity profile and various imaging calibration techniques.
19
Figure 2-1. Standardized filename code for all saved main combustion test data files. High-frequency pressure transducer test data files use the same code except for the addition of “hfpt” before the test number (i.e. 010106OUF1IP3CA3SAhfptT01).
010106OUF1IP3CA3SAT01 Date of Test (MM/DD/YY)
Oxidizer: O = Oxygen A = Air
Injector: See Fig. 3-5
Injector Position: See Fig. 3-6
Chamber Arrangement: See Fig. 3-8
Test Number (T##)

20
CHAPTER 3 HIGH-PRESSURE COMBUSTION FACILITY
This chapter discusses in detail the design and construction of the University of
Florida High-Pressure Combustion Facility (UF HPCF). This discussion incorporates
every aspect of the facility, generally broken down into the combustor system, the
propellant feed system, and the control/data acquisition (DAQ) system. Some of these
general systems are further divided into components for design/discussion purposes. The
combustor system consists of the combustion chamber, injector, and other combustor
system components. The control/DAQ system consists of the electronics, control/DAQ
hardware, and the Labview GUI. Furthermore, discussion of how all of these systems
work and function together to form the UF HPCF is presented.
Combustor System
As previously mentioned, the combustor system is broken down into the
combustion chamber, injector, and other combustor system components for
design/discussion purposes. Each of these components presented their own design
challenges worthy of discussion. The combustor system employs each of these
components together for proper functionality.
Combustion Chamber
For the HPCF, the main design goal of the combustion chamber was to house
extremely high temperature combustion at high pressure with optical access to the inside
of the chamber. This goal played directly into choosing both the chamber material and
chamber geometry.

21
Chamber material
The chamber material chosen had to provide ample strength and thermal
characteristics. The extremely high flame temperatures seemed to suggest going with a
refractory metal as the chamber material, such as tungsten. However, many of the
refractory metals oxidize quickly in the presence of oxygen, making them unusable. The
high pressure operation (6.25 MPa) suggested going with a high strength material, such
as steel. However, the melting temperature and thermal conductivity of steel is low.
Therefore, a steel chamber might develop local hot spots, resulting in failure of the
chamber due to steel’s inability to dissipate heat quickly. Copper manages to balance
strength, melting temperature, and thermal conductivity. Copper has a yield strength and
melting temperature comparable to steel. However, copper has a very high thermal
conductivity, allowing the material to pump heat away from hot spots and distribute it
throughout its bulk quickly. This capability of copper lends itself to short durations at
extremely high temperature and even longer durations if a cooling system is
implemented. Copper 110 was chosen as the chamber material for these reasons.
Chamber geometry
The chamber geometry was chosen to eliminate stress concentration areas and hot
spots while allowing maximum optical access capabilities. Initially a cylindrical chamber
was designed due to ease of manufacturing. However, a round chamber made having
optical access without recesses in the chamber flow path impossible. Because the
windows needed flat faces to keep distortion of the optics to a minimum, creating a
window to match the inside cylindrical surface was not an option. Therefore, for ease of
implementing optical access, a square internal chamber cross-section was chosen. It is
known that sharp corners, or extremely small radii, result in high stress concentration. To
22
optimize the design of the chamber, ProEngineer/ProMechanica was used to perform
stress and strain modeling on several different chamber design possibilities. A stress
model for the final chamber geometry is shown in Figure 3-1. A transient thermal
analysis was performed on the chamber as well, the results of are shown in Figure 3-2.
The analysis indicated that the maximum chamber wall temperature after a 10 second run
would be 450 K, well below the melting point of copper. Experiments with test runs of 8
seconds have shown wall temperatures of approximately 550 – 600 K. The difference
exists due to the discrepancy between the higher flow rates of the combustion tests and
the lower flow rates used to calculate the heat load in the transient analysis during the
design phase. As expected, the higher flow rates results in a higher heat release and
higher heat load, and thus a higher wall temperature. Optimization between reducing
stress due to pressure and maximizing optical access resulted in replacing the sharp
corners of the square with 3.18 mm (0.125 in.) radius, as shown in Figure 3-3. This
design drastically reduced the stress in the chamber while rendering a large percentage of
the chamber cross section visible. The combustion chamber geometry was finalized with
a 25.4 by 25.4 mm (1 by 1 in.) square with 3.175 mm (0.125 in.) radius corners cut
through the center of a 63.5 by 63.5 by 101.6 mm (2.5 by 2.5 by 4 in.) piece of Copper
110.
Optical access
Designing optical access into the high-pressure combustion chamber proved to be
challenging. The first consideration for the optical access was window material.
Because of the high flame temperatures and desired laser diagnostic capabilities, a
material had to be chosen with a high melting temperature, low coefficient of thermal
expansion, and the ability to transmit a large percentage of the light spectrum, including
23
ultraviolet. UV-grade fused silica was chosen as the window material, with a softening
temperature above 1600°C and the ability to transmit the light spectrum from 225nm
through 1000+ nm.24
The next consideration for the optical access was shape/size of the window. The
windows needed to be sufficiently thick to take the high pressure combustion regimes, as
well as sit flush to the inner wall of the chamber. Because the maximum dimension
inside of the chamber is 25.4 mm (1 in.), the window did not need to exceed 25.4 mm (1
in.) in width. After reviewing several fused silica suppliers and considering the chamber,
a round 25.4 mm (1 in.) outer diameter (OD) UV-grade fused silica window was chosen,
supplied by Esco Products. Although the round window causes a decrease in the viewing
area as compared to a square window, the combination of small length scale interest for
the combustion and the ease and availability of the round window made it a good choice.
Stress calculations confirmed that a 25.4 mm (1 in.) thick, 25.4 mm (1 in.) OD fused
silica window was sufficient to take the pressure loading.
The final consideration for the optical access was how to mount the windows
securely in the chamber wall. The biggest problem with mounting the windows in the
copper chamber resided in the huge difference in coefficients of thermal expansion for
the two materials. For example, the ratio of the coefficient of thermal expansion of the
copper to that of the fused silica is 42.5.24 As a result, copper will tend to expand much
more than the fused silica window. This can cause sealing problems by opening up larger
gaps between the windows and chamber during combustion. Another problem occurs
upon cooling of the chamber. Because of the gap growth between the copper and the
fused silica during combustion, the windows have the possibility to relax slightly crooked

24
in the chamber wall once the pressure reduces. As the copper cools and contracts, the
slightly crooked window will be forced by the wall back to its correct position. This
however can cause the window edges to catch in the metal and crack or break the
windows. Windows breaking in the chamber poses both a safety issue and a time/cost
effectiveness issue. To correct for these problems between the chamber and windows, a
radial o-ring system was designed into the window cavity in the chamber wall. Two
radial o-ring grooves were cut into the perimeter of the window cavity at two different
depths, cross-sectionally shown in Figure 3-4. The two radial o-rings allow the window
to essentially float in the center of the window cavity without touching the chamber wall.
Because of the tight tolerances, the o-rings have room to expand outwards with the
chamber wall while holding the window firmly in the center of the cavity and keeping a
tight seal. Using two radial o-rings spaced apart keeps the window upright and does not
allow the window to tilt in the cavity, which could cause the glass to catch an edge on the
metal and break upon cooling.
Another problem with mounting the windows was keeping them flush on the inner
wall of the chamber. The desire to keep the inner window surface flush with the inner
chamber wall was to ensure a smooth flow path and eliminate extraneous flame-holding
spots within the chamber. A step was machined by Esco Products into the end of the
window cavity and the end of the window. The steps in the chamber and window mate
when the window is inserted into the chamber, as shown in Figure 3-4. The mating
surface of the chamber step with the window step was polished to keep the window edge
from catching and resulting in a broken window. Another benefit of this glass-to-metal
seal is that it eliminates the need for a rubber seal to be located so close to the combustion
25
zone and high temperatures. With the window fully inserted into the chamber wall, the
outer surface is flush with a slightly larger recess in the chamber wall. A rubber gasket is
placed over this recess and covers the entire metal surface and the outer edge of the
window surface in the recess. A flange is then tightened down onto the chamber wall
with the use of 6 #10 bolts and nuts. This flange is designed to press the gasket against
the window when completely tightened down. The pressure from this gasket keeps the
window from trying to push out of its recess in the chamber during high pressure tests
while allowing slight movements due to thermal expansion. The flange also contains a
drill through hole with the same outer diameter as that of the recess in the inside of the
chamber, also shown in Figure 3-4, resulting in a viewable diameter of 20.6 mm (0.81
in.).
This optical access system provides a very large viewing area as compared to the
internal dimensions of the chamber and injector while maintaining structural integrity and
a tight seal. The combustion chamber, with optical access system installed, has been
pressure tested to over 6.7 MPa (1000 psi) without failure, leaking, or any noticeable
adverse affects. The tests were conducted with cold nitrogen gas first by slowly
increasing and decreasing the pressure. Then more strenuous tests were performed by
hammering the chamber with the high pressure nitrogen and exhausting the nitrogen as
quickly as possible. The windows stayed perfectly in place and did not fail or crack
during these tests cold nitrogen pressure tests.
Other chamber features
As described, the combustion chamber is made of copper 110 and offers optical
access on all four sides of the chamber. The chamber also incorporates ¼-20 tapped
holes at each of the four corners of the two chamber mounting faces. These tapped holes

26
receive ¼-20 threaded rod, allowing the injector, chamber extensions, and exhaust nozzle
to be attached to the main chamber. The chamber also incorporates ports for heat flux
sensors up one side, which are discussed in the DAQ section of this chapter.
Injector
The injector for the HPCF is currently a single-element, coaxial, shear injector.
Single-element refers to there being only one exit for the fuel and one exit for the
oxidizer into the chamber, as opposed to a multi-element injector which essentially
incorporates a matrix of single-element injectors. Coaxial indicates that the oxidizer and
the fuel flow symmetrically about the same axis. More specifically, the fuel injects
annularly around a center stream of oxidizer. A shear injector relies solely on the shear
between the fuel stream and oxidizer stream to mix them together, rather than employing
swirling or impinging techniques. This shear is achieved by injecting the propellants at
different relative velocities. The single-element, coaxial, shear injector for the HPCF was
designed with three goals: adaptability to many different flow regimes, ease of
assembly/integration into combustor system, and ease/cost of manufacturing. This
resulted in three components which collectively form the injector: the fuel annulus,
oxidizer nozzle, and injector housing.
Injector material
The material selection for the injector followed the same methodology as that for
the combustion chamber. For the same reasons that the chamber was made of copper, the
fuel annulus and oxidizer nozzle were made of copper. Being made of copper allows the
injector to have structural integrity by dissipating heat from flame-holding regions at the
tip of the injector. However, instead of copper 110 for the injector, oxygen-free copper
was used. The oxygen-free copper ensures that there is no impregnation of oxygen into

27
the fuel stream before it reaches the chamber. The injector housing, which the fuel
annulus and oxidizer nozzle mount to and which allows mounting of the injector
assembly to the injector, was made of steel for structural and ease/cost of manufacturing
purposes.
Injector geometry
The geometry for the injector housing allows simple mounting of the injector
assembly to the combustion chamber, integration of the fuel annulus and oxidizer nozzle,
and inclusion of nitrogen purging and injector face thermocouples. A cutout of the
injector is shown in Figure 3-5. The oxidizer nozzle is soldered to a stainless steel tube
that extends through the back of the injector housing through a tube fitting equipped with
a Teflon ferule. This oxidizer nozzle mounting method allows the tip of the nozzle to be
moved relative to the surface of the injector without permanently locking a metal ferule
onto the tube, effectively giving the ability for recessed, flush, and protruding
configurations. A spacer sleeve and a spacer baffle are used to hold the oxidizer nozzle
in the center of the injector housing. The spacer baffle also serves to uniformly distribute
the fuel flow around the oxidizer nozzle.
The oxidizer nozzle is shaped to inject the oxidizer straight into the chamber. The
fuel annulus surrounds the oxidizer nozzle and contains a length of straight passage to
straighten the fuel flow before injection into the chamber. The fuel annulus screws into
the face of the injector housing until its face and the face of the injector housing are flush.
The fuel annulus tightens down onto an o-ring to ensure no fuel is ejected through the
threaded portion. Currently the HPCF is equipped for three different injector positions,
the details of which are depicted in Figure 3-6. The injector assembly is attached to the

28
chamber via the 4 ¼-20 bolts and the position of the injector inside the chamber is
determined by the use of spacer tubes, as indicated in Figure 3-7.
The dimensions of the injector were determined from a combination of literature
review (see Table 1-1) and careful examination of the goals of the HPCF. In order to
allow a range of flow conditions for GH2/GO2, two injectors were designed, designated
UF1 and UF2. A third injector also exists for use in GH2/air experiments and is
designated UF0. The geometrical details of the three injectors can be found in Figure 3-
5. The fuel annulus remains the same for all three injectors. The oxidizer nozzle, on the
other hand, has different diameters for each injector, which are given in Figure 3-5.
Other Combustor System Components
The remaining combustor system components include the exhaust nozzle, chamber
extensions, and the igniter.
Exhaust nozzle
The exhaust nozzle allows the flow to choke at the exit of the chamber, resulting in
a rise in the chamber pressure. For the purposes of the UF HPCF, the exhaust nozzle was
not designed to optimize the exhaust flow for propulsion purposes. The exhaust nozzle
was designed to choke the flow for a certain chamber pressure, for long service life, and
ease of assembly/integration. For the same reasons listed for the chamber and injector,
the exhaust nozzle was also made of copper. Long service life from the nozzle required
all hot spots be eliminated. Because the exhaust nozzle endures direct contact with the
flame and recirculation regions of hot exhaust gases, the nozzle was smoothly contoured
down from the inlet face to a minimum diameter hole and contoured back out to the exit
face, as shown in Figure 3-7. This smooth contoured profile eliminates sharp corners and
the resulting hot spots, which could lead to premature wear or failure. The copper nozzle

29
disc is mounted between two mating flanges which mount to the chamber. O-rings seal
the nozzle within the flanges. This nozzle flange system allows many nozzles for
different flow conditions to be quickly made and replaced. A picture of the exhaust
nozzle assembly installed in the combustor is shown in Figure 3-14.
Chamber extensions
Chamber extensions serve to change the length of the chamber and/or to
incorporate DAQ/control or safety features into the chamber. Currently there are four
different chamber extensions, with two of the four being identical. All of the extension
pieces are made of copper 110, same as the chamber. The extensions also incorporate
through-holes and an o-ring groove on the mating surface to allow sealed attachment to
the chamber. The chamber extensions have the same cross section as the chamber, but
differ in length. The two identical extensions are 18.61 mm (0.7325 in.) long and each
incorporates a single heat flux sensor. The longer extension of length 38.1 mm (1.5 in.)
incorporates four heat flux sensors. The fourth chamber extension differs in function
from the other three in that it is always attached to the chamber immediately upstream of
the exhaust nozzle. This permanent extension has ports into the chamber on all four of its
sides. One port houses the igniter, one port houses a thermocouple that can protrude into
the chamber and a low frequency pressure transducer, another port houses a high
frequency pressure transducer and allows passage to a safety valve that opens in the event
of an over-pressure, and fourth port exists for extra DAQ hardware (currently plugged).
A picture of the chamber extension installed in the combustor is shown in Figure 3-14.
Igniter
The igniter places a 10,000 volt spark inside the chamber, allowing the propellants
to ignite. The igniter consists of two main components: the igniter lead and the
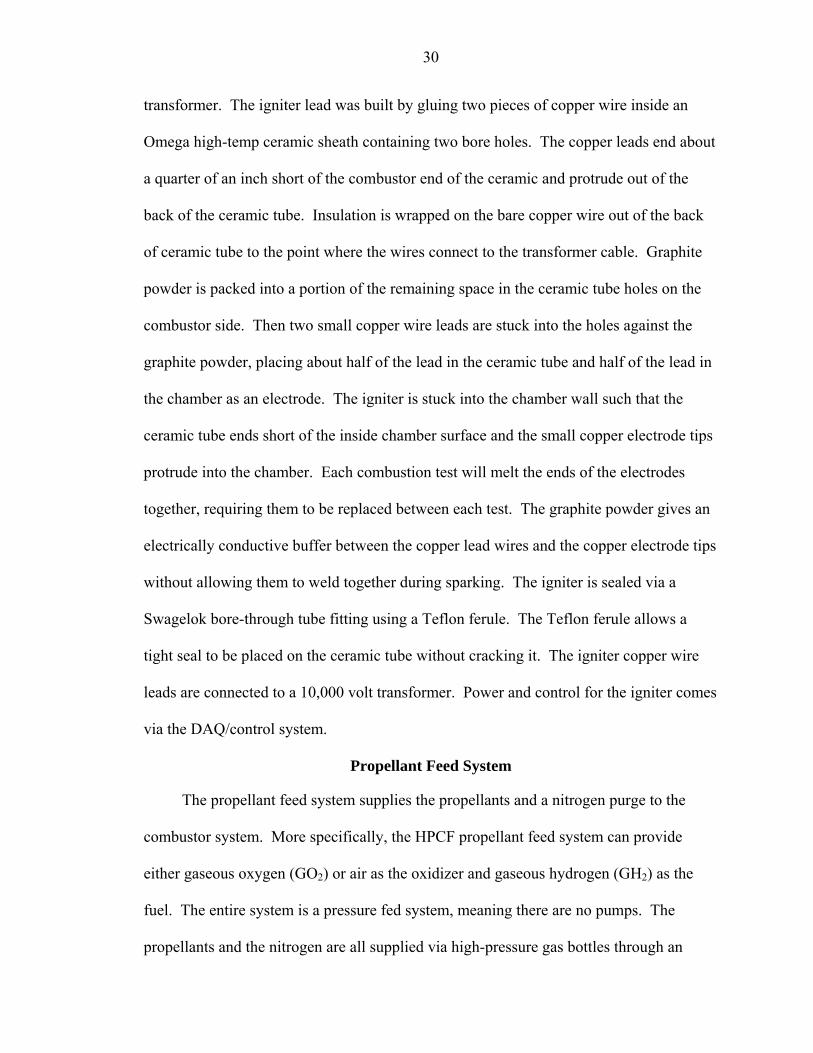
30
transformer. The igniter lead was built by gluing two pieces of copper wire inside an
Omega high-temp ceramic sheath containing two bore holes. The copper leads end about
a quarter of an inch short of the combustor end of the ceramic and protrude out of the
back of the ceramic tube. Insulation is wrapped on the bare copper wire out of the back
of ceramic tube to the point where the wires connect to the transformer cable. Graphite
powder is packed into a portion of the remaining space in the ceramic tube holes on the
combustor side. Then two small copper wire leads are stuck into the holes against the
graphite powder, placing about half of the lead in the ceramic tube and half of the lead in
the chamber as an electrode. The igniter is stuck into the chamber wall such that the
ceramic tube ends short of the inside chamber surface and the small copper electrode tips
protrude into the chamber. Each combustion test will melt the ends of the electrodes
together, requiring them to be replaced between each test. The graphite powder gives an
electrically conductive buffer between the copper lead wires and the copper electrode tips
without allowing them to weld together during sparking. The igniter is sealed via a
Swagelok bore-through tube fitting using a Teflon ferule. The Teflon ferule allows a
tight seal to be placed on the ceramic tube without cracking it. The igniter copper wire
leads are connected to a 10,000 volt transformer. Power and control for the igniter comes
via the DAQ/control system.
Propellant Feed System
The propellant feed system supplies the propellants and a nitrogen purge to the
combustor system. More specifically, the HPCF propellant feed system can provide
either gaseous oxygen (GO2) or air as the oxidizer and gaseous hydrogen (GH2) as the
fuel. The entire system is a pressure fed system, meaning there are no pumps. The
propellants and the nitrogen are all supplied via high-pressure gas bottles through an

31
intricate network of tubing, valves, and regulators. A schematic of the propellant feed
system is shown in Figure 3-10. The propellant feed system offers a reliable and
controllable supply of propellants and nitrogen purge to the combustor system.
As mentioned, this pressure fed system relies on high-pressure gas bottles. For the
air supply, an array of 6 bottles at 17.9 MPa (2600 psi) are connected in parallel and is
located inside the combustion lab. The GO2 supply is provided by an array of 10 bottles
at 17.9 MPa (2600 psi), all connected in parallel. The GO2 bottles are located outside
under a covered shed for safety. The GH2 supply is provided by a single hydrogen bottle
at 17.9 MPa (2600 psi), which is located inside the combustion lab. An array of 6
hydrogen bottles at 15.2 MPa (2200 psi) located outside the building is available for
future integration if the need for longer tests arises. For the purpose of this study,
however, the fuel mass flow rates are low enough to warrant one bottle of hydrogen,
which can deliver upwards of 20-30 tests. The nitrogen purge supply is provided by 1
bottle of nitrogen at 17.9 MPa (2600 psi) located inside the combustion lab. This
nitrogen bottle is connected to both the oxidizer and fuel lines, as well as the chamber
purge line into the back of the injector housing, allowing complete nitrogen purge of the
propellant supply lines, injector, and chamber. This setup also offers the capability to
purge nitrogen throughout the experiment or pre-pressurization of the chamber
immediately before the combustion test.
The entirety of the oxidizer lines is 9.53 mm (0.375 in.) OD stainless steel tubing.
Beyond the valves located on each of the oxidizer bottles, numerous ball valves are
placed in the oxidizer lines to provide shutoff capabilities at several key locations,
switching capability between the oxidizer GO2 and air feeds, and nitrogen purge

32
capability. The GO2 line incorporates a ball valve at the lab entry point for safety. There
is also a ball valve inline close to the tanks outside, allowing excess oxygen to be bled off
safely and allow a place for purging nitrogen to exit the line. Two ball valves directly
upstream of the oxidizer pressure regulator allow the oxidizer to be switched to either
GO2 or air, depending on which ball valve is open. The nitrogen purge for the oxidizer
line is supplied by opening another ball valve at the back of the air line, allowing full
purge of both the air and GO2 lines, as well as the oxidizer supply line that connects to
the injector. Every component in the oxidizer supply line is rated for more than 20.7
MPa (3000 psi), incorporating a good safety margin.
The fuel line is 6.35 mm (0.25 in.) OD stainless steel tubing. There is only one ball
valve located in the fuel line. This ball valve is located near the bottle on a line that tees
into the main fuel line, providing a nitrogen purge to the fuel line when the fuel bottle is
shut off and the ball valve is open. This nitrogen purges the entire line from the bottle all
the way through the injector. As with the oxidizer line, every component in the fuel
supply line is rate for more than 20.7 MPa (3000 psi).
The nitrogen purge line is 6.35 mm (0.25 in.) OD stainless steel tubing. The
nitrogen bottle connects to the oxidizer and fuel lines. Ball valves at both connections
allow control of the nitrogen purge into the propellant supply lines. Also, check valves
are in place before each ball valve to keep oxidizer or fuel from flowing back into the
main nitrogen line for safety reasons.
The propellant supply system previously described delivers both the fuel and
oxidizer to the injector and chamber. However, the propellants must be controlled to
certain pressures and mass flow rates. Also, the control system needs the ability to vary

33
the pressures and flow rates of the propellants to provide a range of combustion tests.
The propellant control system for the high pressure combustion facility provides the
capability to control the pressure and flow rates of the propellants through the use of
pressure regulators, solenoid valves, check valves, and regulating (needle) valves. It is
most convenient to discuss these regulators and valves in order of appearance in the
supply lines from closest to the gas battles to closest to the chamber. A pressure
regulator appears first in line for both the oxidizer and fuel. The pressure regulator
provides a constant propellant supply (downstream) pressure for a varying gas bottle
(upstream) pressure. The oxidizer pressure regulator is a Tescom 26-1100 series, having
a maximum outlet pressure of 20.7 MPa (3000 psi) and a maximum inlet pressure of 34.5
MPa (5000 psi), as well as being rated for oxygen service and a Cv of 1.5. This regulator
is dome loaded with a 1:1 ratio, meaning that the outlet pressure of the regulator is the
pressure applied to the dome. The dome is controlled via nitrogen and a Tescom 26-1000
series pressure regulator, with a maximum inlet and outlet pressure of 20.7 MPa (3000
psi). The fuel pressure regulator is a Tescom 44-1100 series pressure regulator, with a
maximum inlet and outlet pressure of 20.7 MPa (3000 psi) and a Cv of 0.8, and is rated
for use with hydrogen. Next in line are the needle valves. The needle valves allow
precise control of the flow rates of propellants by turning the fine metering handles a
certain number of turns and relating that number to the Cv via a calibration. Three
different needle valve series are used for both the oxidizer and the fuel, depending on the
desired flow rate, and are designated as Swagelok S-Series Metering Valve, Swagok 31-
Series Metering Valve, Swagelok 1-Series Integral-Bonnet Needle Valve. The
calibrations for these needle valves are given in Appendix C. The number of turns on

34
each valve is input to the Labview GUI, which is discussed later. The solenoid valves
appear next in both the oxidizer and fuel lines. They allow the flow of propellants to be
turned on and off remotely, precisely, and quickly. Both the oxidizer and fuel solenoid
valves are Marotta MV100 series solenoid valves, with maximum inlet and outlet
pressure of 20.7 MPa (3000 psi) and a Cv of 0.18. These Marotta valves require a 25
VDC input to activate the solenoid and open the valve. The power and control to the
solenoid valves is supplied via the control/DAQ system. The solenoid valves are located
immediately downstream of the needle valves to eliminate pressure hammering the
needle valves, which can lead to premature failure. Finally in the propellant supply lines
are the check valves. Both the oxidizer and fuel lines have a check valve located close to
the injector. These check valves are Swagelok CH4 series and require only 7 Pa (1 psi)
cracking pressure difference. The check valves allow the oxidizer and fuel to flow to the
injector when activated while disallowing backflow, effectively eliminating the
possibility of premixed gases traveling upstream into the propellant feed system. The
nitrogen purge control is less demanding than that of the propellants. A Victor pressure
regulator allows a nitrogen purge pressure up to 5.5 MPa (800 psi). An Omega SV128
series solenoid valve allows fast shut on/off of the nitrogen purge through the
DAQ/control system. Arrays of filters are used in the oxidizer and fuel feed lines to
ensure clean gas injection. As shown, the propellant feed system allows precise control
of the pressure and flow rate of both the oxidizer and fuel safely. In summary:
• Oxidizer Pressure Regulator: Tescom 26-1100 series. 1:1 Dome type. Maximum outlet pressure = 20.7 MPa (3000 psi). Maximum inlet pressure = 34.5 MPa (5000 psi). Cv = 1.5.
• Nitrogen Dome Controlling Regulator: Tescom 26-1000 series. Maximum outlet pressure = 20.7 MPa (3000 psi). Maximum inlet pressure = 20.7 MPa (3000 psi).

35
• Fuel Pressure Regulator: Tescom 44-1100 series. Maximum outlet pressure = 20.7 MPa (3000 psi). Maximum inlet pressure = 20.7 MPa (3000 psi). Cv = 0.8.
• Nitrogen Purge Regulator: Victor Pressure Regulator. Maximum outlet pressure = 5.5 MPa (800 psi). Maximum inlet pressure = 5.5 MPa (800 psi).
• Oxidizer/Fuel Low Flow Rate Metering Valve: Swagelok S-Series Metering Valve (calibration in Appendix C).
• Oxidizer/Fuel Medium Flow Rate Metering Valve: Swagelok 31-Series Metering Valve (calibration in Appendix C).
• Oxidizer/Fuel High Flow Rate Metering Valve: Swagelok 1-Series Integral-Bonnet Needle Valve (calibration in Appendix C).
• Oxidizer Solenoid Valve: Marotta MV100 Series Solenoid Valve. Maximum inlet pressure = 20.7 MPa (3000 psi). Maximum outlet pressure = 20.7 MPa (3000 psi). Cv = 0.18.
• Fuel Solenoid Valve: Marotta MV100 Series Solenoid Valve. Maximum inlet pressure = 20.7 MPa (3000 psi). Maximum outlet pressure = 20.7 MPa (3000 psi). Cv = 0.18.
• Nitrogen Purge Solenoid Valve: Omega SV128 Series Solenoid Valve. Maximum inlet pressure = 6.9 MPa (1000 psi). Maximum outlet pressure = 6.9 MPa (1000 psi).
• Oxidizer Injector Check Valve: Swagelok CH4 Series Check Valve. Cracking pressure = 7 Pa (1 psi).
• Fuel Injector Check Valve: Swagelok CH4 Series Check Valve. Cracking pressure = 7 Pa (1 psi).
Control/DAQ System
The HPCF control/DAQ system manages the power supply to all components of
the HPCF, gives the user complete control of the HPCF and the combustion tests, and
provides a variety of data acquisition capabilities for the combustion tests. A schematic
flowchart of the control/DAQ system is shown in Figure 3-11. The power management
is provided via the electronics system. The control/DAQ hardware provides responsive
control and data acquisition capabilities. A Labview GUI provides complete control of

36
the HPCF to the user from a remote location. All of these sub-systems work in parallel
and rely upon each other to form the HPCF control/DAQ system.
Electronics system
The electronics system for the HPCF provides the power management for the
igniter and the propellant and nitrogen purge solenoid valves. Figure 3-12 shows the
circuit diagram for the electronics system. The entire system is housed within a box that
is supplied with 120 VAC and 24 VDC. Inside the box resides five solid-state relays:
one for the oxidizer solenoid valve, one for the fuel valve, one for the nitrogen valve, and
one for each of the igniter leads. The propellant solid-state relays supply 24 VDC to the
solenoid valves with 5 VDC excitation. The nitrogen purge and igniter lead solid-state
relays supply 120 VAC with 5 VDC excitation. Two relays are used for the igniter
because of the exposed nature of the two igniter electrodes. Using a relay for each lead
ensures that one lead does not touch a ground and short out the system or injure someone.
The 5 VDC excitation for all relays is supplied by the control/DAQ hardware and
controlled via the Labview GUI, which will be discussed shortly. Connections to the
electronics system are made via BNC connectors and banana plugs.
Control/DAQ Hardware
The high-pressure combustion facility requires quick and accurate on-the-fly
control of the propellant/nitrogen purge flows and the ignition of the chamber, as well as
reading and recording of valuable test data. The control/DAQ system for the HPCF
provides all of the control and data recording capabilities required. The control/DAQ
hardware are responsible for managing the input/output of control signals and feedback
and all data acquisition signals. The hardware consists of the computer hardware, DAQ
sensors, and the laser and imaging systems. The computer hardware includes a National

37
Instruments PCI-MIO-16E-1/SCXI-1000 chassis, a National Instruments PCI-6259/BNC-
2110, and a fiberoptic/PCI board. The DAQ sensors include thermocouples, heat flux
sensors, standard pressure transducers, and a high-frequency pressure transducer. The
laser and imaging systems incorporate a laser, tunable OPO, and an intensified CCD
camera.
Computer hardware
As previously mentioned, the computer hardware consists of a National
Instruments PCI-MIO-16E-1/SCXI-1000 chassis, a National Instruments PCI-6259/BNC-
2110, and a fiberoptic/PCI board. The PCI-MIO-16E-1/SCXI-1000 chassis is used
exclusively for controlling the electronics system and reading all sensors, with the
exception of the high-frequency pressure transducer. The SCXI-1000 chassis houses a
SCXI-1100 module for 32 thermocouple channels, a SCXI-1140 module for 8 pressure
transducer channels, and a SCXI-1124 for 6 output channels of 0-10 VDC. The PCI-
6259/BNC-2110 board is used for reading the high-frequency pressure transducer. This
transducer had to be separated from the SCXI-1000 chassis to obtain high-frequency
response while allowing the interactive feedback from the combustion tests to the SCXI-
1000 chassis and to the computer/user. The fiberoptic/PCI board is used for image
acquisition and connects the intensified CCD camera to the same computer as the high-
frequency pressure transducer.
DAQ sensors
The DAQ sensors are used to collect valuable combustion test data, as well as to
provide in-situ feedback to the computer/user for test control and safety purposes. The
sensors include propellant line pressure transducers, chamber pressure transducer, a
thermocouple open to the chamber environment, injector face thermocouples, a
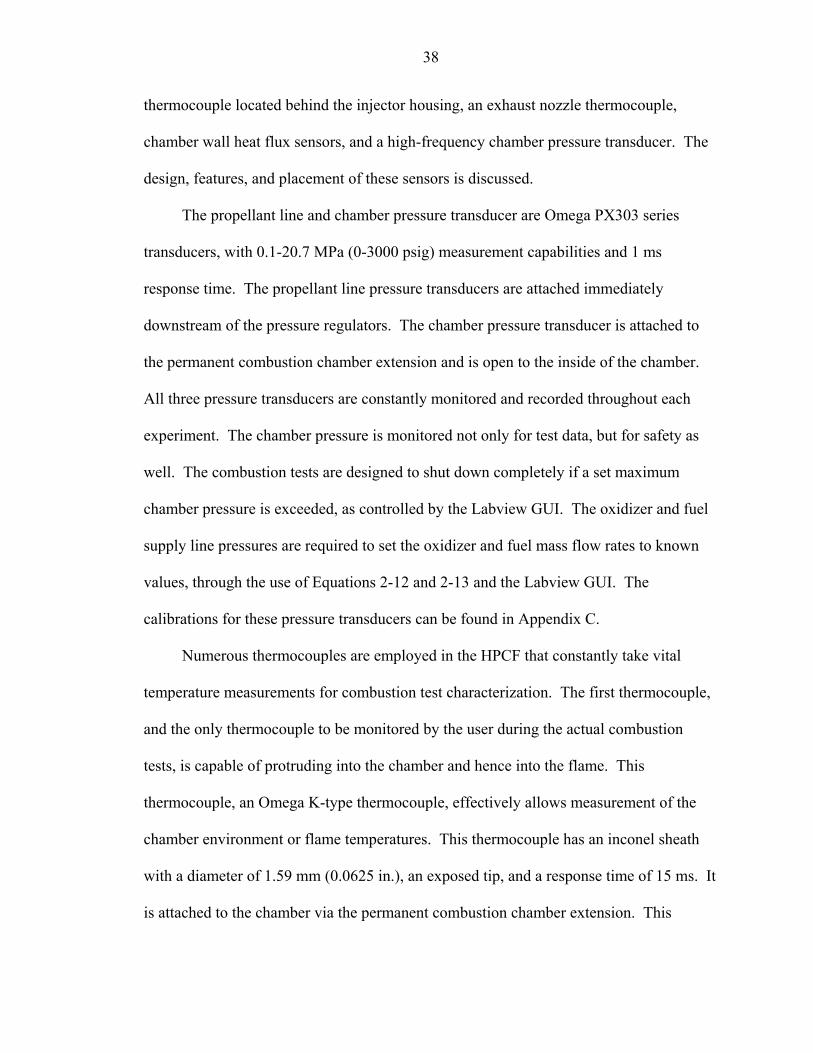
38
thermocouple located behind the injector housing, an exhaust nozzle thermocouple,
chamber wall heat flux sensors, and a high-frequency chamber pressure transducer. The
design, features, and placement of these sensors is discussed.
The propellant line and chamber pressure transducer are Omega PX303 series
transducers, with 0.1-20.7 MPa (0-3000 psig) measurement capabilities and 1 ms
response time. The propellant line pressure transducers are attached immediately
downstream of the pressure regulators. The chamber pressure transducer is attached to
the permanent combustion chamber extension and is open to the inside of the chamber.
All three pressure transducers are constantly monitored and recorded throughout each
experiment. The chamber pressure is monitored not only for test data, but for safety as
well. The combustion tests are designed to shut down completely if a set maximum
chamber pressure is exceeded, as controlled by the Labview GUI. The oxidizer and fuel
supply line pressures are required to set the oxidizer and fuel mass flow rates to known
values, through the use of Equations 2-12 and 2-13 and the Labview GUI. The
calibrations for these pressure transducers can be found in Appendix C.
Numerous thermocouples are employed in the HPCF that constantly take vital
temperature measurements for combustion test characterization. The first thermocouple,
and the only thermocouple to be monitored by the user during the actual combustion
tests, is capable of protruding into the chamber and hence into the flame. This
thermocouple, an Omega K-type thermocouple, effectively allows measurement of the
chamber environment or flame temperatures. This thermocouple has an inconel sheath
with a diameter of 1.59 mm (0.0625 in.), an exposed tip, and a response time of 15 ms. It
is attached to the chamber via the permanent combustion chamber extension. This

39
thermocouple sees the highest temperature of any of the thermocouples because it is open
the in-situ combustion chamber environment. The depth of protrusion into the chamber
is kept to a minimum, and is often recessed, during combustion tests, as the flame
temperature is approximately 3000 K, well above the melting temperature of the
thermocouple materials. In general, this thermocouple is monitored for easy recognition
of ignition in the chamber, as the quick response time allows near instantaneous
temperature increase at the onset of combustion, viewable through the Labview GUI.
The next two thermocouples measure the temperature at two different locations on
the injector face. These thermocouples are Omega K-type thermocouples. They have
inconel sheaths with 1.02 mm (0.04 in.) sheath diameters and exposed tips for fast
response times of 10 ms. These two thermocouples are set up to read the injector face
temperature at a distance of 2.11 mm (0.083 in.) and 4.24 mm (0.167 in.) radially
outward from the center axis of the injector, as shown in Figure 3-9. These
thermocouples provide valuable data about the recirculation regions that occur on the
injector face. Another thermocouple is located behind the injector housing. This
thermocouple has the same characteristics as the injector face thermocouples. It is used
to detect any indication of backflow or heat transfer through the gap between the injector
housing and the chamber wall. Finally, the exhaust nozzle thermocouple is an Omega K-
type thermocouple with an inconel sheath of 0.51 mm (0.02 in.) diameter, an exposed tip,
and a response time of 7 ms. This thermocouple is embedded into the back face of the
exhaust nozzle to a distance of 1.59 mm (0.0625 in.) to the combustion exposed face of
the exhaust nozzle. The data from this thermocouple gives insight into the effects of
direct exposure to the flame and provides a boundary condition for CFD modeling.

40
The chamber wall heat flux sensors provide heat flux data for the length of the
combustion chamber. Each heat flux sensor used in the HPCF were made in-house and
consist of two thermocouples located side-by-side that protrude into the chamber wall at
different depths. Because the thermocouples are small in diameter relative to the
chamber dimensions, the axial displacement between the two thermocouples (center to
center) is only 0.04 in., which is small relative to the chamber dimensions, and the
thermocouples can be approximated as axially linear. Therefore, the heat flux is
calculated via Equation 2.14 from the temperature difference between the two
thermocouples, the axial distance between the two thermocouple tips, and the heat
transfer coefficient of the chamber material.
Each thermocouple used in the heat flux sensors consists of an Omega 1.02 mm
(0.040 in.) OD double-hole ceramic thermocouple insulator, an Omega K-type bare wire
thermocouple, wire insulation, heat shrink tubing, and an Omega K-type mini connector.
The ceramic tubes were sheared to one of two different lengths. The thermocouple wires
were fed through the two holes in the ceramic tube until the junction of the thermocouple
was situated at the end of the ceramic tube. Wire insulation was placed over the
remainder of the thermocouple wires to keep them from touching, and heat shrink tubing
was used to hold the wire insulation against the back of the ceramic tube. The ends of the
thermocouple wire were attached to the insulated mini connector. By having a portion of
the thermocouple flexible, i.e. the portion using wire insulation around the wires, the risk
for accidentally breaking the ceramic portion and possibly losing electrical isolation is
minimized. For each pair, the longer of the thermocouple pair protrudes into the chamber
wall to a distance of 3.18 mm (0.125 in.) from the inner chamber wall, while the shorter

41
of the thermocouple pair protrudes to a distance of 9.53 mm (0.375 in.) from the inner
chamber wall, giving a depth difference of 6.35 mm (0.25 in.). This is the value of ∆x
used in Equation 2-15 for calculating the heat flux. As explained, the two thermocouples
are located side-by-side, so that the center axis of each thermocouple are only 1.02 mm
(0.040 in.) apart, as viewed perpendicular to the wall or down the lengths of the
thermocouples. The placement of the heat flux sensor thermocouples is shown in Figure
3-3. These custom made thermocouples have a response time of approximately 5 ms.
The heat flux sensors are all located along one face of the combustion chamber and
extensions. On the combustion chamber there are 8 heat flux sensors. The two shorter
chamber extensions each have a single heat flux sensor and the longer chamber extension
has 4 heat flux sensors. In total, this can give as few as 8 heat flux sensors and as many
as 14 heat flux sensors, depending on the chamber arrangement. Table 3-1 lists the
distance from the injector face to each heat flux sensor depending on both the injector
position and the chamber arrangements, which are depicted in Figure 3-6 and Figure 3-8
respectively. In the cases where all three chamber extensions are used in conjunction
with the combustion chamber, limitations in the DAQ channels require that the lowest
heat flux sensor (beside or behind the injector) go unused, as explained in the operational
procedure in Appendix B.
The high-frequency chamber pressure transducer is used to monitor dominant
frequencies inherent to the combustion process, as well as the combustor system. The
goal of using this sensor is to determine what effect the chamber length, mass flow rates,
and chamber pressure have on the frequencies of the combustion process. The sensor is
an Entran EPX series static transducer with a full scale range of 6.9 MPa (1000 psi), a

42
maximum pressure of 13.8 MPa (2000 psi), and accurate frequency response up to 50
kHz. The sensor ouput ranges from 0-100 mV for 0.1-6.9 MPa (0-1000psig) excitation.
The sensor is attached to the permanent combustion chamber extension.
A problem arose due to the high-frequency pressure transducers output of only 100
mV at 6.9 MPa (1000 psi). Reading the mV signal into the computer resulted in
extremely high noise content of ± 0.7 MPa (100 psi) after conversion. With the cabling
from the transducer to the DAQ board shielded, the mV order noise seemed to be at the
DAQ system and hence unavoidable. Therefore, an inline operational amplifier had to be
built to increase the output to the order of 10 V at 6.9 MPa (1000 psi) due to the high
noise content in the mV range. The amplifier chip is a Texas Instruments TLV2373 rail-
to-rail op-amp with 3MHz response. The circuit was built inside a small electronics box
with BNC input/outputs. The circuit diagram for the op-amp is shown in Figure 3-13.
The amplifier was calibrated using known output voltages to create a calibration curve
for output voltage vs. amplification factor, which can be found in Appendix C. The
amplifier reduced the noise to less than ± 30 Pa (5 psi).
Laser and imaging systems
The laser and imaging systems in the HPCF include a laser, a tunable OPO, and an
intensified CCD Camera. The laser is a Continuum Surelite Nd:YAG Laser, with a 355
nm output and a maximum power of 170 mJ. The beam from the laser is directed into a
Continuum Panther OPO, capable of tunable ouput in the UV and visible spectrums. The
doubler allows tuning of the beam wavelength to 283 nm for OH excitation. The camera
is a Cooke DiCam-Pro instensified CCD camera, capable of taking 1280x1024 images at
10 fps and 1280x480 images at 20 fps with exposure times down to 5 ns. The camera is
triggered from the laser and can be delayed if required.

43
Labview GUI
The Labview graphical user interface (GUI) allows the user to remotely control the
HPCF. This is accomplished via direct control/monitoring of the electronics system and
the control/DAQ hardware through simple to use interfaces on remote computers. One
Labview GUI, titled “HPCF Control Interface”, is dedicated to control/monitoring of the
entire HPCF, with the exception of the high-frequency pressure transducer, which has its
own Labview GUI, and the laser and imaging systems, which are controlled via their own
software packages. On a separate computer, another Labview GUI is used to take data
from the high-frequency pressure transducer and is titled “HPCF-HFPT Interface”.
The “HPCF Control Interface” is the main Labview GUI for the facility. Through
this GUI the user can control the propellant/nitrogen purge valves, ignition, various
combustion test timings, data acquisition channel selection, and the on/off of the
combustion tests, as well as monitor in-situ chamber pressure and temperature and the
combustion test progress through various indicators and graphs. Figure 3-15 shows the
“HPCF Control Interface” as the user sees it when the Labview GUI is operational. Each
component of the GUI is labeled with a number and is explained in Table 3-2. Some key
features of the “HPCF Control Interface” include:
• Front panel control of all valves and spark.
• Front panel monitoring of chamber temperature and pressure, propellant flow rates, and combustion test progress.
• Front panel control of combustion test time features.
• One button combustion test activation.
• One button emergency shutdown.

44
The “HPCF-HFPT Interface” gives the user control of the data acquisition from the
high-frequency pressure transducer. This simple interface simply gives the user the
ability to start the experiment and set the save file path. Once run, the data is presented in
the graph on the interface. This interface is shown in Figure 3-16, with the components
numbered and explained in Table 3-2.
HPCF Assembly and Operation
The assembly and operational procedures for the UF HPCF are located in
Appendix B. The assembly procedure includes complete assembly of the combustor
system and subcomponents, maintenance of components between testing, and
disassembly/troubleshooting. The operational procedure completely details from start to
finish how to safely and effectively operate the UF HPCF.
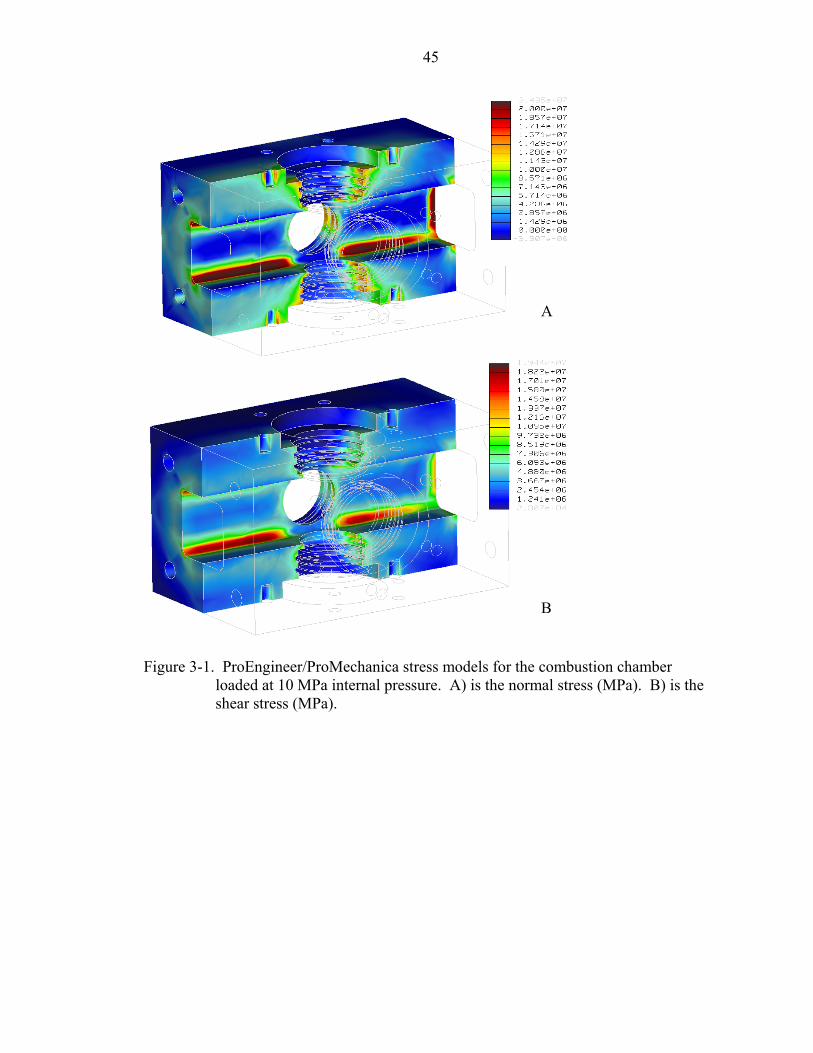
45
Figure 3-1. ProEngineer/ProMechanica stress models for the combustion chamber
loaded at 10 MPa internal pressure. A) is the normal stress (MPa). B) is the shear stress (MPa).
A
B
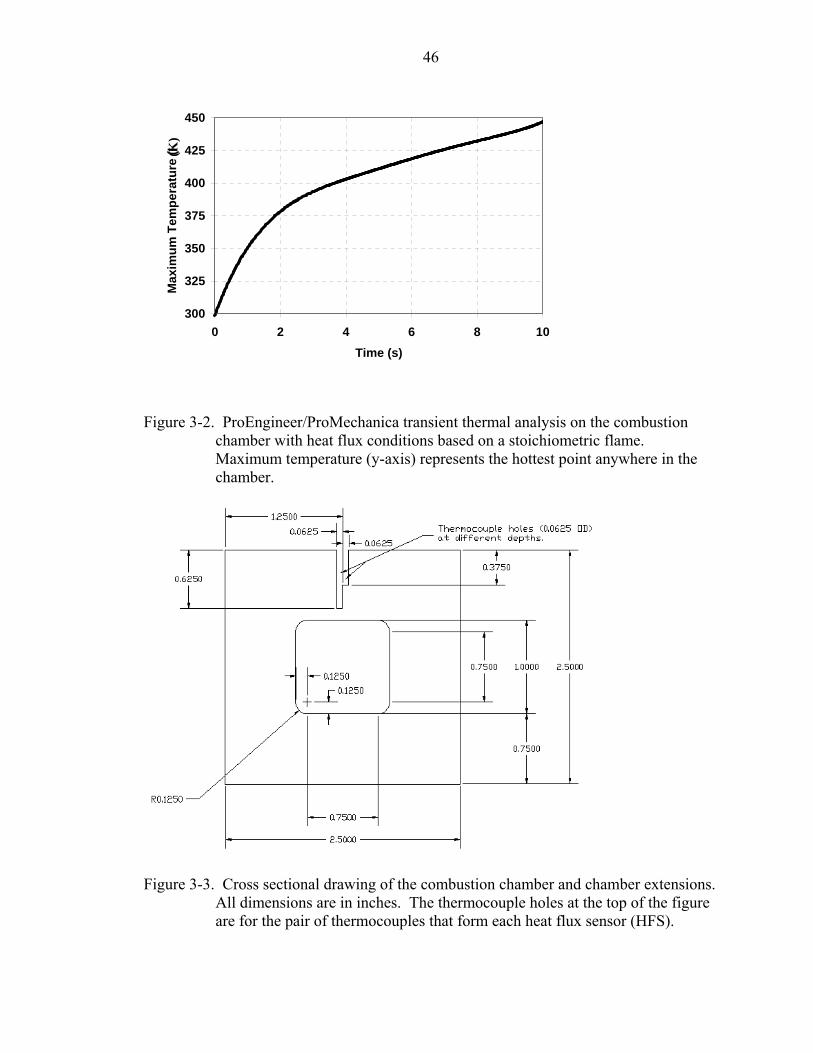
46
300
325
350
375
400
425
450
0 2 4 6 8 10Time (s)
Max
imum
Tem
pera
ture
(K)
(K)
Figure 3-2. ProEngineer/ProMechanica transient thermal analysis on the combustion
chamber with heat flux conditions based on a stoichiometric flame. Maximum temperature (y-axis) represents the hottest point anywhere in the chamber.
Figure 3-3. Cross sectional drawing of the combustion chamber and chamber extensions.
All dimensions are in inches. The thermocouple holes at the top of the figure are for the pair of thermocouples that form each heat flux sensor (HFS).
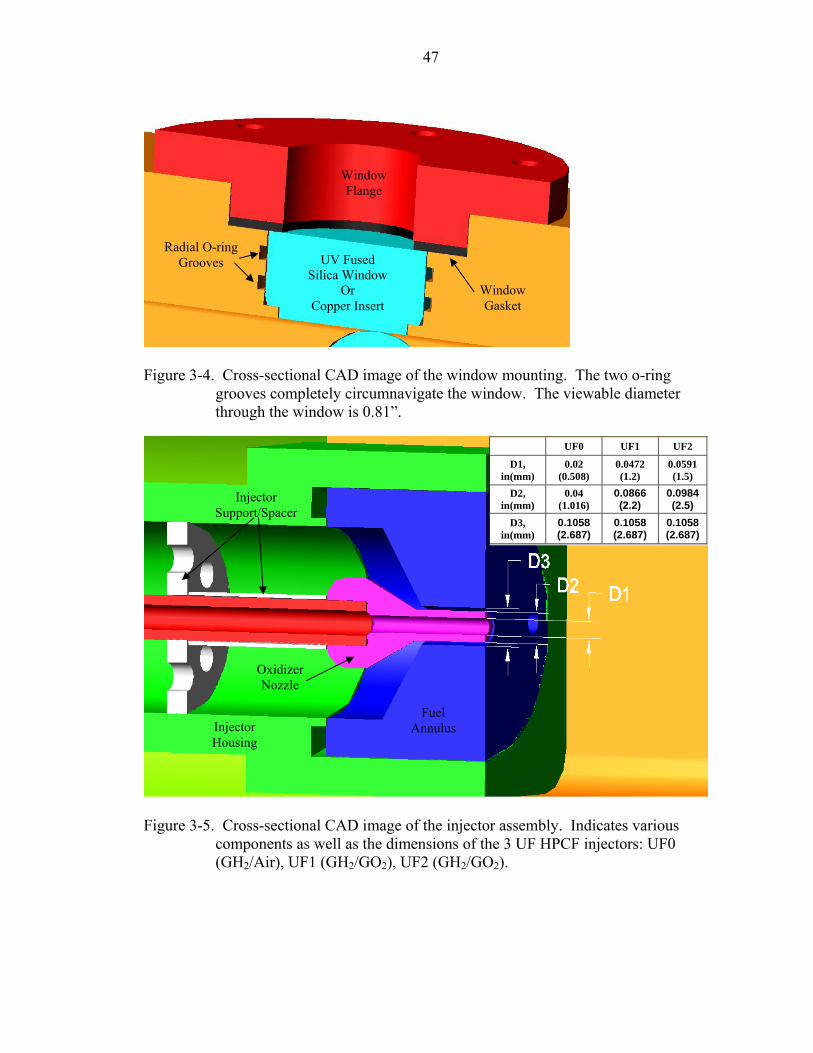
47
Figure 3-4. Cross-sectional CAD image of the window mounting. The two o-ring
grooves completely circumnavigate the window. The viewable diameter through the window is 0.81”.
Figure 3-5. Cross-sectional CAD image of the injector assembly. Indicates various
components as well as the dimensions of the 3 UF HPCF injectors: UF0 (GH2/Air), UF1 (GH2/GO2), UF2 (GH2/GO2).
UV Fused Silica Window
Or Copper Insert
Window Flange
Radial O-ring Grooves
Window Gasket
Injector Housing
Oxidizer Nozzle
Fuel Annulus
Injector Support/Spacer
UF0 UF1 UF2
D1, in(mm)
0.02 (0.508)
0.0472 (1.2)
0.0591 (1.5)
D2, in(mm)
0.04 (1.016)
0.0866 (2.2)
0.0984 (2.5)
D3, in(mm)
0.1058 (2.687)
0.1058 (2.687)
0.1058 (2.687)
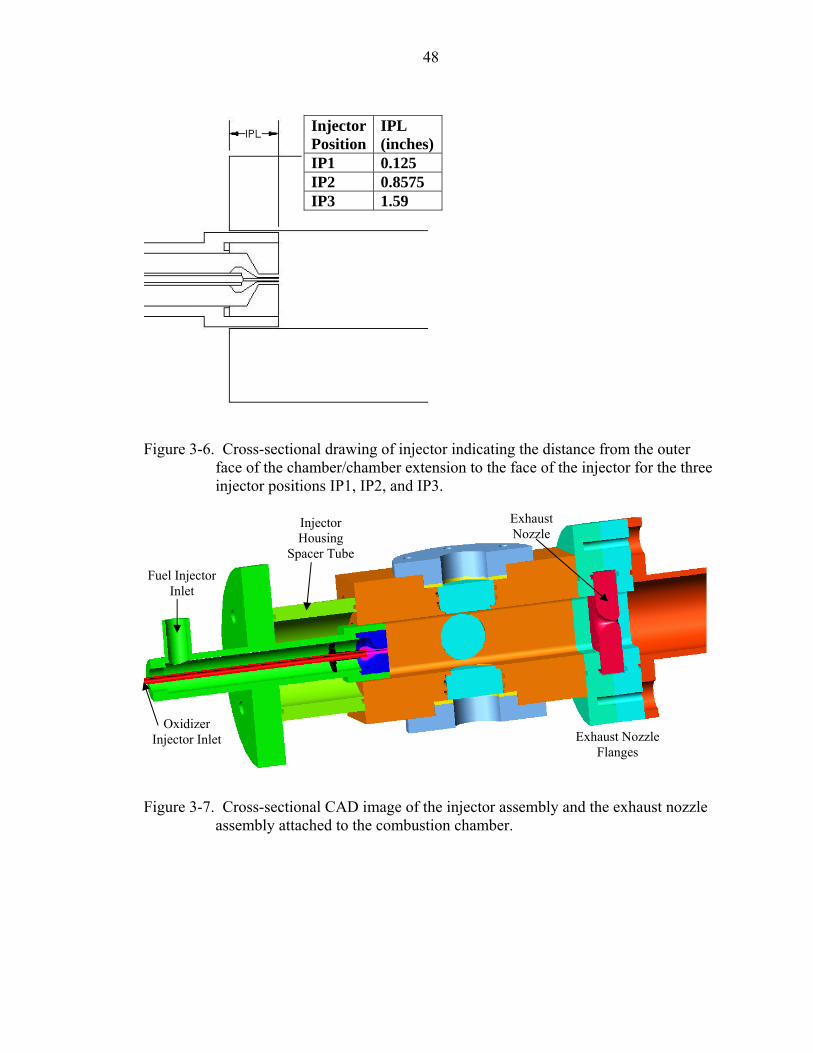
48
Figure 3-6. Cross-sectional drawing of injector indicating the distance from the outer
face of the chamber/chamber extension to the face of the injector for the three injector positions IP1, IP2, and IP3.
Figure 3-7. Cross-sectional CAD image of the injector assembly and the exhaust nozzle
assembly attached to the combustion chamber.
Injector Position
IPL (inches)
IP1 0.125 IP2 0.8575 IP3 1.59
Injector Housing
Spacer Tube
Oxidizer Injector Inlet
Fuel Injector Inlet
Exhaust Nozzle Flanges
Exhaust Nozzle

49
Figure 3-8. Pictorial of the different chamber arrangements possible for the HPCF.
Flow path is left to right. CC – combustion chamber. SE – short chamber extension. LE – long chamber extension.
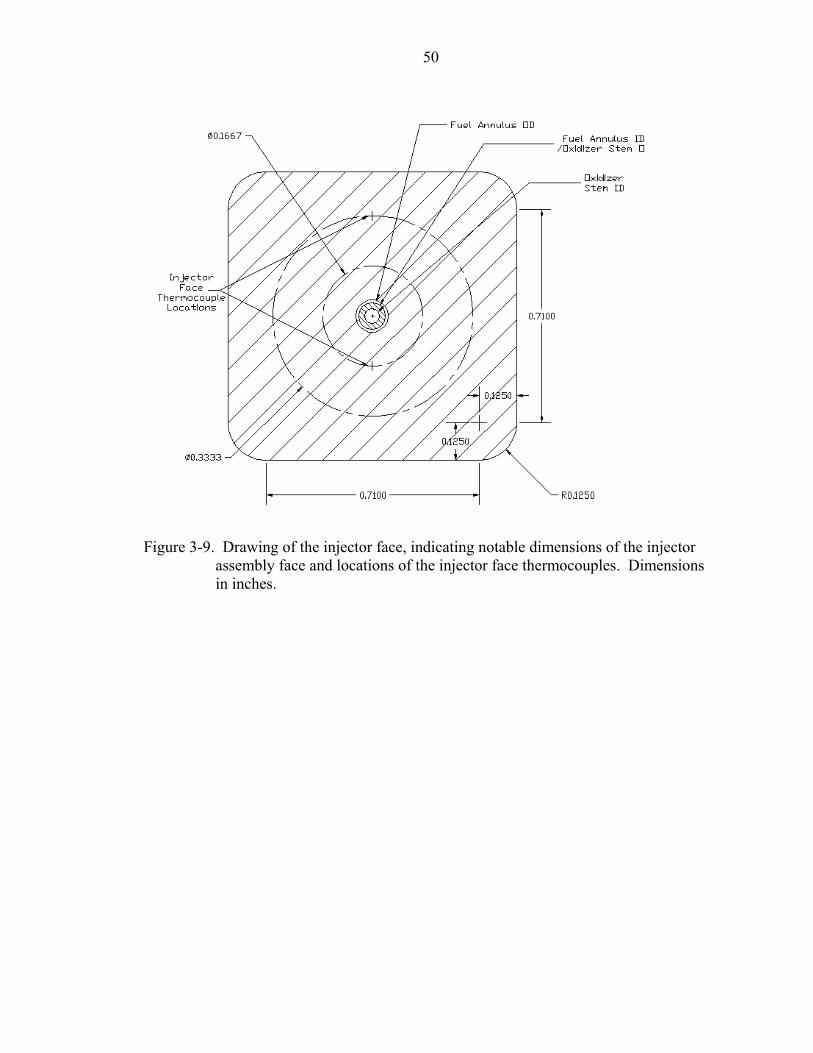
50
Figure 3-9. Drawing of the injector face, indicating notable dimensions of the injector
assembly face and locations of the injector face thermocouples. Dimensions in inches.
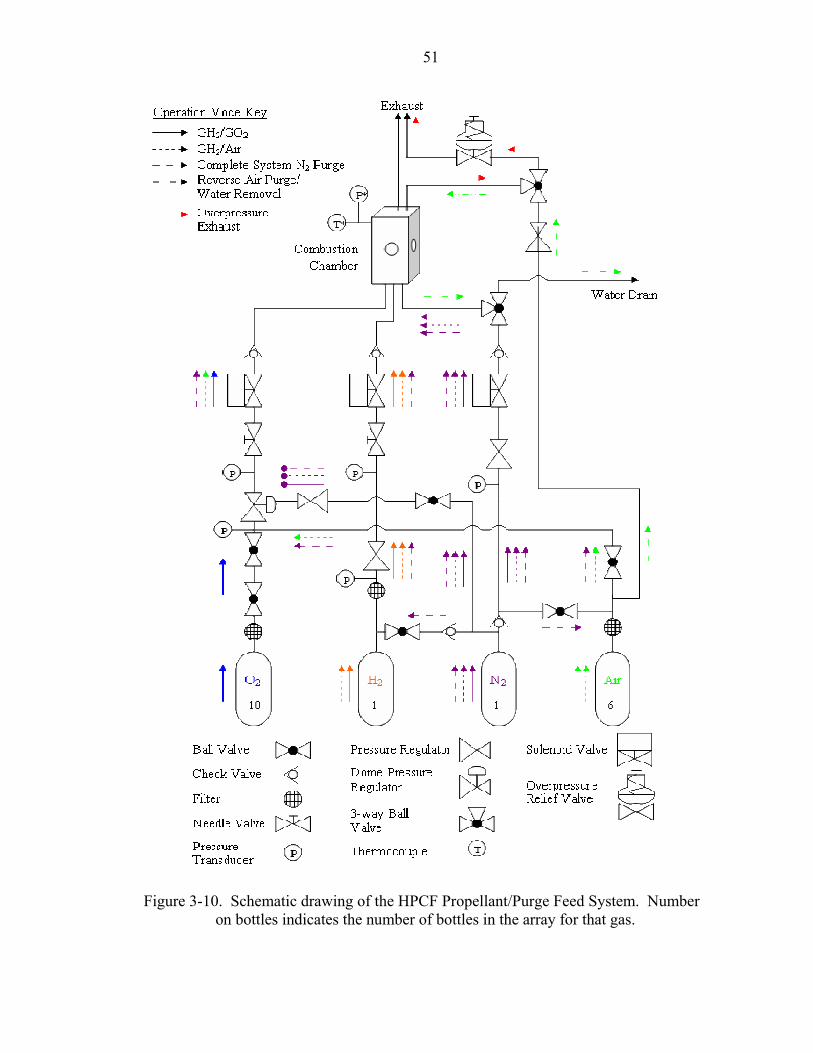
51
Figure 3-10. Schematic drawing of the HPCF Propellant/Purge Feed System. Number
on bottles indicates the number of bottles in the array for that gas.
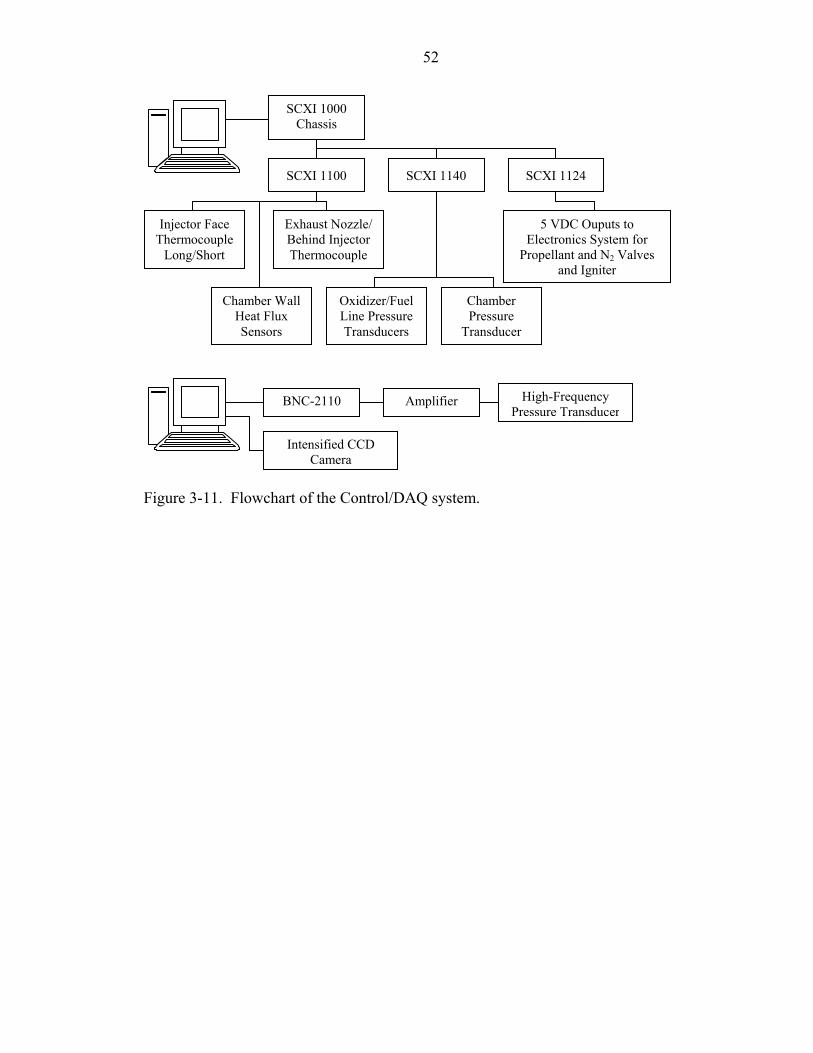
52
Figure 3-11. Flowchart of the Control/DAQ system.
SCXI 1000 Chassis
SCXI 1100 SCXI 1140 SCXI 1124
Injector Face Thermocouple
Long/Short
Chamber Wall Heat Flux Sensors
Exhaust Nozzle/ Behind Injector Thermocouple
Oxidizer/Fuel Line Pressure Transducers
Chamber Pressure
Transducer
5 VDC Ouputs to Electronics System for
Propellant and N2 Valves and Igniter
BNC-2110 Amplifier High-Frequency Pressure Transducer
Intensified CCD Camera
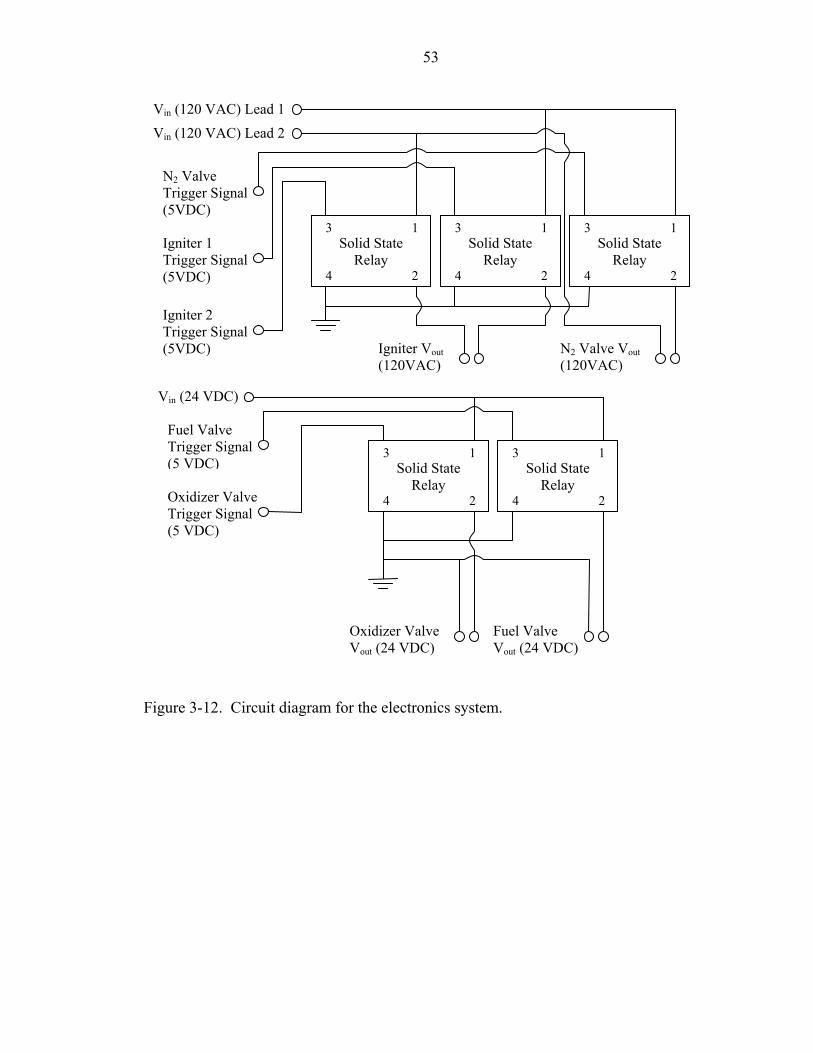
53
Figure 3-12. Circuit diagram for the electronics system.
Solid State Relay
3 1
24
Solid State Relay
3 1
2 4
Vin (24 VDC)
Oxidizer Valve Trigger Signal (5 VDC)
Fuel Valve Trigger Signal (5 VDC)
Oxidizer Valve Vout (24 VDC)
Fuel Valve Vout (24 VDC)
Vin (120 VAC) Lead 1
Solid State Relay
3 1
24
Solid State Relay
3 1
24
Solid State Relay
3 1
24
Vin (120 VAC) Lead 2
Igniter 1 Trigger Signal (5VDC)
Igniter 2 Trigger Signal (5VDC)
N2 Valve Trigger Signal (5VDC)
N2 Valve Vout (120VAC)
Igniter Vout (120VAC)

54
Table 3-1. Distances from the injector face to the heat flux sensors for all injector position/chamber arrangement combinations. All dimensions in inches.
HFS1 HFS2 HFS3 HFS4 HFS5 HFS6 HFS7 HFS8 HFS9 HFS10 HFS11 HFS12 HFS13 HFS14IP1CA0SA 0 0.4 0.8 1.2 2.55 2.95 3.35 3.75 0 0 0 0 0 0IP1CA1SA 0 0.4 0.8 1.2 2.55 2.95 3.35 3.75 4.24125 0 0 0 0 0IP1CA2SA 0 0.4 0.8 1.2 2.55 2.95 3.35 3.75 4.24125 4.97375 0 0 0 0IP1CA3SA 0 0.4 0.8 1.2 2.55 2.95 3.35 3.75 4.24125 4.97375 5.49 5.89 6.29 6.69IP1CA3SB 0 0.4 0.8 1.2 2.55 2.95 3.35 3.75 4.24125 4.7575 5.1575 5.5575 5.9575 6.47375IP1CA3SC 0 0.4 0.8 1.2 2.55 2.95 3.35 3.75 4.025 4.425 4.825 5.225 5.74125 6.47375IP1CA4SA 0 0.4 0.8 1.2 2.55 2.95 3.35 3.75 4.025 4.425 4.825 5.225 0 0IP1CA5SA 0 0.4 0.8 1.2 2.55 2.95 3.35 3.75 4.24125 4.7575 5.1575 5.5575 5.9575 0IP1CA5SB 0 0.4 0.8 1.2 2.55 2.95 3.35 3.75 4.025 4.425 4.825 5.225 5.74125 0IP1CA6SA 0.24125 0.7325 1.1325 1.5325 1.9325 3.2825 3.6825 4.0825 4.4825 4.7575 5.1575 5.5575 5.9575 0IP1CA7SA 0.24125 0.97375 1.465 1.865 2.265 2.665 4.015 4.415 4.815 5.215 5.49 5.89 6.29 6.69IP1CA8SA 0.24125 0.7325 1.1325 1.5325 1.9325 3.2825 3.6825 4.0825 4.4825 4.97375 5.49 5.89 6.29 6.69IP1CA8SB 0.24125 0.7325 1.1325 1.5325 1.9325 3.2825 3.6825 4.0825 4.4825 4.7575 5.1575 5.5575 5.9575 6.47375IP1CA9SA 0.24125 0.7325 1.1325 1.5325 1.9325 3.2825 3.6825 4.0825 4.4825 4.97375 0 0 0 0IP1CA1RA 0.24125 0.7325 1.1325 1.5325 1.9325 3.2825 3.6825 4.0825 4.4825 0 0 0 0 0IP1CA2RA 0.24125 0.97375 1.465 1.865 2.265 2.665 4.015 4.415 4.815 5.215 0 0 0 0IP1CA3RA 0.24125 0.97375 1.49 1.89 2.29 2.69 2.965 3.365 3.765 4.165 5.515 5.915 6.315 6.715IP1CA3RB 0.24125 0.7575 1.1575 1.5575 1.9575 2.47375 2.965 3.365 3.765 4.165 5.515 5.915 6.315 6.715IP1CA3RC 0.025 0.425 0.825 1.225 1.74125 2.47375 2.965 3.365 3.765 4.165 5.515 5.915 6.315 6.715IP1CA4RA 0.025 0.425 0.825 1.225 1.5 1.9 2.3 2.7 4.05 4.45 4.85 5.25 0 0IP1CA5RA 0.24125 0.7575 1.1575 1.5575 1.9575 2.2325 2.6325 3.0325 3.4325 4.7825 5.1825 5.5825 5.9825 0IP1CA5RB 0.025 0.425 0.825 1.225 1.74125 2.2325 2.6325 3.0325 3.4325 4.7825 5.1825 5.5825 5.9825 0IP1CA6RA 0.025 0.425 0.825 1.225 1.5 1.9 2.3 2.7 4.05 4.45 4.85 5.25 5.74125 0IP1CA7RA 0.025 0.425 0.825 1.225 1.5 1.9 2.3 2.7 4.05 4.45 4.85 5.25 5.74125 6.47375IP1CA8RA 0.24125 0.7575 1.1575 1.5575 1.9575 2.2325 2.6325 3.0325 3.4325 4.7825 5.1825 5.5825 5.9825 6.47375IP1CA8RB 0.025 0.425 0.825 1.225 1.74125 2.2325 2.6325 3.0325 3.4325 4.7825 5.1825 5.5825 5.9825 6.47375IP2CA0SA -0.7325 -0.3325 0.0675 0.4675 1.8175 2.2175 2.6175 3.0175 0 0 0 0 0 0IP2CA1SA -0.7325 -0.3325 0.0675 0.4675 1.8175 2.2175 2.6175 3.0175 3.50875 0 0 0 0 0IP2CA2SA -0.7325 -0.3325 0.0675 0.4675 1.8175 2.2175 2.6175 3.0175 3.50875 4.24125 0 0 0 0IP2CA3SA -0.7325 -0.3325 0.0675 0.4675 1.8175 2.2175 2.6175 3.0175 3.50875 4.24125 4.7575 5.1575 5.5575 5.9575IP2CA3SB -0.7325 -0.3325 0.0675 0.4675 1.8175 2.2175 2.6175 3.0175 3.50875 4.025 4.425 4.825 5.225 5.74125IP2CA3SC -0.7325 -0.3325 0.0675 0.4675 1.8175 2.2175 2.6175 3.0175 3.2925 3.6925 4.0925 4.4925 5.00875 5.74125IP2CA4SA -0.7325 -0.3325 0.0675 0.4675 1.8175 2.2175 2.6175 3.0175 3.2925 3.6925 4.0925 4.4925 0 0IP2CA5SA -0.7325 -0.3325 0.0675 0.4675 1.8175 2.2175 2.6175 3.0175 3.50875 4.025 4.425 4.825 5.225 0IP2CA5SB -0.7325 -0.3325 0.0675 0.4675 1.8175 2.2175 2.6175 3.0175 3.2925 3.6925 4.0925 4.4925 5.00875 0IP2CA6SA -0.49125 0 0.4 0.8 1.2 2.55 2.95 3.35 3.75 4.025 4.425 4.825 5.225 0IP2CA7SA -0.49125 0.24125 0.7325 1.1325 1.5325 1.9325 3.2825 3.6825 4.0825 4.4825 4.7575 5.1575 5.5575 5.9575IP2CA8SA -0.49125 0 0.4 0.8 1.2 2.55 2.95 3.35 3.75 4.24125 4.7575 5.1575 5.5575 5.9575IP2CA8SB -0.49125 0 0.4 0.8 1.2 2.55 2.95 3.35 3.75 4.025 4.425 4.825 5.225 5.74125IP2CA9SA -0.49125 0 0.4 0.8 1.2 2.55 2.95 3.35 3.75 4.24125 0 0 0 0IP2CA1RA -0.49125 0 0.4 0.8 1.2 2.55 2.95 3.35 3.75 0 0 0 0 0IP2CA2RA -0.49125 0.24125 0.7325 1.1325 1.5325 1.9325 3.2825 3.6825 4.0825 4.4825 0 0 0 0IP2CA3RA -0.49125 0.24125 0.7575 1.1575 1.5575 1.9575 2.2325 2.6325 3.0325 3.4325 4.7825 5.1825 5.5825 5.9825IP2CA3RB -0.49125 0.025 0.425 0.825 1.225 1.74125 2.2325 2.6325 3.0325 3.4325 4.7825 5.1825 5.5825 5.9825IP2CA3RC -0.7075 -0.3075 0.0925 0.4925 1.00875 1.74125 2.2325 2.6325 3.0325 3.4325 4.7825 5.1825 5.5825 5.9825IP2CA4RA -0.7075 -0.3075 0.0925 0.4925 0.7675 1.1675 1.5675 1.9675 3.3175 3.7175 4.1175 4.5175 0 0IP2CA5RA -0.49125 0.025 0.425 0.825 1.225 1.5 1.9 2.3 2.7 4.05 4.45 4.85 5.25 0IP2CA5RB -0.7075 -0.3075 0.0925 0.4925 1.00875 1.5 1.9 2.3 2.7 4.05 4.45 4.85 5.25 0IP2CA6RA -0.7075 -0.3075 0.0925 0.4925 0.7675 1.1675 1.5675 1.9675 3.3175 3.7175 4.1175 4.5175 5.00875 0IP2CA7RA -0.7075 -0.3075 0.0925 0.4925 0.7675 1.1675 1.5675 1.9675 3.3175 3.7175 4.1175 4.5175 5.00875 5.74125IP2CA8RA -0.49125 0.025 0.425 0.825 1.225 1.5 1.9 2.3 2.7 4.05 4.45 4.85 5.25 5.74125IP2CA8RB -0.7075 -0.3075 0.0925 0.4925 1.00875 1.5 1.9 2.3 2.7 4.05 4.45 4.85 5.25 5.74125IP3CA0SA -1.465 -1.065 -0.665 -0.265 1.085 1.485 1.885 2.285 0 0 0 0 0 0IP3CA1SA -1.465 -1.065 -0.665 -0.265 1.085 1.485 1.885 2.285 2.77625 0 0 0 0 0IP3CA2SA -1.465 -1.065 -0.665 -0.265 1.085 1.485 1.885 2.285 2.77625 3.50875 0 0 0 0IP3CA3SA -1.465 -1.065 -0.665 -0.265 1.085 1.485 1.885 2.285 2.77625 3.50875 4.025 4.425 4.825 5.225IP3CA3SB -1.465 -1.065 -0.665 -0.265 1.085 1.485 1.885 2.285 2.77625 3.2925 3.6925 4.0925 4.4925 5.00875IP3CA3SC -1.465 -1.065 -0.665 -0.265 1.085 1.485 1.885 2.285 2.56 2.96 3.36 3.76 4.27625 5.00875IP3CA4SA -1.465 -1.065 -0.665 -0.265 1.085 1.485 1.885 2.285 2.56 2.96 3.36 3.76 0 0IP3CA5SA -1.465 -1.065 -0.665 -0.265 1.085 1.485 1.885 2.285 2.77625 3.2925 3.6925 4.0925 4.4925 0IP3CA5SB -1.465 -1.065 -0.665 -0.265 1.085 1.485 1.885 2.285 2.56 2.96 3.36 3.76 4.27625 0IP3CA6SA -1.22375 -0.7325 -0.3325 0.0675 0.4675 1.8175 2.2175 2.6175 3.0175 3.2925 3.6925 4.0925 4.4925 0IP3CA7SA -1.22375 -0.49125 0 0.4 0.8 1.2 2.55 2.95 3.35 3.75 4.025 4.425 4.825 5.225IP3CA8SA -1.22375 -0.7325 -0.3325 0.0675 0.4675 1.8175 2.2175 2.6175 3.0175 3.50875 4.025 4.425 4.825 5.225IP3CA8SB -1.22375 -0.7325 -0.3325 0.0675 0.4675 1.8175 2.2175 2.6175 3.0175 3.2925 3.6925 4.0925 4.4925 5.00875IP3CA9SA -1.22375 -0.7325 -0.3325 0.0675 0.4675 1.8175 2.2175 2.6175 3.0175 3.50875 0 0 0 0IP3CA1RA -1.22375 -0.7325 -0.3325 0.0675 0.4675 1.8175 2.2175 2.6175 3.0175 0 0 0 0 0IP3CA2RA -1.22375 -0.49125 0 0.4 0.8 1.2 2.55 2.95 3.35 3.75 0 0 0 0IP3CA3RA -1.22375 -0.49125 0.025 0.425 0.825 1.225 1.5 1.9 2.3 2.7 4.05 4.45 4.85 5.25IP3CA3RB -1.22375 -0.7075 -0.3075 0.0925 0.4925 1.00875 1.5 1.9 2.3 2.7 4.05 4.45 4.85 5.25IP3CA3RC -1.44 -1.04 -0.64 -0.24 0.27625 1.00875 1.5 1.9 2.3 2.7 4.05 4.45 4.85 5.25IP3CA4RA -1.44 -1.04 -0.64 -0.24 0.035 0.435 0.835 1.235 2.585 2.985 3.385 3.785 0 0IP3CA5RA -1.22375 -0.7075 -0.3075 0.0925 0.4925 0.7675 1.1675 1.5675 1.9675 3.3175 3.7175 4.1175 4.5175 0IP3CA5RB -1.44 -1.04 -0.64 -0.24 0.27625 0.7675 1.1675 1.5675 1.9675 3.3175 3.7175 4.1175 4.5175 0IP3CA6RA -1.44 -1.04 -0.64 -0.24 0.035 0.435 0.835 1.235 2.585 2.985 3.385 3.785 4.27625 0IP3CA7RA -1.44 -1.04 -0.64 -0.24 0.035 0.435 0.835 1.235 2.585 2.985 3.385 3.785 4.27625 5.00875IP3CA8RA -1.22375 -0.7075 -0.3075 0.0925 0.4925 0.7675 1.1675 1.5675 1.9675 3.3175 3.7175 4.1175 4.5175 5.00875IP3CA8RB -1.44 -1.04 -0.64 -0.24 0.27625 0.7675 1.1675 1.5675 1.9675 3.3175 3.7175 4.1175 4.5175 5.00875
Injector Position/ Chamber Arrangement Identifier
Axial Distance from Injector Face to Heat Flux Sensor (inches)
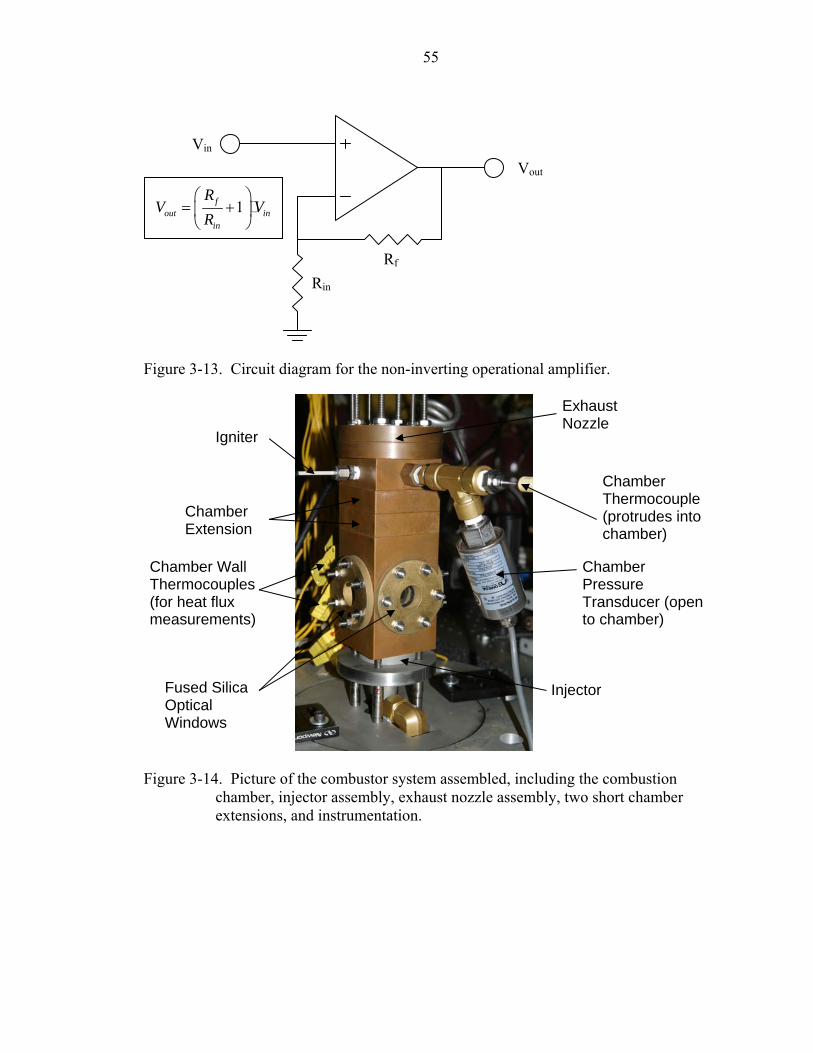
55
Figure 3-13. Circuit diagram for the non-inverting operational amplifier.
Figure 3-14. Picture of the combustor system assembled, including the combustion
chamber, injector assembly, exhaust nozzle assembly, two short chamber extensions, and instrumentation.
Vin Vout
Rf Rin
1fout in
in
RV V
R⎛ ⎞
= +⎜ ⎟⎝ ⎠
Fused Silica Optical Windows
Injector
Exhaust Nozzle
Igniter
Chamber Extension
Chamber Thermocouple (protrudes into chamber)
Chamber Pressure Transducer (open to chamber)
Chamber Wall Thermocouples (for heat flux measurements)

56
Figure 3-15. HPCF Control Interface front panel (Labview GUI). Numbers referenced to Table 3-2.
1
2
3
4
5
6
7
8
9
10 11 17
12
16
18
19
14
15
13
20
21
22
23
24
25
26
27
28
29
30
31
32
33
34
35
36
37
38
39
40
41
42
43
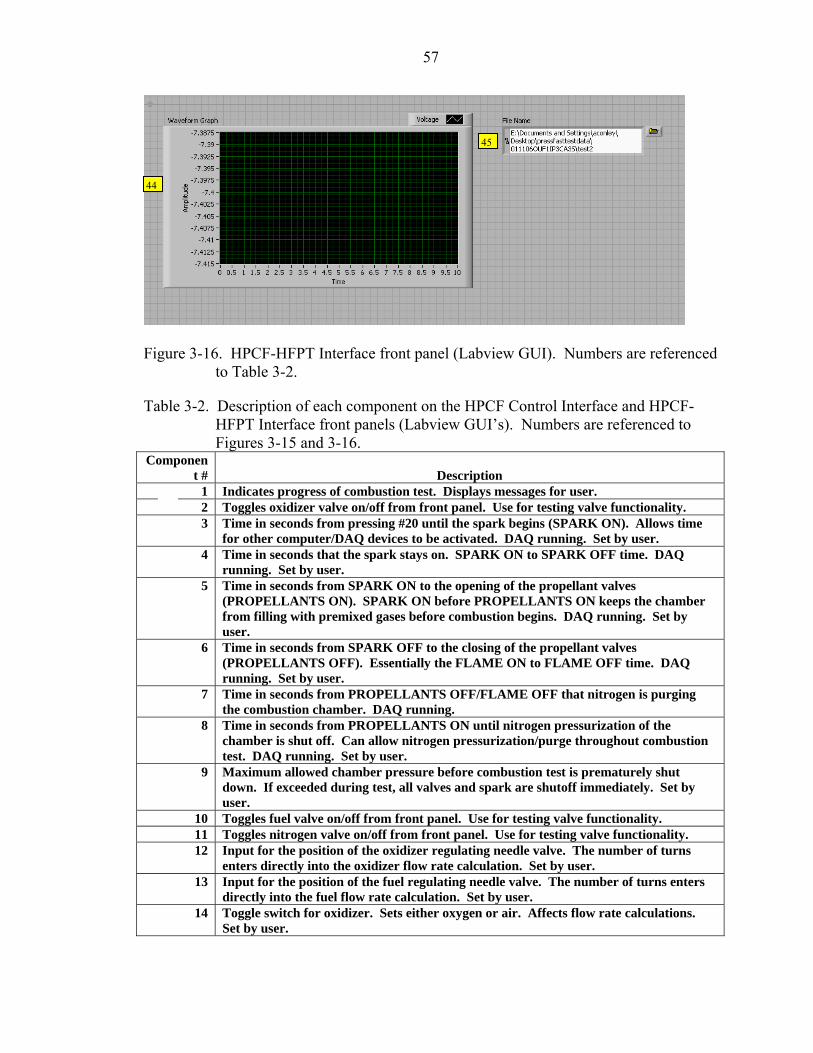
57
Figure 3-16. HPCF-HFPT Interface front panel (Labview GUI). Numbers are referenced
to Table 3-2.
Table 3-2. Description of each component on the HPCF Control Interface and HPCF-HFPT Interface front panels (Labview GUI’s). Numbers are referenced to Figures 3-15 and 3-16.
Component # Description
1 Indicates progress of combustion test. Displays messages for user. 2 Toggles oxidizer valve on/off from front panel. Use for testing valve functionality. 3 Time in seconds from pressing #20 until the spark begins (SPARK ON). Allows time
for other computer/DAQ devices to be activated. DAQ running. Set by user. 4 Time in seconds that the spark stays on. SPARK ON to SPARK OFF time. DAQ
running. Set by user. 5 Time in seconds from SPARK ON to the opening of the propellant valves
(PROPELLANTS ON). SPARK ON before PROPELLANTS ON keeps the chamber from filling with premixed gases before combustion begins. DAQ running. Set by user.
6 Time in seconds from SPARK OFF to the closing of the propellant valves (PROPELLANTS OFF). Essentially the FLAME ON to FLAME OFF time. DAQ running. Set by user.
7 Time in seconds from PROPELLANTS OFF/FLAME OFF that nitrogen is purging the combustion chamber. DAQ running.
8 Time in seconds from PROPELLANTS ON until nitrogen pressurization of the chamber is shut off. Can allow nitrogen pressurization/purge throughout combustion test. DAQ running. Set by user.
9 Maximum allowed chamber pressure before combustion test is prematurely shut down. If exceeded during test, all valves and spark are shutoff immediately. Set by user.
10 Toggles fuel valve on/off from front panel. Use for testing valve functionality. 11 Toggles nitrogen valve on/off from front panel. Use for testing valve functionality. 12 Input for the position of the oxidizer regulating needle valve. The number of turns
enters directly into the oxidizer flow rate calculation. Set by user. 13 Input for the position of the fuel regulating needle valve. The number of turns enters
directly into the fuel flow rate calculation. Set by user. 14 Toggle switch for oxidizer. Sets either oxygen or air. Affects flow rate calculations.
Set by user.
44
45

58
Table 3-2. Continued 15 Toggles nitrogen pressurization on/off. Allows the chamber to be pre-pressurized with
nitrogen, beginning 3 seconds before SPARK ON and lasting until the number of seconds beyond PROPELLANTS ON as set by #8. Set by user.
16 Toggles nitrogen purge at PROPELLANTS/FLAME OFF on/off. Set by user. 17 Toggles spark on/off from front panel. Use for testing spark functionality. 18 Active monitor of chamber temperature (thermocouple open to chamber environment,
Celsius) during front panel and combustion tests. Easy recognition of successful combustion.
19 Active monitor of chamber pressure (psig) during combustion tests only. 20 Turns combustion test on/off. Once pressed, a predefined combustion test will proceed
from beginning to end unless ended prematurely by user or exceeding of maximum chamber pressure. User controlled. If user ended and nitrogen purge is set to ON position, the chamber will purge with nitrogen before front panel operation resumes.
21 Indicator light for oxidizer valve operation. 22 Indicator light for fuel valve operation. 23 Indicator light for spark operation. 24 Indicator light for nitrogen pressurization of the chamber. 25 Indicator light for nitrogen purging. 26 Numerical indicator of chamber temperature (Celsius). 27 Numerical indicator of chamber pressure (psig). TARE button allows atmospheric
condition to be set to 0 psig by activating an offset value. 28 Numerical indicator of oxidizer line pressure (psig) before the needle valve. TARE
button allows atmospheric condition to be set to 0 psig by activating an offset value. 29 Numerical indicator of fuel line pressure (psig) before the needle valve. TARE button
allows atmospheric condition to be set to 0 psig by activating an offset value. 30 Numerical indicator for oxidizer mass flow rate (g/s). 31 Numerical indicator for fuel mass flow rate (g/s). 32 Numerical indicator for oxidizer/fuel mass flow ratio. 33 Numerical indicator for equivalence ratio. 34 File path for combustion test data save. Data is automatically saved to set file path at
the end of each combustion test. Set by user. 35 Calibration slope for chamber pressure transducer. Set by user from periodic
calibrations. 36 Calibration slope for oxidizer pressure transducer. Set by user from periodic
calibrations. 37 Calibration slope for fuel pressure transducer. Set by user from periodic calibrations. 38 Selector for fuel regulating needle valve in operation. Allows high degree of control at
a large range of desired flow rates. Choice affects Cv calibration curve. Set by user. 39 Selector for oxidizer regulating needle valve in operation. Allows high degree of
control at a large range of desired flow rates. Choice affects Cv calibration curve. Set by user.
40 Emergency shutoff of HPCF. Can be pressed at any time to shutdown all valves and spark, no matter what settings are in place. Data will lost if pressed. User controlled.
41 Allows user to identify which thermocouple channels are being used for DAQ. Eliminates unused channels from contaminating used channels. Set by user.
42 Scan rate for temperature, pressure, and heat flux data in Hz. Set by user. 43 Number of samples averaged for each data point. 44 Displays high-frequency pressure transducer data after a combustion test. 45 File path for high-frequency pressure transducer combustion test data save. Data is
automatically saved to set file path at end of each combustion test. Set by user.
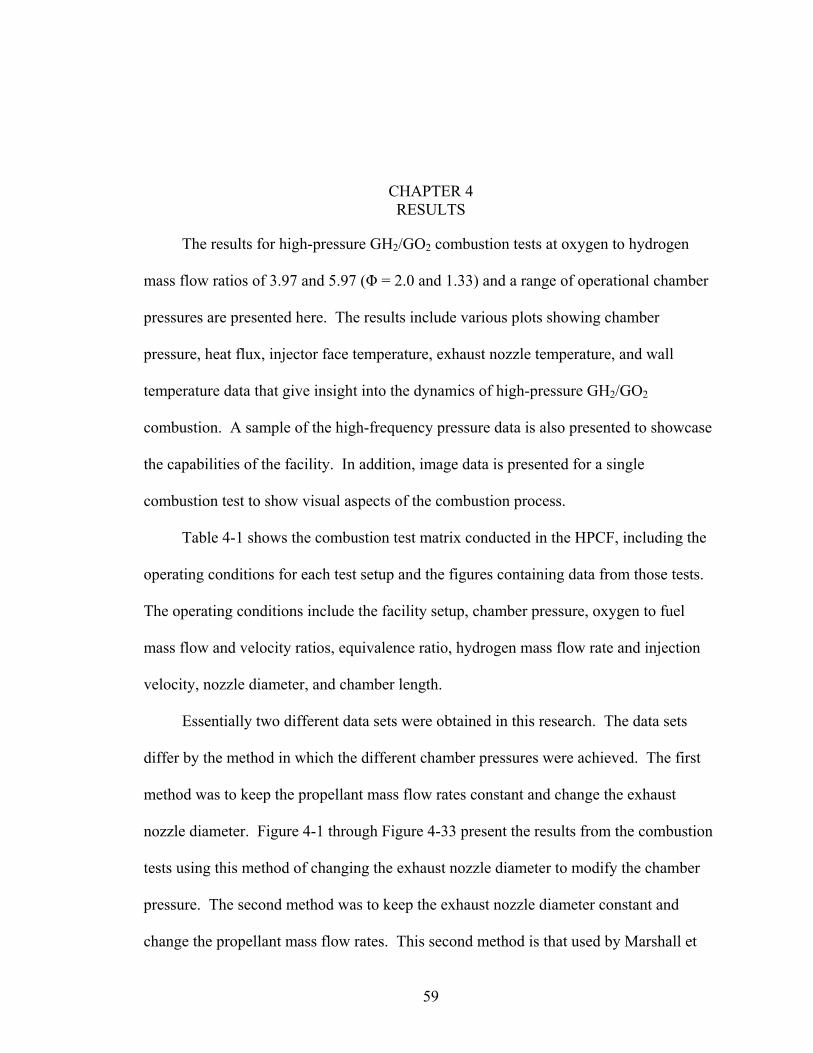
59
CHAPTER 4 RESULTS
The results for high-pressure GH2/GO2 combustion tests at oxygen to hydrogen
mass flow ratios of 3.97 and 5.97 (Φ = 2.0 and 1.33) and a range of operational chamber
pressures are presented here. The results include various plots showing chamber
pressure, heat flux, injector face temperature, exhaust nozzle temperature, and wall
temperature data that give insight into the dynamics of high-pressure GH2/GO2
combustion. A sample of the high-frequency pressure data is also presented to showcase
the capabilities of the facility. In addition, image data is presented for a single
combustion test to show visual aspects of the combustion process.
Table 4-1 shows the combustion test matrix conducted in the HPCF, including the
operating conditions for each test setup and the figures containing data from those tests.
The operating conditions include the facility setup, chamber pressure, oxygen to fuel
mass flow and velocity ratios, equivalence ratio, hydrogen mass flow rate and injection
velocity, nozzle diameter, and chamber length.
Essentially two different data sets were obtained in this research. The data sets
differ by the method in which the different chamber pressures were achieved. The first
method was to keep the propellant mass flow rates constant and change the exhaust
nozzle diameter. Figure 4-1 through Figure 4-33 present the results from the combustion
tests using this method of changing the exhaust nozzle diameter to modify the chamber
pressure. The second method was to keep the exhaust nozzle diameter constant and
change the propellant mass flow rates. This second method is that used by Marshall et

60
al.3 Figure 4-35 through Figure 4-38 present the results from the combustion tests using
this method of changing the propellant mass flow rates to modify the chamber pressure.
Furthermore, both data sets (data from both methods of modifying the chamber
pressure) were analyzed using the two different heat flux equations presented in Chapter
2, namely Equation 2-15 for the steady state heat flux calculation and Equation 2-16 for
the steady state heat flux plus heat absorption calculation. If the figure presents heat flux
values, the caption will indicate which heat flux equation was used in the calculations.
Discussion of these results occurs in Chapter 5.
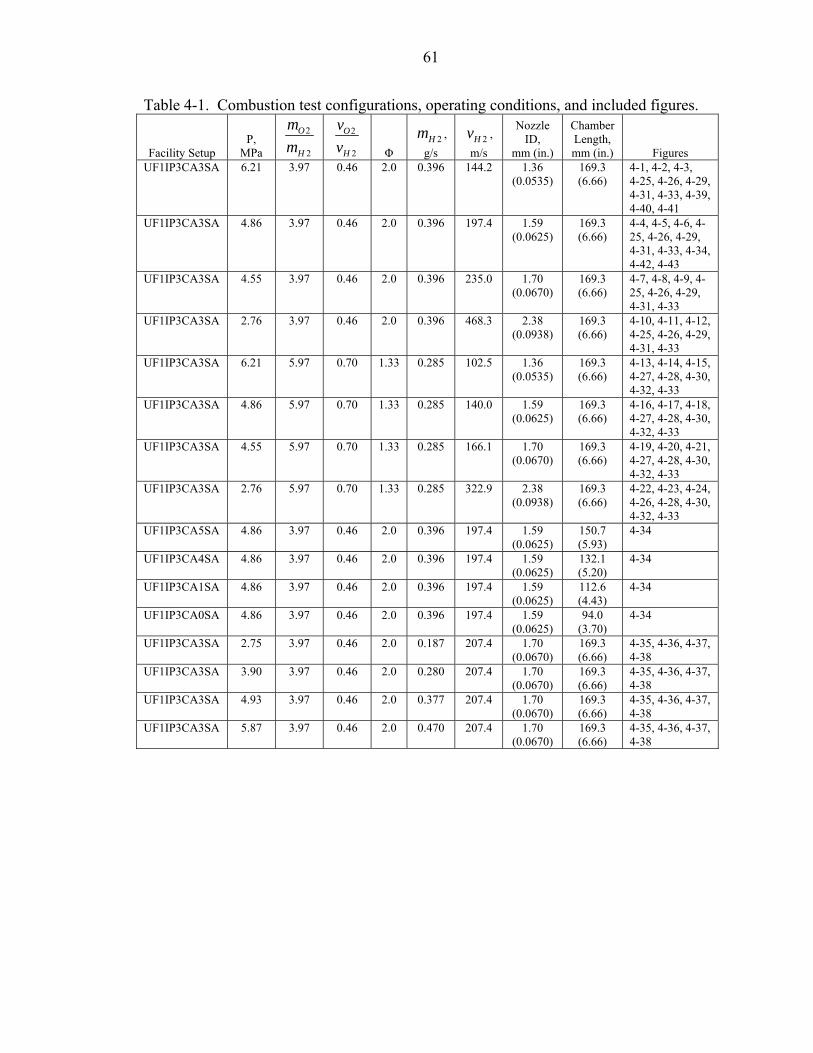
61
Table 4-1. Combustion test configurations, operating conditions, and included figures.
Facility Setup P,
MPa
2
2
O
H
mm
2
2
O
H
vv
Φ
2Hm , g/s
2Hv , m/s
Nozzle ID,
mm (in.)
Chamber Length, mm (in.) Figures
UF1IP3CA3SA 6.21 3.97 0.46 2.0 0.396 144.2 1.36 (0.0535)
169.3 (6.66)
4-1, 4-2, 4-3, 4-25, 4-26, 4-29, 4-31, 4-33, 4-39, 4-40, 4-41
UF1IP3CA3SA 4.86 3.97 0.46 2.0 0.396 197.4 1.59 (0.0625)
169.3 (6.66)
4-4, 4-5, 4-6, 4-25, 4-26, 4-29, 4-31, 4-33, 4-34, 4-42, 4-43
UF1IP3CA3SA 4.55 3.97 0.46 2.0 0.396 235.0 1.70 (0.0670)
169.3 (6.66)
4-7, 4-8, 4-9, 4-25, 4-26, 4-29, 4-31, 4-33
UF1IP3CA3SA 2.76 3.97 0.46 2.0 0.396 468.3 2.38 (0.0938)
169.3 (6.66)
4-10, 4-11, 4-12, 4-25, 4-26, 4-29, 4-31, 4-33
UF1IP3CA3SA 6.21 5.97 0.70 1.33 0.285 102.5 1.36 (0.0535)
169.3 (6.66)
4-13, 4-14, 4-15, 4-27, 4-28, 4-30, 4-32, 4-33
UF1IP3CA3SA 4.86 5.97 0.70 1.33 0.285 140.0 1.59 (0.0625)
169.3 (6.66)
4-16, 4-17, 4-18, 4-27, 4-28, 4-30, 4-32, 4-33
UF1IP3CA3SA 4.55 5.97 0.70 1.33 0.285 166.1 1.70 (0.0670)
169.3 (6.66)
4-19, 4-20, 4-21, 4-27, 4-28, 4-30, 4-32, 4-33
UF1IP3CA3SA 2.76 5.97 0.70 1.33 0.285 322.9 2.38 (0.0938)
169.3 (6.66)
4-22, 4-23, 4-24, 4-26, 4-28, 4-30, 4-32, 4-33
UF1IP3CA5SA 4.86 3.97 0.46 2.0 0.396 197.4 1.59 (0.0625)
150.7 (5.93)
4-34
UF1IP3CA4SA 4.86 3.97 0.46 2.0 0.396 197.4 1.59 (0.0625)
132.1 (5.20)
4-34
UF1IP3CA1SA 4.86 3.97 0.46 2.0 0.396 197.4 1.59 (0.0625)
112.6 (4.43)
4-34
UF1IP3CA0SA 4.86 3.97 0.46 2.0 0.396 197.4 1.59 (0.0625)
94.0 (3.70)
4-34
UF1IP3CA3SA 2.75 3.97 0.46 2.0 0.187 207.4 1.70 (0.0670)
169.3 (6.66)
4-35, 4-36, 4-37, 4-38
UF1IP3CA3SA 3.90 3.97 0.46 2.0 0.280 207.4 1.70 (0.0670)
169.3 (6.66)
4-35, 4-36, 4-37, 4-38
UF1IP3CA3SA 4.93 3.97 0.46 2.0 0.377 207.4 1.70 (0.0670)
169.3 (6.66)
4-35, 4-36, 4-37, 4-38
UF1IP3CA3SA 5.87 3.97 0.46 2.0 0.470 207.4 1.70 (0.0670)
169.3 (6.66)
4-35, 4-36, 4-37, 4-38
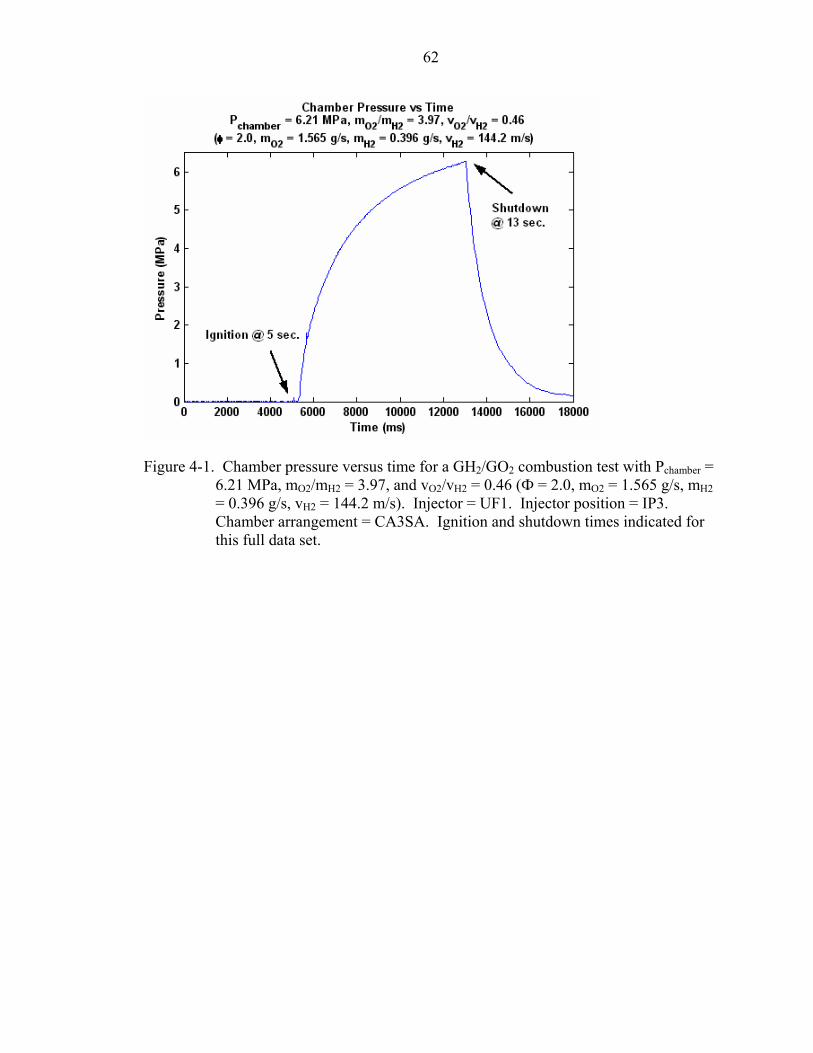
62
Figure 4-1. Chamber pressure versus time for a GH2/GO2 combustion test with Pchamber =
6.21 MPa, mO2/mH2 = 3.97, and vO2/vH2 = 0.46 (Ф = 2.0, mO2 = 1.565 g/s, mH2 = 0.396 g/s, vH2 = 144.2 m/s). Injector = UF1. Injector position = IP3. Chamber arrangement = CA3SA. Ignition and shutdown times indicated for this full data set.
63
Figure 4-2. Heat flux versus time for a GH2/GO2 combustion test with Pchamber = 6.21
MPa, mO2/mH2 = 3.97, and vO2/vH2 = 0.46 (Ф = 2.0, mO2 = 1.565 g/s, mH2 = 0.396 g/s, vH2 = 144.2 m/s). Injector = UF1. Injector position = IP3. Chamber arrangement = CA3SA. Legend indicates distance from injector face to heat flux sensor. Ignition and shutdown times indicated for this full data set. Heat flux calculations performed using steady state heat flux equation (Equation 2-15).
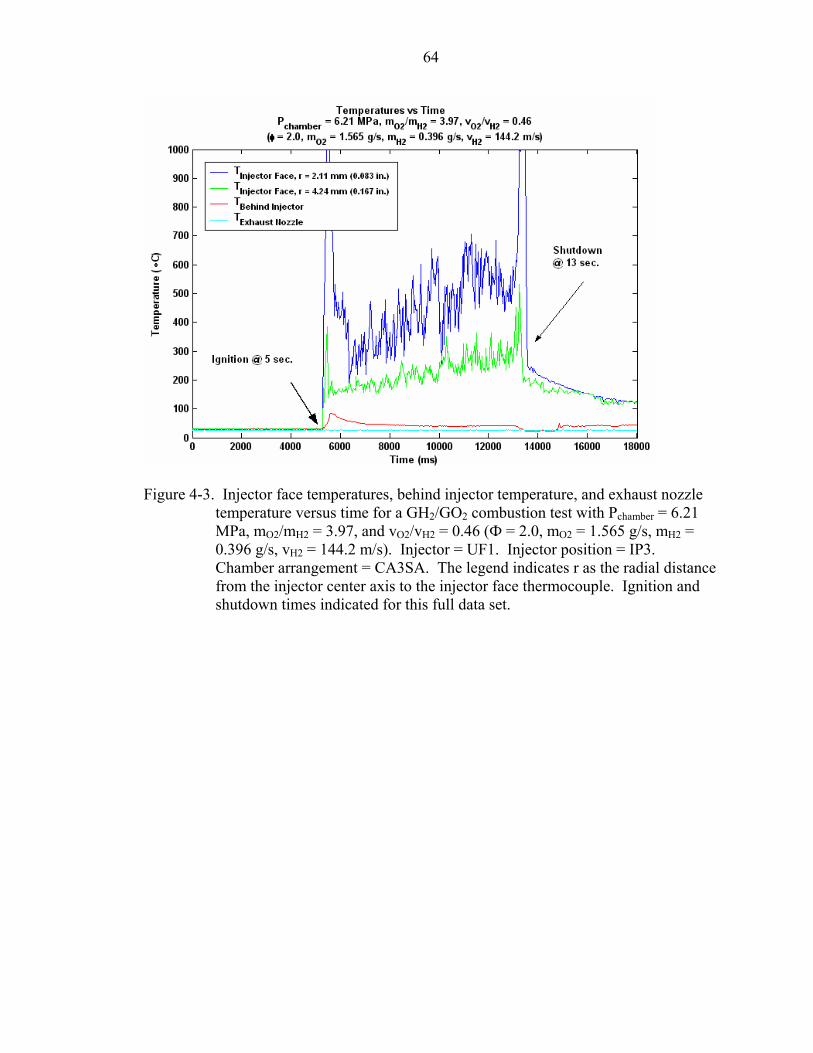
64
Figure 4-3. Injector face temperatures, behind injector temperature, and exhaust nozzle
temperature versus time for a GH2/GO2 combustion test with Pchamber = 6.21 MPa, mO2/mH2 = 3.97, and vO2/vH2 = 0.46 (Ф = 2.0, mO2 = 1.565 g/s, mH2 = 0.396 g/s, vH2 = 144.2 m/s). Injector = UF1. Injector position = IP3. Chamber arrangement = CA3SA. The legend indicates r as the radial distance from the injector center axis to the injector face thermocouple. Ignition and shutdown times indicated for this full data set.

65
Figure 4-4. Chamber pressure versus time for a GH2/GO2 combustion test with Pchamber =
4.86 MPa, mO2/mH2 = 3.97, and vO2/vH2 = 0.46 (Ф = 2.0, mO2 = 1.565 g/s, mH2 = 0.396 g/s, vH2 = 197.4 m/s). Injector = UF1. Injector position = IP3. Chamber arrangement = CA3SA.
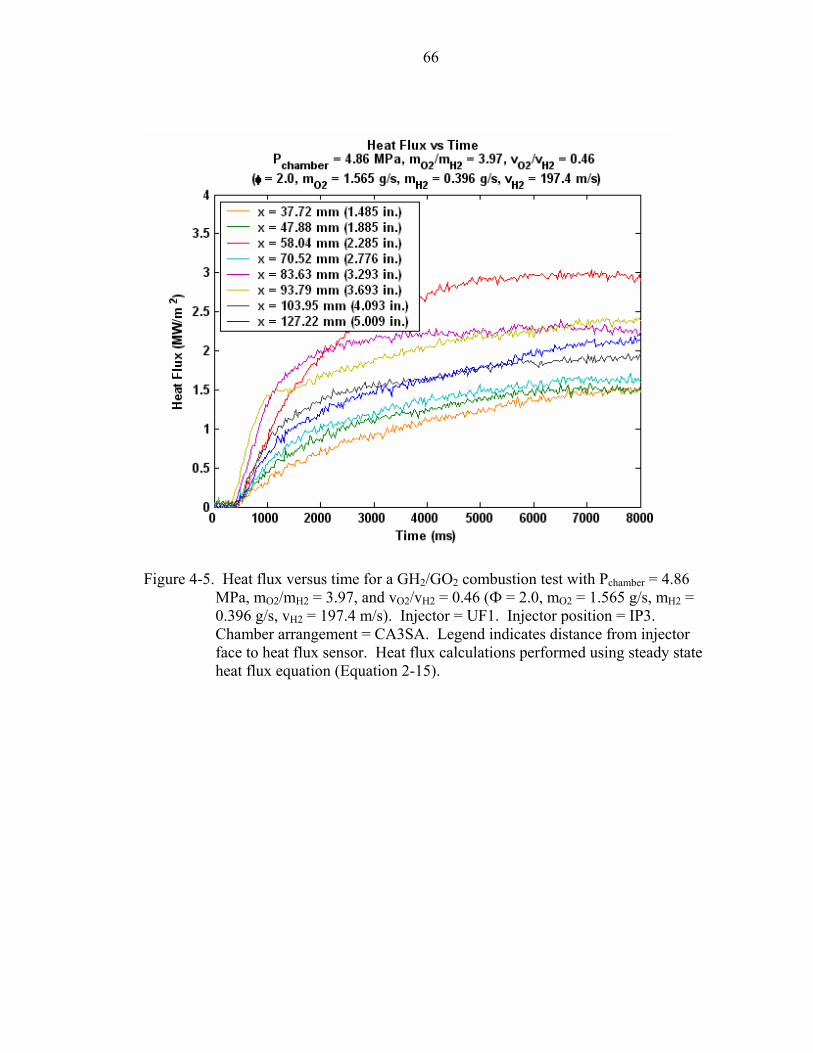
66
Figure 4-5. Heat flux versus time for a GH2/GO2 combustion test with Pchamber = 4.86
MPa, mO2/mH2 = 3.97, and vO2/vH2 = 0.46 (Ф = 2.0, mO2 = 1.565 g/s, mH2 = 0.396 g/s, vH2 = 197.4 m/s). Injector = UF1. Injector position = IP3. Chamber arrangement = CA3SA. Legend indicates distance from injector face to heat flux sensor. Heat flux calculations performed using steady state heat flux equation (Equation 2-15).
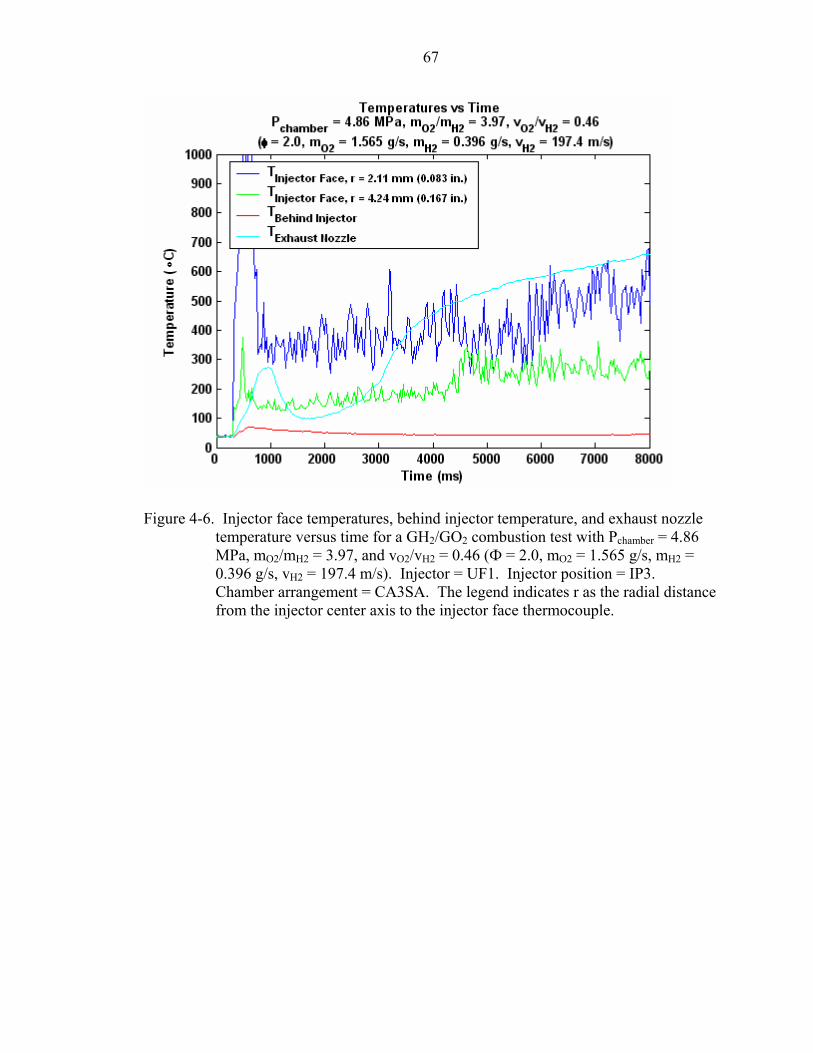
67
Figure 4-6. Injector face temperatures, behind injector temperature, and exhaust nozzle
temperature versus time for a GH2/GO2 combustion test with Pchamber = 4.86 MPa, mO2/mH2 = 3.97, and vO2/vH2 = 0.46 (Ф = 2.0, mO2 = 1.565 g/s, mH2 = 0.396 g/s, vH2 = 197.4 m/s). Injector = UF1. Injector position = IP3. Chamber arrangement = CA3SA. The legend indicates r as the radial distance from the injector center axis to the injector face thermocouple.
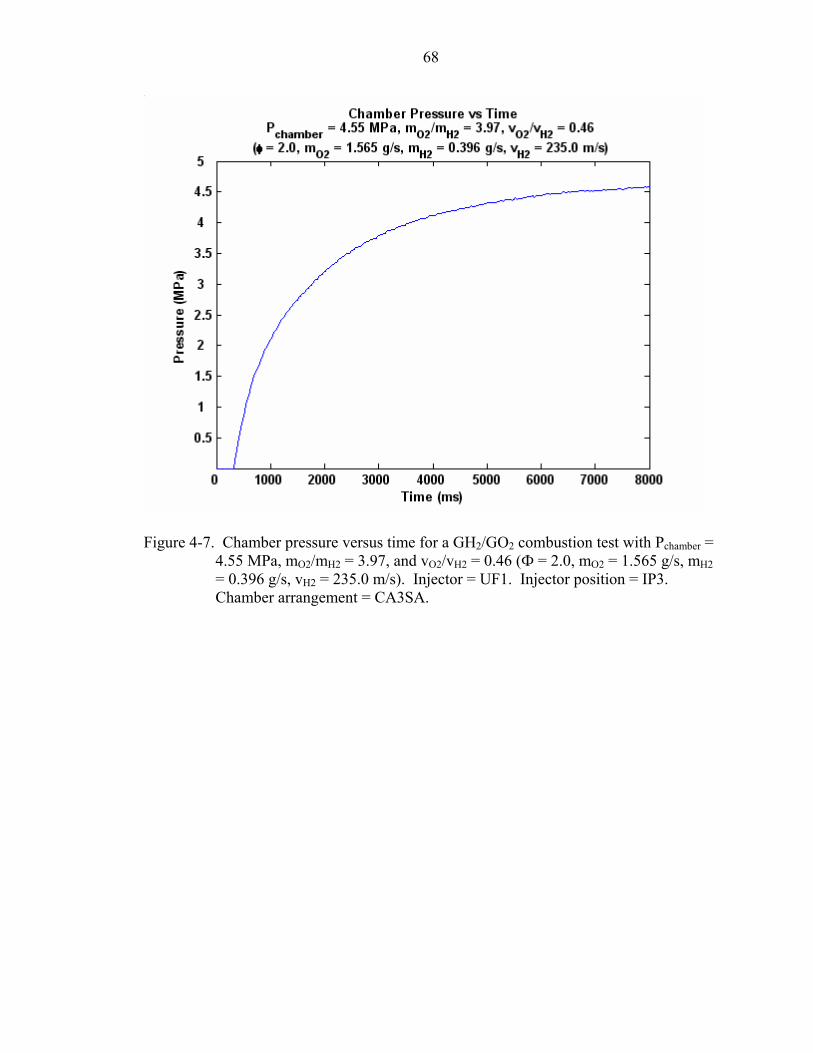
68
Figure 4-7. Chamber pressure versus time for a GH2/GO2 combustion test with Pchamber =
4.55 MPa, mO2/mH2 = 3.97, and vO2/vH2 = 0.46 (Ф = 2.0, mO2 = 1.565 g/s, mH2 = 0.396 g/s, vH2 = 235.0 m/s). Injector = UF1. Injector position = IP3. Chamber arrangement = CA3SA.
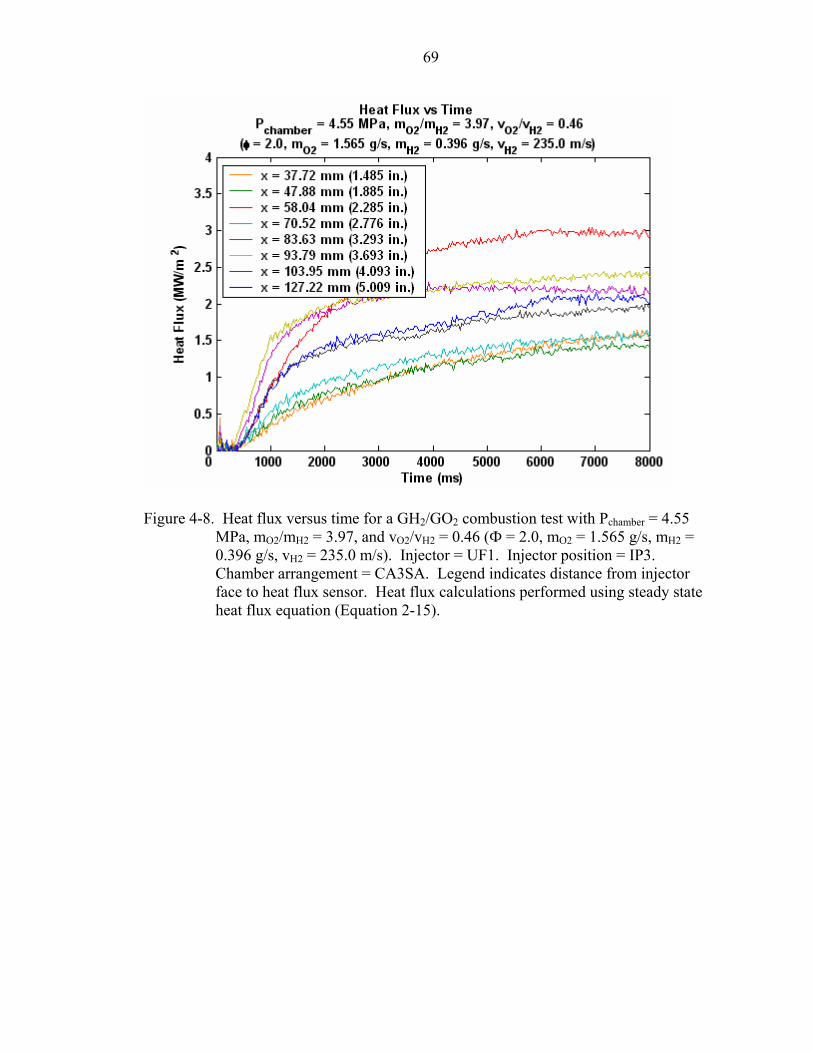
69
Figure 4-8. Heat flux versus time for a GH2/GO2 combustion test with Pchamber = 4.55
MPa, mO2/mH2 = 3.97, and vO2/vH2 = 0.46 (Ф = 2.0, mO2 = 1.565 g/s, mH2 = 0.396 g/s, vH2 = 235.0 m/s). Injector = UF1. Injector position = IP3. Chamber arrangement = CA3SA. Legend indicates distance from injector face to heat flux sensor. Heat flux calculations performed using steady state heat flux equation (Equation 2-15).
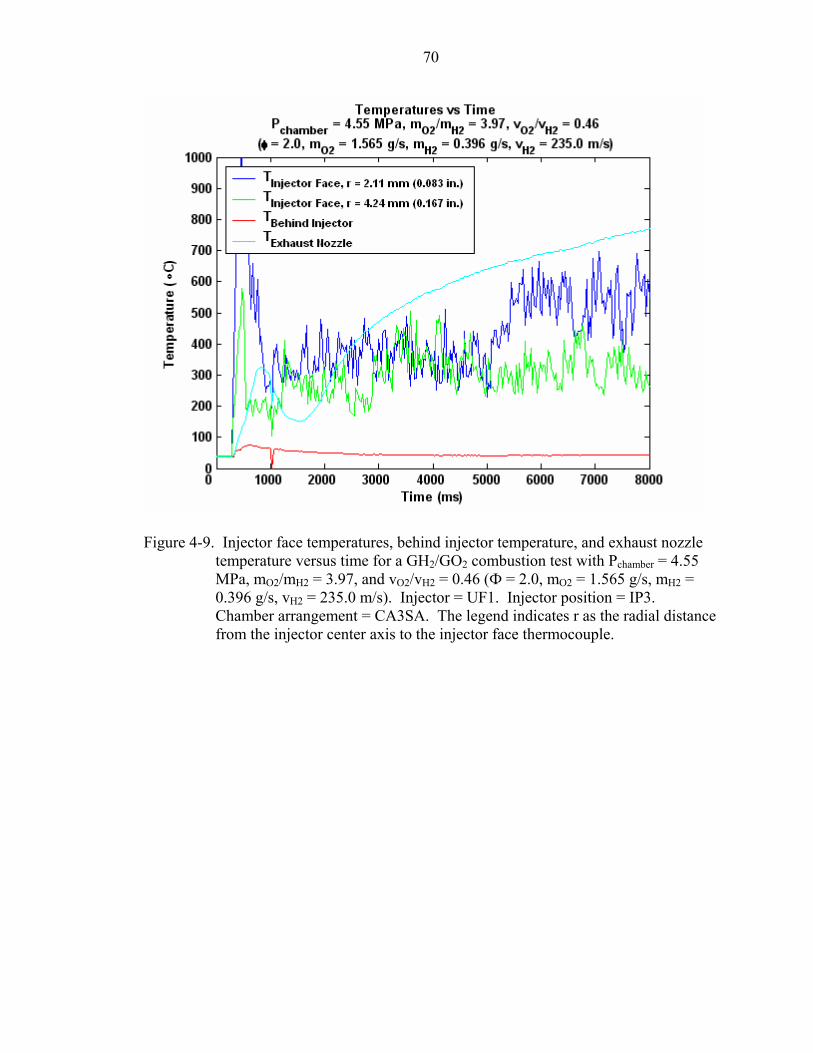
70
Figure 4-9. Injector face temperatures, behind injector temperature, and exhaust nozzle
temperature versus time for a GH2/GO2 combustion test with Pchamber = 4.55 MPa, mO2/mH2 = 3.97, and vO2/vH2 = 0.46 (Ф = 2.0, mO2 = 1.565 g/s, mH2 = 0.396 g/s, vH2 = 235.0 m/s). Injector = UF1. Injector position = IP3. Chamber arrangement = CA3SA. The legend indicates r as the radial distance from the injector center axis to the injector face thermocouple.
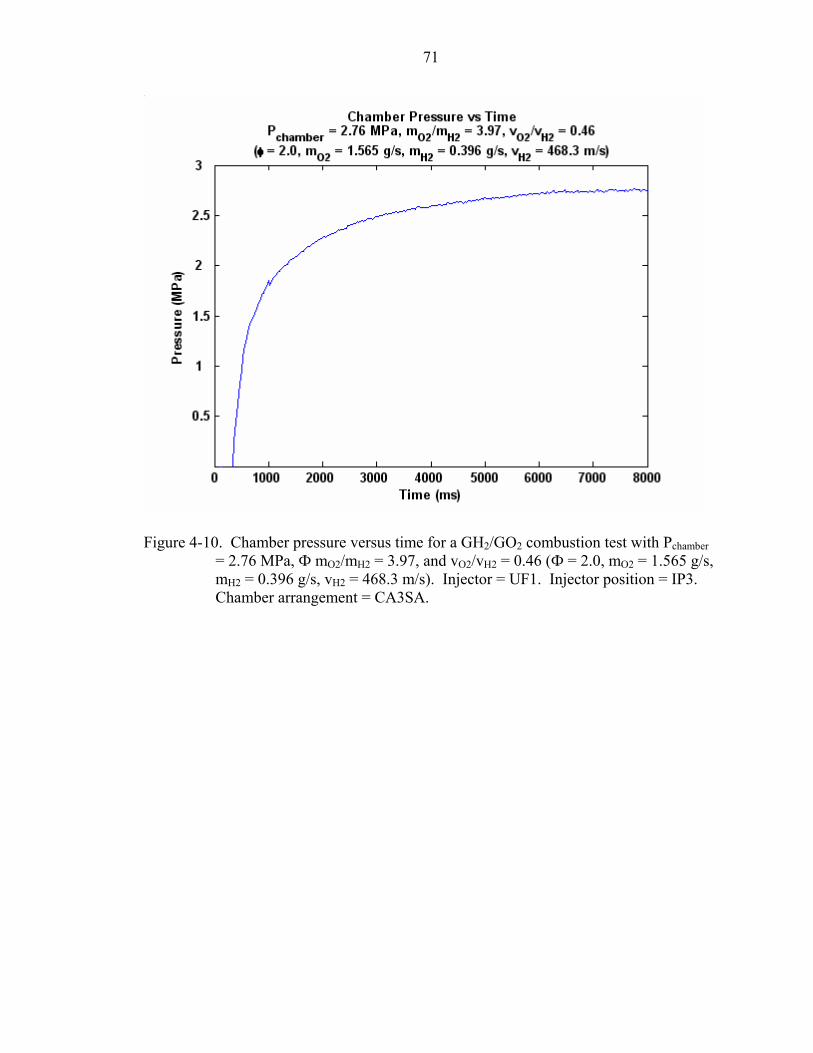
71
Figure 4-10. Chamber pressure versus time for a GH2/GO2 combustion test with Pchamber
= 2.76 MPa, Ф mO2/mH2 = 3.97, and vO2/vH2 = 0.46 (Ф = 2.0, mO2 = 1.565 g/s, mH2 = 0.396 g/s, vH2 = 468.3 m/s). Injector = UF1. Injector position = IP3. Chamber arrangement = CA3SA.
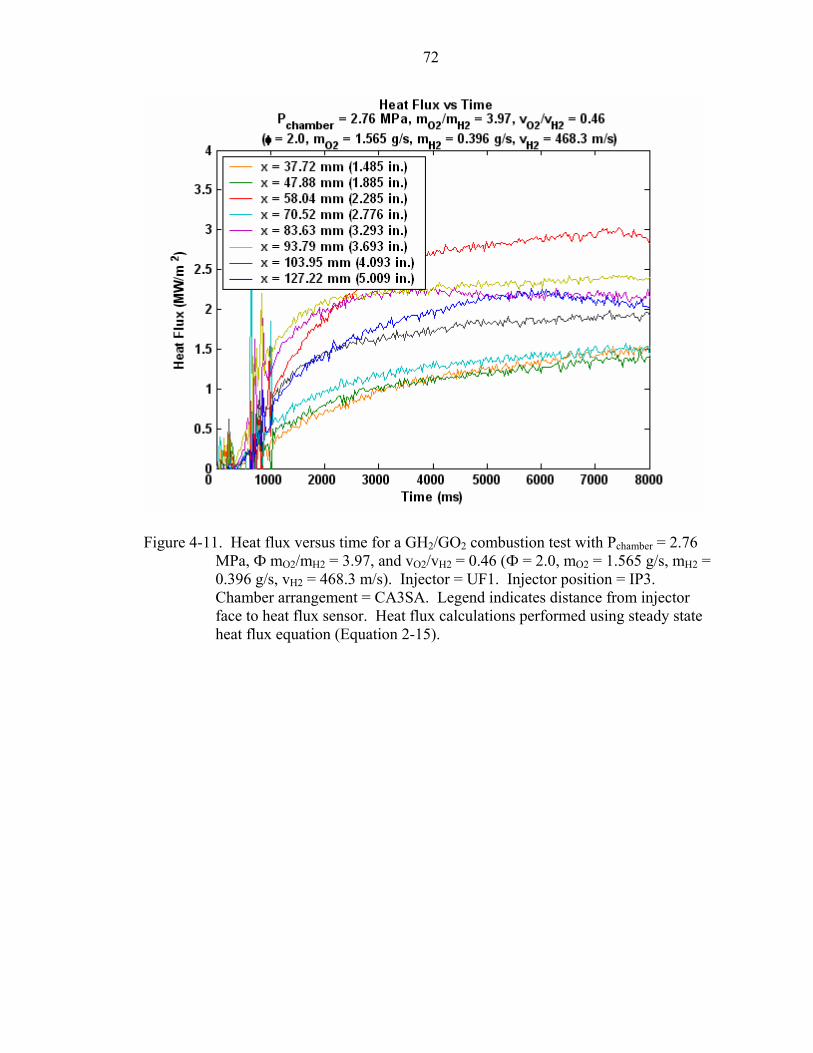
72
Figure 4-11. Heat flux versus time for a GH2/GO2 combustion test with Pchamber = 2.76
MPa, Ф mO2/mH2 = 3.97, and vO2/vH2 = 0.46 (Ф = 2.0, mO2 = 1.565 g/s, mH2 = 0.396 g/s, vH2 = 468.3 m/s). Injector = UF1. Injector position = IP3. Chamber arrangement = CA3SA. Legend indicates distance from injector face to heat flux sensor. Heat flux calculations performed using steady state heat flux equation (Equation 2-15).

73
Figure 4-12. Injector face temperatures, behind injector temperature, and exhaust nozzle
temperature versus time for a GH2/GO2 combustion test with Pchamber = 2.76 MPa, mO2/mH2 = 3.97, and vO2/vH2 = 0.46 (Ф = 2.0, mO2 = 1.565 g/s, mH2 = 0.396 g/s, vH2 = 468.3 m/s). Injector = UF1. Injector position = IP3. Chamber arrangement = CA3SA. The legend indicates r as the radial distance from the injector center axis to the injector face thermocouple.

74
Figure 4-13. Chamber pressure versus time for a GH2/GO2 combustion test with Pchamber
= 6.21 MPa, mO2/mH2 = 5.97, and vO2/vH2 = 0.70 (Ф = 1.33, mO2 = 1.693 g/s, mH2 = 0.285 g/s, vH2 = 102.5 m/s). Injector = UF1. Injector position = IP3. Chamber arrangement = CA3SA.
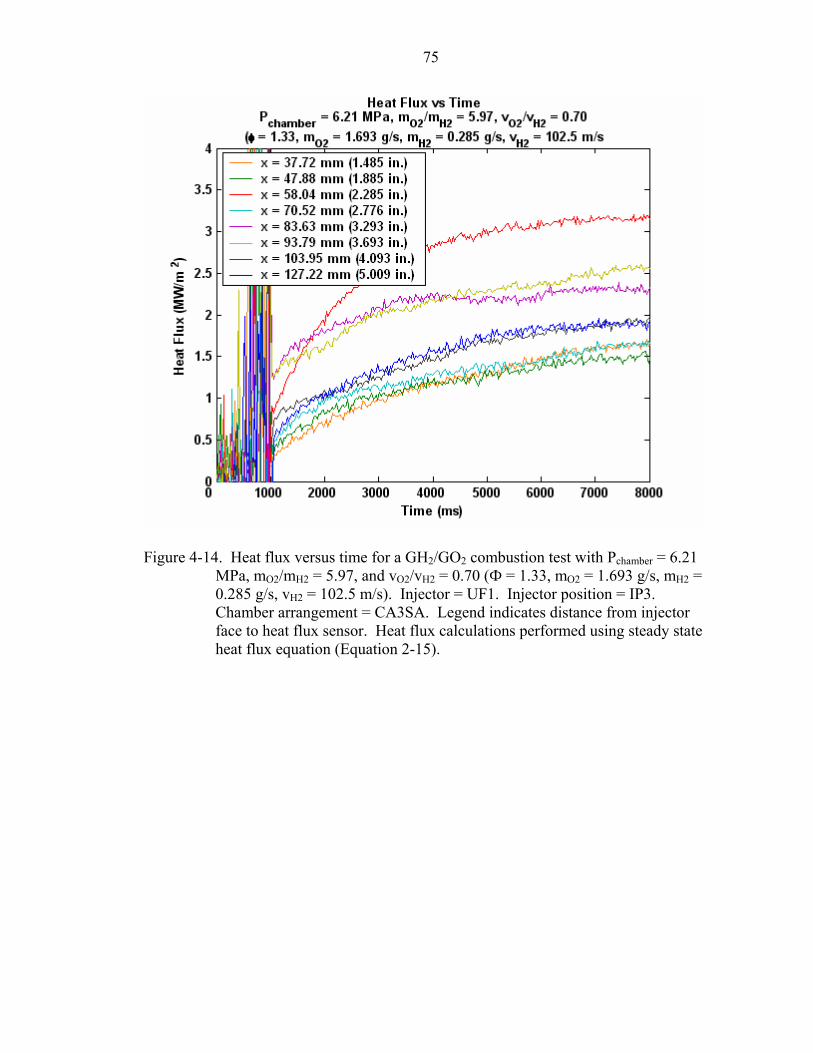
75
Figure 4-14. Heat flux versus time for a GH2/GO2 combustion test with Pchamber = 6.21
MPa, mO2/mH2 = 5.97, and vO2/vH2 = 0.70 (Ф = 1.33, mO2 = 1.693 g/s, mH2 = 0.285 g/s, vH2 = 102.5 m/s). Injector = UF1. Injector position = IP3. Chamber arrangement = CA3SA. Legend indicates distance from injector face to heat flux sensor. Heat flux calculations performed using steady state heat flux equation (Equation 2-15).
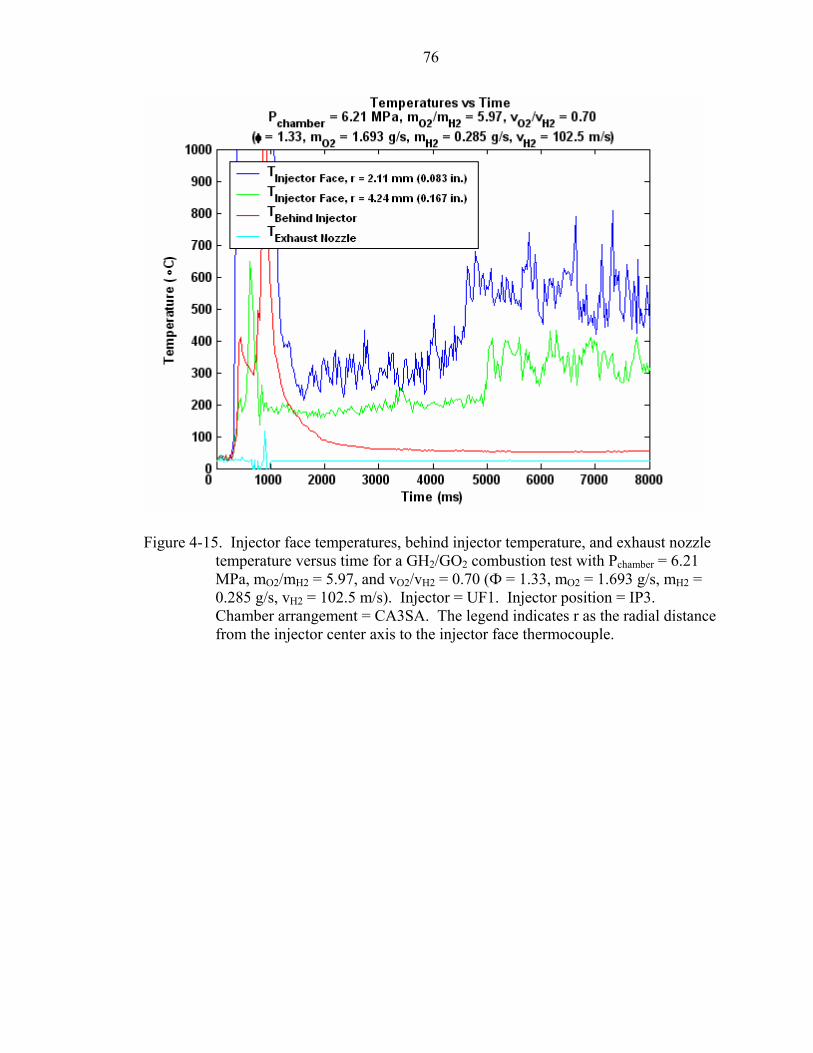
76
Figure 4-15. Injector face temperatures, behind injector temperature, and exhaust nozzle
temperature versus time for a GH2/GO2 combustion test with Pchamber = 6.21 MPa, mO2/mH2 = 5.97, and vO2/vH2 = 0.70 (Ф = 1.33, mO2 = 1.693 g/s, mH2 = 0.285 g/s, vH2 = 102.5 m/s). Injector = UF1. Injector position = IP3. Chamber arrangement = CA3SA. The legend indicates r as the radial distance from the injector center axis to the injector face thermocouple.
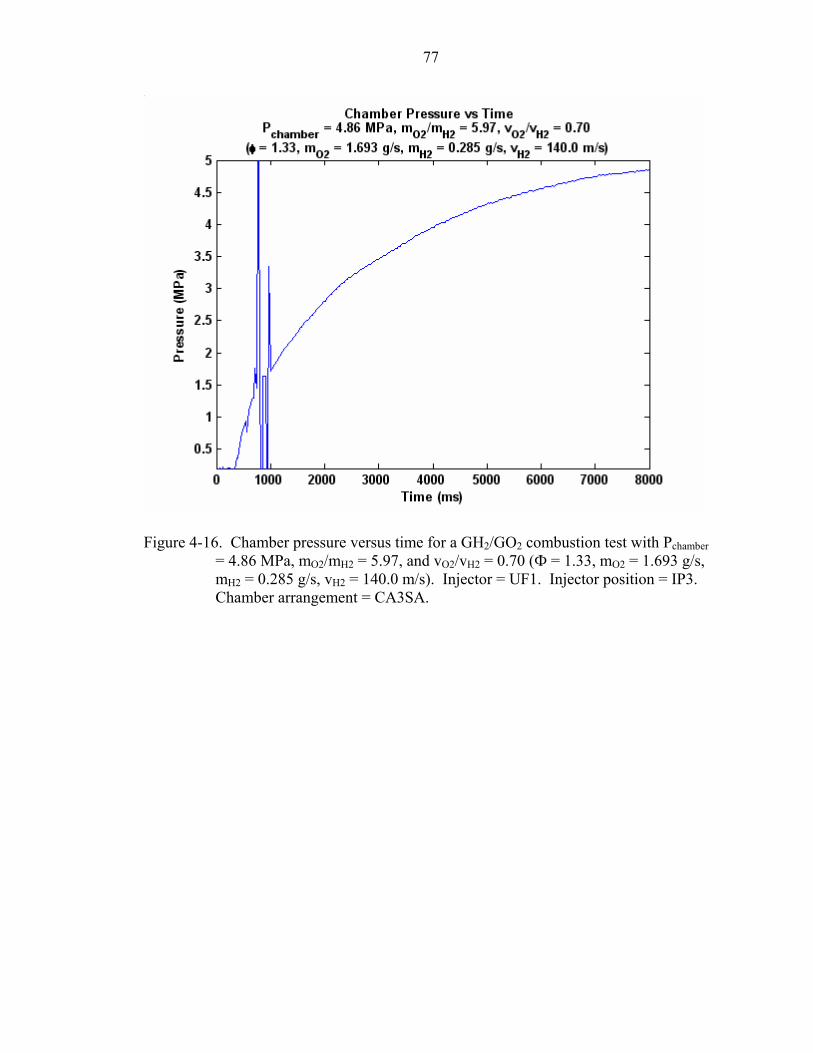
77
Figure 4-16. Chamber pressure versus time for a GH2/GO2 combustion test with Pchamber
= 4.86 MPa, mO2/mH2 = 5.97, and vO2/vH2 = 0.70 (Ф = 1.33, mO2 = 1.693 g/s, mH2 = 0.285 g/s, vH2 = 140.0 m/s). Injector = UF1. Injector position = IP3. Chamber arrangement = CA3SA.
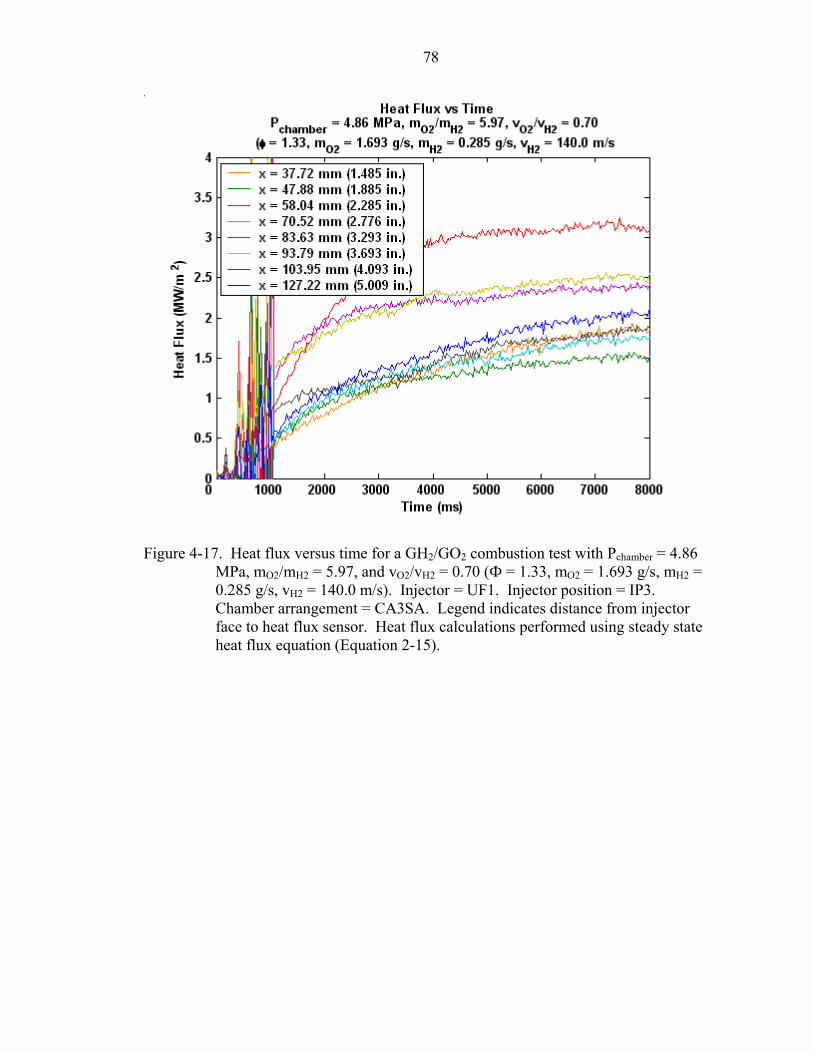
78
Figure 4-17. Heat flux versus time for a GH2/GO2 combustion test with Pchamber = 4.86
MPa, mO2/mH2 = 5.97, and vO2/vH2 = 0.70 (Ф = 1.33, mO2 = 1.693 g/s, mH2 = 0.285 g/s, vH2 = 140.0 m/s). Injector = UF1. Injector position = IP3. Chamber arrangement = CA3SA. Legend indicates distance from injector face to heat flux sensor. Heat flux calculations performed using steady state heat flux equation (Equation 2-15).
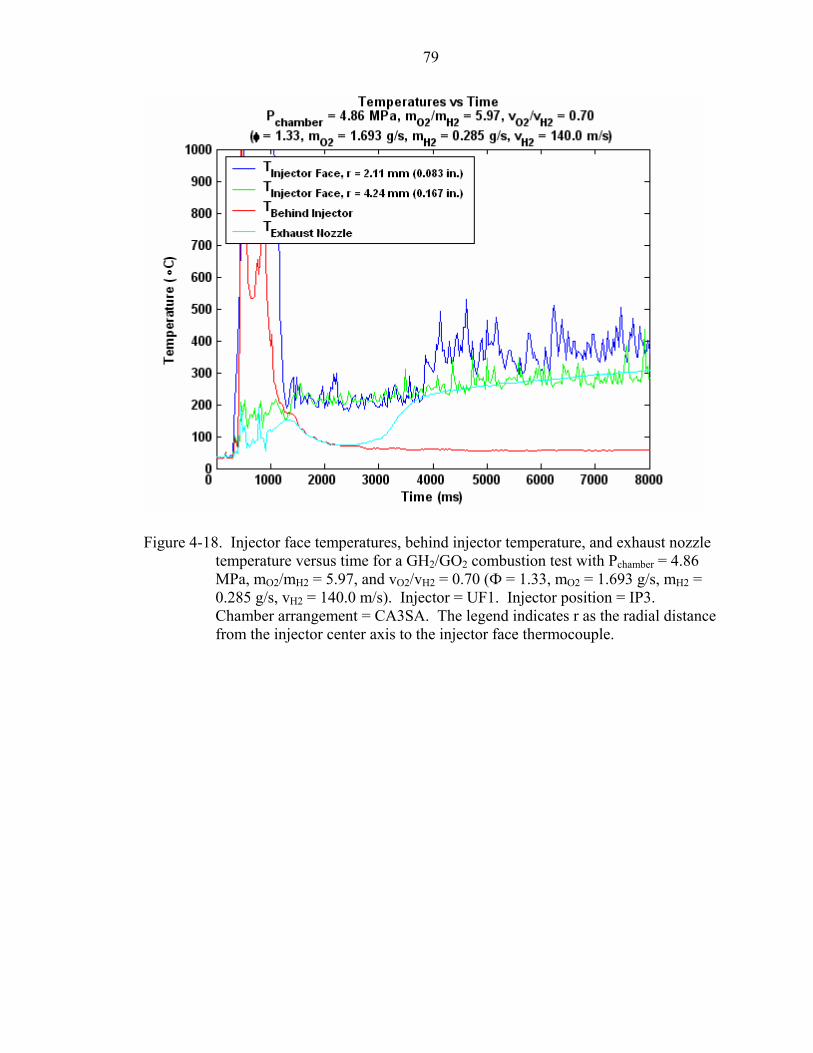
79
Figure 4-18. Injector face temperatures, behind injector temperature, and exhaust nozzle
temperature versus time for a GH2/GO2 combustion test with Pchamber = 4.86 MPa, mO2/mH2 = 5.97, and vO2/vH2 = 0.70 (Ф = 1.33, mO2 = 1.693 g/s, mH2 = 0.285 g/s, vH2 = 140.0 m/s). Injector = UF1. Injector position = IP3. Chamber arrangement = CA3SA. The legend indicates r as the radial distance from the injector center axis to the injector face thermocouple.
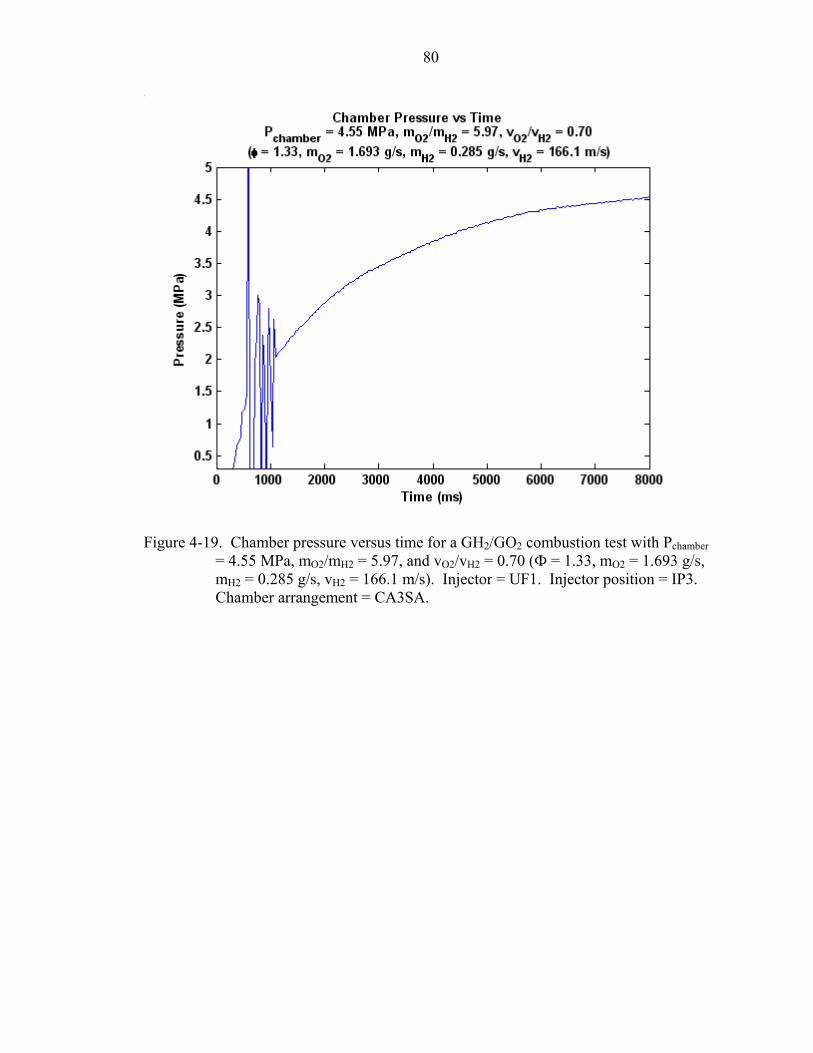
80
Figure 4-19. Chamber pressure versus time for a GH2/GO2 combustion test with Pchamber
= 4.55 MPa, mO2/mH2 = 5.97, and vO2/vH2 = 0.70 (Ф = 1.33, mO2 = 1.693 g/s, mH2 = 0.285 g/s, vH2 = 166.1 m/s). Injector = UF1. Injector position = IP3. Chamber arrangement = CA3SA.

81
Figure 4-20. Heat flux versus time for a GH2/GO2 combustion test with Pchamber = 4.55
MPa, mO2/mH2 = 5.97, and vO2/vH2 = 0.70 (Ф = 1.33, mO2 = 1.693 g/s, mH2 = 0.285 g/s, vH2 = 166.1 m/s). Injector = UF1. Injector position = IP3. Chamber arrangement = CA3SA. Legend indicates distance from injector face to heat flux sensor. Heat flux calculations performed using steady state heat flux equation (Equation 2-15).

82
Figure 4-21. Injector face temperatures, behind injector temperature, and exhaust nozzle
temperature versus time for a GH2/GO2 combustion test with Pchamber = 4.55 MPa, mO2/mH2 = 5.97, and vO2/vH2 = 0.70 (Ф = 1.33, mO2 = 1.693 g/s, mH2 = 0.285 g/s, vH2 = 166.1 m/s). Injector = UF1. Injector position = IP3. Chamber arrangement = CA3SA. The legend indicates r as the radial distance from the injector center axis to the injector face thermocouple.
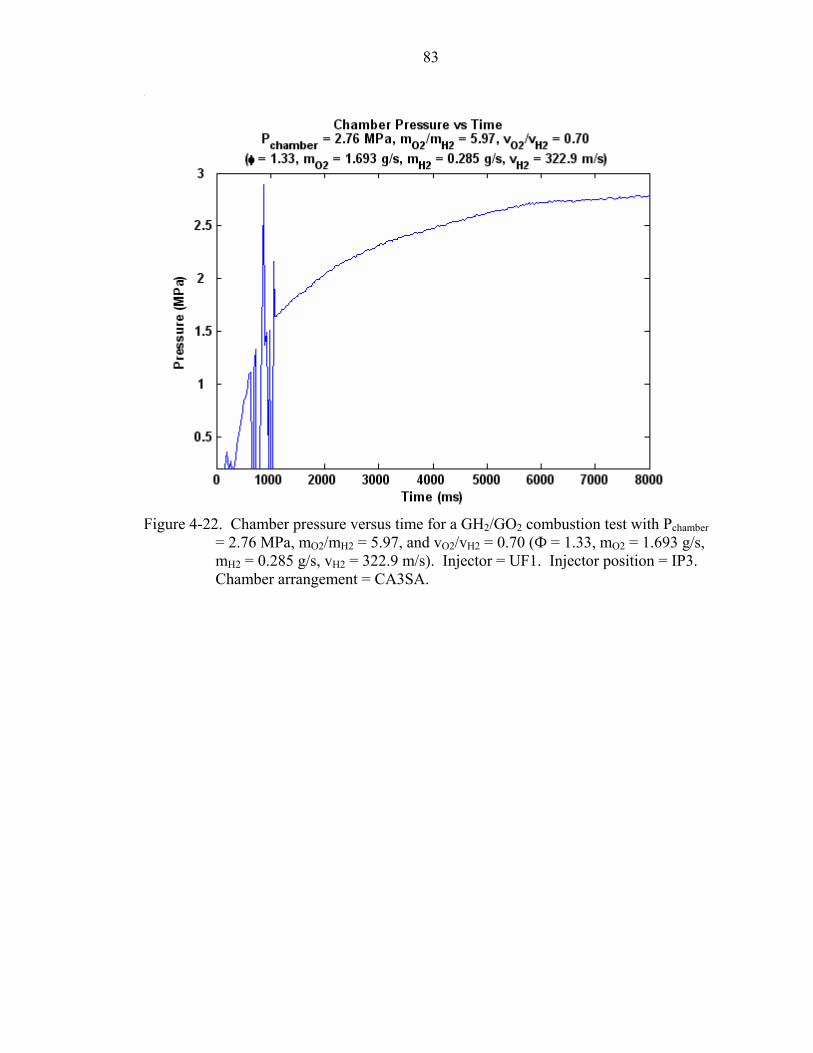
83
Figure 4-22. Chamber pressure versus time for a GH2/GO2 combustion test with Pchamber
= 2.76 MPa, mO2/mH2 = 5.97, and vO2/vH2 = 0.70 (Ф = 1.33, mO2 = 1.693 g/s, mH2 = 0.285 g/s, vH2 = 322.9 m/s). Injector = UF1. Injector position = IP3. Chamber arrangement = CA3SA.
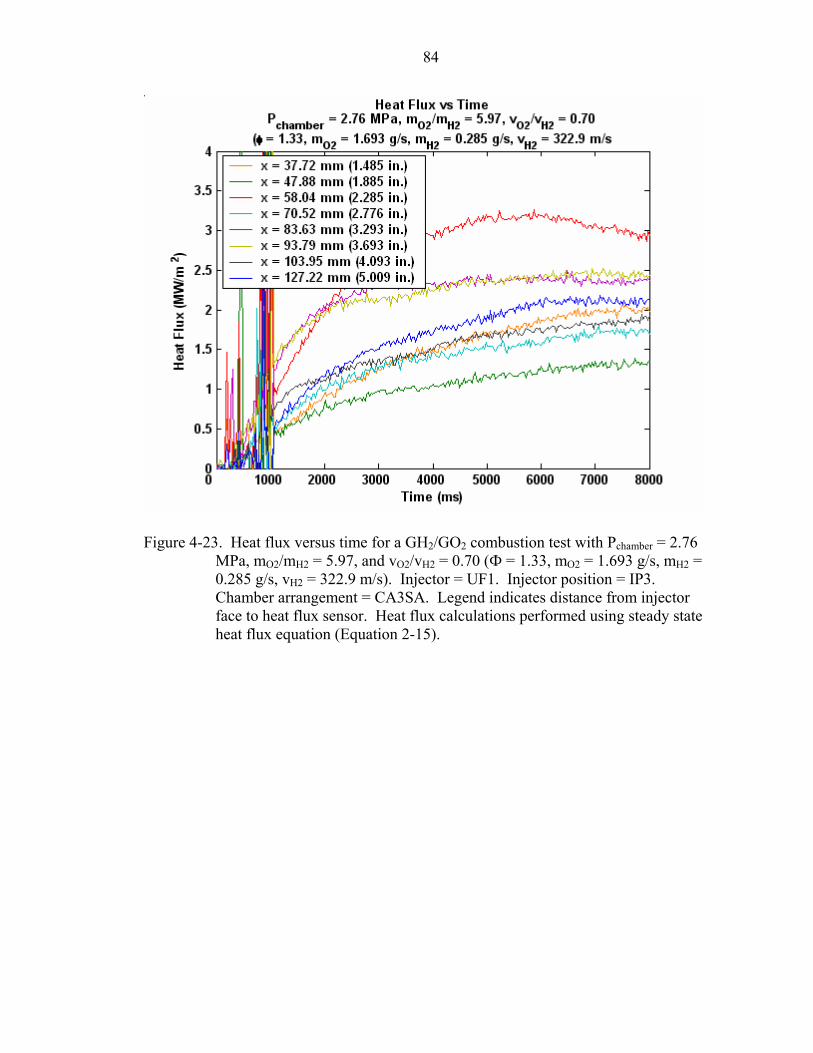
84
Figure 4-23. Heat flux versus time for a GH2/GO2 combustion test with Pchamber = 2.76
MPa, mO2/mH2 = 5.97, and vO2/vH2 = 0.70 (Ф = 1.33, mO2 = 1.693 g/s, mH2 = 0.285 g/s, vH2 = 322.9 m/s). Injector = UF1. Injector position = IP3. Chamber arrangement = CA3SA. Legend indicates distance from injector face to heat flux sensor. Heat flux calculations performed using steady state heat flux equation (Equation 2-15).
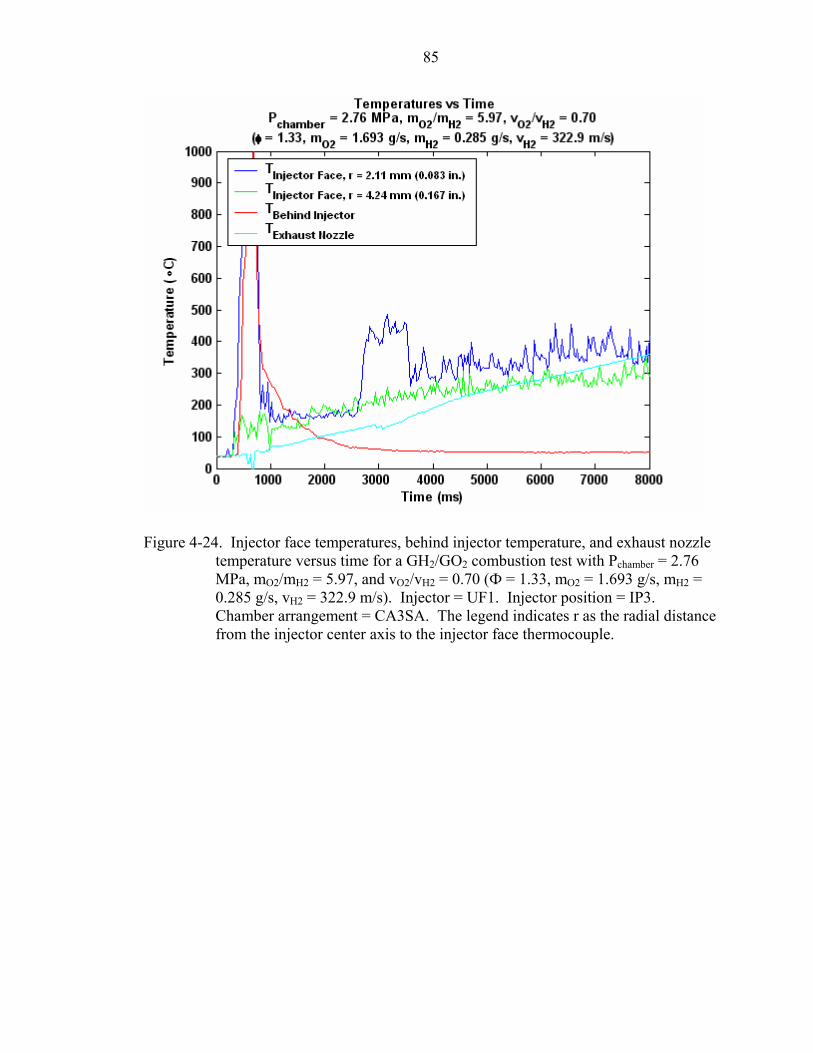
85
Figure 4-24. Injector face temperatures, behind injector temperature, and exhaust nozzle
temperature versus time for a GH2/GO2 combustion test with Pchamber = 2.76 MPa, mO2/mH2 = 5.97, and vO2/vH2 = 0.70 (Ф = 1.33, mO2 = 1.693 g/s, mH2 = 0.285 g/s, vH2 = 322.9 m/s). Injector = UF1. Injector position = IP3. Chamber arrangement = CA3SA. The legend indicates r as the radial distance from the injector center axis to the injector face thermocouple.
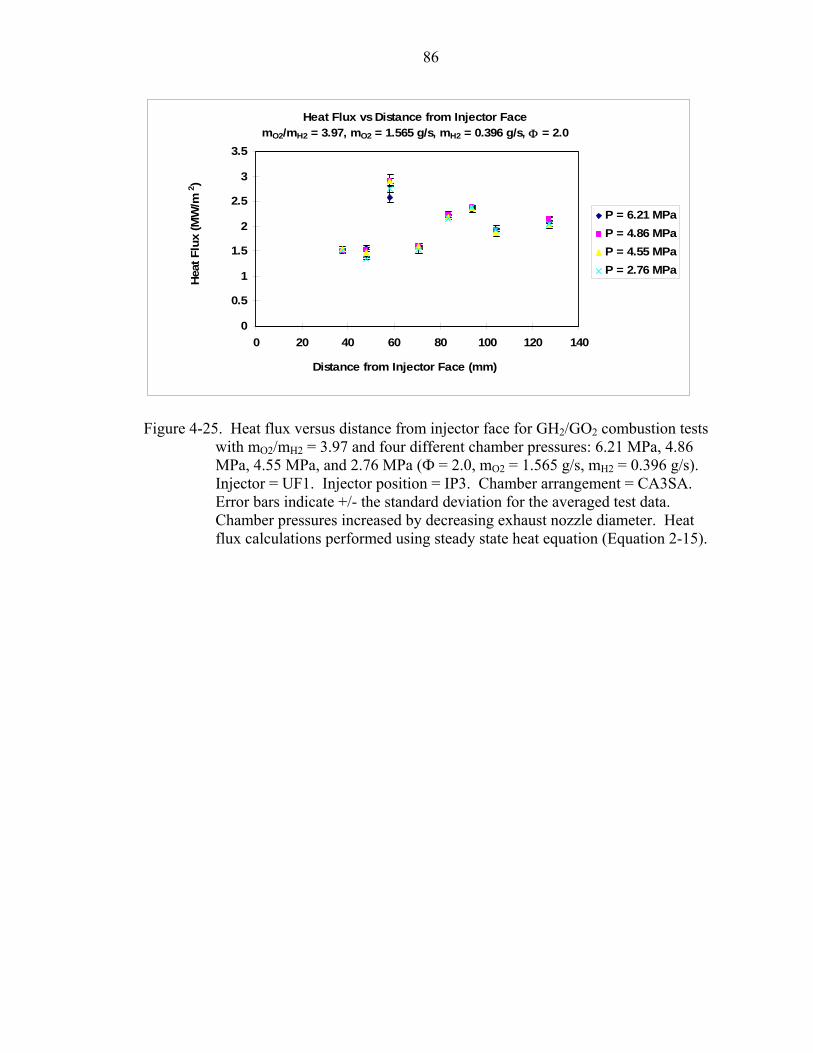
86
0
0.5
1
1.5
2
2.5
3
3.5
0 20 40 60 80 100 120 140
P = 6.21 MPaP = 4.86 MPaP = 4.55 MPaP = 2.76 MPa
Distance from Injector Face (mm)
Hea
t Flu
x (M
W/m
2 )
Heat Flux vs Distance from Injector FacemO2/mH2 = 3.97, mO2 = 1.565 g/s, mH2 = 0.396 g/s, Φ = 2.0
Figure 4-25. Heat flux versus distance from injector face for GH2/GO2 combustion tests
with mO2/mH2 = 3.97 and four different chamber pressures: 6.21 MPa, 4.86 MPa, 4.55 MPa, and 2.76 MPa (Ф = 2.0, mO2 = 1.565 g/s, mH2 = 0.396 g/s). Injector = UF1. Injector position = IP3. Chamber arrangement = CA3SA. Error bars indicate +/- the standard deviation for the averaged test data. Chamber pressures increased by decreasing exhaust nozzle diameter. Heat flux calculations performed using steady state heat equation (Equation 2-15).

87
0
0.5
1
1.5
2
2.5
3
3.5
4
0 20 40 60 80 100 120 140
P = 6.21 MPaP = 4.86 MPaP = 4.55 MPaP = 2.76 MPa
Distance from Injector Face (mm)
Hea
t Flu
x (M
W/m
2 )Heat Flux vs Distance from Injector Face
mO2/mH2 = 3.97, mO2 = 1.565 g/s, mH2 = 0.396 g/s, Φ = 2.0
Heat Flux calculations performed using steady state heat flux plus heat absorption equation (Equation 2-16).
Figure 4-26. Heat flux versus distance from injector face for GH2/GO2 combustion tests
with mO2/mH2 = 3.97 and four different chamber pressures: 6.21 MPa, 4.86 MPa, 4.55 MPa, and 2.76 MPa (Ф = 2.0, mO2 = 1.565 g/s, mH2 = 0.396 g/s). Injector = UF1. Injector position = IP3. Chamber arrangement = CA3SA. Chamber pressures increased by decreasing exhaust nozzle diameter. Heat flux calculations performed using steady state heat flux plus heat absorption equation (Equation 2-16).

88
0
0.5
1
1.5
2
2.5
3
3.5
0 20 40 60 80 100 120 140
P = 6.21 MPaP = 4.86 MPaP = 4.55 MPaP = 2.76 MPa
Distance from Injector Face (mm)
Heat
Flu
x (M
W/m
2 )
Heat Flux vs Distance from Injector FacemO2/mH2 = 5.97, mO2 = 1.693 g/s, mH2 = 0.285 g/s, Φ = 1.33
Figure 4-27. Heat flux versus distance from injector face for GH2/GO2 combustion tests
with mO2/mH2 = 5.97 and four different chamber pressures: 6.21 MPa, 4.86 MPa, 4.55 MPa, and 2.76 MPa (Ф = 1.33, mO2 = 1.693 g/s, mH2 = 0.285 g/s). Injector = UF1. Injector position = IP3. Chamber arrangement = CA3SA. Error bars indicate +/- the standard deviation for the averaged test data. Chamber pressures increased by decreasing exhaust nozzle diameter. Heat flux calculations performed using steady state heat flux equation (Equation 2-15).
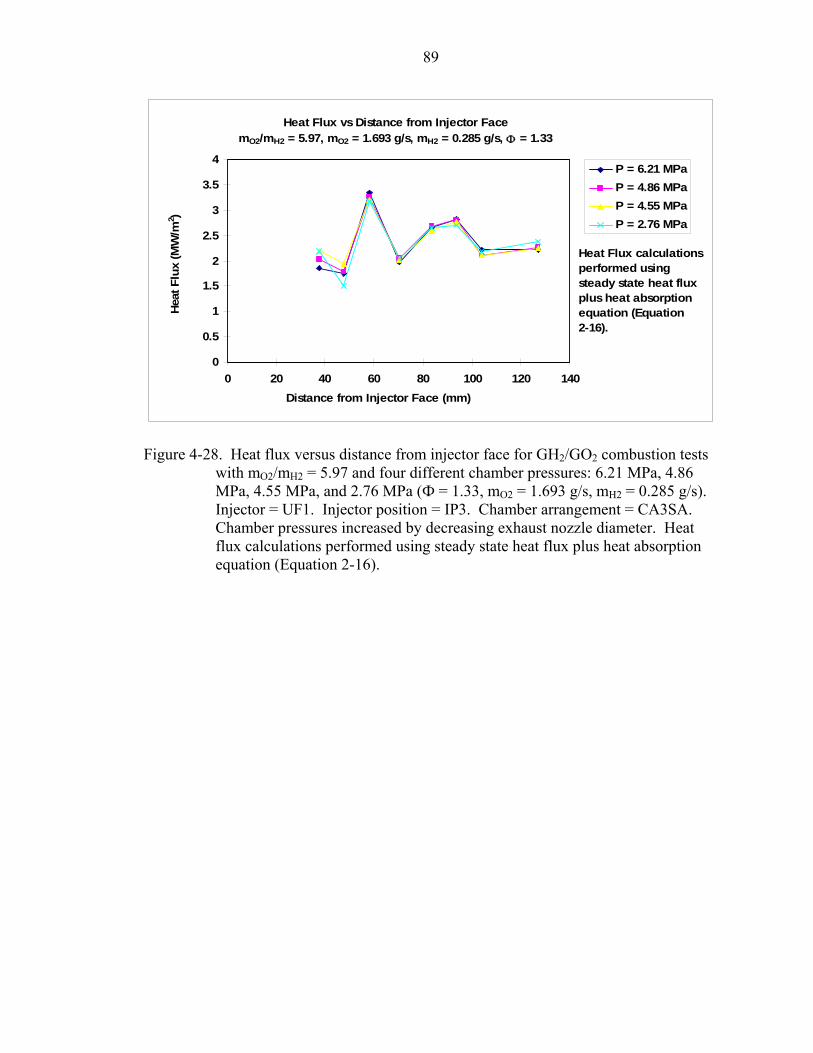
89
0
0.5
1
1.5
2
2.5
3
3.5
4
0 20 40 60 80 100 120 140
P = 6.21 MPaP = 4.86 MPaP = 4.55 MPaP = 2.76 MPa
Distance from Injector Face (mm)
Heat
Flu
x (M
W/m
2 )
Heat Flux vs Distance from Injector FacemO2/mH2 = 5.97, mO2 = 1.693 g/s, mH2 = 0.285 g/s, Φ = 1.33
Heat Flux calculations performed using steady state heat flux plus heat absorption equation (Equation 2-16).
Figure 4-28. Heat flux versus distance from injector face for GH2/GO2 combustion tests
with mO2/mH2 = 5.97 and four different chamber pressures: 6.21 MPa, 4.86 MPa, 4.55 MPa, and 2.76 MPa (Ф = 1.33, mO2 = 1.693 g/s, mH2 = 0.285 g/s). Injector = UF1. Injector position = IP3. Chamber arrangement = CA3SA. Chamber pressures increased by decreasing exhaust nozzle diameter. Heat flux calculations performed using steady state heat flux plus heat absorption equation (Equation 2-16).

0
50
100
150
200
250
300
350
0 20 40 60 80 100 120 140
P = 6.21 MPaP = 4.86 MPaP = 4.55 MPaP = 2.76 MPa
Distance from Injector Face (mm)
Tem
pera
ture
( o C
)
Chamber Wall Temperature vs Distance from Injector FacemO2/mH2 = 3.97, mO2 = 1.565 g/s, mH2 = 0.396 g/s, Φ = 2.0
Figure 4-29. Chamber wall temperature versus distance from injector face for GH2/GO2
combustion tests with mO2/mH2 = 3.97 and four different chamber pressures: 6.21 MPa, 4.86 MPa, 4.55 MPa, and 2.76 MPa (Ф = 2.0, mO2 = 1.565 g/s, mH2 = 0.396 g/s). Injector = UF1. Injector position = IP3. Chamber arrangement = CA3SA. Error bars indicate +/- the standard deviation for the averaged test data. Chamber pressures increased by decreasing exhaust nozzle diameter. Wall temperature calculations performed using Equation 2-17.

91
0
50
100
150
200
250
300
350
0 20 40 60 80 100 120 140
P = 6.21 MPaP = 4.86 MPaP = 4.55 MPaP = 2.76 MPa
Distance from Injector Face (mm)
Tem
pera
ture
( o C
)
Chamber Wall Temperature vs Distance from Injector FacemO2/mH2 = 5.97, mO2 = 1.693 g/s, mH2 = 0.285 g/s, Φ = 1.33
Figure 4-30. Chamber wall temperature versus distance from injector face for GH2/GO2
combustion tests with mO2/mH2 = 5.97 and four different chamber pressures: 6.21 MPa, 4.86 MPa, 4.55 MPa, and 2.76 MPa (Ф = 1.33, mO2 = 1.693 g/s, mH2 = 0.285 g/s). Injector = UF1. Injector position = IP3. Chamber arrangement = CA3SA. Error bars indicate +/- the standard deviation for the averaged test data. Chamber pressures increased by decreasing exhaust nozzle diameter. Wall temperature calculations performed using Equation 2-17.

92
200250300350400450500550600650
2 3 4 5 6 7
r = 2.11 mm (0.083 in) r = 4.24 mm (0.167 in)
Chamber Pressure (MPa)
Tem
pera
ture
( o C)
Injector Face Temperature vs Chamber PressuremO2/mH2 = 3.97, mO2 = 1.565 g/s, mH2 = 0.396 g/s, Φ = 2.0
Figure 4-31. Injector face temperature versus chamber pressure for GH2/GO2 combustion
tests with mO2/mH2 = 3.97 (Ф = 2.0, mO2 = 1.565 g/s, mH2 = 0.396 g/s). Injector = UF1. Injector position = IP3. Chamber arrangement = CA3SA. Legend indicates r as the radial distance from the injector center axis to the injector face thermocouple. Bars indicate +/- the standard fluctuation from the average temperature. Chamber pressures increased by decreasing exhaust nozzle diameter.
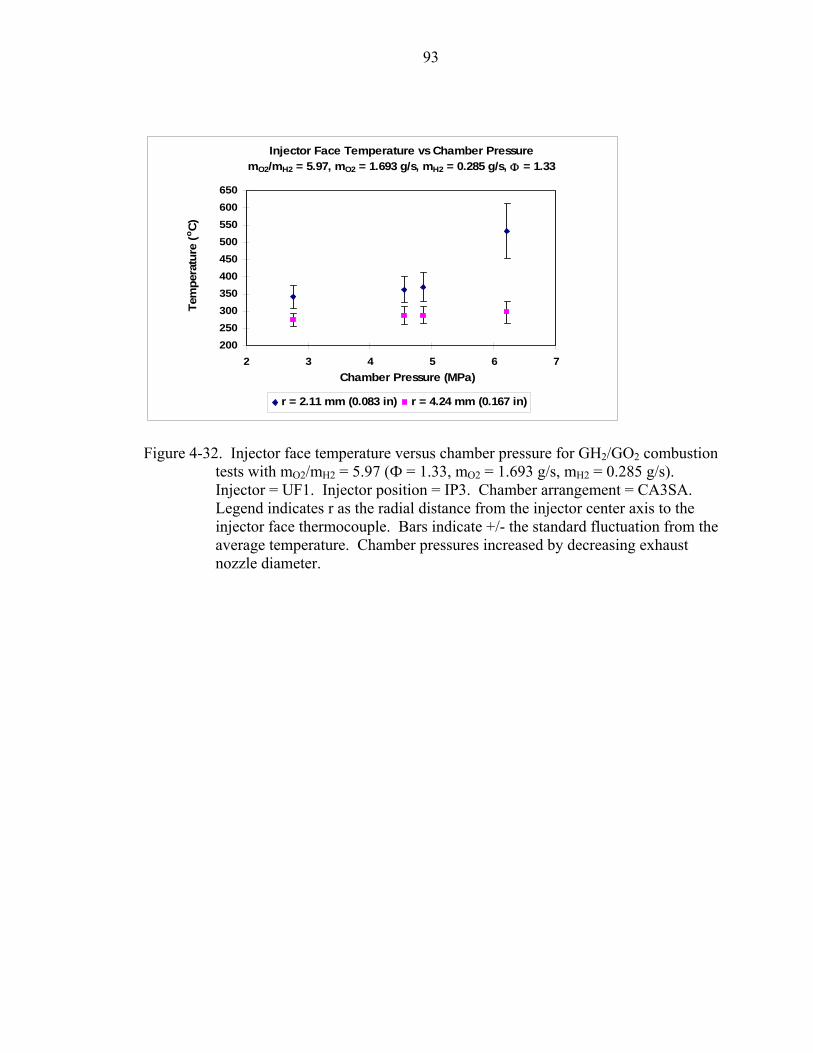
93
200250300350400450500550600650
2 3 4 5 6 7
r = 2.11 mm (0.083 in) r = 4.24 mm (0.167 in)
Chamber Pressure (MPa)
Tem
pera
ture
( o C)
Injector Face Temperature vs Chamber PressuremO2/mH2 = 5.97, mO2 = 1.693 g/s, mH2 = 0.285 g/s, Φ = 1.33
Figure 4-32. Injector face temperature versus chamber pressure for GH2/GO2 combustion
tests with mO2/mH2 = 5.97 (Ф = 1.33, mO2 = 1.693 g/s, mH2 = 0.285 g/s). Injector = UF1. Injector position = IP3. Chamber arrangement = CA3SA. Legend indicates r as the radial distance from the injector center axis to the injector face thermocouple. Bars indicate +/- the standard fluctuation from the average temperature. Chamber pressures increased by decreasing exhaust nozzle diameter.

94
0
100
200
300
400
500
600
0 2 4 6Radial Distance from Injector
Center Axis (mm)
Tem
pera
ture
( o C)
Pchamber = 6.21 MPa, mO2/mH2 = 3.97
Pchamber = 4.86 MPa, mO2/mH2 = 3.97
Pchamber = 4.55 MPa, mO2/mH2 = 3.97
Pchamber = 2.76 MPa, mO2/mH2 = 3.97
Pchamber = 6.21 MPa, mO2/mH2 = 5.97
Pchamber = 4.86 MPa, mO2/mH2 = 5.97
Pchamber = 4.55 MPa, mO2/mH2 = 5.97
Pchamber = 2.76 MPa, mO2/mH2 = 5.97
Injector Face Temperature vs Radial Distance from Injector Center Axis
Figure 4-33. Injector face temperatures versus radial distance from injector center axis
for GH2/GO2 combustion tests at mO2/mH2 = 3.97 and 5.97 and Pchamber = 6.21 MPa, 4.86 MPa, 4.55 MPa, and 2.76 MPa. Chamber pressures increased by decreasing exhaust nozzle diameter.
150
200
250
300
350
400
450
90 110 130 150 170
r = 2.11 mm (0.083 in)r = 4.24 mm (0.167 in)
Chamber Length (mm)
Inje
ctor
Fac
e Te
mpe
ratu
re (
o C )
Injector Face Temperauture vs. Chamber LengthPchamber = 4.86 MPa, mO2/mH2 = 3.97, vO2/vH2 = 0.46 (Φ = 2.0, mO2 = 1.565 g/s,
mH2 = 0.396 g/s, vH2 = 197.4 m/s)
Chamber Lengths mm (inch)169.3 (6.66)150.7 (5.93)132.1 (5.20)112.6 (4.43)94.0 (3.70)
Figure 4-34. Injector face temperature versus chamber length for GH2/GO2 combustion
tests with Pchamber = 4.86 MPa, mO2/mH2 = 3.97, and vO2/vH2 = 0.46 (Ф = 2.0, mO2 = 1.565 g/s, mH2 = 0.396 g/s). Injector = UF1. Injector position = IP3. Legend indicates r as the radial distance from the injector center axis to the injector face thermocouple. Error bars indicate +/- the standard deviation for the averaged test data.

95
0
0.5
1
1.5
2
2.5
3
3.5
4
0 50 100 150Distance from Injector Face (mm)
Hea
t Flu
x (M
W/m
2 )
Heat Flux vs Distance from Injector FacemO2/mH2 = 3.97, vO2/vH2 = 0.46, vH2 = 207.4 m/s
Φ = 2.0, IDnozzle = 1.70 mm (0.670 in.)Pchamber = 2.75 MPa, mH2 = 0.187 g/s
Pchamber = 2.75 MPa, mH2 = 0.187 g/s
Pchamber = 3.90 MPa, mH2 = 0.280 g/s
Pchamber = 3.90 MPa, mH2 = 0.280 g/s
Pchamber = 4.93 MPa, mH2 = 0.377 g/s
Pchamber = 4.93 MPa, mH2 = 0.377 g/s
Pchamber = 5.87 MPa, mH2 = 0.470 g/s
Pchamber = 5.87 MPa, mH2 = 0.470 g/s
Heat Flux calculations performed using steady state heat flux plus heat absorption equation (Equation 2.16).
Figure 4-35. Heat flux versus distance from injector face for GH2/GO2 combustion tests
with mO2/mH2 = 3.97 (Φ = 2.0), vO2/vH2 = 0.46, vH2 = 207.4 m/s, and a variety of chamber pressures. Chamber pressure increased by increasing flow rates. Exhaust nozzle diameter = 1.70 mm (0.670 in.). Injector = UF1. Injector position = IP3. Chamber arrangement = CA3SA. Heat flux values calculated using steady state heat flux plus heat absorption equation (Equation 2-16).
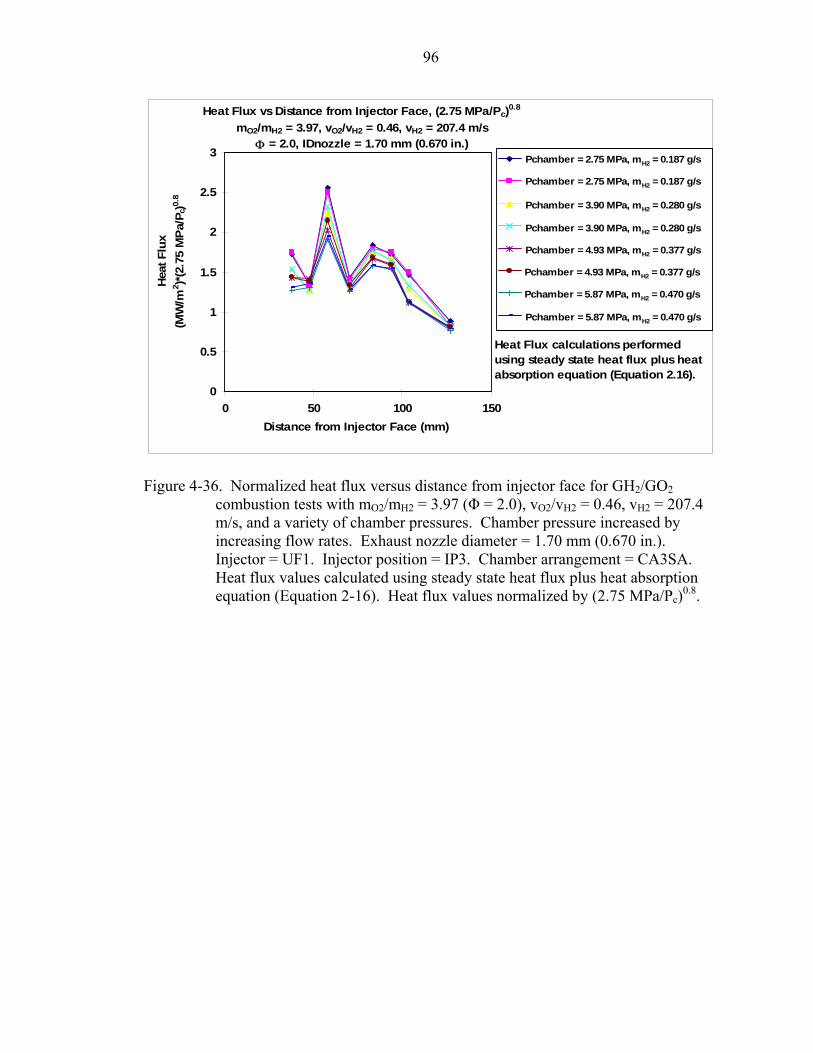
96
0
0.5
1
1.5
2
2.5
3
0 50 100 150Distance from Injector Face (mm)
Hea
t Flu
x(M
W/m
2 )*(2.
75 M
Pa/
P c)0.
8
Heat Flux vs Distance from Injector Face, (2.75 MPa/Pc)0.8
mO2/mH2 = 3.97, vO2/vH2 = 0.46, vH2 = 207.4 m/sΦ = 2.0, IDnozzle = 1.70 mm (0.670 in.)
Pchamber = 2.75 MPa, mH2 = 0.187 g/s
Pchamber = 2.75 MPa, mH2 = 0.187 g/s
Pchamber = 3.90 MPa, mH2 = 0.280 g/s
Pchamber = 3.90 MPa, mH2 = 0.280 g/s
Pchamber = 4.93 MPa, mH2 = 0.377 g/s
Pchamber = 4.93 MPa, mH2 = 0.377 g/s
Pchamber = 5.87 MPa, mH2 = 0.470 g/s
Pchamber = 5.87 MPa, mH2 = 0.470 g/s
Heat Flux calculations performed using steady state heat flux plus heat absorption equation (Equation 2.16).
Figure 4-36. Normalized heat flux versus distance from injector face for GH2/GO2
combustion tests with mO2/mH2 = 3.97 (Φ = 2.0), vO2/vH2 = 0.46, vH2 = 207.4 m/s, and a variety of chamber pressures. Chamber pressure increased by increasing flow rates. Exhaust nozzle diameter = 1.70 mm (0.670 in.). Injector = UF1. Injector position = IP3. Chamber arrangement = CA3SA. Heat flux values calculated using steady state heat flux plus heat absorption equation (Equation 2-16). Heat flux values normalized by (2.75 MPa/Pc)0.8.

97
0
0.5
1
1.5
2
2.5
3
0 50 100 150Distance from Injector Face (mm)
Hea
t Flu
x(M
W/m
2 )*(2.
75 M
Pa/
P c)0.
6
Heat Flux vs Distance from Injector Face, (2.75 MPa/Pc)0.6
mO2/mH2 = 3.97, vO2/vH2 = 0.46, vH2 = 207.4 m/sΦ = 2.0, IDnozzle = 1.70 mm (0.670 in.)
Pchamber = 2.75 MPa, mH2 = 0.187 g/s
Pchamber = 2.75 MPa, mH2 = 0.187 g/s
Pchamber = 3.90 MPa, mH2 = 0.280 g/s
Pchamber = 3.90 MPa, mH2 = 0.280 g/s
Pchamber = 4.93 MPa, mH2 = 0.377 g/s
Pchamber = 4.93 MPa, mH2 = 0.377 g/s
Pchamber = 5.87 MPa, mH2 = 0.470 g/s
Pchamber = 5.87 MPa, mH2 = 0.470 g/s
Heat Flux calculations performed using steady state heat flux plus heat absorption equation (Equation 2.16).
Figure 4-37. Normalized heat flux versus distance from injector face for GH2/GO2
combustion tests with mO2/mH2 = 3.97 (Φ = 2.0), vO2/vH2 = 0.46, vH2 = 207.4 m/s, and a variety of chamber pressures. Chamber pressure increased by increasing flow rates. Exhaust nozzle diameter = 1.70 mm (0.670 in.). Injector = UF1. Injector position = IP3. Chamber arrangement = CA3SA. Heat flux values calculated using steady state heat flux plus heat absorption equation (Equation 2-16). Heat flux values normalized by (2.75 MPa/Pc)0.6.

98
0
0.5
1
1.5
2
2.5
3
0 50 100 150Distance from Injector Face (mm)
Heat
Flu
x(M
W/m
2 )*(0
.187
g/s
/ m
H2)0.
5
Heat Flux vs Distance from Injector Face, (0.187 g/s / mH2)0.5
mO2/mH2 = 3.97, vO2/vH2 = 0.46, vH2 = 207.4 m/sΦ = 2.0, IDnozzle = 1.70 mm (0.670 in.)
Pchamber = 2.75 MPa, mH2 = 0.187 g/s
Pchamber = 2.75 MPa, mH2 = 0.187 g/s
Pchamber = 3.90 MPa, mH2 = 0.280 g/s
Pchamber = 3.90 MPa, mH2 = 0.280 g/s
Pchamber = 4.93 MPa, mH2 = 0.377 g/s
Pchamber = 4.93 MPa, mH2 = 0.377 g/s
Pchamber = 5.87 MPa, mH2 = 0.470 g/s
Pchamber = 5.87 MPa, mH2 = 0.470 g/s
Heat Flux calculations performed using steady state heat flux plus heat absorption equation (Equation 2.16).
Figure 4-38. Normalized heat flux versus distance from injector face for GH2/GO2
combustion tests with mO2/mH2 = 3.97 (Φ = 2.0), vO2/vH2 = 0.46, vH2 = 207.4 m/s, and a variety of chamber pressures. Chamber pressure increased by increasing flow rates. Exhaust nozzle diameter = 1.70 mm (0.670 in.). Injector = UF1. Injector position = IP3. Chamber arrangement = CA3SA. Heat flux values calculated using steady state heat flux plus heat absorption equation (Equation 2-16). Heat flux values normalized by (0.187 g/s / mH2)0.5.
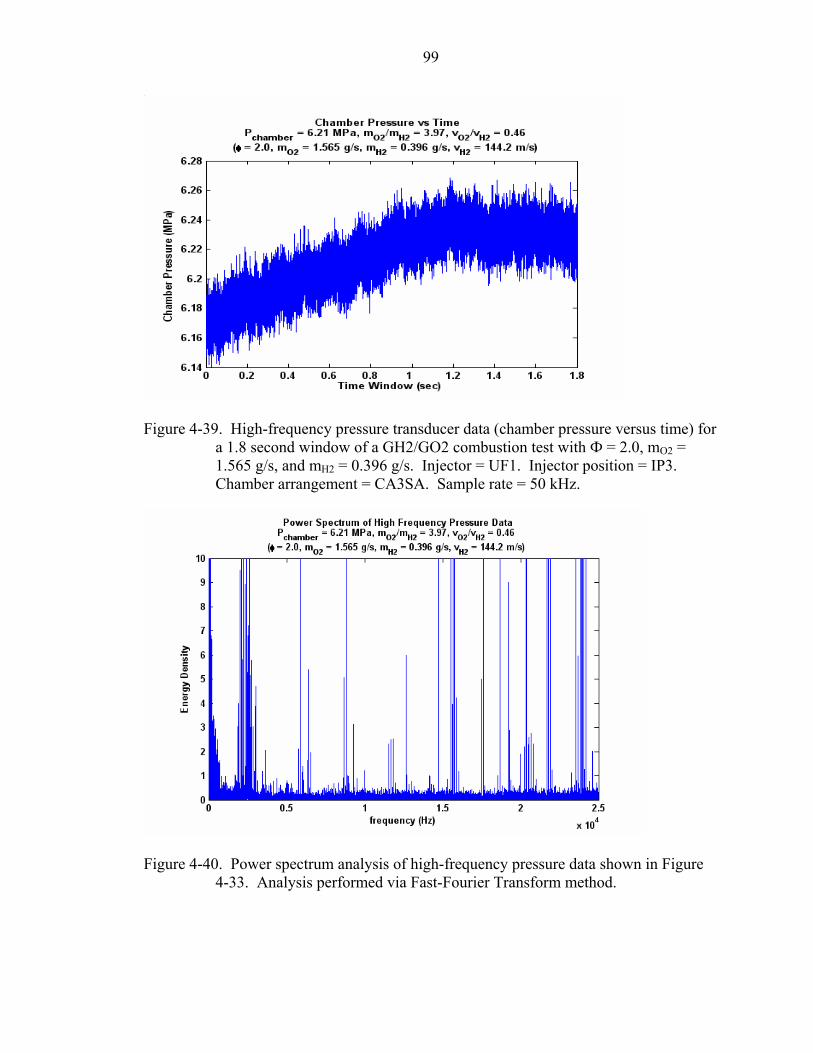
99
Figure 4-39. High-frequency pressure transducer data (chamber pressure versus time) for
a 1.8 second window of a GH2/GO2 combustion test with Ф = 2.0, mO2 = 1.565 g/s, and mH2 = 0.396 g/s. Injector = UF1. Injector position = IP3. Chamber arrangement = CA3SA. Sample rate = 50 kHz.
Figure 4-40. Power spectrum analysis of high-frequency pressure data shown in Figure
4-33. Analysis performed via Fast-Fourier Transform method.

100
Figure 4-41. 0-3500 Hz window of power spectrum shown in Figure 4-34.
Figure 4-42. Average flame profile of a GH2/GO2 flame with operating conditions of
Pchamber = 4.86 MPa, Ф = 2.0, mO2 = 1.565 g/s, mH2 = 0.396 g/s, and vO2/vH2 = 0.46. Images of broadband flame emission. Exposure time = 500 ns. Average of 132 images. Injector center axis located at y = 0 and injector face located at x = 0.

101
Figure 4-43. Instantaneous flame image of a GH2/GO2 flame with operating conditions
of Pchamber = 4.86 MPa, Ф = 2.0, mO2 = 1.565 g/s, mH2 = 0.396 g/s, and vO2/vH2 = 0.46. Image of broadband flame emission. Exposure time = 500 ns. Injector center axis located at y = 0 and injector face located at x = 0.
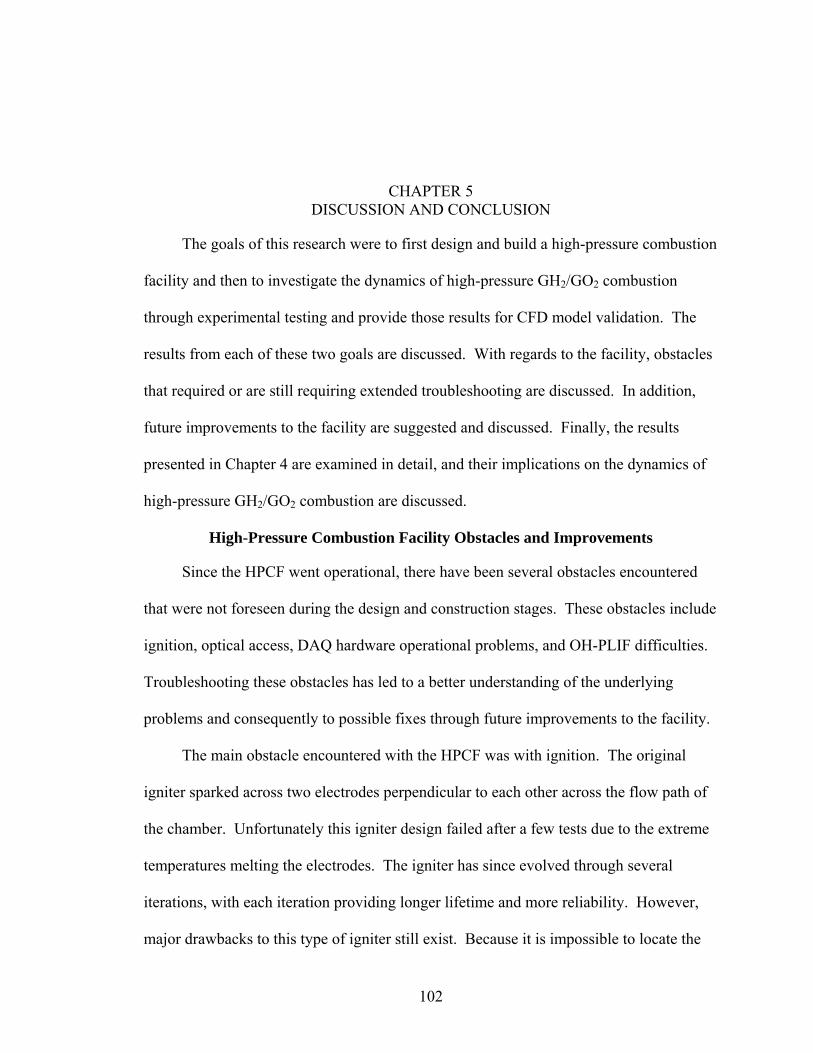
102
CHAPTER 5 DISCUSSION AND CONCLUSION
The goals of this research were to first design and build a high-pressure combustion
facility and then to investigate the dynamics of high-pressure GH2/GO2 combustion
through experimental testing and provide those results for CFD model validation. The
results from each of these two goals are discussed. With regards to the facility, obstacles
that required or are still requiring extended troubleshooting are discussed. In addition,
future improvements to the facility are suggested and discussed. Finally, the results
presented in Chapter 4 are examined in detail, and their implications on the dynamics of
high-pressure GH2/GO2 combustion are discussed.
High-Pressure Combustion Facility Obstacles and Improvements
Since the HPCF went operational, there have been several obstacles encountered
that were not foreseen during the design and construction stages. These obstacles include
ignition, optical access, DAQ hardware operational problems, and OH-PLIF difficulties.
Troubleshooting these obstacles has led to a better understanding of the underlying
problems and consequently to possible fixes through future improvements to the facility.
The main obstacle encountered with the HPCF was with ignition. The original
igniter sparked across two electrodes perpendicular to each other across the flow path of
the chamber. Unfortunately this igniter design failed after a few tests due to the extreme
temperatures melting the electrodes. The igniter has since evolved through several
iterations, with each iteration providing longer lifetime and more reliability. However,
major drawbacks to this type of igniter still exist. Because it is impossible to locate the

103
igniter in the propellant stream, the igniter must sit out of the main flow and wait for
mixed gases to make contact with it. This usually means the chamber fills with premixed
gases before ignition, causing detonation and a huge pressure spike. With the copper
inserts in place of the windows, this pressure spike is not a problem. With the windows
installed, though, this huge pressure spike tends to crack the windows, ruining the optical
access. Also, the pressure spikes tend to kill the highly sensitive Entran high-frequency
pressure transducers. The best solution is to integrate a torch igniter in the
injector/injector face. This would ignite the propellants immediately upon injection,
eliminating the pressure spike. Also, integrating the torch into the injector allows clean
ignition no matter where the injector is located within the chamber. The design of a
injector with integrated ignition torch is currently in progress.
Another obstacle is maintaining contact between the heat flux sensors and the
chamber surface. It has been observed that some heat flux sensors tend to either lose
contact or initiate contact during the middle of a combustion test due to the expansion of
the copper chamber. Thermal grease was added to the contact point of the heat flux
sensor and combustion chamber to try and maintain contact. While this did help some,
the grease tends to dry out and crack, causing the sensors to lose contact again. One
possible solution is to solder the heat flux sensors to the chamber surface to establish a
permanent contact. This solution is worth investigation.
Next, there are several locations for DAQ sensors that have been identified as
desirable since the facility went operational. More specifically, temperature and pressure
measurements inside the injector immediately upstream of the injection point. This
includes measurements within both the oxidizer and fuel injector components. The

104
temperature measurements are especially desired because they would give insight into
heat transfer upstream of the injection point. However, the size and geometry of the
injector make retrofitting these DAQ capabilities extremely difficult. Investigation into
adding these DAQ sensors to the injector being designed with the torch igniter is
currently in progress.
Another improvement would be implementing a water-cooled exhaust nozzle.
While water-cooling the nozzle will take away the exhaust nozzle temperature reading as
a boundary condition, it would allow longer run times of the chamber for longer studies,
as the exhaust nozzle heats up much faster than any other part of the combustor. A
water-cooled nozzle has been designed for the HPCF and awaits construction and
implementation.
Finally, getting the OH-PLIF diagnostic technique to work proved to be very
difficult. The laser sheet optics were setup properly and the UV output was tuned to the
correct wavelength, but no fluorescence was observed. The most likely problem is too
little power at the chamber. This stems from inefficiencies and misalignments in the
OPO, doubler, and laser sheet optics. Currently, effort is being put into maximizing the
power out of the laser/OPO system and calibrating the technique in a Methane/Air flame.
High-Pressure GH2/GO2 Combustion Dynamics
The results obtained in this research, including those presented in Chapter 4, give
much insight into the dynamics of high-pressure GH2/GO2 combustion, as well as
provide for CFD code validation. The results mainly include heat flux and injector face
temperature data for GH2/GO2 flames operating at mO2/mH2 = 3.97 and mO2/mH2 = 5.97
(Φ = 2.0 and Φ = 1.33). For these two mass flow ratios, four operational chamber
pressures were investigated by keeping the propellant mass flow rates constant and

105
changing the exhaust nozzle diameter, namely 6.21 MPa, 4.86 MPa, 4.55 MPa, and 2.76
MPa. Pressure versus time, wall heat flux versus time (using two different heat flux
equations), injector face temperatures versus time, heat flux versus distance from injector,
chamber wall temperature versus distance from injector, and injector face temperatures
versus chamber length are all presented for this method of changing the chamber pressure
within Chapter 4. In addition, a second set of wall heat flux data was obtained for
GH2/GO2 flames operating at mO2/mH2 = 3.97 for four different chamber pressures, which
were increased by increasing the propellant mass flow rates but keeping the exhaust
nozzle diameter constant. This method in which this second set of data was obtained is
similar to that used by Marshall et al.3
Initial Unstable/Unsteady Flow
First, it is interesting to note that during all of the combustion tests, there seems to
be an initial period where the internal flow is not stabilized, followed by a stabilized
period where the heat fluxes level off and the injector face temperatures become
relatively steady. Aspects of this can be seen in all the combustion tests from Figures 4-1
through Figures 4-24. This unstable period appears to last for several seconds after
ignition. For example, Figure 4-10 shows the two injector face temperatures making a
transition to a higher (and admittedly more fluctuatory) value around 4.5 to 5 seconds
after ignition. While all tests do not show this drastic change, most do show a change
after several seconds of combustion. One possible source of this phenomenon could be
an initial period of backflow into the space behind the injector block. However, this was
tested for by running tests with nitrogen pre-pressurizing the chamber so that the area
behind the injector was at the same pressure or higher than that of the chamber once
combustion started. The same period of instability appeared in these tests as well.

106
This effect is more likely due to the change in gas injection velocity during the
ramping up of the chamber pressure. Immediately after the propellants are turned on they
rush through the injector, possibly choking at the injector, until the chamber pressure
rises due to the presence of the propellants. After ignition occurs, the chamber pressure
begins to rise, which causes the propellant injection velocities to drop. Once the chamber
pressure begins to level off to the nominal operating pressure, the propellant injection
velocities sets up to their nominal operating conditions, at which point the internal flow is
able to reach a more steady state than during the period of pressure/velocity change. This
is when the recirculation regions next to the injector are able to set up to a more steady
state, giving rise to the changes seen after several seconds of burn.
Pressure Effect on Wall Heat Flux
More interesting aspects of the combustion dynamics become evident when
comparing the data from the two different data sets. More specifically, the data obtained
by changing the chamber pressure via changing the exhaust nozzle and the data obtained
by changing chamber pressure via changing the propellant mass flow rates give different
results in regards to the effect of chamber pressure on the wall heat flux.
Figure 4-25 and Figure 4-27 clearly show that when the exhaust nozzle diameter
was decreased to increase the chamber pressure, the operational chamber pressure had
little effect on the heat flux, no matter the mass flow ratio. Even with each data point
being the average of 3 to 5 tests, there was very little variation based on chamber
pressure. Note that the heat flux calculations for Figure 4-25 and Figure 4-27 were
steady state heat flux only (Equation 2-15). In addition, applying the steady state heat
flux plus heat absorption calculation (Equation 2-16) to the same set of data yields
similarly profiled and patterned results, as shown in Figure 4-26 and Figure 4-28.

107
Comparing the steady state heat flux results to the steady state heat flux plus heat
absorption results (compare Figure 4-25 to Figure 4-26, Figure 4-27 to Figure 4-28)
clearly shows that the only difference is in magnitude of the wall heat flux value.
Specifically, the steady state heat flux plus heat absorption yields on average 10% higher
values than the steady state heat flux alone. Even so, there is little to no difference in the
heat flux values due to pressure effects. The slight variation seen in the heat fluxes
across the different chamber pressures can be attributed to both the change in the
propellant injection velocities and in smaller part to the +/- 5% error in the measured heat
flux values.
This pressure independence on the wall heat fluxes is also supported by the
combustion tests where the chamber pressure was increased by increasing the propellant
mass flow rates. The results from this set of combustion test data are presented in Figure
4-35, Figure 4-36, and Figure 4-37. Figure 4-35 clearly indicates that as the propellant
mass flow rates are increased, and hence the chamber pressure increased, the heat flux
values increase. The profiles seem to be similar between the different cases, though.
Marshall et al.3 also present similar results in their study. They argue a pressure scaling
of the heat flux values available in the literature such that the heat transfer coefficient, h,
is proportional to pressure to the power of 0.8, as shown in Equation 5-1. Note that
pressure to the power of 0.6, as shown in Figure 4-37, seems to give a tighter collapse of
the data than to the power of 0.8.
0.8
,2.75
A normalized Ac
MPaq qP
⎛ ⎞= ⎜ ⎟
⎝ ⎠. (5-1)
While this pressure scaling does result in a collapse of the results to similar
normalized heat flux values, as shown in Figure 4-36, this researcher believes that the

108
application of such a pressure scaling relation is inaccurate. This inaccuracy seems to be
supported by the combustion test results for which the chamber pressure was increased
by decreasing the exhaust nozzle diameter (propellant mass flow rates kept constant),
where there was shown to be no pressure dependence, as shown in Figure 4-26 and
Figure 4-28. This researcher believes that a more accurate scaling argument would be to
scale the heat transfer coefficient, h, using a mass flow scaling based on the hydrogen
mass flow rate, as shown in Equation 5-2.
0.5
,2
0.187 /A normalized A
H
g sq qm
⎛ ⎞= ⎜ ⎟
⎝ ⎠. (5-2)
Note that the scaling factor of 0.5 was chosen because it gave the most visually compact
collapse of the data. Using the mass flow rate scaling argument allows both sets of data
to be accurate, since the data obtained from keeping the mass flow rates constant would
not be affected by the scaling and the data obtained by changing the mass flow rates
collapses to similar heat flux values, resulting in very similar profiles and values from all
of the combustion tests. If the mass flow scaling is used, it becomes clear that there in no
pressure dependence on the wall heat flux profile and wall heat flux values.
This lack of pressure dependence compares favorably with that of Marshall et al.,3
even though different scaling arguments are applied. The fact that the profile remains
similar across all pressures suggests that the dynamic structures within the combusting
flow are pressure independent if all other factors remain constant. Furthermore, the
results from the combustion tests where the mass flow rates were held constant, in which
the injection velocities must increase for the same injector geometry, indicate that the
dynamic structures within the combusting flow are only slightly dependent on the
injection velocity, as indicated by slightly varying values in the heat fluxes with similar

109
profiles. This suggests that the basic dynamic structures of the combusting flow are
mostly dependent on the chamber geometry, with little dependence on injection velocities
and no pressure dependence.
The same conclusion is supported by the chamber wall temperature profiles, shown
in Figure 4-29 and Figure 4-30, which show very little variation across the different
chamber pressure tests. The chamber wall temperature plots do give insight into what the
flame is doing inside the chamber though. The wall temperatures clearly increase, peak,
and decrease along the length of the chamber. This seems to indicate that the shear layer,
the hottest portion of the flame, contacts the chamber wall at the location of the peak wall
temperature, or around 83 mm (3.27 in.) from the injector face for both equivalence
ratios. However, the distance from the injector face at which the highest heat release
occurs appears to be at a different location than the point of maximum chamber wall
temperature. This point of maximum heat release occurs around 60 mm (2.35 in.) from
the injector face. The maximum heat release point also appears to have little dependence
on mass flow ratio and injection velocities, and no pressure dependence. Because the
heat fluxes and chamber wall temperature profiles did not seem to be affected by changes
in chamber pressure, mass flow ratios, velocity ratios, and injection velocities, they
would appear to be dominated mainly by geometrical features.
The injector face temperatures for mO2/mH2 = 3.97 (Φ = 2.0) also seem to have little
pressure dependence, as shown in Figure 4-31 and Figure 4-33. There is only a slight
increase for the two injector face temperatures at a chamber pressure of 4.55 MPa. The
injector face temperatures for mO2/mH2 = 5.97 (Φ = 1.33) show slightly different results
however, as shown in Figure 4-32 and Figure 4-33. The lower pressure values

110
correspond well with each other, as does the value for the injector face thermocouple that
is at a distance of 4.24 mm (0.167 in.) from the injector center axis. However the value
for the injector face thermocouple that is at a distance of 2.11 mm (0.087 in.) from the
injector center axis increases by almost 200 oC, with a huge increase in fluctuation as
well. The reason for this jump is unclear.
Effect of Chamber Length
Another study done in this research was to investigate the effect of chamber length
on the injector face temperatures, of which the results are presented in Figure 4-34. The
trend for the two injector face temperature locations is clear. The temperature measured
4.24 mm (0.167 in.) away from the center axis of the injector shows little change with a
decrease in chamber length. The temperature measured 2.11 mm (0.087 in.) away from
the center axis of the injector shows a sizeable increase as the chamber length decreases.
This increase is probably explained by one of two events. Either the recirculation region
becomes more energetic with hotter gases as the chamber length decreases, or the flame
is forced to spread more quickly due to the decreased length, resulting in the shear layer
residing closer to the thermocouple.
High-Frequency Pressure Transducer
The reason for incorporating the high-frequency pressure transducer into the HPCF
was to provide the capability to investigate acoustic modes of the combustion process
based on changes in chamber length, flow rates, and chamber pressure. While the
usefulness of this information to the CFD modelers is still under review, preliminary data
has been obtained for several combustion tests, one of which is presented in Figure 4-39.
More specifically, a 1.8 second window of the combustion test is presented. The
sampling rate of the transducer was 50 kHz, meaning a useful 25kHz frequency response

111
could be obtained using Fast-Fourier Transform, as show in Figure 4-40. This plot
clearly shows frequency ranges of high local energy. Figure 4-41 zooms in on Figure 4-
34 to show the frequency response in the range of 0 to 3500 Hz. While these plots
clearly show acoustic response, it is impossible to tell from just those single plots which
frequencies are characteristic of certain aspects of the flow, facility, or other
environmental effects. Even comparing the high-frequency pressure transducer data from
several different combustion tests yields very little differences. It is believed by this
researcher that in order for operational conditions and facility features to be accurately
characterized by their acoustic response, a massive amount of tests would need to be
performed, accompanied with a massive correlation study. Unfortunately, the highly
fragile nature of the Entran high-frequency pressure transducers combined with the
current ignition method renders this improbable. The torch ignition method described
above has the potential to correct this problem.
Imaging Discussion
The imaging capabilities of the HPCF offer excellent opportunities to physically
see and image the dynamics of high-pressure combustion. One such example is shown in
Figure 4-42. This image shows the average flame profile of a mO2/mH2 = 3.97 (Φ = 2.0),
Pchamber = 4.86 MPa GH2/GO2 combustion test. One piece of information that can be
instantly pulled from this image is the flame liftoff distance, hliftoff, which is
approximately 1mm in this case. Additionally, the shear layer is seen to bend toward the
centerline (toward the oxidizer) as it moves away from the injector, which is
characteristic of fuel-rich shear layers.25 Also, shear layer growth rates can be inferred
from the image. Figure 4-43 shows an instantaneous image from the same combustion
test as that for the average flame profile. This image clearly shows the transition from
112
the laminar shear layer to the fully turbulent shear layer. Also, image pairs of this type,
taken with a separation time of 500 ns or more, allows average flame velocities to be
calculated based on intensity correlations.
Conclusion
There were two goals of this research. The first goal was to design and build a
high-pressure combustion facility (UF HPCF) capable of operating pressures up to 6.25
MPa (62 atm) and a range of equivalence ratios, with optical access and a host of
diagnostic capabilities. The second goal was to experimentally investigate the dynamics
of high-pressure GH2/GO2 combustion for oxygen to hydrogen mass flow ratios of 3.97
and 5.97 (Φ = 2.0 and 1.33) and a range of chamber pressures including 6.21 MPa, 4.86
MPa, 4.55 MPa, and 2.76 MPa.
The facility was made operational with capabilities including chamber wall heat
flux measurements, injector face temperature measurements, exhaust nozzle
measurements, high-frequency chamber pressure measurements, broadband and UV
imaging, and complete controllability via remote GUI. A full range of combustion tests
have been performed in the HPCF, including those desired for this research. Several
improvements should be made to the HPCF in the future. First is the integration of a
torch igniter into the injector, which will eliminate the detonation and pressure spiking
problem. Secondly, the water-cooled nozzle can be integrated for longer combustion test
times. Finally, a better method for ensuring the proper seat of the heat flux sensors to the
chamber should be incorporated.
Certain aspects of high-pressure GH2/GO2 dynamics were investigated for mO2/mH2
= 3.97 and mO2/mH2 = 5.97 (Φ = 2.0 and Φ = 1.33). For these two mass flow ratios, four
operational chamber pressures were investigated by keeping the propellant mass flow

113
rates constant and changing the exhaust nozzle diameter, namely 6.21, 4.86, 4.55, and
2.76 MPa. In addition, four operational chamber pressures were investigated by keeping
the exhaust nozzle diameter constant and changing the propellant mass flow rates,
namely 5.87, 4.93, 3.90, and 2.75 MPa. A period of instability seems to exist in the flow
inside the chamber for several seconds after ignition due to changing gas injection
velocities. Maximum heat release occurs around 60 mm (2.35 in.) from the injector face.
In general, the injector face temperatures have no dependence on chamber pressure. The
temperature measured at 2.11 mm (0.087 in.) radially outward from the injector center
axis increases as the chamber length decreases, whereas the temperature measured at 4.24
mm (0.167 in.) shows no change with a decrease in chamber length. A massive amount
of tests and correlations would be needed to make use of the high-frequency pressure
transducer data. Usefulness of broadband average flame profiles and broadband
instantaneous flame images includes experimental investigation of hliftoff, shear growth
rate, and average flame speeds. The profiles of heat flux and chamber wall temperatures
seem to have no pressure dependence and only a slight dependence on propellant
injection velocities. A scaling of heat flux values based on fuel mass flow rate, instead of
chamber pressure, is suggested. The lack of pressure dependence and only slight
dependence on the propellant injection velocities, as shown by the similarity in heat flux
profiles, suggests that the basic dynamic structures of the combusting flow are mainly
dominated by geometrical effects.

114
APPENDIX A LABVIEW AND MATLAB CODES
Labview Codes
The block diagrams for the Labview GUI’s “HPCF Control Interface” and “HPCF-
HFPT Interface”, described in Chapter 3, are presented here. Due to the large size of the
block diagram images, the images of the code are contained with the thesis but displayed
within a PDF file which is linked here and included in this thesis. A sample image is
shown here to give the reader an idea of what is shown by opening the PDF file. Click
the hyperlink caption to open the PDF files and view the Labview block diagrams.
Object A-1. Complete Labview code (block diagram) for Labview GUI “HPCF Control
Interface” (5.52 MB, object-a1.pdf).

115
Object A-2. Complete Labview code (block diagram) for Labview GUI “HPCF-HFPT
Interface” (565 KB, object-a2.pdf).
Matlab Codes
The codes for the Matlab programs described in Chapter 2 are included here. The
included program codes are for “HPCF_Data_Processor”, “HFPT_Compare”,
“HPCF_Image_Processor”, and “HPCF_AvgFlameSpeed”. Because of the length of
some of the codes, they were saved into text files and linked here to conserve space.
Object A-3. Matlab code for “HPCF_Data_Proceessor” (19 KB, object-a3.txt).
Object A-4. Matlab code for “HFPT_Compare” (5 KB, object-a4.txt).
Object A-5. Matlab code for “HPCF_Image_Processor” (1 KB, object-a5.txt).
Object A-6. Matlab code for “HPCF_AvgFlameSpeed” (3 KB, object-a6.txt).
Note: All Labview codes, Matlab codes, AutoCAD drawings, and combustion test data
files are located on the Quest computer at C:\High Pressure Combustion Facility.

116
APPENDIX B OPERATIONAL PROCEDURE AND ASSEMBLY INSTRUCTIONS FOR UF HPCF
Operational Procedure
Startup
1. Initiate Labview GUI “HPCF Control Interface” to ensure that all output channels are sending 0 VDC signals.
2. Turn on the power to the electronics system (120 VAC for N2 valve and igniter, 24 VDC for propellant valves).
3. Open the propellant solenoid valves from the control interface to ensure that the lines are purged.
4. Tare the pressure sensors for the chamber and the propellant lines.
5. Turn the two oxidizer ball valves immediately upstream of the oxidizer pressure regulator to the CLOSED position.
For GO2 oxidizer:
6. Turn the oxidizer ball valve at the lab wall to the CLOSED position.
7. Open all bottles in the GO2 bottle array.
8. Turn the oxidizer ball valve at the lab wall to the OPEN position.
9. Turn the oxidizer ball valve on the GO2 line immediately upstream of the oxidizer pressure regulator to the OPEN position. Skip to Step 13.
For Air oxidizer:
10. Ensure that the ball valve upstream of the Air bottle array, which connects the Air and N2 lines, is in the CLOSED position.
11. Open all bottles in the Air bottle array.
12. Turn the oxidizer ball valve on the Air line immediately upstream of the oxidizer pressure regulator to the OPEN position.
13. Ensure that the ball valve connecting the GH2 and N2 lines is in the CLOSED position.

117
14. Open the GH2 bottle.
15. Open the N2 bottle.
16. Set the propellant regulators to the desired downstream propellant line pressures.
17. Using the control interface, change values for the number of turns on the propellant needle valves to set the desired mass flow rates and equivalence ratio.
18. Set the propellant needle valves to the entered number from Step 17.
19. Ensure that igniter tips have been replaced from last experiment.
20. Open the propellant solenoid valves briefly to ensure that pure propellants are delivered at the beginning of the experiment.
21. Purge the chamber with nitrogen to clear the propellants from the chamber.
Testing
22. Change the filename save path on the control interface to direct the saved test data to the desired folder and filename, using the standardized filename presented in Chapter 2. Skip to Step 26 if not acquiring high-frequency pressure transducer data.
If acquiring high-frequency pressure transducer data:
23. Open Labview GUI “HPCF-HFPT Interface”.
24. Change filename save path on this control interface to direct the saved HFPT test data to the desired folder and filename, using the standardized filename presented in Chapter 2.
25. Turn on the 10 VDC power supply to the HFPT and Op-Amp.
26. Skip to Step 29 if not acquiring images.
If acquiring images:
27. The camera should be setup and focused before the Startup of the HPCF.
28. If the camera is setup, run the camera software and set the desired gate and shutter settings.
29. Set all test parameters to the desired values in the “HPCF Control Interface”.
30. Run the combustion test via the Start/Stop Combustion Run button in “HPCF Control Interface”, making sure to initiate the HFPT and camera software (if being used) at the same time.

118
31. IN CASE OF EMERGENCY, hit the large red EMERGENCY SHUTOFF button on the “HPCF Control Interface”. This immediately closes the propellant valves, shuts off the ignition, and shuts the N2 valve. Test data for that run will be lost.
32. If successful, the combustion test should initiate and run according to the user settings on the control interface. The test will automatically shutdown at the end of the test run time, save the data, and return to the control interface pretest operational mode.
33. Allow the chamber to cool down after each test by monitoring the chamber and exhaust nozzle temperatures.
34. Replace the igniter tips.
35. Change the filename (usually just the test number) for the next test and change any testing parameters desired, such as pressures, flow rates, etc.
36. Repeat TESTING procedure.
Shutdown
37. Allow the chamber to cool down somewhat.
38. Close the GH2 bottle.
39. Close the oxidizer ball valve at the lab wall if using GO2. Close the Air bottles if using Air.
40. Open the propellant solenoid valves to allow the high-pressure propellants to purge out of the propellant feed lines.
41. Close the GO2 bottles if using GO2.
42. Skip to Step 45 if not purging propellant lines with N2.
If purging propellant lines with N2:
43. With the propellant solenoid valves opened, turn the ball valves connecting the N2 line to the propellant lines to the OPEN position, allowing the N2 to purge through the propellant lines into the chamber.
44. Once sufficiently purged, return the ball valves to the CLOSED position.
45. Close the N2 bottle.
46. Shut off the propellant solenoid valves.
47. Open the N2 solenoid valve to purge the remaining nitrogen out of the system, then shut it off.

119
48. Disconnect power to the electronics system.
Assembly Instructions
Injector
1. Place the fuel baffle piece/oxidizer tube support and spacer sleeve onto the oxidizer nozzle tube such that the sleeve butts up against the back of the oxidizer nozzle and the fuel baffle/oxidizer tube support butts up against the sleeve.
2. Slide oxidizer nozzle/tube down into the injector housing so that the tube protrudes through the Swagelok fitting on the back of the injector housing and the fuel baffle/oxidizer tube support is pressed into the injector housing, centering the oxidizer nozzle/tube in the injector housing.
3. Place o-ring (2-016 V1164-75) down into the fuel annulus socket on the injector housing block and into the o-ring groove.
4. Screw the fuel annulus down into the socket on the injector housing block using the tool holes on the fuel annulus face to tighten it down firmly against the o-ring. The grooves cut the fuel annulus face and the injector housing block face (for placement of injector face thermocouples) should line up when correctly assembled.
5. Tighten the oxidizer nozzle/tube using a Teflon ferule in the Swagelok fitting so that the nozzle tip is at the desired protrusion/recession from the injector face.
6. Attach the oxidizer and fuel extension lines onto the corresponding ports on the back of the injector housing.
7. Insert the injector face thermocouples and behind injector thermocouple through the flange of the injector housing and seal. Fix the thermocouples to the desired location on the injector face using glue.
Chamber Windows or Copper Inserts and Heat Flux Sensors
8. Clean window/copper insert socket thoroughly.
9. Place two o-rings (2-022 V1475-75) into the radial o-ring grooves in the socket.
10. Wipe WD-40 on the o-rings and socket walls and around the circumference of the windows/copper inserts.
11. Set the window/insert into the socket (stepped and beveled edge towards inside of chamber) such that it rests level on top of the first o-ring.
12. Place the window flange on top of the window insert, loosely tightening a nut/washer on all 6 bolts.

120
13. Tighten the flange down, pushing the window/insert into the socket. Make sure to tighten the flange down evenly so that the window/insert goes in straight and not crooked, which can break the windows.
14. Once the flange is tightened down to the wall, carefully loosen the flange (again evenly) and remove.
15. Place rubber gasket or copper washer on top of window/insert and retighten the flange with the gasket or washer sandwiched between the flange and the window/insert. Be careful not to over tighten when using the copper washer with the window, as surface imperfections in either piece can result in a cracked window. Remember that the sealing is provided by the radial o-rings. The flange and gasket/washer just keep the window from being pressed out during tests.
16. Repeat for all four sides of the chamber.
17. Place heat flux sensors in the heat flux sensor ports in the chamber wall. Use RTV sealant to hold them in place.
18. Clean the inside surface of the chamber.
Injector/Chamber Assembly
19. Screw 4 ¼-20 pieces of threaded rod into the tapped holes on the chamber inlet surface.
20. Place the desired injector spacer corresponding to the desired injector position (IP1, IP2, IP3) on the chamber inlet surface, using an o-ring (2-030 V1164-75) in the o-ring groove at each end of the injector spacer, so that the spacer is contained within the ¼-20 threaded rods.
21. Place the injector assembly such that the injector housing block slides through the injector spacer and into the chamber, the flange of the injector housing squeezes the injector spacer between itself and the chamber inlet surface, and the ¼-20 threaded rod passes through the holes on the flange of the injector housing.
22. Slide the extension stem sleeves (cut tubing that is numbered 1-8) over the threaded rod and down onto the backside of the injector housing flange according to the following table. These allow the window height to be the same relative to the optical equipment no matter what the injector position is.
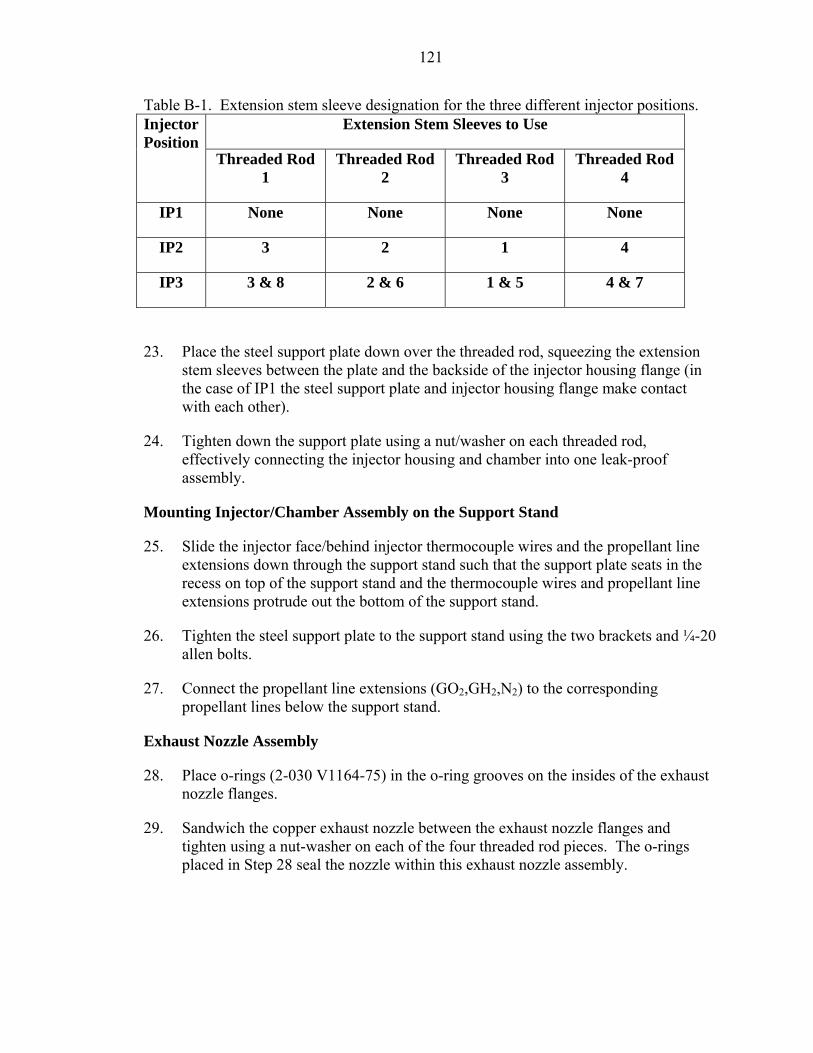
121
Table B-1. Extension stem sleeve designation for the three different injector positions. Extension Stem Sleeves to Use Injector
Position Threaded Rod
1 Threaded Rod
2 Threaded Rod
3 Threaded Rod
4
IP1 None None None None
IP2 3 2 1 4
IP3 3 & 8 2 & 6 1 & 5 4 & 7
23. Place the steel support plate down over the threaded rod, squeezing the extension stem sleeves between the plate and the backside of the injector housing flange (in the case of IP1 the steel support plate and injector housing flange make contact with each other).
24. Tighten down the support plate using a nut/washer on each threaded rod, effectively connecting the injector housing and chamber into one leak-proof assembly.
Mounting Injector/Chamber Assembly on the Support Stand
25. Slide the injector face/behind injector thermocouple wires and the propellant line extensions down through the support stand such that the support plate seats in the recess on top of the support stand and the thermocouple wires and propellant line extensions protrude out the bottom of the support stand.
26. Tighten the steel support plate to the support stand using the two brackets and ¼-20 allen bolts.
27. Connect the propellant line extensions (GO2,GH2,N2) to the corresponding propellant lines below the support stand.
Exhaust Nozzle Assembly
28. Place o-rings (2-030 V1164-75) in the o-ring grooves on the insides of the exhaust nozzle flanges.
29. Sandwich the copper exhaust nozzle between the exhaust nozzle flanges and tighten using a nut-washer on each of the four threaded rod pieces. The o-rings placed in Step 28 seal the nozzle within this exhaust nozzle assembly.

122
Chamber Extension, Exhaust Nozzle, Exhaust Tube Attachments
30. Screw 4 ¼-20 threaded rod pieces into the tapped holes on the outlet face of the combustion chamber (on top in current orientation).
31. Slide desired chamber extensions down threaded rod and mate with chamber or extension surface, using an o-ring (2-030 V1164-75) in the o-ring groove of the extensions to seal between the flat face of the chamber or extension backside and the grooved face of the next extension.
32. The permanent chamber extension (extension with igniter, pressure transducers, thermocouple, and over-pressure valve) is always attached farthest away from the injector and closest to the exhaust nozzle, meaning that all other extensions are placed before it. It is sealed against the other extensions or chamber outlet face using the same o-ring described for the other extensions.
33. The exhaust nozzle assembly is then placed over the threaded rod against the permanent chamber extension and is sealed with the same o-ring described for the chamber extensions.
34. Place an o-ring (2-030 V1164-75) into the o-ring groove on the backside (top) of the exhaust nozzle assembly.
35. Place the exhaust nozzle thermocouple down into the hole on the backside of the exhaust nozzle.
36. Place the exhaust tube over the threaded rod on top of the exhaust nozzle assembly, allowing the exhaust nozzle thermocouple sheath to sit in the groove cut on the exhaust tube flange.
37. Tighten the exhaust tube down on the exhaust nozzle assembly and chamber extensions using a nut/washer on each threaded rod, effectively sealing the chamber together.
DAQ Sensor, Igniter, and Over-pressure Valve Attachment
38. Attach the high-frequency pressure transducer to the branch off of the permanent chamber extension.
39. Attach the over-pressure relief valve to the other branch off of the same “T” connector.
40. Slide igniter through the Swagelok fitting on the permanent chamber extension into the chamber and tighten using a Teflon ferule at the indicated point on the ceramic insulator of the igniter.
41. Connect all thermocouples (including those comprising the heat flux sensors) to the thermocouple extension cables marked with DAQ channels according to the

123
following table. Note that each heat flux sensor uses two channels (two thermocouples, one long, one short). Also note that the exhaust nozzle thermocouple should always use the channel immediately available after final heat flux sensor channel for data processing purposes.
Table B-2. List of DAQ channel/thermocouple usage. Thermocouple DAQ Channel
Chamber/Flame Thermocouple 0
Injector Face Thermocouple Long (ITL)
1
Injector Face Thermocouple Short (ITS)
2
Behind Injector Thermocouple (BIT) 3
Heat Flux Sensor N Long Thermocouple
4 + (2N-2) [will always be even]
Heat Flux Sensor N Short Thermocouple
5 + (2N-2) [will always be odd]
Exhaust Nozzle Thermocouple 5 + (2N-2) + 1
Disassembly
42. Reverse assembly instructions to disassemble the combustor, ignoring unnecessary steps depending on particular disassembly goal.

124
APPENDIX C CALIBRATION CURVES AND EQUATIONS
Metering/Needle Valve Cv Calibration
The following Cv calibration curves and equations were taken from Swagelok’s
data sheets for the corresponding valves. Data points were picked from the graphs
Swagelok provided and a plot was made in Excel. Curve fitting was used to obtain an
equation for Cv versus Number of Turns for each of the valves used in the HPCF. R-
squared values have been presented too for uncertainty analysis purposes. The equations
are used in the Labview program to calculate the mass flow rates of the propellants
during the combustion tests.
S Series Swagelok Metering Valve
The following calibration curve and Equation C.1 is for the B-SS4 and SS-SS4-VH
metering valves.

125
y = -3E-06x3 + 8E-05x2 - 9E-05x + 0.0001R2 = 0.9995
00.0005
0.0010.00150.002
0.00250.003
0.0035
0.0040.0045
0 2 4 6 8 10 12
Cv
Number of Turns
Figure C-1. Calibration curve (Cv versus number of turns) for the B-SS4 and SS-SS4-VH
metering valves.
3 20.000003 0.00008 0.00009 0.0001vC x x x= + − + (C.1)
where x is the number of turns on the metering valve.
31 Series Swagelok Metering Valve
The following calibration curve and Equation C.2 is for the SS-31RS4 and SS-
31RF4 metering valves.

126
y = 0.0038x - 0.0039R2 = 1
y = 0.0002x3 - 0.0004x2 + 0.0023xR2 = 1
y = 0.0074x2 - 0.1309x + 0.6103R2 = 0.9911
0
0.005
0.01
0.015
0.02
0.025
0.03
0.035
0.04
0.045
0 2 4 6 8 10 12
Number of Turns
Cv
Figure C-2. Calibration curve (Cv versus number of turns) for the SS-31RS4 and SS-
31RF4 metering valves.
( )( )( )
2
3 2
0.0074 0.1309 0.6103 0 3.0
0.0038 0.0039 3.0 8.9
0.0002 0.0004 0.0023 8.9 10v
x x x
C x x
x x x x
⎧ − + ≤ <⎪
= − ≤ ≤⎨⎪ + − < ≤⎩
(C.2)
where x is the number of turns on the metering valve.
1 Series Integral-Bonnet Needle Valve
The following calibration curve and Equation C.3 is for the SS-1RS4 needle valve,
which has a 0.172 inch orifice.
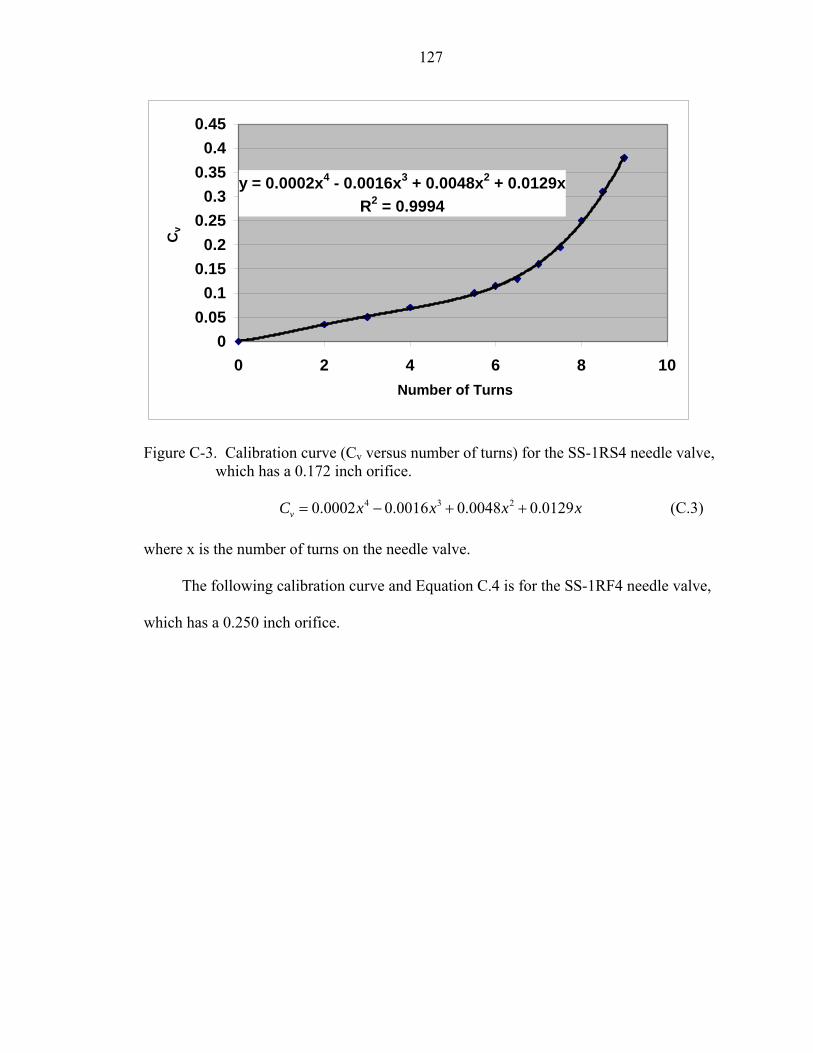
127
y = 0.0002x4 - 0.0016x3 + 0.0048x2 + 0.0129xR2 = 0.9994
00.05
0.10.15
0.20.25
0.30.35
0.40.45
0 2 4 6 8 10
Cv
Number of Turns
Figure C-3. Calibration curve (Cv versus number of turns) for the SS-1RS4 needle valve,
which has a 0.172 inch orifice.
4 3 20.0002 0.0016 0.0048 0.0129vC x x x x= − + + (C.3)
where x is the number of turns on the needle valve.
The following calibration curve and Equation C.4 is for the SS-1RF4 needle valve,
which has a 0.250 inch orifice.
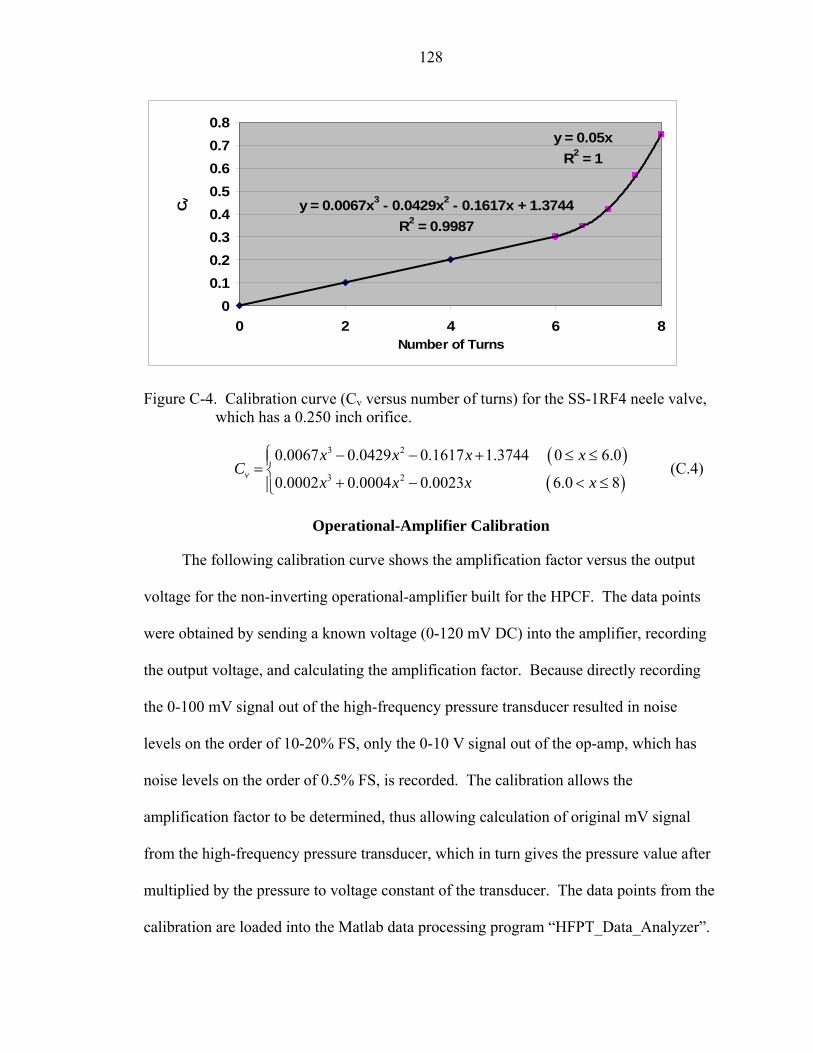
128
y = 0.05xR2 = 1
y = 0.0067x3 - 0.0429x2 - 0.1617x + 1.3744R2 = 0.9987
00.10.20.30.40.50.60.70.8
0 2 4 6 8
C v
Number of Turns
Figure C-4. Calibration curve (Cv versus number of turns) for the SS-1RF4 neele valve,
which has a 0.250 inch orifice.
( )( )
3 2
3 2
0.0067 0.0429 0.1617 1.3744 0 6.0
0.0002 0.0004 0.0023 6.0 8v
x x x xC
x x x x
⎧ − − + ≤ ≤⎪= ⎨+ − < ≤⎪⎩
(C.4)
Operational-Amplifier Calibration
The following calibration curve shows the amplification factor versus the output
voltage for the non-inverting operational-amplifier built for the HPCF. The data points
were obtained by sending a known voltage (0-120 mV DC) into the amplifier, recording
the output voltage, and calculating the amplification factor. Because directly recording
the 0-100 mV signal out of the high-frequency pressure transducer resulted in noise
levels on the order of 10-20% FS, only the 0-10 V signal out of the op-amp, which has
noise levels on the order of 0.5% FS, is recorded. The calibration allows the
amplification factor to be determined, thus allowing calculation of original mV signal
from the high-frequency pressure transducer, which in turn gives the pressure value after
multiplied by the pressure to voltage constant of the transducer. The data points from the
calibration are loaded into the Matlab data processing program “HFPT_Data_Analyzer”.
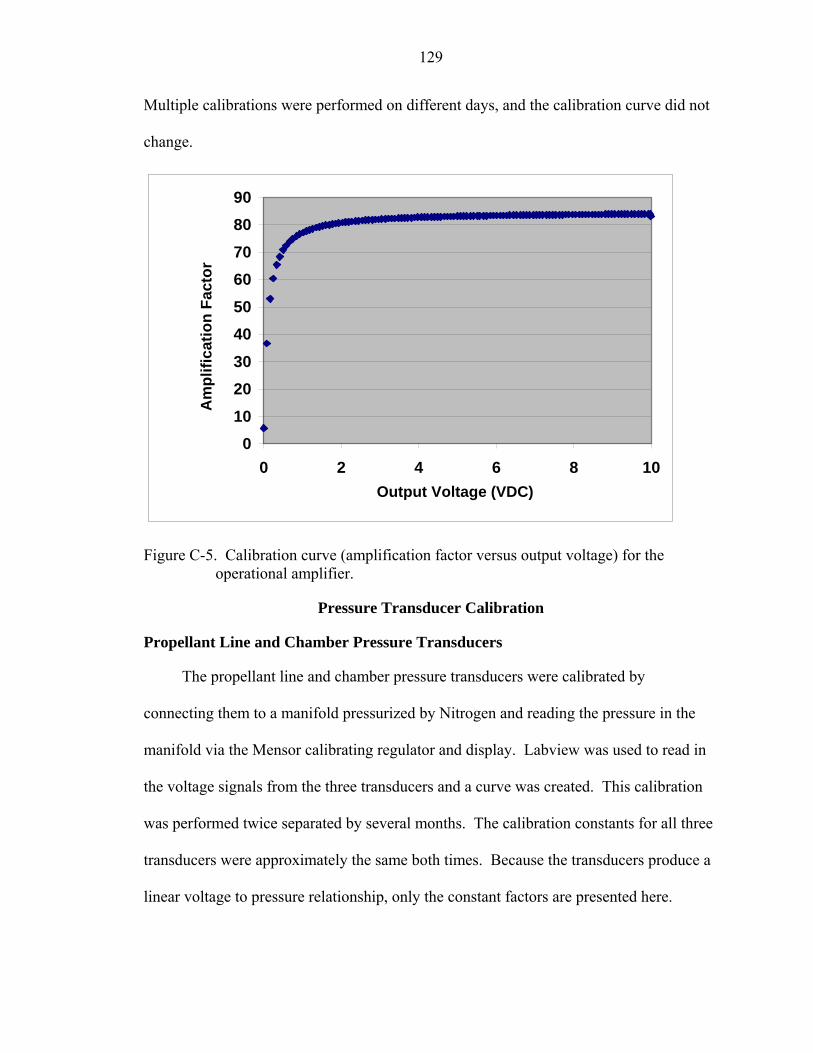
129
Multiple calibrations were performed on different days, and the calibration curve did not
change.
0102030405060708090
0 2 4 6 8 10Output Voltage (VDC)
Am
plifi
catio
n Fa
ctor
Figure C-5. Calibration curve (amplification factor versus output voltage) for the
operational amplifier.
Pressure Transducer Calibration
Propellant Line and Chamber Pressure Transducers
The propellant line and chamber pressure transducers were calibrated by
connecting them to a manifold pressurized by Nitrogen and reading the pressure in the
manifold via the Mensor calibrating regulator and display. Labview was used to read in
the voltage signals from the three transducers and a curve was created. This calibration
was performed twice separated by several months. The calibration constants for all three
transducers were approximately the same both times. Because the transducers produce a
linear voltage to pressure relationship, only the constant factors are presented here.

130
Table C-1. Table of calibration factors for the chamber and propellant line pressure transducers.
Pressure Transducer Calibration Factor (PSIG/Voltage)
Combustion Chamber
605.105
Oxidizer Line 618.425
Fuel Line 606.421
High-Frequency Pressure Transducer
Each Entran high-frequency pressure transducer came calibrated with a constant
mV/FS value. The transducers were calibrated in the combustion lab as well and gave a
value approximately equal to the constant calibration factor supplied by Entran. Since
there are several transducers and the indicated calibration factor on the box is correct, the
values will not be listed here due to their short lifetime.

131
LIST OF REFERENCES
1. Tucker, K., West, J., Williams, R., Lin, J., Rocker, M., Canabal, F., Robles, B., and Garcia, R., “Using CFD as a Rocket Injector Design Tool: Recent Progress at Marshall Space Flight Center,” 5th International Symposium on Liquid Space Propulsion (CD-ROM), Chattanooga, TN, 2003.
2. Tramecourt, N., Masquelet, M., and Menon, S., “Large-Eddy Simulation of Unsteady Wall Heat Transfer in a High Pressure Combustion Chamber,” AIAA-2005-4124, 41st AIAA/ASME/SAE/ASEE Joint Propulsion Conference and Exhibit, Tuscon, AZ, 2005.
3. Marshall, W. M., Pal, S., Woodward, R. D., and Santoro, R. J., “Benchmark Wall Heat Flux Data for a GO2/GH2 Single Element Combustor”, AIAA 2005-3572, 41st AIAA/ASME/SAE/ASEE Joint Propulsion Conference and Exhibit, Tuscon, AZ, 2005.
4. Allen, M. G. and Miller, M. F., “Optically-Accessible Gas Turbine Combustor for High Pressure Diagnostics Validation,” AIAA 97-0116, AIAA 35th Aerospace Sciences Meeting, Reno, NV, 1997.
5. Kojima, J. and Nguyen, Q-V., “Development of a High-Pressure Burner for Calibrating Optical Diagnostic Techniques,” NASA/TM-2003-212738, Glenn Research Center, Cleveland, OH, 2003.
6. Carter, C. D., King, G. B., and Laurendeau, N. M., “A Combustion Facility for High-Pressure Flame Studies by Spectroscopic Methods,” American Institute of Physics, Review of Scientific Instruments, Vol. 60, No. 8, August, 1989, pp. 2606-2609.
7. Locke, R. J., Hicks, Y. R., Anderson, R. C., and Ockunzzi, K. A., “OH Imaging in a Lean Burning High-Pressure Combustor,” AIAA Journal, Vol. 34, No. 3, March 1996, pp. 622-624.
8. Foust, M. J., Deshpande, M., Pal, S., Ni, T., Merkle, C. L., Santoro, R. J., “Experimental and Analytical Characterization of a Shear Coaxial Combusting GO2/GH2 flowfield,” AIAA 96-0646, AIAA 34th Aerospace Sciences Meeting, Reno, NV, 1996.

132
9. Tucker, P. K., Klem, M. D., Smith, T. D., Farhangi, S., Fisher, S. C., and Santoro, R. J., “Design of Efficient GO2/GH2 Injectors: A NASA, Industry, and University Cooperative Effort,” AIAA-1997-3350, 33rd AIAA/ASME/SAE/ASEE Joint Propulsion Conference and Exhibit, Seattle, WA, 1997.
10. Ferraro, M., Kujala, R. J., Thomas, J.-L., Glogowski, M. J., and Micci, M. M., “Measurements of Shear Coaxial Injector Sprays – Cold Flow and Hot Fire Experiments,” AIAA 96-3028, 32nd AIAA/ASME/SAE/ASEE Joint Propulsion Conference and Exhibit, Lake Buena Vista, FL, 1996.
11. Kohse-Hoinghaus, K. and Jeffries, J. B., Applied Combustion Diagnostics, Combustion: An International Series, Taylor and Francis, New York, 2002.
12. Eckbreth, A. C., Laser Diagnostics for Combustion Temperature and Species, 2nd ed., Combustion Science and Technology Book Series, Vol. 3, CRC, New York, 1996.
13. Santoro, R. J., “Applications of Laser-Based Diagnostics to High Pressure Rocket and Gas Turbine Combustor Studies,” AIAA-1998-2698, 20th Advanced Measurement and Ground Testing Technology Conference, Albuquerque, NM, 1998.
14. Frank, J. H., Miller, M. F., and Allen, M. G., “Imaging of Laser-Induced Fluorescence in a High-Pressure Combustor,” AIAA-99-0773, AIAA 34th Aerospace Sciences Meeting, Reno, NV, 1999.
15. Edwards, T., Weaver, D. P., and Campbell, D. H., “Laser-Induced Fluorescence in High Pressure Solid Propellant Flames,” Applied Optics, Vol. 26, No. 17, September, 1987, pp. 3496-3509.
16. Arnold, A., Bombach, R., Kappeli, B., and Schlegel, A., “Quantitative Measurements of OH Concentration Fields by Two-Dimensional Laser-Induced Fluorescence,” Applied Physics B: Laser and Optics, Vol. 64, 1997, pp. 579-583.
17. Atakan, B., Heinze, J., and Meier, U. E., “OH Laser-Induced Fluorescence at High Pressures: Spectroscopic and Two-Dimensional Measurements Exciting the A-X (1,0) Transition,” Applied Physics B: Laser and Optics, Vol. 64, 1997, pp. 585-591.
18. Allen, M. G., McManus, K. R., Sonnenfroh, D. M., and Paul, P. H., “Planar Laser-Induced-Fluorescence Imaging Measurements of OH and Hydrocarbon Fuel Fragments in High-Pressure Spray-Flame Combustion,” Applied Optics, Vol. 34, No. 27, September, 1995, pp. 6287-6300.
19. Stocker, R., Karl, J., and Hein, D., “OH LIF in Atmospheric Pressure Flames Excited by a Tunable OPO (Type II) Laser System,” F3003, Proceedings of PSFVIP-3, Maui, HI, 2001.

133
20. Singla, G., Scouflaire, P., Rolon, C., and Candel, S., “Planar Laser-Induced Fluorescence of OH in High-Pressure Cryogenic LOx/GH2 Jet Flames,” Combustion and Flame, Vol. 144, 2006, pp. 151-169.
21. Reynolds, W. C., STANJAN, a reaction chemistry computer program, Stanford University, 1987.
22. Turns, S. R., An Introduction to Combustion: Concepts and Applications, 2nd ed., McGraw-Hill, Boston, 2000.
23. Holman, J. P., Heat Transfer, 9th ed., McGraw-Hill, Boston, 2002.
24. Callister, W. D., Jr., Materials Science and Engineering: An Introduction, 5th ed., Wiley, New York, 2000.
25. Deshpande, M. and Merkle, C. L., “Characterization of Unsteady Effects in GO2/GH2 Combustor Flowfields,” AIAA-1996-3128, 32nd AIAA/ASME/SAE/ASEE Joint Propulsion Conference and Exhibit, Lake Buena Vista, FL, 1996.
26. Sutton, G. P. and Biblarz, O., Rocket Propulsion Elements, 7th ed., Wiley-Interscience, New York, 2001.
27. Kim, S.C. and VanOverbeke, T. J., “Performance and Flow Calculations for a Gaseous H2/O2 Thruster,” AIAA J. Spacecraft, Vol. 28, No. 4, July-August, 1991, pp. 433-438.
28. Bazarov, V. G. and Yang, V., “Liquid-Propellant Rocket Engine Injector Dynamics,” Journal of Propulsion and Power, Vol. 14, No. 5, September-October, 1998, pp. 797-806.
29. Dahm, W. J. A. and Dimotakis, P. E., “Measurements of Entrainment and Mixing in Turbulent Jets,” AIAA Journal, Vol. 25, No. 9, September, 1987, pp. 1216-1223.
30. Yeralan, S., Pal, S., and Santoro, R. J., “Major Species and Temperature Profiles of LOX/GH2 Combustion,” AIAA-1997-2974, 33rd AIAA/ASME/SAE/ASEE Joint Propulsion Conference and Exhibit, Seattle, WA, 1997.

134
BIOGRAPHICAL SKETCH
Alex Conley was born in Lafayette, LA, in 1982, but grew up in Sylacauga, AL.
Careful balance of academics and sports landed Alex a scholarship to the University of
Miami in 2000. Alex spent four years in Miami enjoying the big city life, the beach, and
friends, while managing to graduate number two in his graduating class in May 2004
with B.S. in Mechanical Engineering. Alex met the love of his life, Wendy, through his
antics on and off the rugby field while at Miami. Alex joined the Combustion Lab at the
University of Florida in August 2004, where his wife, Wendy, began attending the School
of Veterinary Medicine a year earlier. Alex has balanced husbandly duties, his dogs, his
love of motorcycles, school, and research during his pursuit of a master’s degree over the
past two years. Upon graduation Alex will move to Huntsville, AL, where he has been
offered and accepted a position as a Combustion Engineer for the aerospace research
company CFDRC. He will be doing contract work on the upper stage of the CLV at
NASA Marshall. He looks forward to being back in good ole Alabama.