Embed Size (px)
Citation preview

ISSN: 0973-4945; CODEN ECJHAO
E-Journal of Chemistry
http://www.e-journals.net 2009, 6(1), 53-60
High Performance Liquid Chromatography
Method for Determination of Trace Amount
of Ibutilide Fumarate in Pharmaceutical
Manufacturing Environments
M. SATYA BABU*, PRATHAMA S. MAINKAR and Y.ANJANEYULU
Sai Advantium Pharma Limited (SAP Limited),
LB Nagar, Hyderabad,
Andhra Pradesh, India. [email protected]
Received 3 June 2008; Accepted 14 July 2008
Abstract: A rapid and sensitive RP-HPLC method with UV detection at
227 nm for routine analysis of washed MLs (mother liquors) from equipment
after manufacturing and thereby cleaning of ibutilide fumarate active
pharmaceutical ingredient was developed. Chromatography was performed
with mobile phase containing a mixture of aqueous 0.01 M potassium
dihydrogen phosphate (KH2PO4) and acetonitrile. The gradient elution was
developed for better and optimized results. The developed method was
validated for precision which includes system precision and method precision,
accuracy, intra-day and using different system and finally linearity studies from
0.4 to 150%. The method is ascertained to be having good repeatability and
reproducibility. The %RSD for method precision (5 different preparations at
test concentration) was observed to be 1.36, wherein the system precision (6
repeated injections of same preparation) was observed to be 0.33. The %
recovery from ‘Accuracy’ studies yielded the recovery of 99-100% which
indicates the capability of the method. The linearity of the method was studied
right from 0.4 to 150% which shows the method is quite linear with a
correlation coefficient of 0.9998. The proposed method was simple, highly
sensitive, precise, and accurate.The retention time less than 15 min, indicated
that the method is useful for routine testing of washed MLs from equipment
after manufacturing and cleaning of ibutilide fumarate.
Keywords: Ibutilide fumarate, HPLC, Correlation coefficient, %RSD, Active Pharmaceutical
Ingredient, US FDA,
54 M. SATYA BABU et al.
Introduction
Ibutilide fumarate is an antiarrhythmic drug with predominantly class III (cardiac action
potential prolongation) properties according to the Vaughan Williams Classification. The
drug is available in the market as injection wherein each milliliter of injection contains 0.1
mg of ibutilide fumarate (equivalent to 0.087 mg ibutilide free base), 0.189 mg sodium
acetate trihydrate, 8.90 mg sodium chloride, hydrochloric acid to adjust pH to approximately
4.6 and water for injection. The ibutilide injections are available with the brand name of
“COVERT” manufactured and distributed by Pharmacia Upjohn.
The chemical name for ibutilide fumarate is methanesulfonamide, N-{4-{4-(ethylheptyl
amino)-1 -hydroxybutyl} phenyl}, (+)(-), (E)-2-butenedioate (1:0.5) (hemifumarate salt). Its
molecular formula is C22H38N2O5S, and its molecular weight is 442.62. Ibutilide fumarate is
a white to off-white powder with an aqueous solubility of over 100 mg/mL at pH 7 or lower.
The structural formula is depicted below:
Ibutilide fumarate
In the pharmaceutical manufacturing environment, cleaning of equipment plays a vital
role where the assurance of carry over of previous product has to be within the regulatory
acceptable limits. i.e., calculation of maximum allowable carryover (MAC) and there by
applying the MAC to calculate allowable limit for rinse and swab sampling etc. The drug
regulatory agencies, for example, US FDA, are very keen and particular about the capability
of analytical method in terms of sensitivity, limit of detection, accuracy and precision.
So far, only the determination of ibutilide from human plasma using LC-tandem mass
spectrometry1 and assaying of enantiomers of ibutilide and artilide using solid-phase extraction,
derivatization and achiral-chiral column switching high performance liquid Chromatography2
have been described in literature. However, no procedure has been described for the
determination of API at low levels (at ppm level) accurately and within the linear range. Hence,
it was felt necessary to develop a liquid chromatographic procedure which would serve as a rapid
and reliable method for determination of ibutilide fumarate at trace levels (even at 1 ppm).
In this work we have developed a selective and sensitive RP-High Performance Liquid
Chromatography method which can conveniently detect the lowest possible amount of
0.001% of ibutilide in the equipment cleaning MLs with a good sensitivity, selectivity,
repeatability and reproducibility.
Experimental Materials and reagents
Ibutilide fumarate API was synthesized by a well known API/CRO company using the
generic process developed and established by the same firm. The HPLC purity of the
selected test sample is higher than the 99.9%. A laboratory reagent grade Potassium
dihydrogen phosphate was procured from ‘Qualigens’ for which the reported assay is 99.5%.
Additionally, the laboratory grade acetonitrile used in this experimentation was obtained
from ‘Merck’ for which the purity is reported to be 99.8%

HPLC Method for Determination of Ibutilide Fumarate 55
Chromatographic conditions and Instrumentation
The RP-High Performance Liquid Chromatography was carried out on ‘Waters’ Liquid
Chromatograph model 2695 equipped with quaternary pump, Photo Diode Array detector
(PDA, waters # 2996), column oven and auto sampler. The output signal was monitored and
integrated using ‘Empower 2’ software.
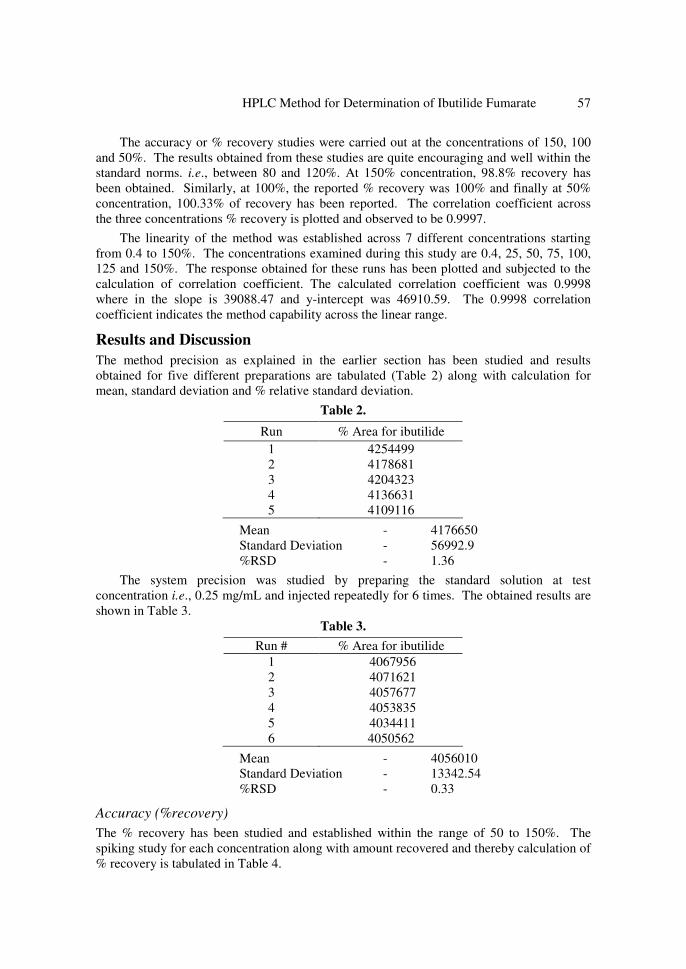
Symmetry C8 column with 250 mm length and 4.6 mm dia with 5 µ particle size has been
optimized to obtain the best possible results. The other columns tried for development of this
method are, Inertsil C8 250 x 4.6 mm, 5 µ and YMC C8 250 x 4.6 mm, 5 µ (Figure 3). A mixture
of 0.01 M potassium dihydrogen phosphate (KH2PO4) in water and acetonitrile was used as
mobile phase. The gradient elution program has been developed and optimized for better, accurate
and consistent results. The gradient program developed for this method is depicted below
Time Solvent B % (Acetonitrile)
0 25
5 25
15 90
20 90
25 25
30 25
The optimized flow rate was 1.0 mL/min and the detection was at 227 nm. The UV
absorbance spectrum is depicted in Figure 1.
No. Wavelength Absorbance Description
1 227.00 0.361
Figure 1. UV absorbance spectrum for ibutilide fumarate.
56 M. SATYA BABU et al.
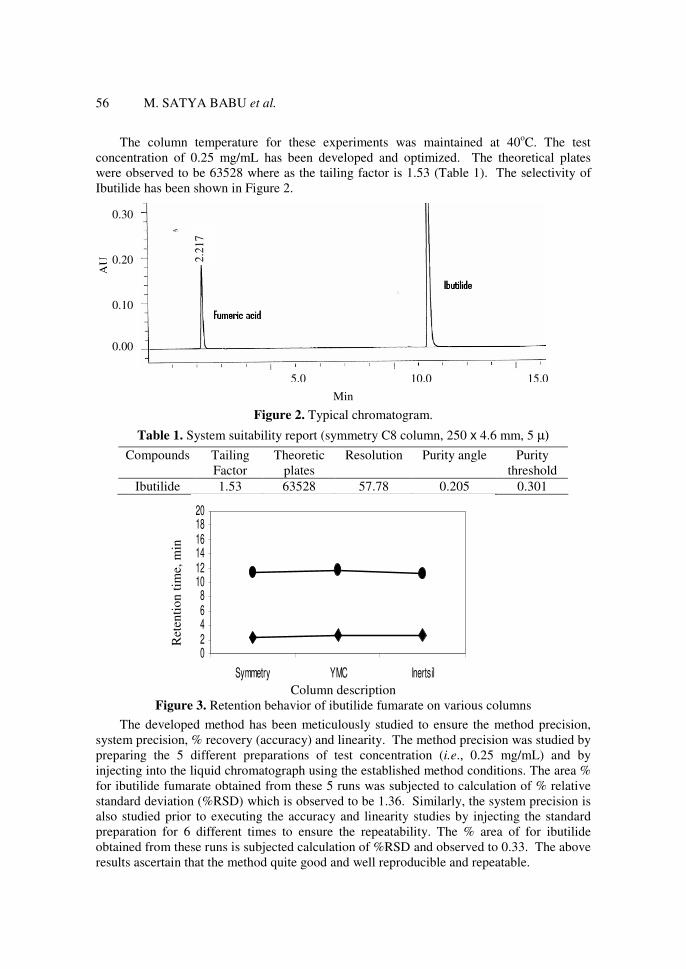
The column temperature for these experiments was maintained at 40oC. The test
concentration of 0.25 mg/mL has been developed and optimized. The theoretical plates
were observed to be 63528 where as the tailing factor is 1.53 (Table 1). The selectivity of
Ibutilide has been shown in Figure 2.
Min
Figure 2. Typical chromatogram.
Table 1. System suitability report (symmetry C8 column, 250 x 4.6 mm, 5 µ)
Compounds Tailing
Factor
Theoretic
plates
Resolution Purity angle Purity
threshold
Ibutilide 1.53 63528 57.78 0.205 0.301
02468
101214161820
Symmetry YMC Inertsil Column description
Figure 3. Retention behavior of ibutilide fumarate on various columns
The developed method has been meticulously studied to ensure the method precision,
system precision, % recovery (accuracy) and linearity. The method precision was studied by
preparing the 5 different preparations of test concentration (i.e., 0.25 mg/mL) and by
injecting into the liquid chromatograph using the established method conditions. The area %
for ibutilide fumarate obtained from these 5 runs was subjected to calculation of % relative
standard deviation (%RSD) which is observed to be 1.36. Similarly, the system precision is
also studied prior to executing the accuracy and linearity studies by injecting the standard
preparation for 6 different times to ensure the repeatability. The % area of for ibutilide
obtained from these runs is subjected calculation of %RSD and observed to 0.33. The above
results ascertain that the method quite good and well reproducible and repeatable.
5.0 10.0 15.0
0.30
0.20
0.10
0.00
AU
2.2
17
Ret
enti
on
tim
e, m
in
HPLC Method for Determination of Ibutilide Fumarate 57
The accuracy or % recovery studies were carried out at the concentrations of 150, 100
and 50%. The results obtained from these studies are quite encouraging and well within the
standard norms. i.e., between 80 and 120%. At 150% concentration, 98.8% recovery has
been obtained. Similarly, at 100%, the reported % recovery was 100% and finally at 50%
concentration, 100.33% of recovery has been reported. The correlation coefficient across
the three concentrations % recovery is plotted and observed to be 0.9997.
The linearity of the method was established across 7 different concentrations starting
from 0.4 to 150%. The concentrations examined during this study are 0.4, 25, 50, 75, 100,
125 and 150%. The response obtained for these runs has been plotted and subjected to the
calculation of correlation coefficient. The calculated correlation coefficient was 0.9998
where in the slope is 39088.47 and y-intercept was 46910.59. The 0.9998 correlation
coefficient indicates the method capability across the linear range.
Results and Discussion
The method precision as explained in the earlier section has been studied and results
obtained for five different preparations are tabulated (Table 2) along with calculation for
mean, standard deviation and % relative standard deviation.
Table 2.
Run % Area for ibutilide
1 4254499
2 4178681
3 4204323
4 4136631
5 4109116
Mean - 4176650
Standard Deviation - 56992.9
%RSD - 1.36
The system precision was studied by preparing the standard solution at test
concentration i.e., 0.25 mg/mL and injected repeatedly for 6 times. The obtained results are
shown in Table 3.
Table 3.
Run # % Area for ibutilide
1 4067956
2 4071621
3 4057677
4 4053835
5 4034411
6 4050562
Mean - 4056010
Standard Deviation - 13342.54
%RSD - 0.33
Accuracy (%recovery)
The % recovery has been studied and established within the range of 50 to 150%. The
spiking study for each concentration along with amount recovered and thereby calculation of
% recovery is tabulated in Table 4.
58 M. SATYA BABU et al.
Table 4.
Description 150% 100% 50%
Wt of sample taken 37.12 mg 25.02 mg 12.28 mg
Run 1 (area) 6181769 4244748 2085212
Run 2 (area) 6187764 4208639 2071999
Run 3 (area) 6257371 4255503 2101303
Mean area 6208968 4236297 2086171
St. deviation 42025.3 24548.5 14675.5
%RSD 0.68 0.58 0.70
Amount Recovered 36.6708 mg 25.0200 mg 12.3211 mg
% Recovery 98.8% 100.0 % 100.3%
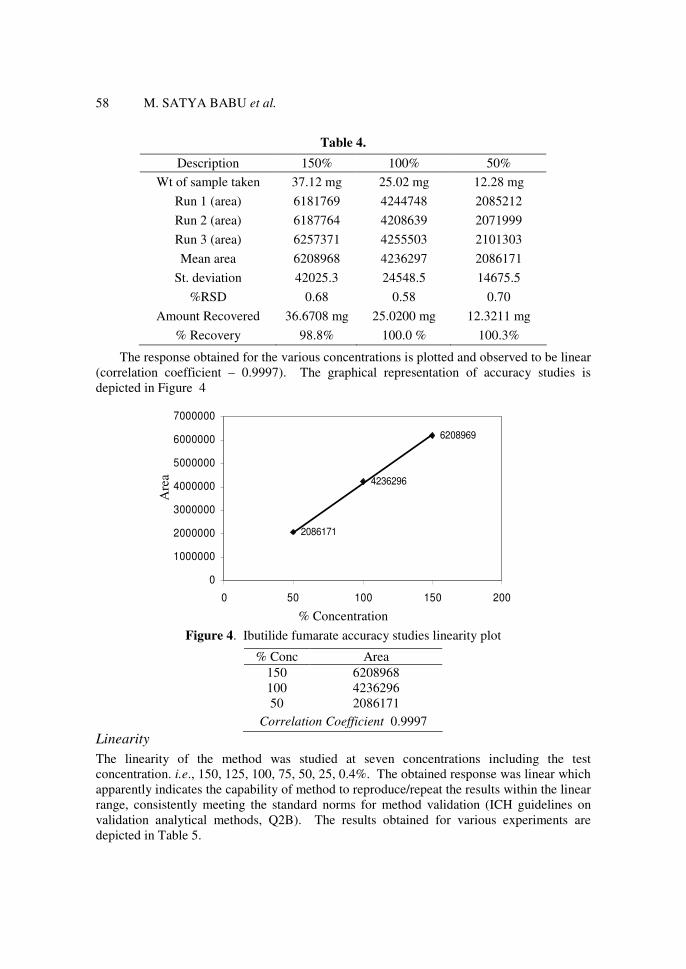
The response obtained for the various concentrations is plotted and observed to be linear
(correlation coefficient – 0.9997). The graphical representation of accuracy studies is
depicted in Figure 4
6208969
4236296
2086171
0
1000000
2000000
3000000
4000000
5000000
6000000
7000000
0 50 100 150 200
% Concentration
Figure 4. Ibutilide fumarate accuracy studies linearity plot
Linearity
The linearity of the method was studied at seven concentrations including the test
concentration. i.e., 150, 125, 100, 75, 50, 25, 0.4%. The obtained response was linear which
apparently indicates the capability of method to reproduce/repeat the results within the linear
range, consistently meeting the standard norms for method validation (ICH guidelines on
validation analytical methods, Q2B). The results obtained for various experiments are
depicted in Table 5.
% Conc Area
150 6208968
100 4236296
50 2086171
Correlation Coefficient 0.9997
Are
a

HPLC Method for Determination of Ibutilide Fumarate 59
Table 5.
Description 150% 125% 100% 75% 50% 25% 0.4%,10
ppm
Run 1 (area) 5868003 4908454 3975013 3002320 2009878 1033565 16634
Run 2 (area) 5897040 4902367 3968418 3038337 2030476 1027204 16311
Run 3 (area) 5899360 4907563 3971339 3042297 2042955 1022749 16094
Mean area 5888134 4906128 3971590 3027651 2027770 1027839 16346
Std
deviation 17472.8 3287.5 3304.6 22026.8 16703.7 5435.9 271.7
%RSD 0.2967 0.0670 0.0832 0.7275 0.8237 0.5289 1.6623
The response obtained for each of the concentration is plotted by taking %
concentration on x-axis and area on y-axis. The results are then subjected to calculation of
correlation coefficient after calculation of slope and y-intercept. The graphical
representation for linearity studies is depicted in Figure 5.
0
1000000
2000000
3000000
4000000
5000000
6000000
7000000
0 20 40 60 80 100 120 140 160
% Concentration
Figure 5. Ibutilide fumarate linearity studies plot
% Conc. Area
150 5888134
125 4906128
100 3971590
75 3027651
50 2027770
25 1027839
0.4 16346
Slope – 39088
y-intercept - 46910
Correlation coefficient 0.9998
Conclusions
The results obtained from these studies are well fit into the standard specifications stipulated
by the regulatory agencies. The method is able to reproduce the results consistently even at
10 ppm level and hence this can be conveniently used in the pharmaceutical manufacturing
environment for equipment cleaning certification.
Are
a

60 M. SATYA BABU et al.
References
1 Lei Tian, Yishi Li, Yiling Huand, Fuhua Kuang, Feiou Li and Li Hua. J
Chromatogr., 1998, 816(1-2), 81-85.
2 HSU C.-Y.L; Walgters R.R J Chromatogr., B, 1995, 667, 115-128.
3 Rodehamel J, "Cleaning and Maintenance," University of Wisconsin's Control
Procedures in Drug Production Seminar, 1966, July 17-22, pp 82-87 William
Blockstein, Editor, Published by the University of Wisconsin, L.O.C.#66-64234
4 Harder S W, Pharm Technol., 1984, 8(5), 29-34.
5 Fourman G L and Mullen M V, Pharm Technol., 1993, 17(4), 54-60.
6. Chapter <1225> Validation of Compendial Methods; US Pharmacopeia 23, United
States Pharmacopeial Convention, Inc., Rockville MD: 1994
7 Compliance program guidance manual, Food and drug administration, Guide to
inspection of validation of cleaning processes, July 1993.
8 International conference on Harmonization, (ICH) Q2B, Validation of Analytical
Procedures, Methodology, May 1997.

Submit your manuscripts athttp://www.hindawi.com
Hindawi Publishing Corporationhttp://www.hindawi.com Volume 2014
Inorganic ChemistryInternational Journal of
Hindawi Publishing Corporation http://www.hindawi.com Volume 2014
International Journal ofPhotoenergy
Hindawi Publishing Corporationhttp://www.hindawi.com Volume 2014
Carbohydrate Chemistry
International Journal of
Hindawi Publishing Corporationhttp://www.hindawi.com Volume 2014
Journal of
Chemistry
Hindawi Publishing Corporationhttp://www.hindawi.com Volume 2014
Advances in
Physical Chemistry
Hindawi Publishing Corporationhttp://www.hindawi.com
Analytical Methods in Chemistry
Journal of
Volume 2014
Bioinorganic Chemistry and ApplicationsHindawi Publishing Corporationhttp://www.hindawi.com Volume 2014
SpectroscopyInternational Journal of
Hindawi Publishing Corporationhttp://www.hindawi.com Volume 2014
The Scientific World JournalHindawi Publishing Corporation http://www.hindawi.com Volume 2014
Medicinal ChemistryInternational Journal of
Hindawi Publishing Corporationhttp://www.hindawi.com Volume 2014
Chromatography Research International
Hindawi Publishing Corporationhttp://www.hindawi.com Volume 2014
Applied ChemistryJournal of
Hindawi Publishing Corporationhttp://www.hindawi.com Volume 2014
Hindawi Publishing Corporationhttp://www.hindawi.com Volume 2014
Theoretical ChemistryJournal of
Hindawi Publishing Corporationhttp://www.hindawi.com Volume 2014
Journal of
Spectroscopy
Analytical ChemistryInternational Journal of
Hindawi Publishing Corporationhttp://www.hindawi.com Volume 2014
Journal of
Hindawi Publishing Corporationhttp://www.hindawi.com Volume 2014
Quantum Chemistry
Hindawi Publishing Corporationhttp://www.hindawi.com Volume 2014
Organic Chemistry International
Hindawi Publishing Corporationhttp://www.hindawi.com Volume 2014
CatalystsJournal of
ElectrochemistryInternational Journal of
Hindawi Publishing Corporation http://www.hindawi.com Volume 2014