Embed Size (px)
Citation preview

High magnetic moments and anisotropies for FexCo1−x monolayers on Pt(111)
G. Moulas,1 A. Lehnert,1 S. Rusponi,1 J. Zabloudil,2 C. Etz,3 S. Ouazi,1 M. Etzkorn,1 P. Bencok,4
P. Gambardella,5 P. Weinberger,3 and H. Brune1
1Institute of the Physics of Nanostructures, Ecole Polytechnique Fédérale de Lausanne (EPFL), CH-1015 Lausanne, Switzerland2Institut für Physikalische Chemie, University of Vienna, Sensengasse 8/7, A-1090 Vienna, Austria
3Center for Computational Materials Science, Vienna University of Technology, Getreidemarkt 9/134, A-1060 Vienna, Austria4European Synchrotron Radiation Facility, Boîte Postale 200, F-38043 Grenoble, France
5Centre d’Investigacions en Nanociència i Nanotecnologia (ICN-CSIC), UAB Campus, E-08193 Bellaterra, Spainand Institució Catalana de Recerca i Estudis Avançats (ICREA), E-08100 Barcelona, Spain
�Received 31 July 2008; published 17 December 2008�
The magnetism of 1-ML-thick films of FexCo1−x on Pt�111� was investigated both experimentally, by x-raymagnetic circular dichroism and magneto-optical Kerr effect measurements, and theoretically, by first-principles electronic structure calculations, as a function of the film chemical composition. The calculated Feand Co spin moments are only weakly dependent on the composition and close to 3�B /atom and 2�B /atom,respectively. This trend is also seen in the experimental data, except for pure Fe, where an effective spinmoment of only Seff= �1.2�0.2��B /atom was measured. On the other hand, both the orbital moment and themagnetic anisotropy energy show a strong composition dependence with maxima close to the Fe0.5Co0.5
stoichiometry. The experiment, in agreement with theory, gives a maximum magnetic anisotropy energy of 0.5meV/atom, which is more than 2 orders of magnitude larger than the value observed in bulk bcc FeCo andclose to that observed for the L10 phase of FePt. The calculations clearly demonstrate that this compositiondependence is the result of a fine tuning in the occupation number of the dx2−y2 and dxy orbitals due to theFe-Co electronic hybridization.
DOI: 10.1103/PhysRevB.78.214424 PACS number�s�: 75.70.Ak, 75.30.Gw, 73.20.At
I. INTRODUCTION
Exploring the ultimate density limits of magnetic infor-mation storage requires elaborate tuning of several magneticproperties, such as the easy magnetization axis, the magneticanisotropy energy �MAE� K, and the saturation magnetiza-tion �MS� of the recording medium.1 In order to inhibit ther-mally activated magnetization reversal the MAE has to be1.2 eV/bit. Reducing the bit size therefore requires higherMAE per atom. At the same time, the magnetization densityof the recording medium must increase in order to stay withtechnologically available write fields. In order to reduce di-polar magnetic interactions between adjacent bits the easyaxis has to be perpendicular to the plane, and finally narrowswitching and stray field distributions are required.
Extensive theoretical and experimental efforts have beendevoted to develop new materials that meet these require-ments. Examples are patterned media, exchanged-biasedmultilayers, and self-assembled monodisperse and equidis-tant nanoparticles. Bimetallic alloys represent a viable routeto tune both MS and the MAE, as these quantities arestrongly influenced by compositional effects and lattice dis-tortions. While the MAE of ferromagnetic transition metalsin their cubic structures is on the order of a few tens of�eV /atom, structurally distorted alloys, such as FePt in theL10 phase2–4 or bct-FeCo,5–7 may have MAE values close to1 meV/atom. Moreover, the total magnetic moment can betuned by choosing the two elements of the alloy. FePt andFeCo are good examples of alloys with comparable MAE butwith, respectively, lower and higher magnetic moments withrespect to Fe and Co bulk values.
As the typical size of nanoparticles and the thickness ofthin films approach a few atomic lattice distances, electronic
interactions between the magnetic medium and the support-ing substrate play an increasingly important role and lead tonew properties opening up a new degree of freedom. Theeffect of electronic hybridization with the substrate is wellexemplified by the magnetic behavior observed for surface-adsorbed individual atoms. Giant magnetic anisotropies havebeen found for single Co atoms on Pt�111�,8 a 5d transitionmetal, while vanishing MAE values have been observed forsingle Co atoms when deposited on alkali metals where only3d-sp hybridization is possible.9 In addition to electronicchange via hybridization, in thin films the lattice mismatchbetween film and substrate can induce modifications of thecrystallographic translational symmetry, which can result inadditional modifications of the magnetic properties.10
Here we report on the magnetic properties of 1 ML�monolayer� �1 ML is defined as 1 film atom per substrateatom� thick films of FexCo1−x deposited on a Pt�111� surface.Among ferromagnetic materials, FeCo displays the highestsaturation magnetization,5 while Pt is known to induce largeMAE in both Co �Refs. 11 and 12� and Fe.13 A combinationof large MS and MAE is required to push the superparamag-netic limit to smaller sizes and higher densities while keep-ing the writing field �Hwr�K /MS� in the technological limit.Until now, large MAE values have been predicted and ex-perimentally observed only in distorted FeCo-bct bulk, re-spectively, several monolayers thick films.5–7 In a combinedexperimental and theoretical study we demonstrate that1-ML-thick FexCo1−x films grown on Pt�111� possess bothvery large MS and MAE values compared to most ferromag-netic materials.14 This result is a consequence of the elec-tronic hybridization between Fe and Co atoms in the mono-layer and between the FeCo layer and the Pt�111� substrate.
PHYSICAL REVIEW B 78, 214424 �2008�
1098-0121/2008/78�21�/214424�14� ©2008 The American Physical Society214424-1

We find in our calculations in agreement with experimentspin moments of about 3�B /atom for Fe and 2�B /atom forCo. These values are only weakly composition dependent,namely, they show a monotonic increase in MS in going fromCo to Fe. This is in contrast with the well-known Slater-Pauling behavior,15 showing a maximum of MS at interme-diate composition. We attribute this to the reduced film di-mensionality which, narrowing the d-density of states�DOS�, produces a clear splitting of the Fe 3d↑ and 3d↓ spinbands. Contrary to the behavior of the spin moments, boththe orbital moment and the MAE are found to strongly de-pend on the alloy composition, with a maximum around theequiatomic stoichiometry. The experiments, in agreementwith theory, give a maximum MAE value of 0.5 meV/atom,which is more than 2 orders of magnitude larger than thevalue measured in bulk bcc FeCo alloy16 and similar to thevalues observed in the highly ordered L10 phase of FePt.17
Calculations of the element and orbital-resolved DOS clearlydemonstrate that the observed composition dependence is theresult of Fe-Co electronic hybridization, namely, a fine tun-ing of the occupation number of spin-down dx2−y2 and dxy
in-plane orbitals, both for Fe and Co, while the population ofthe d3z2−r2, dxz, and dyz out-of-plane orbitals remains nearlystable. Moreover, we show that the Pt substrate plays animportant role in the Fe-Co hybridization, as well as in de-termining the MAE and MS of this system.
II. EXPERIMENT
FexCo1−x films were grown by atomic beam epitaxy fromthoroughly outgassed high-purity rods �99.995%� using acommercial electron-beam evaporator. The Pt�111� substratewas prepared by repeated cycles of Ar+-ion sputtering �1.3keV at 300 K to remove magnetic layers and at 800 K oncethe substrate was clean �20 min��, followed by annealing at800 K at an oxygen partial pressure of PO2
=6�10−8 mbar�10 min� to remove carbon impurities, and final annealing to1100–1300 K. This preparation procedure gives chemical de-fect densities below 2�10−3 ML and typical terrace sizes ofabout 1000 Å. Fe and Co atoms were codeposited on thesurface. The film coverage and chemical composition wereadjusted by varying the Fe and Co fluxes, which were previ-ously calibrated by scanning tunneling microscopy �STM�and x-ray-absorption spectroscopy �XAS� within �0.05ML. The evaporation rate for Fe and Co was in the range of0.1–0.6 ML/min. During deposition the pressure inside theUHV chamber was below 1�10−10 mbar. To investigate theeffect of the film morphology on the magnetic properties,two types of monolayer films were grown with either agranular or continuous structure.
Granular films have been deposited at T�50 K, wheresurface diffusion of both species is frozen. Their morpholo-gies have been investigated in detail by variable temperaturescanning tunneling microscopy �VT-STM� at the Ecole Poly-technique Fédérale de Lausanne �EPFL�. Analog growthconditions were used to deposit and investigate in situ thegranular films by XAS using synchrotron radiation at theID08 beamline of the European Synchrotron Radiation Fa-cility �ESRF� in Grenoble. XAS experiments were per-
formed in the total electron yield mode using 99�1% circu-larly polarized light and a �5 T magnetic field generated bya split coil superconducting magnet. The x-ray beam andmagnetic field are parallel to each other and form an angle �with the surface normal. The out-of-plane vs in-plane mag-netization was investigated by tilting the sample positionfrom �=0° to 70°, corresponding to normal and grazing in-cidences of the x-ray beam, respectively. All XAS measure-ments presented here have been performed at 10 K in lessthan 2 h for each freshly prepared sample. The coveragecalibration at the ESRF has been carried out in situ by STMafter warming up the samples and transferring them from thecryostat to the STM of the ID08 beamline.
Continuous films were investigated by VT-STM andmagneto-optical Kerr effect �MOKE� measurements atEPFL. The films were grown at 35 K and then annealed at300 K for 5 min. MOKE measurements were performed inboth polar and transversal configurations as a function of thestoichiometry in the temperature range 35–400 K. An elec-tromagnet with magnetic poles, and a coil inside the vacuumsystem were used to produce magnetic in-plane and out-of-plane fields at the sample position up to 50 mT. The lightsource was a p-polarized and temperature-stabilized 780 nmlaser diode. The angle between the incident beam and thesurface normal was 35°. Magnetization curves were acquiredby MOKE in temperature intervals of 10 K. A complete char-acterization of the magnetic properties was always per-formed in less than 2 h after sample preparation and at apressure of 4�10−11 mbar. A maximum variation in the co-ercive field of �1.5 mT was measured when the MOKEexperiments were repeated after 2 h. We have taken thisvalue as error bar for the measurements of the coercive field.
III. EXPERIMENTAL RESULTS
A. Structural results: Granular and continuous films
Figure 1�a� shows an STM image of the granular filmstructure obtained after deposition of 0.6 ML of Co onPt�111� at 35 K. The observed morphology was independentof the film stoichiometry and of the deposition temperatureup to 50 K. Up to this temperature the surface diffusions ofCo and Fe are frozen giving rise to statistical growth of is-lands with density, size, and morphology being independentof composition.18 From the STM images, we estimated amean grain diameter of about 20 Å which corresponds to agrain size of about 50 atoms. The grain thickness is oneatomic layer; only 0.02 ML is in the second layer. This valueimplies a low activation energy for interlayer diffusion whichis reasonable for the small island sizes of only 8 atoms indiameter. The lattice misfit between Fe and Pt is −10.3% andthe one between Co and Pt is −9.4%. Despite these largevalues STM measurements do not reveal surface partial dis-locations in the islands for all stoichiometries, suggestingpseudomorphic growth of the FexCo1−x alloy islands. Thiscan be rationalized by stress relief at the steps,19 which leadsfor Co/Pt�111� to an island diameter of 30–40 Å up towhich the islands are pseudomorphic and beyond which theyhave partial dislocations, where the stacking changes fromfcc to hcp or vice versa.20 For Fe on Pt�111� pseudomorphic
MOULAS et al. PHYSICAL REVIEW B 78, 214424 �2008�
214424-2

growth has been observed up to completion of the firstmonolayer.21 This is surprising in view of the large misfit andimplies large tensile stress.
Continuous films were grown by depositing 1 ML ofFexCo1−x at temperatures lower than 50 K followed by an-nealing at 300 K. This procedure presents two advantages incomparison with deposition directly at room temperature.First, the film morphology is composition independent asdiffusion is entirely frozen for both elements during deposi-tion, and second the morphology is coming closest to anideal flat and defect-free single layer. Examples are shown inFig. 1 for monolayers formed of pure Co and of Fe0.40Co0.60.
Second layer coverage represents less than 4% of the totalcoverage �for comparison second layer coverage amounts toabout 30% in room temperature deposited 1 ML of Co �Ref.22� and 1 ML of Fe �Ref. 21��. The density of second layerislands and first layer vacancies was only 8�10−3 ML, andthis is independent of stoichiometry. This allows minimi-zation of the effect of film roughness on the magneticproperties.23,24 Randomly distributed partial surface disloca-tions are observed for all compositions, except for pure Fe.The dislocations are the domain walls separating fcc fromhcp staking areas and appear in pairs due to the energy dif-ference between the two stacking sequences. Depending onthe tip conditions, these pairs appear as a bright double line
(a)
(b)
(c)
FIG. 1. �a� STM image of 0.60�0.05 ML Co/Pt�111� depositedand imaged at T=35 K. The surface exhibits monolayer-thickgrains containing on average 50 atoms each. �b� STM image of1.00�0.05 ML Co/Pt�111�. �c� STM image of 1.00�0.05 MLFe0.40Co0.60 /Pt�111�. Growth conditions for �b� and �c�: depositionat T=35 K followed by annealing for 5 min at T=300 K.
4.1
-0.1
XAS(arb.units)
1.0
0.0
0.2
0.4
0.6
0.8
805
p
(a)
(b)
(c)
q
t
775 780 785 790 795 800
Photon Energy (eV)
XMCD(arb.units) 0.0
-0.3
-0.2
XAS(I/I0)
3.6
3.7
3.8
3.9
4.0
FIG. 2. �Color online� XAS and XMCD spectra recorded at theCo L2,3 edges for a 0.83�0.05 ML film of Fe0.35Co0.65 �T=10 K,�0H=5 T, field and beam normal to the sample corresponding to�=0°�. �a� Absorption spectra normalized to the incident photonflux �I0� for parallel ��+= I+ / I0� and antiparallel ��−= I− / I0� align-ment of photon helicity with respect to the field. The shown back-ground signal corresponds to the XAS acquired on the clean Pt�111�surface. �b� XMCD spectrum with the corresponding integral cal-culated from spectra shown in �a�. �c� Total XAS spectra with thecorresponding integral calculated from spectra shown in �a� aftersubtraction of the background signal and of the two-step functionaccounting for nonresonant absorption �full gray line�.
HIGH MAGNETIC MOMENTS AND ANISOTROPIES FOR Fe… PHYSICAL REVIEW B 78, 214424 �2008�
214424-3

or as a depression, as in Fig. 1. In both cases the positive ornegative apparent height amounts to 0.25�0.05 Å. Al-though surface dislocations have been observed for pure Co�Ref. 22� but not for pure Fe,21 a clear correlation betweendislocation density and film chemical composition could notbe detected. This finding is in agreement with the randomchemical order due to the growth by codeposition at tem-peratures low enough to suppress surface diffusion.
Experiments carried out above room temperature revealedstructural evolutions such as segregation of adatoms on topof the first layer. Previous experimental and theoretical stud-ies were focused on the structural evolutions occurring aboveroom temperature, e.g., insertion of atoms in the substrate,22
intermixing,25–27 or adatom segregation at the film surface.28
In order to have monolayers of well-defined composition andstructure we restrict ourselves to the temperature rangewhere structural evolution is absent.
B. X-ray-absorption spectroscopy on granular FexCo1−x films:Magnetic moments versus stoichiometry
We investigated four different compositions, all of themshowing intense dichroic signals. XAS spectra were acquiredat the L3,2 edges of both Fe and Co. As an example, Fig. 2shows the XAS spectra recorded at the Co L3,2 edges for a0.83-ML-thick granular film of Fe0.35Co0.65 for both helici-ties in a magnetic field of �0H=5 T. Figure 2�a� representsthe raw absorption spectra normalized to the incident photonflux for parallel ��+� and antiparallel ��−� alignment of pho-ton helicity with respect to the applied magnetic field. Spec-tra recorded on the Pt�111� substrate are shown as back-ground in Fig. 2�a�. Figures 2�b� and 2�c� show the resultingx-ray magnetic circular dichroism �XMCD� ��+−�−� andXAS ��++�−� intensities together with their integrals. Inaddition to the substrate contribution, a two-step function,taking into account nonresonant absorption shown in Fig.2�c�, has to be subtracted from the XAS signal in order toisolate the contribution of the 2p→3d transitions. Accordingto the XMCD sum rules, the projections of the orbital L �Ref.29� and effective spin Seff=S+7D magnetic moments30 ontothe incident light direction can be determined from theXMCD and XAS spectra as follows:
L = −4
3hd
�L3+L2
��+ − �−�dE
�L3+L2
��+ + �−�dE
= −4
3hd
q
t, �1�
S + 7D = − hd
6�L3
��+ − �−�dE − 4�L3+L2
��+ − �−�dE
�L3+L2
��+ + �−�dE
= − hd6p − 4q
t, �2�
where hd is the number of holes in the 3d states, D is the spinmagnetic dipole moment, and the integrals p, q, and t arelabeled in Fig. 2. The resulting out-of-plane magnetic mo-ments for Fe and Co are shown in Table I for the differentstoichiometries. For the evaluation of L and Seff, we assumedhd=2.4 for Co �Ref. 8� and hd=3.4 for Fe.31 This assumptionsimplifies the comparison of the magnetic moments with pre-vious literature values. The uncertainty on the number ofunoccupied 3d states can generally be quite large. Variationson the order of 10% can arise from the hd dependence on thealloy stoichiometry32 and from the reduced dimensionality.33
However, our calculations give with hd=2.3 for Co and hd=3.4 for Fe �see Sec. IV� values in excellent agreement withthe two previous values from literature. In addition, thesevalues vary by less than 2% with the alloy composition.Therefore we estimate in the present case the uncertainty onhd to be small, and the error bars for L and Seff have beenderived taking into account only the experimental errors.
The orbital moments of Co and Fe show a strong depen-dence on the alloy stoichiometry. This dependence is evenlarger when considering the mean orbital moment per alloyatom, defined as mL=xLFe+ �1−x�LCo, with a minimum of�0.14�0.02��B /atom for pure Fe and a maximum of�0.43�0.08��B /atom for x=0.35 and �0.31�0.06��B /atomfor pure Co �see Table I�. In contrast, the mean effective spinmoment mSeff
shows only a slight dependence on the filmstoichiometry and tends to increase moving from Co to Fe.
TABLE I. Element-resolved orbital and spin moments �in units of �B /atom� estimated from XAS data acquired along the easy axis��=0°� with �0H=5 T. mL and mSeff
are the average orbital and effective spin moments per atom in the alloy. The saturation magnetizationMS and the total magnetization at 5 T, M5 T, are estimated from the magnetization curves in Fig. 3. The values for pure Co correspond to1-ML-high Co islands with an average size of 40 atoms and are taken from Ref. 8.
��ML� LFe �Seff�Fe �L / Seff�Fe LCo �Seff�Co �L / Seff�Co mL mSeff
M5 T / MS
Co Ref. 8 0.31�0.06 1.8�0.1 0.17�0.02 0.31�0.06 1.8�0.1 1
Fe0.35Co0.65 0.83�0.05 0.30�0.03 3.0�0.3 0.10�0.02 0.50�0.05 2.2�0.2 0.23�0.04 0.43�0.08 2.5�0.5 1
Fe0.52Co0.48 0.73�0.05 0.24�0.02 2.1�0.2 0.11�0.02 0.40�0.04 1.7�0.2 0.24�0.03 0.32�0.06 1.9�0.4 0.85
Fe0.55Co0.45 1.17�0.05 0.29�0.03 2.9�0.3 0.10�0.02 0.48�0.04 2.2�0.2 0.22�0.03 0.38�0.07 2.6�0.5 1
Fe 0.79�0.05 0.14�0.02 1.2�0.2 0.12�0.04 0.14�0.02 1.2�0.2 0.85
MOULAS et al. PHYSICAL REVIEW B 78, 214424 �2008�
214424-4

The only exception is the pure Fe film for which we measurea strongly reduced effective spin moment of Seff= �1.2�0.2��B /atom �see Sec. V B�.
C. Granular films: Magnetization curves and magneticanisotropy energy
The magnetization curves in Fig. 3 represent the peak ofthe Fe �Co� L3 XMCD intensity at 707.2 �777.3� eV dividedby the pre-edge XAS intensity at 704.0 �773.0� eV as a func-tion of the external magnetic field for �=0° and 70°. Nor-malization to the pre-edge intensity compensates for the an-gular and field dependence of the total electron yield of thesample, which strongly affect the absolute photocurrent.
The shape of the M�H� curves measured with �=0° and70° shows that all the samples exhibit an out-of-plane easyaxis. Figures 3�a� and 3�b� show magnetization curves ofpure Fe and Fe0.52Co0.48, both are not saturated at the maxi-mum available magnetic field of 5 T. In order to estimate thesaturated magnetic moment per atom, we linearly extrapo-lated M�H� above 4 T and defined the intersection point ofthe magnetization curves measured along the two directionsas MS. For the nonsaturated samples we found that the mag-netization at �0H=5 T is about 85% of MS. Note that theeffective spin and orbital moments reported in Table I are theones measured at �0H=5 T. In alloy samples we find thatthe Fe and Co magnetization curves coincide, as expectedbecause of the strong ferromagnetic exchange coupling be-tween the two species �see Fig. 3�b��.
It is interesting to compare Figs. 3�b� and 3�c�, whichrefer to samples with very similar chemical compositions butdifferent coverages. The film with �=0.73�0.05 MLshows reversible magnetization curves, while the one with�=1.17�0.05 ML shows hysteresis with a coercive fieldHc of about 1 T. The origin of this difference resides in thefilm morphology. As pointed out above, the growth condi-tions of the granular films are to a good approximation idealstatistical growth with frozen surface diffusion. In this case,island percolation occurs at a coverage of ��0.9 ML.34 Inother words, for coverages below this value the film can beseen as an ensemble of monolayer-high magnetically inde-pendent particles, while for coverages above the film be-comes a continuously connected structure. Because in ultra-thin films with out-of-plane easy axis the critical single-domain diameter is on the order of 1 �m �Refs. 35 and 36�,one expects that the morphological percolation is accompa-nied by the onset of irreversible mechanisms of magnetiza-tion switching, such as nucleation of reversed domains anddomain-wall propagation.
The films with coverage below the coalescence thresholdhave the advantage that the mechanism of magnetization re-versal is the rotation of the magnetization vector of eachisland, and therefore one can straightforwardly derive theMAE from the angular dependence of the magnetizationcurves M��H� using the following equation:37,38
MAE =
�0
MS
�0HdM�1− �
0
MS
�0HdM�2
sin2��1 − �2�, �3�
where H is the applied magnetic field, �1=0° and �2=70°.MS is shown in Table I as a multiple of M5 T, the total
0
10
(b)
-10 -5 0 5-1
1
M/Ms
0
10
(a)
-10 -5 0 5-1
1
M/Ms
0
10
(c)
-10 -5 0 5-1
1
M/Ms
0.3
FexCo1-x1.0
(d)
0.0 0.2 0.6 0.80.0
0.6
0.4
0.1
0.2
0.4
0.5
MAE(meV/atom)
FIG. 3. �Color online� Magnetization curves M��H� of granularfilms measured at the Fe edge at T=10 K, �=0° �solid circles�, and�=70° �open circles� normalized to MS �see text�. �a� �=0.79�0.05 ML pure Fe; �b� �=0.73�0.05 ML Fe0.52Co0.48,crosses represent the Co edge data; �c� �=1.17�0.05 MLFe0.55Co0.45. Dotted lines are linear extrapolations of the experimen-tal data when saturation is not reached. �d� MAE vs stoichiometrycalculated from Eqs. �3� and �4�. The value for pure Co is takenfrom Ref. 8 and corresponds to one-monolayer-thick Co islandswith an average size of 40 atoms. The dotted line is a guide forthe eyes.
HIGH MAGNETIC MOMENTS AND ANISOTROPIES FOR Fe… PHYSICAL REVIEW B 78, 214424 �2008�
214424-5

magnetic moment estimated at 5 T following
M5 T = x�LFe + �Seff�Fe� + �1 − x��LCo + �Seff�Co� + mPt.
�4�
Equation �4� takes into account the orbital and spin momentsof Fe and Co, weighted by the film stoichiometry, and themagnetic moment induced in the substrate Pt atoms. Ourcalculations �see Sec. IV B� give mPt= �0.25�0.03��B /atom, slightly decreasing when moving from pure Co to pureFe. These values are consistent with previous studies whichfound mPt�0.2�B /atom �Ref. 25� and mPt�0.27�B /atom�Ref. 39� for the induced Pt moment in Co/Pt�111� and Fe/Pt�111�, respectively.
A strong dependence of the MAE on the alloy composi-tion is observed in Fig. 3�d�. We find a maximum of0.50�0.05 meV /atom for close to equiatomic stoichiom-etry. This value is about three times the values measured forpure Fe �0.1�0.05 meV /atom� and Co �0.15�0.02 meV /atom� monolayers on Pt�111�.
D. Continuous FexCo1−x films: Coercivity versus stoichiometry
The magnetization of continuous films deposited at 35 Kand annealed to room temperature was studied by means ofin situ MOKE. In large islands or continuous films, magne-tization reversal does not take place by coherent rotation butby the energetically favored nucleation and growth of re-versed domains. Consequently, the measured coercive fieldsHc�T� may be orders of magnitude smaller than the valuesestimated from the MAE assuming coherent magnetizationrotation. However, because the continuous films investigatedhere all have similar morphology �see Sec. III A�, Hc may beused to monitor relative changes in the MAE as a function offilm stoichiometry.
All the measured samples showed square-shaped hyster-esis loops for the out-of-plane magnetization measured bypolar Kerr effect �Fig. 4�a��. Using transverse Kerr effect noin-plane signal was observed within the detection limit. Fromthese observations we deduce an out-of-plane easy axis ofmagnetization and a single-domain remanent state, indepen-dent of film stoichiometry.
The coercive field measured at T=240 K is shown in Fig.4�b� as a function of stoichiometry of the monolayers. Forpure Co �x=0�, the coercive field amounts to �0HC=24.5�1.5 mT and for pure Fe �x=1� to 4.5�1.5 mT.Mixing the two elements produces an increase in the switch-ing field up to a maximum of �0HC=43.5�1.5 mT. TheHc�x� trend is very similar to the one observed for the MAEof granular films with the maximum reached in both cases atx=0.40.
Magnetization curves at different temperatures for a pureFe film are shown in Fig. 5�a�. The coercive field vanishes at260 K and the loops become s shaped at 270 K, suggestingthe occurrence of a magnetic phase transition associated withthe Curie temperature TC. At TC the susceptibility �=M /Hdiverges. Therefore TC can be determined by linearly ex-trapolating the magnetization curve data represented in anArrot plot M2�H /M� to zero.40–42 From Fig. 5�b� we deduceTC=270�5 K for the pure Fe film. For all the other stoichi-
ometries, TC is above 300 K but below 400 K as inferredfrom extrapolating from the temperature dependence ofHc�T�. We already discussed the impossibility to experimen-tally verify these results because the samples undergo struc-tural changes when annealed to temperatures higher than320–340 K �see Sec. III A�. As expected due to the lowdimensionality of the studied films, the measured values ofTC are strongly reduced with respect to the bulk values of1043 K for Fe and 1388 K for Co.43 Alloying Fe and Co hasbeen shown to increase TC.44,45 Finally, we note that the ob-served behavior differs from what has been reported forFexCo1−x monolayers on W�110�. In that case the authorsobserved a monotonically decreasing Curie temperature withincreasing the Co concentration.46 This was ascribed to theFe-Co hybridization which, in this peculiar system, reducesthe tendency toward ferromagnetic ordering with increasingCo content.47
IV. THEORY
A. Computational method
In order to gain further insight into the magnetic proper-ties of this system we performed first-principles electronicstructure calculations using the screened Korringa-Kohn-Rostoker �SKKR� Green’s-function method.48 In this ap-proach a surface is described as a system with two-
-50 -25 0 25 50
-1
0
1
M/M
SAT
0
10
20
30
40
0.0 0.2 0.4 0.6 0.8 1.0
50
Fe
Co
Fe40 Co60
FexCo1-x
(a)
(b)
FIG. 4. �Color online� �a� Polar MOKE magnetization curverecorded at T=240 K for 1.00�0.05 ML Co �red�, Fe �black�, andFe0.40Co0.60 alloy �blue�. �b� Coercive field vs stoichiometry for 1ML of FexCo1−x measured along the easy axis �T=240 K�. Thedotted line is a guide for the eyes.
MOULAS et al. PHYSICAL REVIEW B 78, 214424 �2008�
214424-6
dimensional translational symmetry. In the third direction itconsists of a semi-infinite bulk on one side and of a semi-infinite vacuum region on the other. The relativistic scatter-ing solutions, and consequently the Green’s functions, areobtained by solving the Dirac equation, whereby spin-orbitcoupling is automatically included in the calculations. Wavefunctions and scattering matrices have been calculated up toan orbital momentum quantum number of �max=2. Thischoice of �max=2 means that s, p, and d valence electronshave been taken into account. The potentials are described inthe atomic sphere approximation �ASA� and within the localspin-density approximation �LSDA�. When calculating theelectrostatic potential by solving Poisson’s equation, mo-ments of the charge density up to �max=4 have been consid-ered in order to realistically describe the potentials and en-ergies in the layers at and near the surface. For the self-consistent calculations, 80 k� points have been used in theirreducible surface Brillouin-zone �ISBZ� integrations and 16energy points for the energy integrations along a semicircularcontour in the complex energy plane by means of a Gaussianquadrature. The magnetocrystalline anisotropy energies havebeen obtained by means of the force theorem as the corre-sponding difference in band energies49 which have been con-verged in terms of k points in the ISBZ �for details see Ref.50�.
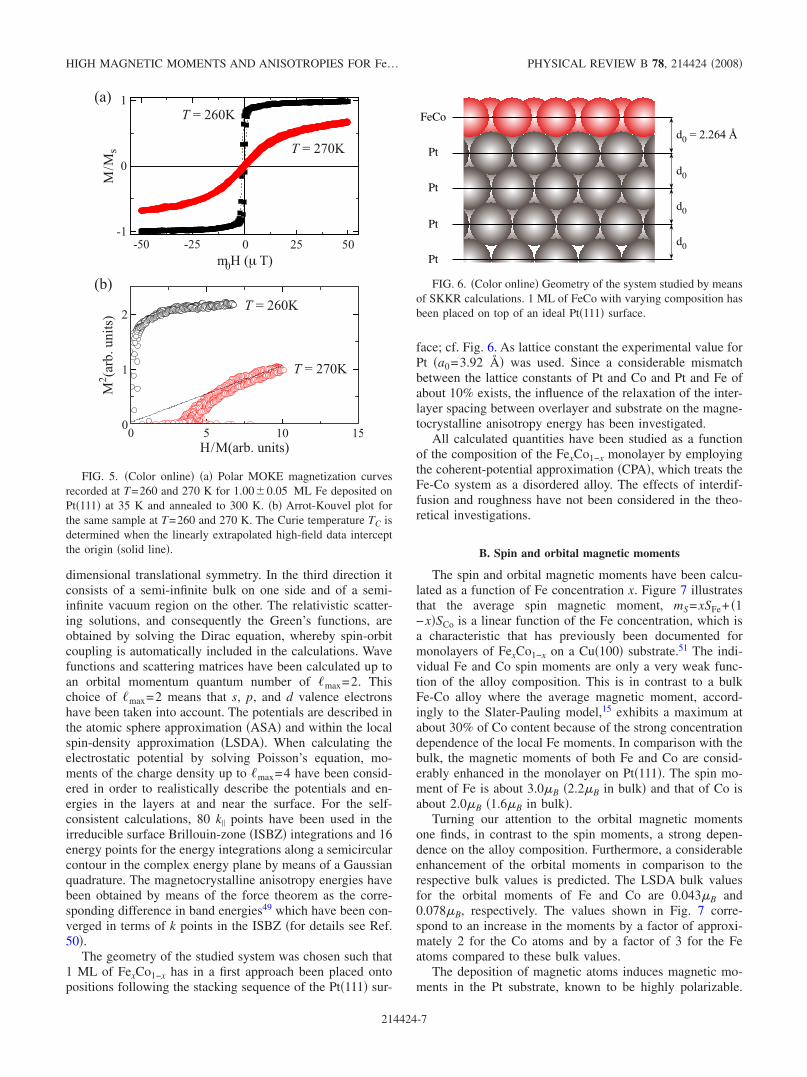
The geometry of the studied system was chosen such that1 ML of FexCo1−x has in a first approach been placed ontopositions following the stacking sequence of the Pt�111� sur-
face; cf. Fig. 6. As lattice constant the experimental value forPt �a0=3.92 � was used. Since a considerable mismatchbetween the lattice constants of Pt and Co and Pt and Fe ofabout 10% exists, the influence of the relaxation of the inter-layer spacing between overlayer and substrate on the magne-tocrystalline anisotropy energy has been investigated.
All calculated quantities have been studied as a functionof the composition of the FexCo1−x monolayer by employingthe coherent-potential approximation �CPA�, which treats theFe-Co system as a disordered alloy. The effects of interdif-fusion and roughness have not been considered in the theo-retical investigations.
B. Spin and orbital magnetic moments
The spin and orbital magnetic moments have been calcu-lated as a function of Fe concentration x. Figure 7 illustratesthat the average spin magnetic moment, mS=xSFe+ �1−x�SCo is a linear function of the Fe concentration, which isa characteristic that has previously been documented formonolayers of FexCo1−x on a Cu�100� substrate.51 The indi-vidual Fe and Co spin moments are only a very weak func-tion of the alloy composition. This is in contrast to a bulkFe-Co alloy where the average magnetic moment, accord-ingly to the Slater-Pauling model,15 exhibits a maximum atabout 30% of Co content because of the strong concentrationdependence of the local Fe moments. In comparison with thebulk, the magnetic moments of both Fe and Co are consid-erably enhanced in the monolayer on Pt�111�. The spin mo-ment of Fe is about 3.0�B �2.2�B in bulk� and that of Co isabout 2.0�B �1.6�B in bulk�.
Turning our attention to the orbital magnetic momentsone finds, in contrast to the spin moments, a strong depen-dence on the alloy composition. Furthermore, a considerableenhancement of the orbital moments in comparison to therespective bulk values is predicted. The LSDA bulk valuesfor the orbital moments of Fe and Co are 0.043�B and0.078�B, respectively. The values shown in Fig. 7 corre-spond to an increase in the moments by a factor of approxi-mately 2 for the Co atoms and by a factor of 3 for the Featoms compared to these bulk values.
The deposition of magnetic atoms induces magnetic mo-ments in the Pt substrate, known to be highly polarizable.
-50 -25 0 25 50
0 5 10 15
-1
0
1
0
2
H/M(arb. units)
(a)
(b)
M/Ms
1
M2(arb.units)
FIG. 5. �Color online� �a� Polar MOKE magnetization curvesrecorded at T=260 and 270 K for 1.00�0.05 ML Fe deposited onPt�111� at 35 K and annealed to 300 K. �b� Arrot-Kouvel plot forthe same sample at T=260 and 270 K. The Curie temperature TC isdetermined when the linearly extrapolated high-field data interceptthe origin �solid line�.
d0
d0
d0
d0
FeCo
Pt
Pt
Pt
Pt
FIG. 6. �Color online� Geometry of the system studied by meansof SKKR calculations. 1 ML of FeCo with varying composition hasbeen placed on top of an ideal Pt�111� surface.
HIGH MAGNETIC MOMENTS AND ANISOTROPIES FOR Fe… PHYSICAL REVIEW B 78, 214424 �2008�
214424-7

The total induced moment per Pt atom of the topmost layerranges from about 0.23�B for a pure Fe layer to 0.28�B for apure Co layer �Fig. 8�. Both orbital and spin Pt moments arecollinear with the magnetization of alloy film.
C. Magnetocrystalline anisotropy energy
The magnetocrystalline anisotropy energy has been calcu-lated as the difference in band energy, Eb�� ,��, for two mag-netization directions, �=0° and 90°, corresponding to easyand hard magnetization axis. For �=90° there exists a depen-dence of the band energy difference on the azimuthal angle�, which is, however, several orders of magnitude smaller�on the order of a few �eV�. In order to determine the MAE,we have therefore calculated
MAE = Ebx−z = Eb�90 ° ,0°� − Eb�0 ° ,0°� . �5�
The resulting MAE is plotted in Fig. 9 as a function of Feconcentration. Note that the dipolar energy is not taken intoaccount. The maximum energy appears at Fe0.5Co0.5 and theeasy axis is parallel to the surface normal, as long as theconcentration of Fe atoms is below approximately 75%. Be-yond this concentration the calculations predict in-planemagnetization with a total MAE of −0.71 meV for the pureFe film.
D. Contribution of the Pt substrate
It is of interest to assess the contribution of the substrateto the total MAE. According to the calculations, this contri-bution is always favoring in-plane magnetization and it hasan almost linear function of the Fe concentration �see Fig. 9�.The energy attributed to the Pt substrate is by a factor of 10larger for a pure Fe than for a pure Co monolayer. Except fora pure Fe film the FexCo1−x film contributes with positive-energy values, hence favoring perpendicular magnetization.
E. Effect of layer relaxation
Because of the about 10% lattice mismatch between Feand Co bulk nearest neighbor distance and the one of Pt onemight expect a contraction of the distance between the lastlayer of the Pt substrate and the magnetic overlayer. Techni-cally this has been realized in the simulation by changingonly the distance between the last Pt and the overlayer, cf.Fig. 6. Consequently the volume of the Wigner-Seitz cell—and hence that of the ASA sphere—of the Pt atoms in the
Fe Co Average moment
Fe Co Average moment
0.0 0.2 0.4 0.6 0.8 1.00.08
0.10
0.12
0.14
0.16
0.18
1.8
2.0
2.2
2.4
2.6
2.8
3.0
3.2
FexCo1-x
mL(μ
B/a
tom
)m
S(μ
B/a
tom
)
FIG. 7. �Color online� Spin and orbital magnetic moments asfunctions of Fe concentration x. Individual and averaged values areplotted. mL values are the ones calculated along the easy axis �seeSec. IV C�. Note the linear dependence of the average spin mo-ments on x in contrast to what is observed in the bulk bcc FeCoalloy. The lines are guides for the eyes.
mS (Pt) mL (Pt) m (Pt)
S 2.51 FeCo
0.21 Pt
0.03
0.05
0.004
L 0.16 FeCo
0.05 Pt
0.004
0.007
0.001
0.0 0.2 0.4 0.6 0.8 1.0
0.05
0.10
0.15
0.20
0.25
FexCo1-x
mPt
(μB
/ato
m)
FIG. 8. �Color online� �Bottom� Induced spin and orbital mo-ments in Pt atoms of the topmost substrate layer as a function of Feconcentration x. Lines are guides for the eyes. The layer-resolvedinduced spin �top� and orbital �middle� moments �in units of �B� inPt atoms up to the fourth substrate layer for the Fe0.5Co0.5 mono-layer are shown.
MOULAS et al. PHYSICAL REVIEW B 78, 214424 �2008�
214424-8

topmost layer were reduced, and those of the Fe and/or Coatoms remained unchanged. The influence of a successivechange in this interlayer distance on the MAE is illustrated inFig. 10. The results suggest that the MAE is strongly affectedby changes in the interlayer distance. In particular, in theregime between 40%�x�80%, the MAE can even changeits sign depending on the relaxation value. Generally, theMAE is more positive when the film is outward relaxedwhich is expected since the Pt substrate induces in-planeMAE.
V. DISCUSSION
A. Experiment versus theory
Rather good agreement is found for all compositions apartfrom clean Fe between experimental data and theoretical cal-
culations for the magnetic moments. This is surprising sincetheory treats a perfect monolayer, whereas the XMCD mea-surements have been performed on granular films. The spinmoment �per alloy atom� is predicted by theory to linearlyincrease from mS=2.0�B to mS=3.0�B while moving frompure Co to pure Fe. XMCD data give an effective spin mo-ment of Seff= �1.8�0.1��B for pure Co which increases byincreasing Fe content. For Fe0.55Co0.45 we measure mSeff= �2.6�0.5��B, in coincidence with theory and similar to thebcc bulk value �2.3�B�. Slightly smaller values were recentlyreported for Fe0.55Co0.45 /Pt superlattices �2.5�B�,52 three-dimensional �3D� crystalline Fe0.56Co0.44 nanoparticles�2.3�B�,53 and a significantly smaller one for 6-ML-thickFeCo films on Rh�100� close to the equiatomic composition�1.8�B�.7
An evident discrepancy between theory and XMCD dataexists in the case of pure Fe for which we measured astrongly reduced effective spin moment of Seff= �1.2�0.2��B vs 3.0�B found by theory. The experimentalvalue is also substantially lower than 2.5�B reported in FePtnanoparticles54,55 and multilayers.56 Low spin values havebeen reported for 1 ML of Fe on Cu�111� �Refs. 57 and 58�and on Au�111�.59 This is probably the consequence of com-plex magnetic structures with prevalent antiferromagnetic�AFM� order characterizing thin Fe film with strained fccstructures, as recently observed for the Fe ML on Ir�111�.60
Because the lattice constant of Ir and Pt differs by only 2%and because they are both highly polarizable, it is possiblethat similar AFM structures also form on the Pt�111� surface.Our calculations assumed ideal flat films pseudomorphicwith the Pt�111� surface and cannot account for such lowmoment structures. When adding Co atoms, the strong ferro-magnetic behavior of Co on Pt�111� and the strong hybrid-ization between Fe and Co restore the ferromagnetic order atthe Fe sites.
The orbital moment is seen in experiment and theory tohave a maximum close to x=0.5. The exact compositionwhere this maximum is taken on varies slightly betweentheory, x=0.6, and experiment, x=0.4. Moreover, theory sub-stantially underestimates mL with respect to experiment. Thisis not surprising because the local-density approximationused for the present calculations typically underestimates theorbital magnetic moments of 3d metals by about a factor of2. Arguably, correlation effects may play a prominent role incorrectly predicting the magnitude of the orbitalpolarization.61 However, the general trend observed as afunction of the film stoichiometry should not be affected.Comparing again with the 6-ML-thick FeCo films onRh�100� we note that also in that case a similar behavior formL was observed with a maximum at x=0.4.7
The MAE also shows minima for pure Fe and pure Cocomposition and has a maximum value of about 0.5 meV/atom for a film stoichiometry close to the equiatomic com-position. It is worth nothing that this value is orders-of-magnitude enhanced compared with the bcc Fe and hcp Cobulk values of 5 and 45 �eV /atom, respectively.14,62 Theobserved bell-shaped behavior as a function of the film sto-ichiometry is very similar to what has recently been pre-dicted and measured in films of a few nanometerthickness.5–7 Our experimental and theoretical results dem-
MA
E (m
eV/a
tom
)
FexCo1-x
0.0 0.2 0.4 0.6 0.8 1.0-0.8
-0.6
-0.4
-0.2
0.0
0.2
0.4
0.6
0.8
FeCo Pt Total
FIG. 9. MAE as function of Fe concentration x. The separatedcontribution of the Pt substrate, per Pt surface atom, �filled circles�and of the FexCo1−x overlayer �empty circles� to the total MAE�gray circles: dashed line� are also shown. Lines are guides for theeyes.
0.0
MA
E (m
eV/a
tom
)
FexCo1-x
0.2 0.4 0.6 0.8 1.0-1.0
-0.5
0.0
0.5
1.0
+ 10% + 4%
0% 2% 4% 6% 8% 10%
FIG. 10. Total MAE as function of the interlayer distance be-tween the magnetic film and the topmost Pt layer. The interlayerdistance is expressed in percentage of the substrate interlayer dis-tance. Lines are guides for the eyes.
HIGH MAGNETIC MOMENTS AND ANISOTROPIES FOR Fe… PHYSICAL REVIEW B 78, 214424 2008
214424-9

onstrate an out-of-plane MAE for the FeCo films. However,a clear discrepancy exists for the pure Fe film MAE which isfound out of plane in the experiments and predicted in planeby the calculations. This is predominantly due to the strongin-plane contribution of the Pt substrate found in the calcu-lations �see Fig. 9�. Figure 10 also shows that the interlayerrelaxation of the Fe film with respect to the Pt�111� substrateis not responsible for the predicted in-plane easy axis. Thecalculations find for the Fe monolayer much higher spin mo-ments than the experimentally observed ones, which cer-tainly affects the spin-orbit interaction between film and sub-strate and consequently the MAE of the system.
B. Electronic structure analysis
The bcc FeCo alloy is one of the most studied B2 alloys.Its magnetization as a function of the Co concentration iswell described by the Slater-Pauling curve which shows amaximum at about 30% of Co and then a decrease by furtherincreasing the Co content.15 This can be understood, takinginto account that Fe is a weak ferromagnet with the Fermilevel intersecting both the 3d↑ and 3d↓ spin bands, while Cois a strong ferromagnet having holes only in the 3d↓ band.The strong hybridization of Fe and Co in the alloy producestwo concomitant effects. The first is an increase in the Feexchange splitting relative to pure Fe. The second is that thelarge Co electron-electron interaction to bandwidth ratio as-sists and strengthens the weaker Fe electron-electron interac-tion by saturating the Fe moment. The net result is a redis-tribution of 3d↓ electrons to the 3d↑ states at the Fe siteswhile adding Co up to a concentration of about 30%. Afterreaching the maximum magnetization value, the total num-ber of 3d↑ electrons remains constant, whereas the numberof 3d↓ electrons increases in order to accommodate the ad-ditional electrons coming from Co.32,63–65
Our experimental and theoretical data support a differentbehavior for the FexCo1−x monolayer film on Pt�111�. Calcu-lations predict a linear decrease in the average spin momentmS moving from pure Fe to pure Co, as illustrated in Fig. 7.The spin-resolved DOS of Fe �Co� demonstrates that thespin-up band is almost completely filled, with about 4.8 elec-trons, while about 1.8 �2.9� electrons are localized in thespin-down band, independently on the Co concentration.Consequently, the spin moment at both the Co and Fe sites iscomposition independent, and the alloy magnetization issimply given by the weighted mean of Fe and Co spin mo-ments. This is also partially seen in the experimental datagiving a spin moment Seff= �1.8�0.1��B for Co which in-creases to mSeff
= �2.6�0.5��B for Fe0.55Co0.45. The reasonfor this different behavior with respect to the bulk can beeasily understood by comparing the d band of the Fe mono-layer �see Fig. 11� with that of bulk Fe �see Fig. 2�b� of Ref.65�. Two features in the bulk DOS are evident: a small peakat the Fermi energy EF in the majority states �absent in thefilm� and a clear peak below EF in the minority states �cross-ing EF in the film�. This strong superposition of minority andmajority states is responsible for the reduced spin momentobserved in bulk Fe. In the monolayer film, the d-band nar-rowing due to the reduced symmetry produces a clear split-
ting of majority and minority states, forcing the Fe to behaveas a strong ferromagnet. Adding Co atoms strengthens thed-band narrowing, as seen in Fig. 11 by comparing the DOSof pure Fe and Fe0.5Co0.5 films. However, because the Fespin moment is already close to the maximum value given bya completely filled 3d↑ shell, adding Co atoms plays only afractional role.
Let us now consider what happens for the orbital momentL and the MAE, related to L via the spin-orbit interaction. Inbulk, the high symmetry of the bcc structure stronglyquenches L with the consequence that also the MAE is closeto zero. Large MAE values can only be observed in highlystrained bct structures which destroy the translational sym-metry of the bcc structure. The unquenched orbital momentdue to the reduced symmetry is accompanied by an aniso-tropy of the orbital moment itself which in turn generates alarge value of the MAE via the spin-orbit coupling. In par-ticular for bulk FeCo alloys it has been shown that a tetrag-onal distortion of the bcc structure produces a reduction inthe energy difference between occupied and unoccupiedstates. Because in second-order perturbation theory the MAEis inversely proportional to the energy separation betweenoccupied and unoccupied states, a strong MAE is predictedand experimentally observed for the c /a ratio minimizingthis energy separation.5,7
This picture changes completely when considering asingle FexCo1−x layer on the Pt�111� surface. In this case, thec /a ratio is not even defined. The symmetry breaking arisesfrom coordination reduction, strain due to lattice mismatchbetween monolayer and substrate, and electronic hybridiza-tion with the substrate. The calculations evidence a chargetransfer from the Pt substrate to the FexCo1−x film, changingmore or less linearly from about 0.08 electrons for pure Coto 0.06 electrons for pure Fe. The effect of the electronichybridization with the substrate can be qualitatively under-stood by comparing each of the five orbital-resolved DOScalculated for the Co/Pt�111� monolayer film �Fig. 12� withthe equivalent calculated for the free-standing Co monolayer�see Fig. 2 of Ref. 66�. The most visible difference concernsthe DOS widths of the two systems. For ml= �2 the DOS
Fe0.5Co0.5 Fe1.0Co0.0
DO
S (1
/Ryd
)
0.4
-0.4 -0.3 -0.2 -0.1 0-2-1012345
integrated DOS
3d
3d
E-EF(Ryd)-0.6 -0.4 -0.2 0 0.2
-40
-20
0
20
40
n el
ectro
ns
FIG. 11. �Color online� Calculated Fe DOS for Fe0.50Co0.50 andfor pure Fe monolayer films. The inset shows the correspondingintegrated DOS �1 Ryd=13.6 eV�.
MOULAS et al. PHYSICAL REVIEW B 78, 214424 �2008�
214424-10

widths are very similar, while for ml= �1 and ml=0 theDOS widths are about 3 and 4 eV, respectively, larger in thePt�111� supported Co monolayer. In the independent electronligand field picture a larger DOS width implies stronger elec-tronic hybridization or bonding with the neighboringatoms.67 Because orbitals with ml=0 �d3z2−r2� and ml= �1�dxz ,dyz� describe out-of-plane bonding, while orbitals withml= �2 �dx2−y2 ,dxy� describe in-plane bonding, the previousobservation on the DOS widths immediately highlights theformation of a strong vertical Co-Pt bonding and a substan-tially unmodified in-plane Co-Co bonding. In the sameligand field picture, the formation of a strong directionalbonding generates a reduction in the component of the or-bital moment perpendicular to the bonding direction. In ourcase, this implies a strong reduction in the in-plane compo-nent of the orbital moment in the Co/Pt�111� monolayer incomparison with the free-standing monolayer. Coherently,our experimental data show highly unquenched out-of-planeorbital atomic moments of L= �0.31�0.06��B and�0.14�0.02��B for pure Co and Fe, respectively.
A second strong hybridization is seen between Fe and Coatoms when they are mixed in the alloy. Because the CoDOS is narrower than the Fe DOS, increasing the Fe percent-age in the alloy leads to the spreading of Co and Fe DOS�Fig. 13�. However, the orbital-resolved DOS for Co are al-ways narrower than the corresponding one for Fe. In theligand field picture this implies larger L values for Co thanfor Fe, in agreement with the experiment.
The Fe-Co hybridization is also responsible for the ob-served composition dependence of the MAE. To highlightthis point, we compared the anisotropy of the orbital moment�L=LM�−LM�� with the anisotropy in the occupation ofeach minority 3d↓ orbitals �Nd↓ =Nd,M� −Nd,M�� calculatedfor the magnetization oriented out of plane �M�� and inplane �M�� �Fig. 14�. In order to simplify the comparison we
weighted the differences in the occupation of the minority3d↓ orbitals with the corresponding orbital quantum num-bers. This way, for the dx2−y2 and dxy in-plane orbitals theanisotropy reads Nip↓ =2�Nxy −Nx2−y2� while for the dxz
and dyz out-of-plane orbitals reads Nop↓ =Nxz−Nyz. Thed3z2−r2 �ml=0� out-of-plane orbital gives no contribution tothe orbital moment and was therefore left out. Because themajority states give only a minor contribution, this allowsdirect linking of the occupation number with the orbital mo-ment. We also note that the pure d orbitals have ml=0. How-ever, the spin-orbit interaction produces a mixing of the dorbitals which lifts the ml degeneracy. The resulting curvesclearly suggest that the maximum of the orbital moment an-isotropy occurs at equiatomic composition as a result of theoccupation change in the dx2−y2 and dxy orbitals, both for Feand Co, while the in-plane orbitals give an almost composi-tion independent contribution. Because in the Bruno68 andvan der Laan69 models the MAE is directly linked to L, wecan argue that also the maximum MAE observed for thesame composition is a strict consequence of this fine tuningof the occupation in the 3d↓ orbitals.
As a final remark we want to stress the relevant roleplayed by the substrate. The Pt surface, transferring chargeand forcing a morphological strain in the overlayer FeCofilm, completely modifies the film electronic structure. Thismeans that the system has to be described as a whole andtrying to extrapolate general trends could be misleading. Inthe previous discussion, when attributing to the Fe-Co hy-bridization the bell shape of the MAE vs stoichiometrycurve, we intended to highlight that the major effect of the
d3z2-r2 ml = 0
dyz
E-EF (Ryd)
-15
-10
-5
0
5
10
-0.4 -0.2 0 0.2 0.4-15
-10
-5
0
5
10
-15
-10
-5
0
5
10
-0.4 -0.2 0 0.2 0.4
E-EF (Ryd)
DO
S (1
/Ryd
)D
OS
(1/R
yd)
DO
S (1
/Ryd
)
dx2-y2 ml = 2 dxy ml = -2
ml = 1 dxz ml = -1
Fe0.0Co1.0 Fe0.5Co0.5
FIG. 12. �Color online� Orbital-resolved Co DOS calculated forFe0.5Co0.5 and for the pure Co monolayer films.
Fe Co
Fe Co
dxydyz
DO
S (1
/Ryd
)D
OS
(1/R
yd)
DO
S (1
/Ryd
)
-0.4 -0.2 0 0.2 0.4-0.4 -0.2 0 0.2 0.4
-10
-5
0
5
10
-10
-5
0
5
10
-10
-5
0
5
10
E-EF (Ryd) E-EF (Ryd)
Fe0.5Co0.5
Fe0.25Co0.75
Fe0.75Co0.25
FIG. 13. Color online Orbital-resolved DOS for Fe and Co asa function of the alloy stoichiometry. Reducing the Co content pro-duces for both elements the broadening of in-plane dxy and out-of-plane dyz orbitals. A similar trend is also observed for the otherd orbitals.
HIGH MAGNETIC MOMENTS AND ANISOTROPIES FOR Fe… PHYSICAL REVIEW B 78, 214424 2008
214424-11

electronic hybridization involving Fe, Co, and Pt atoms isseen in the in-plane d orbitals of Fe and Co even if the Ptplays a non-negligible role. This is clearly seen comparing,for example, our results with similar ones for an FeCo mono-layer on Cu�100�.70 In this last case the MAE is found tohave a linear dependence on the film composition.
VI. CONCLUSIONS
The magnetic moments, magnetic anisotropy energies,and coercive fields of monolayer-thick granular and continu-ous FexCo1−x films deposited on a Pt�111� surface have beeninvestigated by XMCD and MOKE, as well as by first-principles electronic structure calculations. XMCD datashow that the effective spin moment of Co and Fe is notcorrelated with the stoichiometry in granular films, contraryto the orbital moment, which shows a maximum at x=0.35for both Fe and Co. The calculated atomic spin moments ofFe and Co are close to 3.0�B and 2.0�B, respectively, andonly weakly composition dependent. The calculated orbitalmoments of Fe and Co are shown to depend on the stoichi-ometry, with a maximum around x=0.6 for both species. Thetotal �spin plus orbital� magnetic moment of the alloyed filmdoes not follow the well-known bell-shaped Slater-Paulingcurve15 observed in bulk bcc FeCo alloys due to the mono-tonic linear dependence of the average spin moment on thefilm composition. The calculated DOS shows that this behav-ior is due to the reduced film dimensionality which, narrow-ing the d-DOS, produces a clear splitting of the Fe 3d↑ and3d↓ spin bands. The MAE strongly depends on the alloycomposition and follows the orbital moment trend, with amaximum around x=0.4 �experiment� and x=0.6 �theory�.The largest MAE value is 0.5 meV/atom, which is more than2 orders of magnitude greater than the MAE of bcc FeCoalloys and similar to the MAE of the highly ordered L10phase of FePt. The element and orbital-resolved DOS clearlydemonstrate that the observed composition dependence is theresult of fine changes of the relative population of spin-downdx2−y2 and dxy in-plane orbitals, both for Fe and Co, while thed3z2−r2, dxz, and dyz out-of-plane orbitals play no role. Chargetransfer from the Pt substrate to the overlayer film, togetherwith spin and orbital moments induced in the Pt atoms, arefound to affect both the Fe-Co hybridization and the overallmagnetic properties.
ACKNOWLEDGMENTS
One of us �J.Z.� would like to thank R. Hammerling andP. Mohn for helpful discussions. Financial support from theSwiss National Science Foundation �Grants No. 200020-109800 and No. 200020-112322� and from the Austrian Sci-ence Fund �FWF� within the Joint Research Programme S90are gratefully acknowledged. Financial support of this workwas also provided by the Austrian Science Foundation�Grant No. WK W004� and Oak Ridge National Laboratory�Subcontracts No. 4000043271 and No. 4000063148�. Weacknowledge the ESRF for provision of beam time and fi-nancial support from the EUROCORES 05-SONS-FP-009SANMAG project of the European Science Foundation.
in-plane orbitals out-of-plane orbitals total
in-plane orbitals out-of-plane orbitals total
Fe Co Average
0.06
FexCo1-x
0.0 0.2 0.4 0.6 0.8 1.00.00
0.01
0.02
0.03
0.04
0.05
0.060.00
0.01
0.02
0.03
0.04
0.05
0.060.00
0.01
0.02
0.03
0.04
0.05
ΔN
d (C
o)Δ
Nd
(Fe)
Δm
L (μ
B/a
tom
)
FIG. 14. �Color online� Anisotropy of orbital moments �top�compared to the anisotropy of the occupation of spin-down orbitalsof Fe �middle� and Co �bottom�. Lines are guides for the eyes.
MOULAS et al. PHYSICAL REVIEW B 78, 214424 �2008�
214424-12

1 The Physics of Ultra-High-Density Magnetic Recording,Springer Series in Surface Sciences Vol. 41, edited by M. L.Plumer, J. van Ek, and D. Weller �Springer, Berlin, 2001�.
2 B. M. Lairson and B. M. Clemens, Appl. Phys. Lett. 63, 1438�1993�.
3 C. Antoniak et al., Phys. Rev. Lett. 97, 117201 �2006�.4 S. Sun, C. B. Murray, D. Weller, L. Folks, and A. Moser, Sci-
ence 287, 1989 �2000�.5 T. Burkert, L. Nordstrom, O. Eriksson, and O. Heinonen, Phys.
Rev. Lett. 93, 027203 �2004�.6 A. Winkelmann, M. Przybylski, F. Luo, Y. Shi, and J. Barthel,
Phys. Rev. Lett. 96, 257205 �2006�.7 F. Yildiz, F. Luo, C. Tieg, R. M. Abrudan, X. L. Fu, A. Winkel-
mann, M. Przybylski, and J. Kirschner, Phys. Rev. Lett. 100,037205 �2008�.
8 P. Gambardella et al., Science 300, 1130 �2003�.9 P. Gambardella, S. S. Dhesi, S. Gardonio, C. Grazioli, P.
Ohresser, and C. Carbone, Phys. Rev. Lett. 88, 047202 �2002�.10 D. Sander, S. Ouazi, A. Enders, T. Gutjahr-Löser, V. S.
Stepanyuk, D. I. Bazhanov, and J. Kirschner, J. Phys.: Condens.Matter 14, 4165 �2002�.
11 C. J. Lin, G. L. Gorman, C. H. Lee, R. F. C. Farrow, E. E.Marinero, H. V. Do, H. Notarys, and C. J. Chien, J. Magn.Magn. Mater. 93, 194 �1991�.
12 N. W. E. McGee, M. T. Johnson, J. J. de Vries, and J. aan deStegge, J. Appl. Phys. 73, 3418 �1993�.
13 T. Katayama, Y. Suzuki, Y. Nishihara, T. Sugimoto, and M.Hashimoto, J. Appl. Phys. 69, 5658 �1991�.
14 D. Weller and A. Moser, IEEE Trans. Magn. 35, 4423 �1999�.15 L. Pauling, Phys. Rev. 54, 899 �1938�.16 R. C. Hall, J. Appl. Phys. 31, S157 �1960�.17 K. Inomata, T. Sawa, and S. Hashimoto, J. Appl. Phys. 64, 2537
�1988�.18 H. Brune, Surf. Sci. Rep. 31, 121 �1998�.19 K. Bromann, H. Brune, M. Giovannini, and K. Kern, Surf. Sci.
388, L1107 �1997�.20 T. Cren, S. Rusponi, N. Weiss, M. Epple, and H. Brune, J. Phys.
Chem. B 108, 14685 �2004�.21 D. Repetto et al., Phys. Rev. B 74, 054408 �2006�.22 E. Lundgren, B. Stanka, M. Schmid, and P. Varga, Phys. Rev. B
62, 2843 �2000�.23 P. Bruno, G. Bayreuther, P. Beauvillain, and C. Chappert, J.
Appl. Phys. 68, 5759 �1990�.24 M. Przybylski, L. Yan, J. Zukrowski, M. Nyvlt, Y. Shi, A.
Winkelmann, J. Barthel, M. Wasniowska, and J. Kirschner,Phys. Rev. B 73, 085413 �2006�.
25 S. Ferrer, J. Alvarez, E. Lundgren, X. Torrelles, P. Fajardo, andF. Boscherini, Phys. Rev. B 56, 9848 �1997�.
26 O. Robach, C. Quiros, P. Steadman, K. F. Peters, E. Lundgren, J.Alvarez, H. Isern, and S. Ferrer, Phys. Rev. B 65, 054423�2002�.
27 H. Bulou and C. Massobrio, Phys. Rev. B 72, 205427 �2005�.28 Y. Xie and J. A. Blackman, Phys. Rev. B 74, 054401 �2006�.29 B. T. Thole, P. Carra, F. Sette, and G. van der Laan, Phys. Rev.
Lett. 68, 1943 �1992�.30 P. Carra, B. T. Thole, M. Altarelli, and X. Wang, Phys. Rev. Lett.
70, 694 �1993�.31 C. T. Chen, Y. U. Idzerda, H. J. Lin, N. V. Smith, G. Meigs, E.
Chaban, G. H. Ho, E. Pellegrin, and F. Sette, Phys. Rev. Lett.75, 152 �1995�.
32 H. H. Hamdeh, B. Fultz, and D. H. Pearson, Phys. Rev. B 39,11233 �1989�.
33 R. Wu and A. J. Freeman, Phys. Rev. Lett. 73, 1994 �1994�.34 J. G. Amar, F. Family, and P.-M. Lam, Phys. Rev. B 50, 8781
�1994�.35 R. Skomski, H.-P. Oepen, and J. Kirschner, Phys. Rev. B 58,
3223 �1998�.36 A. Vaterlaus, O. Portmann, C. Stamm, and D. Pescia, J. Magn.
Magn. Mater. 272-276, 1137 �2004�.37 R. M. Bozorth, Phys. Rev. 50, 1076 �1936�.38 P. Gambardella, A. Dallmeyer, K. Maiti, M. C. Malagoli, S.
Rusponi, P. Ohresser, W. Eberhardt, C. Carbone, and K. Kern,Phys. Rev. Lett. 93, 077203 �2004�.
39 R. Wu, L. Chen, and N. Kioussis, J. Appl. Phys. 79, 4783�1996�.
40 A. Arrott, Phys. Rev. 108, 1394 �1957�.41 J. S. Kouvel, General Electric Research Laboratory Report No.
57-RL-1799 �1957�.42 P. Poulopoulos, M. Farle, U. Bovensiepen, and K. Baberschke,
Phys. Rev. B 55, R11961 �1997�.43 R. Skomski, J. Phys.: Condens. Matter 15, R841 �2003�.44 C. Takahashi, M. Ogura, and H. Akai, J. Phys.: Condens. Matter
19, 365233 �2007�.45 M. Lezaic, P. Mavropoulos, and S. Bluegel, Appl. Phys. Lett.
90, 082504 �2007�.46 M. Pratzer and H. J. Elmers, Phys. Rev. Lett. 90, 077201 �2003�.47 D. Spišák and J. Hafner, Phys. Rev. B 70, 014430 �2004�.48 L. Szunyogh, B. Újfalussy, P. Weinberger, and J. Kollár, Phys.
Rev. B 49, 2721 �1994�.49 H. J. F. Jansen, Phys. Rev. B 59, 4699 �1999�.50 Electron Scattering in Solid Matter, edited by J. Zabloudil, R.
Hammerling, L. Szunyogh, and P. Weinberger �Springer-Verlag,Heidelberg, 2004�.
51 I. Turek, J. Kudrnovsky, V. Drchal, and P. Weinberger, Phys.Rev. B 49, 3352 �1994�.
52 G. Andersson, T. Burkert, P. Warnicke, M. Björck, B. Sanyal, C.Chacon, C. Zlotea, L. Nordström, P. Nordblad, and O. Eriksson,Phys. Rev. Lett. 96, 037205 �2006�.
53 A. Kleibert, J. Passig, K.-H. Meiwes-Broer, M. Getzlaff, and J.Bansmann, J. Appl. Phys. 101, 114318 �2007�.
54 S. Imada, A. Yamasaki, S. Suga, T. Shima, and K. Takanashi,Appl. Phys. Lett. 90, 132507 �2007�.
55 O. Dmitrieva et al., Phys. Rev. B 76, 064414 �2007�.56 W. J. Antel, Jr., M. M. Schwickert, T. Lin, W. L. O’Brien, and G.
R. Harp, Phys. Rev. B 60, 12933 �1999�.57 P. Ohresser, G. Ghiringhelli, O. Tjernberg, N. B. Brookes, and
M. Finazzi, Phys. Rev. B 62, 5803 �2000�.58 M. A. Torija, Z. Gai, N. Myoung, E. W. Plummer, and J. Shen,
Phys. Rev. Lett. 95, 027201 �2005�.59 P. Ohresser, N. B. Brookes, S. Padovani, F. Scheurer, and H.
Bulou, Phys. Rev. B 64, 104429 �2001�.60 K. von Bergmann, S. Heinze, M. Bode, E. Y. Vedmedenko, G.
Bihlmayer, S. Blügel, and R. Wiesendanger, Phys. Rev. Lett. 96,167203 �2006�.
61 I. Yang, S. Y. Savrasov, and G. Kotliar, Phys. Rev. Lett. 87,216405 �2001�.
62 Physics of Ferromagnetism, edited by S. Chikazumi �Clarendon,Oxford, 1997�.
63 R. Richter and H. Eschrig, J. Phys. F: Met. Phys. 18, 1813�1988�.
HIGH MAGNETIC MOMENTS AND ANISOTROPIES FOR Fe… PHYSICAL REVIEW B 78, 214424 �2008�
214424-13

64 R. H. Victora and L. M. Falicov, Phys. Rev. B 30, 259 �1984�.65 R. H. Victora, L. M. Falicov, and S. Ishida, Phys. Rev. B 30,
3896 �1984�.66 G. H. O. Daalderop, P. J. Kelly, and M. F. H. Schuurmans, Phys.
Rev. B 50, 9989 �1994�.67 J. Stöhr, J. Magn. Magn. Mater. 200, 470 �1999�.
68 P. Bruno, Phys. Rev. B 39, 865 �1989�.69 G. van der Laan, J. Phys.: Condens. Matter 10, 3239 �1998�.70 C. Etz, B. Lazarovits, J. Zabloudil, R. Hammerling, B. Újfalussy,
L. Szunyogh, G. M. Stocks, and P. Weinberger, Phys. Rev. B 75,245432 �2007�.
MOULAS et al. PHYSICAL REVIEW B 78, 214424 �2008�
214424-14