Embed Size (px)
Citation preview

ANI7EAD/TM-17
High-Level Waste Inventory, Characteristics,Generation, and Facility Assessment forTreatment, Storage, and Disposal AlternativesConsidered in the U.S. Department of EnergyEnvironmental Management ProgrammaticEnvironmental Impact Statement
by S.M. Folga, G. Conzelmann, J.L. Gillette, P.H. Kier, and L.A. Poch
Environmental Assessment Division,Argonne National Laboratory, 9700 South Cass Avenue, Argonne, Illinois 60439
HDecember 1996 i „ ^ „ 1 , ^ , L v a |
Work sponsored by United States Department of Energy,Assistant Secretary for Environmental Management

DISCLAIMER
This report was prepared as an account of work sponsored by an agency of theUnited States Government. Neither the United States Government nor any agencythereof, nor any of their employees, makes any warranty, express or implied, orassumes any legal liability or responsibility for the accuracy, completeness, or use-fulness of any information, apparatus, product, or process disclosed, or representsthat its use would not infringe privately owned rights. Reference herein to any spe-cific commercial product, process, or service by trade name, trademark, manufac-turer, or otherwise does not necessarily constitute or imply its endorsement, recom-mendation, or favoring by the United States Government or any agency thereof.The views and opinions of authors expressed herein do not necessarily state orreflect those of the United States Government or any agency thereof.
DISCLAIMER
Portions of this document may be illegiblein electronic image prodncts. Images areproduced from the best available original

CONTENTS
NOTATION x
ABSTRACT 1
1 INTRODUCTION 1
1.1 Background and Definition of Waste Type 2
1.2 Storage Technologies 3
2 INVENTORY AND GENERATION VOLUMES 8
2.1 Assumptions 82.2 Volumes by Site 9
2.2.1 Hanford 92.2.2 Savannah River 192.2.3 Idaho National Engineering Laboratory 292.2.4 West Valley Demonstration Project 34
3 FACILITY ASSESSMENT 44
3.1 Hanford Site: Existing Facilities 443.1.1 History 443.1.2 Facility Descriptions and Environmental Releases 443.1.3 Current Status 55
3.2 Hanford Site: Planned Facilities 573.2.1 Hanford High-Level Waste Vitrification Facility 573.2.2 Schedules and Uncertainties 60
3.3 Savannah River Site: Existing Facilities 603.3.1 History 603.3.2 Facility Descriptions and Environmental Releases 623.3.3 Current Status 73
3.4 Savannah River Site: Planned Facilities 733.5 Idaho National Engineering Laboratory: Existing Facilities 76
3.5.1 History 763.5.2 Descriptions and Environmental Releases 763.5.3 Current Status 85
3.6 Idaho National Engineering Laboratory: Planned Facilities 863.7 West Valley Demonstration Project: Existing Facilities 92
3.7.1 History 923.7.2 Facility Descriptions and Environmental Releases 923.7.3 Current Status 98
in

CONTENTS (Cont.)
4 DEFINITION OF ALTERNATIVES 100
4.1 Methodology and Assumptions 1004.2 Descriptions of HLW Cases 103
4.2.1 No Action Alternative 1034.2.2 Decentralized Alternative 1034.2.3 Regionalized Alternatives 103
4.2.3.1 Case 1 1054.2.3.2 Case 2 105
4.2.4 Centralized Alternatives 1054.2.4.1 Case 1 1054.2.4.2 Case 2 109
5 COST ANALYSIS I l l
5.1 Methodology and Assumptions I l l5.2 Current HLW Storage I l l5.3 HLW Pretreatment/Treatment 1125.4 Interim Canister Storage 1165.5 Transportation of HLW Canisters 119
6 UNCERTAINTIES ASSOCIATED WITH HLW 129
6.1 Waste Characterization 1296.2 Technology Listing 1326.3 Facility Assessment 132
7 REFERENCES 134
APPENDIX: Modular Vault Dry Storage Technology 147
TABLES
1.1 Dimensions, Weights, and Radioactivity of HLW Canisters 4
1.2 Interim Storage Facilities for HLW Canisters 7
2.1 Variance in Estimated Transportation Risk When 12,200 versus 15,000Canisters Are Assumed to Be Produced from Hanford's HLW 12
TABLES (Cont.)
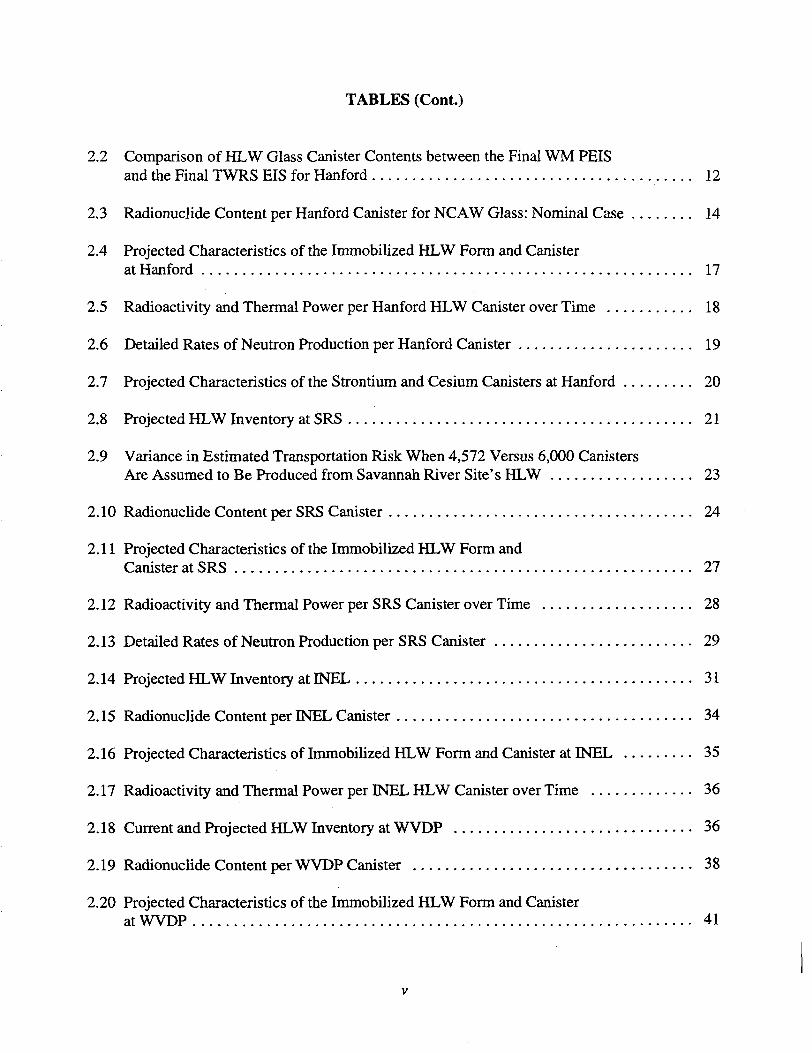
2.2 Comparison of HLW Glass Canister Contents between the Final WM PEIS
and the Final TWRS EIS for Hanford 12
2.3 Radionuclide Content per Hanford Canister for NCAW Glass: Nominal Case 14
2.4 Projected Characteristics of the Immobilized HLW Form and Canister
at Hanford 17
2.5 Radioactivity and Thermal Power per Hanford HLW Canister over Time 18
2.6 Detailed Rates of Neutron Production per Hanford Canister 19
2.7 Projected Characteristics of the Strontium and Cesium Canisters at Hanford 20
2.8 Projected HLW Inventory at SRS 21
2.9 Variance in Estimated Transportation Risk When 4,572 Versus 6,000 Canisters
Are Assumed to Be Produced from Savannah River Site's HLW 23
2.10 Radionuclide Content per SRS Canister 24
2.11 Projected Characteristics of the Immobilized HLW Form and
Canister at SRS 27
2.12 Radioactivity and Thermal Power per SRS Canister over Time 28
2.13 Detailed Rates of Neutron Production per SRS Canister 29
2.14 Projected HLW Inventory at INEL 31
2.15 Radionuclide Content per INEL Canister 34
2.16 Projected Characteristics of Immobilized HLW Form and Canister at INEL 35
2.17 Radioactivity and Thermal Power per INEL HLW Canister over Time 36
2.18 Current and Projected HLW Inventory at WVDP 36
2.19 Radionuclide Content per WVDP Canister 382.20 Projected Characteristics of the Immobilized HLW Form and Canister
at WVDP 41

TABLES (Cont.)
2.21 Radioactivity and Thermal Power per WVDP Canister over Time 42
2.22 Detailed Rates of Neutron Production per WVDP Canister 43
3.1 Current Single-Shell Tank Storage at Hanford 47
3.2 Radionuclide Inventory of Hanford Single-Shell Tank Waste 49
3.3 Current HLW Storage at Hanford 51
3.4 Radionuclide Inventory of Hanford Double-Shell Tank Waste 52
3.5 Estimated Labor Requirements for Current Storage of HLW in DSTsand SSTs at Hanford 52
3.6 Atmospheric Releases of Radionuclides from Current HLW Storageat Hanford 53
3.7 Release Point Characteristics for Atmospheric Emissions for Current Storageand Transfer of HLW at Hanford 53
3.8 Estimated Personnel Requirements and Exposure for Current Storage ofStrontium and Cesium Capsules at Hanford 53
3.9 Estimated Personnel Requirements and Exposure for Transfer
of HLW at Hanford 54
3.10 Atmospheric Releases of Radionuclides from Transfer of HLW at Hanford 55
3.11 Resource Requirements for Construction of the HLW Vitrification
Facility and Support Structures at Hanford 61
3.12 Savannah River Waste Tank Designs 65
3.13 Current HLW Storage at SRS 66
3.14 Radionuclide Content of Current HLW Inventory at SRS 68
3.15 Atmospheric Releases of Radionuclides during Current Storageof HLW at SRS 68
3.16 Release Point Characteristics for Atmospheric Emissions for Current Storageof HLW at SRS 69
VI

TABLES (Cont.)
3.17 Estimated Personnel Requirements and Exposure for Current Storage
of HLW at SRS 69
3.18 Atmospheric Releases of Radionuclides during Transfer of HLW at SRS 71
3.19 Estimated Personnel Requirements and Exposure for HLW Transfer at SRS 71
3.20 Defense Waste Processing Facility at SRS 74
3.21 Facility Characteristics for the Second Glass Canister Storage Building at SRS 75
3.22 Major Components of ICPP High-Level Wastes 78
3.23 Current HLW Storage at INEL 79
3.24 Radionuclide Inventory of Liquid HLW at INEL 81
3.25 Release Point Characteristics for Atmospheric Emissions for the Various
HLW Processes at INEL 83
3.26 New Waste Calcining Facility at INEL 86
3.27 Resource Requirements for HLW Immobilization at INEL 89
3.28 Facility Characteristics for the Glass Canister Storage Building at INEL 91
3.29 Current HLW Storage at WVDP 93
3.30 Mass Amounts of Various Compounds in the THOREX Liquid Wasteat WVDP 94
3.31 Radionuclide Composition of THOREX Liquid HLW at WVDPas of the End of 1989 95
3.32 Release Point Characteristics for Atmospheric Emissions during CurrentStorage and Transfer of HLW at WVDP 96
3.33 Estimated Personnel Requirements and Exposure for Transfer of HLW
at WVDP 97
4.1 Decentralization Alternative 104
4.2 Regionalization Alternative: Case 1 106
Vll

TABLES (Cont.)
4.3 Regionalization Alternative: Case 2 107
4.4 Centralization Alternative: Case 1 108
4.5 Centralization Alternative: Case 2 110
5.1 Unit Storage Cost of HLW at the Three Main DOE Sites 113
5.2 Cost Summary for HLW Pretreatment and Treatment at SRS 113
5.3 Cost Summary for HLW Pretreatment and Treatment of Double-Shell Tank
Waste at Hanford 115
5.4 Cost Summary for HLW Pretreatment and Treatment at INEL 117
5.5 Cost Summary for HLW Pretreatment and Treatment 118
5.6 Cost Characteristics of Interim Glass Canister Storage for the Various
HLW Alternatives 118
5.7 Life-Cycle Cost Analysis for HLW Management Alternatives 120
5.8 Assumed Relationships for the Four Transportation Cost Components 123
5.9 Rail Transportation Cost for HLW 124
5.10 Truck Transportation Cost for HLW 126
5.11 Comparison of Estimated Shipping Costs for Rail and Truck Transport 128
A.I MVDS Resource Characteristics: Construction 151
A.2 Literature Results for MVDS Facility Land Area 154
A.3 Capital Cost Summary for SNF/HLW Interim Storage 156
A.4 Construction Labor as a Function of MVDS Facility Storage Capacity 159
A.5 Literature Results for MVDS Facility Construction Duration 159
A.6 MVDS Resource Characteristics: Operations 161
A.7 Literature Results for MVDS Facility Operation and Maintenance 164viii

TABLES (Cont.)
A.8 Literature Results for MVDS Facility Loading/Unloading 164
A.9 Literature Results for MVDS Facility Work Force 165
A. 10 Annual Waste Generation during MVDS Facility Loading/Unloading 166
FIGURES
3.1 Map of the Hanford Site 45
3.2 Schematic of the 200 West and 200 East Chemical Process Areas 46
3.3 Flow Diagram of the HWVP Process 58
3.4 Flow Diagram for Defense Waste Processing Facility 63
3.5 Map of the Savannah River Site 64
3.6 Map of the Idaho National Engineering Laboratory 77
3.7 Flow Diagram for the Idaho Waste Immobilization Facility 88
3.8 Map of the West Valley Demonstration Project 90
3.9 Flow Diagram for West Valley Demonstration Project 99
A.1 Floor Area as a Function of Capacity: MVDS Interim Storage 155
A.2 Capital Cost as a Function of Capacity: MVDS Interim Storage 158
IX

NOTATION
The following is a list of acronyms and abbreviations (including units of measure) used inthis document.
ACRONYMS, INITIALISMS, AND ABBREVIATIONS
AcAgAmANLAt
BaBDATBiBOYBWR
CCCaF2
CdCeCFMUTCHCISVCmCoCPCCrCsCSBCSSCSSFCSTPBCTSCWCCY
D&DDFDOE
DsrDWPF
actiniumsilveramericiumArgonne National Laboratoryastatine
bariumbest demonstrated available technologybismuthbeginning of yearboiling-water reactor
complexant concentratecalcium fluoridecadmiumceriumconcentrator feed makeup tankcontact-handledcanister interim storage vaultcuriumcobaltchemical process cellchromiumcesiumCanister Storage BuildingCement Solidification SystemCalcine Solids Storage Facilitycesium tetraphenyl boratecomponent test standCentral Waste Complexcalendar year
decontamination and decommissioningdecontamination factorU.S. Department of Energydouble-shell tankDefense Waste Processing Facilitv

EISEPAEu
FeFrFSVFTEFY
GAOGdGWSB
HEPAHIPHLWHWVP
IIAEAICPPIDBIDOEFSFInINCESfELIRTSISFISFSIIWIF
KKTPB
LaLCCLLWLRWHFLWTS
MCSBMFHTMPSC
environmental impact statementU.S. Environmental Protection Agencyeuropium
ironfranciumFort St. Vrainfull-time equivalentfiscal year
U.S. General Accounting OfficegadoliniumGlass Waste Storage Building
high efficiency particulate airhot isostatic pressinghigh-level wasteHanford Waste Vitrification Plant
iodineInternational Atomic Energy AgencyIdaho Chemical Processing PlantIntegrated Data BaseIdaho Operations OfficeIrradiated Fuel Storage FacilityindiumIdaho Nuclear CorporationIdaho National Engineering LaboratoryIntegrated Radwaste Treatment SystemInterim Storage Facilityindependent spent fuel storage installationIdaho Waste Immobilization Facility
potassiumpotassium tetraphenyl borate
lanthanumlife-cycle costslow-level wasteLiquid Radioactive Waste Handling FacilityLiquid Waste Treatment System
modified canister storage buildingmelter feed hold tankMultiDuroose Processing and Storage Como
XI

MRSMVDS
NaNO2
NaOHNaTiNaTPBNbNCAWNCRWNdNEPANiNOX
NpNRCNWCF
O&MORNL
PaPdPEISPFPPmPNLPrPSCoPuPUREXPWR
RaRCRAREDOXRhRHRnRODRu
SbSCTSFCMSGCSB
monitored retrievable storagemodular vault dry storage
sodium nitratesodium hydroxidesodium titinatesodium tetraphenyl borateniobiumneutralized current acid wasteneutralized cladding removal wasteneodymiumNational Environmental Protection Actnickelnitrogen oxideneptuniumU.S. Nuclear Regulatory CommissionNew Waste Calcining Facility
operation and maintenanceOak Ridge National Laboratory
protactiniumpalladiumprogrammatic environmental impact statementPlutonium Finishing PlantpromethiumPacific Northwest LaboratorypraseodymiumPublic Service Company of Coloradoplutoniumplutonium/uranium extractionpressurized water reactor
radiumResource Conservation and Recovery Actreduction/oxidationrhodiumremote-handledradonRecord of Decisionruthenium
antinomyshielded canister transporterslurry fed ceramic meltersecond slass canister storage buildine
Xll

Sm samariumSMWS Sludge Mobilization and Waste SystemSn tinSNF spent nuclear fuelSO 2 sulfur dioxideSOX sulfur oxideSr strontiumSRS Savannah River siteSST single-shell tankSTS Supernatant Treatment System
Tb terbiumTc technetiumTCLP toxicity characteristic leaching procedureTe telluriumTh thoriumTi titaniumTHOREX thorium extractionTPA Tri-Party AgreementTRUW transuranic wasteTWRS Tank Waste Remediation System
U uraniumUSDC U.S. District Court
VF Vitrification FacilityVOC volatile organic compound
WAC waste acceptance criteriaWCF Waste Calcining FacilityWCSF Waste Canister Storage FacilityWESF Waste Encapsulation and Storage FacilityW M Waste ManagementWNYNSC Western New York Nuclear Services CenterWSRC Westinghouse Savannah River CompanyWVDP West Valley Demonstration Project
Y yttrium
Zr zirconium
xin

UNITS OF MEASURE
Bq°CCicmcm3
dop
ftft3
ggalGWhhhain.kgkmkWLlbmm2
m3
man-yrmmmremMTMTHMMTUMWradremst(amWworker-yrwt%yr
becquerel(s)degree(s) Celsiuscurie(s)centimeter(s)cubic centimeter(s)day(s)degree(s) Fahrenheitfoot(feet)cubic foot(feet)gram(s)gallon(s)gigawatt hour(s)hourhectare(s)inch(es)kilogram(s)kilometer(s)kilowatt(s)liter(s)pound(s)meter(s)square meter(s)cubic meter(s)man-year(s)millimeter(s)millirem(s)metric ton(s)metric ton(s) of heavy metalmetric ton(s) of uraniummegawatt(s)radiation absorbed doseroentgen equivalent mansecond(s)ton(s) (metric)micrometer(s)watt(s)worker-year(s)weight percentyear(s)
XIV

HIGH-LEVEL WASTE INVENTORY, CHARACTERISTICS, GENERATION, ANDFACILITY ASSESSMENT FOR TREATMENT, STORAGE, AND DISPOSAL*
ALTERNATIVES CONSIDERED IN THE U.S. DEPARTMENT OFENERGY WASTE MANAGEMENT PROGRAMMATIC
ENVIRONMENTAL IMPACT STATEMENT
by
S.M. Folga, G. Conzelmann, J.L. Gillette, P.H. Kier, and L.A. Poch
ABSTRACT
This report provides data and information needed to support the risk andimpact assessments of high-level waste (HLW) management alternatives in theU.S. Department of Energy Waste Management (WM) ProgrammaticEnvironmental Impact Statement (PEIS). Available data on the physical form,chemical and isotopic composition, storage locations, and other wastecharacteristics of interest are presented. High-level waste management follows siximplementation phases: current storage, retrieval, pretreatment, treatment, interimcanister storage, and geologic repository disposal; pretreatment, treatment, andrepository disposal are outside the scope of the WM PEIS. Brief descriptions ofcurrent and planned HLW management facilities are provided, includinginformation on the type of waste managed in the facility, costs, product form,resource requirements, emissions, and current and future status. Data sources andtechnical and regulatory assumptions are identified. The range of HLWmanagement alternatives (including decentralized, regionalized, and centralizedapproaches) is described. The required waste management facilities includeexpanded interim storage facilities under the various alternatives. Resourcerequirements for construction (e.g., land and materials) and operation (e.g., energyand process chemicals), work force, costs, effluents, design capacities, andemissions are presented for each alternative.
1 INTRODUCTION
The two primary sources of high-level radioactive wastes (HLWs) in the United States are(1) defense wastes generated from the reprocessing of spent nuclear fuel (SNF) and weaponsproduction targets and (2) commercial wastes generated from the power reactor fuel cycle. Spent
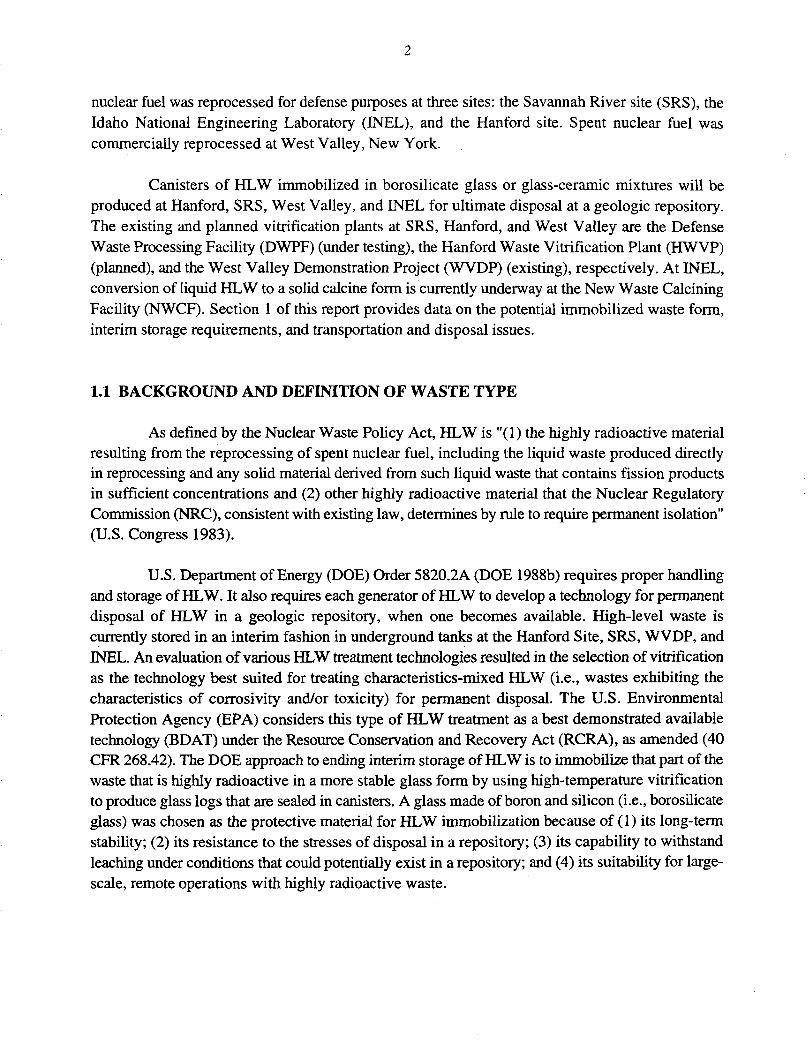
nuclear fuel was reprocessed for defense purposes at three sites: the Savannah River site (SRS), theIdaho National Engineering Laboratory (INEL), and the Hanford site. Spent nuclear fuel wascommercially reprocessed at West Valley, New York.
Canisters of HLW immobilized in borosilicate glass or glass-ceramic mixtures will beproduced at Hanford, SRS, West Valley, and INEL for ultimate disposal at a geologic repository.The existing and planned vitrification plants at SRS, Hanford, and West Valley are the DefenseWaste Processing Facility (DWPF) (under testing), the Hanford Waste Vitrification Plant (HWVP)(planned), and the West Valley Demonstration Project (WVDP) (existing), respectively. At INEL,conversion of liquid HLW to a solid calcine form is currently underway at the New Waste CalciningFacility (NWCF). Section 1 of this report provides data on the potential immobilized waste form,interim storage requirements, and transportation and disposal issues.
1.1 BACKGROUND AND DEFINITION OF WASTE TYPE
As defined by the Nuclear Waste Policy Act, HLW is "(1) the highly radioactive materialresulting from the reprocessing of spent nuclear fuel, including the liquid waste produced directlyin reprocessing and any solid material derived from such liquid waste that contains fission productsin sufficient concentrations and (2) other highly radioactive material that the Nuclear RegulatoryCommission (NRC), consistent with existing law, determines by rule to require permanent isolation"(U.S. Congress 1983).
U.S. Department of Energy (DOE) Order 5820.2A (DOE 1988b) requires proper handlingand storage of HLW. It also requires each generator of HLW to develop a technology for permanentdisposal of HLW in a geologic repository, when one becomes available. High-level waste iscurrently stored in an interim fashion in underground tanks at the Hanford Site, SRS, WVDP, andINEL. An evaluation of various HLW treatment technologies resulted in the selection of vitrificationas the technology best suited for treating characteristics-mixed HLW (i.e., wastes exhibiting thecharacteristics of corrosivity and/or toxicity) for permanent disposal. The U.S. EnvironmentalProtection Agency (EPA) considers this type of HLW treatment as a best demonstrated availabletechnology (BDAT) under the Resource Conservation and Recovery Act (RCRA), as amended (40CFR 268.42). The DOE approach to ending interim storage of HLW is to immobilize that part of thewaste that is highly radioactive in a more stable glass form by using high-temperature vitrificationto produce glass logs that are sealed in canisters. A glass made of boron and silicon (i.e., borosilicateglass) was chosen as the protective material for HLW immobilization because of (1) its long-termstability; (2) its resistance to the stresses of disposal in a repository; (3) its capability to withstandleaching under conditions that could potentially exist in a repository; and (4) its suitability for large-scale, remote operations with highly radioactive waste.

Two of the HLW sites (WVDP and SRS) plan to use cylindrical stainless steel canisters,61 cm (24 in.) in diameter and 300 cm (118 in.) long, filled with borosilicate glass to about 85% ofthe canister volume. The canister design for the WVDP design has a smaller wall thickness and awider fill neck than that proposed for SRS. On the basis of the current design, the canisters will befabricated from 304L stainless steel.
Neither the canister dimensions nor the waste form has been decided for Hanford and INEL.The sizing of the HLW canisters to be produced at the Hanford site is in the conceptual stage andhas not been finalized (DOE 1996a). For consistency, this analysis applies the dimensions of theHanford reference canister for HLW disposal given in ORNL (1995): a diameter of 68 cm (26.8 in)and a length of 457 cm (180 in) with a nominal glass volume of 1.26 m3 (44.5 ft3) and an averagewaste oxide loading of 45%. It should be noted, however, that alternative canister designs with wasteglass oxide volumes of 0.62 m3 (22 ft3) and 10 m3 (360 ft3) are being proposed in the Tank WasteRemediation System (TWRS) EIS (DOE 1996a). The mass of HLW waste oxide glass is estimatedto be approximately 4,200 kg per canister, based on a canister volume of 1.26 m3 and an assumedglass density of 3,300 kg/m3.
In June 1995, DOE selected a preliminary waste form and a process technology to treat thesodium-bearing waste and immobilized calcine at INEL. The current reference waste form at INELis a glass, with each canister assumed to nominally contain 0.92 m3 (32.5 ft3) of waste glass (ORNL1995). The dimensions for the proposed INEL canister are not available but may be expected to bebounded by those at the other three HLW sites. The mass of HLW waste oxide glass is estimated inthis study to be approximately 2,400 kg per canister, based on a canister volume of 0.92 m and aglass density of 2,600 kg/m3 (WINCO 1994).
Table 1.1 summarizes the canister dimensions, weights, and radioactivity for the four HLWsites. The values for radioactivity and decay heat are estimates of the maximum values at the timeof filling. The values in Table 1.1 may change, depending on future changes in HLW managementplans (potential changes for the various sites are noted in the section for each site).
1.2 STORAGE TECHNOLOGIES
Under the DOE approach to long-term HLW management, liquid HLW in current storagewill be vitrified, placed in canisters, and stored in an interim on-site storage facility awaitingtransport to a geologic repository. Canisters produced at WVDP would be placed in storage racksthat hold four canisters each (Peters and Leap 1987). The canisters would then be transported in theracks to the on-site Waste Canister Storage Facility (WCSF). The immobilized HLW would betemporarily stored in a previously decontaminated and refurnished process cell known as thechemical process cell (CPC), which has been modified for HLW interim storage. The rackscontaining the HLW canisters would be stored on two levels because this configuration provides a
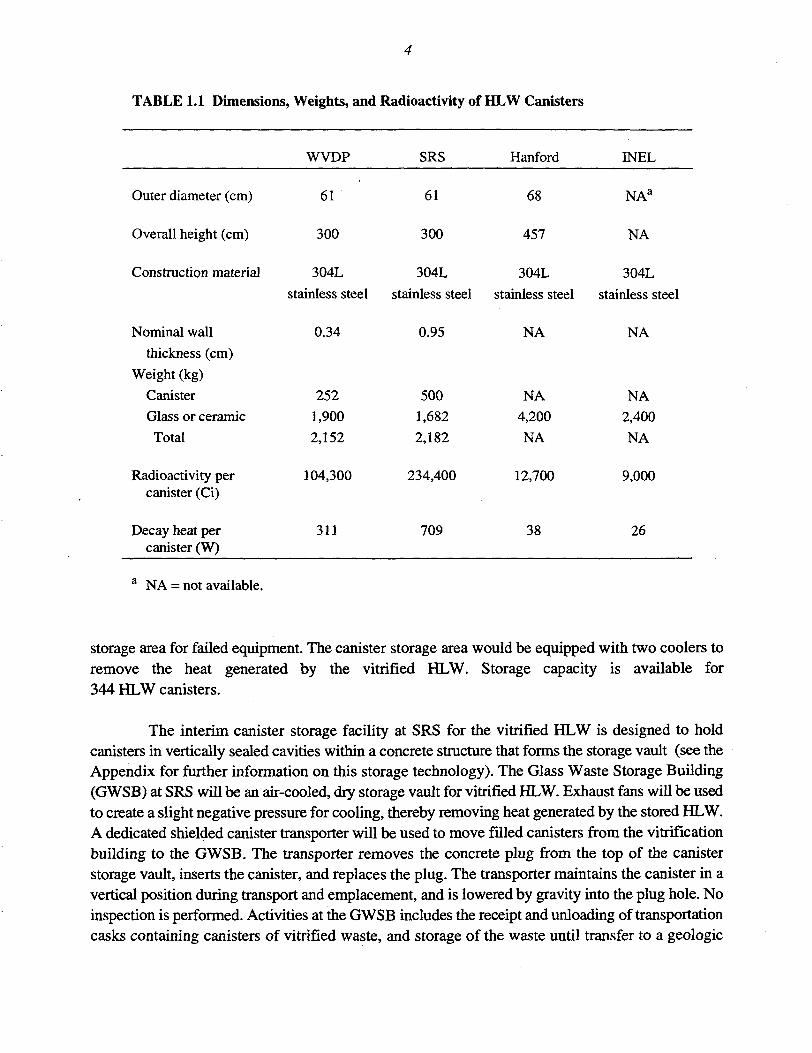
TABLE 1.1 Dimensions, Weights, and Radioactivity of HLW Canisters
WVDP SRS Hanford INEL
Outer diameter (cm)
Overall height (cm)
61
300
61
300
68
457
NAa
NA
Construction material 304L 304L 304L 304L
stainless steel stainless steel stainless steel stainless steel
Nominal wallthickness (cm)
Weight (kg)
Canister
Glass or ceramic
Total
Radioactivity percanister (Ci)
Decay heat percanister (W)
0.34
252
1,900
2,152
104,300
311
0.95
500
1,682
2,182
234,400
709
NA
NA
4,200
NA
12,700
38
NA
NA
2,400
NA
9,000
26
a NA = not available.
storage area for failed equipment. The canister storage area would be equipped with two coolers toremove the heat generated by the vitrified HLW. Storage capacity is available for344 HLW canisters.
The interim canister storage facility at SRS for the vitrified HLW is designed to holdcanisters in vertically sealed cavities within a concrete structure that forms the storage vault (see theAppendix for further information on this storage technology). The Glass Waste Storage Building(GWSB) at SRS will be an air-cooled, dry storage vault for vitrified HLW. Exhaust fans will be usedto create a slight negative pressure for cooling, thereby removing heat generated by the stored HLW.A dedicated shielded canister transporter will be used to move filled canisters from the vitrificationbuilding to the GWSB. The transporter removes the concrete plug from the top of the canisterstorage vault, inserts the canister, and replaces the plug. The transporter maintains the canister in avertical position during transport and emplacement, and is lowered by gravity into the plug hole. Noinspection is performed. Activities at the GWSB includes the receipt and unloading of transportationcasks containing canisters of vitrified waste, and storage of the waste until transfer to a geologic

repository. The GWSB will consist of rows of tubes placed below grade into which the canisters willbe lowered. The canisters will not be stacked within the storage tubes, and concrete plugs willprovide a cover for the tubes. The canisters will be stored in sealed sleeves so that the cooling airwill not directly come into contact with the potentially contaminated surfaces of the HLW canisters.Storage capacity is currently provided for 2,286 canisters; this capacity accommodatesapproximately five years of vitrification operations at the DWPF. The storage capacity of theexisting facility was predicated on the assumption that a geologic repository would be available by1992, the time at which fresh waste would have been processed. Additional storage capacity for2,286 HLW canisters (to be made available in the year 2007) will be required if the opening of thegeologic repository is delayed to FY 2015.
Canister estimates for Hanford and INEL are less certain because pretreatment and wasteminimization processes have not yet been finalized. The construction of the Hanford WasteVitrification Plant was delayed because of insufficient capacity to vitrify the HLW fraction of allHanford double-shell tank (DST) and single-shell tank (SST) waste in the planned time frame. It isestimated that approximately 2,000 standard-sized (0.62 m ) canisters containing glass logs will beproduced from the HLW currently stored within the Hanford DSTs. The number of canisters fromSST wastes is currently unknown because the pretreatment process has not been selected; amaximum of 70,000 canisters has been projected for minimal pretreatment (DOE 1996a). Theestimated number of HLW canisters to be produced from vitrification of the Hanford Site tank wastedepends on site-specific decisions regarding pretreatment and disposal reached under the TWRSEnvironmental Impact Statement (EIS) currently under development (DOE 1996a). For the purposesof this study, it is assumed that an estimated 15,000 canisters will be produced from treating existingHanford HLW. The vitrified HLW canisters at Hanford will be placed in an on-site interim storagefacility, where they would be stored awaiting shipment and disposal at the national geologicrepository. The interim storage method at Hanford is assumed in this analysis to be similar to thatemployed at SRS.
The only other HLW forms produced at Hanford that may require treatment and storage arestrontium (Sr) and cesium (Cs) capsules. These capsules were produced over the years when thehigh-heat-emitting isotopes (Sr-90 and Cs-137, plus their progeny) were removed from the oldwaste, converted to solids (strontium fluoride and cesium chloride), placed in double-walledcapsules, and stored in a water basin. These isotopes are currently contained in seal-welded, high-integrity, double-encapsulated stainless steel or Hastelloy capsules (DOE 1987). Each capsule hasan external diameter of approximately 6.7 cm (2.6 in.) and an overall length of about 53 cm (21 in.).Six hundred five Sr-90 capsules and 1,338 Cs-137 capsules are available for disposal (ORNL 1995).The cesium and strontium capsules currently are classified as waste by-product and have potentialcommercial value as irradiation or heat sources. Additional measures will be required to remediatethe capsules if and when they are reclassified as waste. The cesium and strontium capsules may notmeet the current waste acceptance criteria of the national geologic repository because the waste isin a corrosive form (cesium and strontium salts). It is possible that these capsules may be opened at

Hanford and their contents combined with other feeds to vitrification. DOE policy is to dispose ofreadily retrievable HLW in a national geologic repository, and therefore it would appear that thestrontium and cesium will go to the repository; whether these wastes will go as capsules enclosedin overpacks or in vitrified form has not been decided (DOE 1996a). The reference case of theHanford TWRS is to overpack the capsules (Wodrich 1992), which would comply with the Recordof Decision (ROD) for the disposal of Hanford HLW (DOE 1988a). In this report, it is assumed thatthe cesium and strontium capsules will be packaged in 0.3-m (l-ft)-diameter1 2.7-m (8.5-ft)-talloverpack canisters in accordance with repository waste acceptance criteria and will not requirevitrification; a total of approximately 320 overpack canisters will require interim storage.
It is assumed that interim storage of the overpack canisters will be at the MultipurposeProcessing and Storage Complex (MPSC) (Wodrich 1992; Nyman et al. 1993). The MPSC isdesigned to provide interim dry storage of special-case wastes and will be located in the vicinity ofthe Central Waste Complex (CWC) in the 200 West Area at Hanford. The overpack canisters couldconceivably be stored on an interim basis by using one or more of the following dry storage systems:metal casks, concrete casks, horizontal concrete modules, dual-purpose casks, and modular concretevaults. Because the cesium/strontium canisters will presumably be shipped to a geologic repositoryfor final disposal if and when they are reclassified as waste, the dry storage technology will mostlikely be similar to that utilized for the glass canisters (i.e., modular concrete vaults).
High-level waste generated during reprocessing at INEL initially took the form of an acidicliquid. In 1963, INEL began to calcine this waste into a dry, granular solid that was then stored in4-m (13-ft)-diameter, 14-m (46-ft)-tall stainless steel bins housed in reinforced concrete vaults withan expected lifetime of at least 500 years. Of the four DOE sites containing HLW, INEL HLW willbe processed last because it is in a fairly stable solid form. Full-scale immobilization is projected tostart by FY 2015 (DOE 1995c). It is assumed that on-site storage will be required for the entireinventory of HLW glass canisters produced at INEL, pending transport off site and disposal in ageologic repository.
The method of interim storage at INEL has not been determined, but it is indicated inWINCO (1994) to be similar to the enclosed vault storage concept outlined in Feizollahi andShropshire (1993). The technical characteristics of the enclosed vault storage concept appear to beanalogous to the modular vault storage concept applied at SRS, in that waste packages are storedbelow-grade in storage vaults, and are loaded and retrieved remotely by an overhead bridge crane.In this analysis, it is assumed that the HLW glass canisters at INEL are stored in modular vaults.
Table 1.2 gives a comparison of the interim storage facilities.

TABLE 1.2 Interim Storage Facilities for HLW Canisters
Facility
Storage capacity(HLW canisters)
Storage method
Footprint (m )
Vault volume (m3)
Cooling method
WVDP
CPC
344
Process cell
190
2,490
Air cooler
SRS
GWSB
12,286b
Modular concrete vault
4,343
63,404
Exhaust fans
Hanford
DST and SST Wastes
TBDa
15,000
Modular concrete vault
12,200
141,000
Natural convection
Strontium/CesiumCapsules
MPSC
320
Modular concrete vault0
«l,500d
= 18,000
Natural convection0
1NEL
TBDa
1,700
Modular concrete vault0
3,200d
47,000
Natural convection0
a To be determined. Facility not yet constructed; conceptual design being evaluated.b Additional storage capacity of over 2,286 canisters will also be required if the repository opening is delayed until FY 2015.
0 Assumed; actual dry storage technology is to be determined (Nyman et al. 1993).
Determined by correlation, assuming single canister stacking within a storage tube (due to high heat generation rate).

8
2 INVENTORY AND GENERATION VOLUMES
The following sections describe the current inventory of HLW at the four sites thatreprocessed SNF—Hanford, INEL, SRS, and WVDP. Projections of the quantities of HLW to beproduced at each site in upcoming years are provided, as are projections of the number of canistersof treated HLW to be produced at each site. The principal assumptions used in making theseprojections are noted.
2.1 ASSUMPTIONS
DOE decided in 1992 to phase out operations involving the reprocessing of SNF for therecovery of enriched uranium or plutonium in support of national defense activities. Thus, thequantity of HLW to be treated, stored, and disposed of within DOE Waste Management (WM)programs will consist primarily of the material already in storage at each of the four sites plus wastegenerated during decontamination and decommissioning (D&D) activities with radioactivity levelshigh enough to warrant management similar to HLW. Very little additional HLW is expected to begenerated as a result of environmental restoration activities (DOE 1993b) and, therefore, such wasteis not considered in this analysis.
It is assumed that only SRS will add to the current HLW inventory (about 15% of the totalSRS HLW inventory in FY 2015). The F- and H-Canyon stabilization and decommissioning projectsmay be expected to average about 1,000 m3/yr of material assumed to be managed as HLW.
The SRS WM EIS (DOE 1995a) provides estimates of the minimum and maximumamounts of wastes that may be generated in the future, to account for wastes that may be generatedduring interim management of nuclear materials. This analysis applies the inventory from theexpected waste forecast.
Radioactive, sodium-containing liquid waste produced at INEL from decontamination andsolvent recovery operations is stored in the Idaho Chemical Processing Plant (ICPP) tank farm andis managed as HLW. Currently, the most effective method of processing the sodium-containingwaste consists of calcining it as a blend with fluorine waste generated from fuel reprocessingoperations. The ICPP is required to continue to calcine liquid wastes in accordance with the Noticeof Noncompliance Consent Order, which stipulates that the removal of wastes from existing tankfarms should begin by the late 1990s.
HLW is not projected to be generated at either WVDP or Hanford. Projections for futureHLW inventories at Hanford are based on the assumptions that spent fuel reprocessing at thePUREX Plant will not resume and that irradiated N-Reactor fuel at Hanford will remain in storage
without further processing that may result in the generation of HLW. Newly generated waste atHanford would typically consist of liquid low-activity waste from several facilities at Hanford, afraction (about one-third) of which was produced by facility transition activities. Additionally,approximately 1,930 cesium and strontium capsules are currently classified as waste by-product. Onealternative in the TWRS EIS (DOE 1996a) considers vitrifying the cesium and strontium capsuleswith the Hanford tank waste after reclassifying them as HLW. This analysis assumes the cesium andstrontium capsules to be waste by-product, but does examine the consequences of their potentialreclassification as HLW.
The waste in underground tank storage at the Hanford site consists of mixed hazardousHLW, mixed hazardous TRUW, and mixed hazardous LLW, but is managed as HLW at Hanford.It is assumed that tank wastes that could be classified as TRUW will be blended with other HLWstreams and vitrified for disposal at the national geological repository.
2.2 VOLUMES BY SITE
The radioactive waste inventory indicates that most of the wastes stored have alreadyundergone one or more treatment processes, such as neutralization or precipitation, and that suchwastes are not in the same form as when they were initially generated or characterized.
The total volume of HLW at all sites at the end of CY 1994 was about 379,000 m3
(100 million gal) with a total radioactivity of about 1 x 10⁹ Ci. The DOE began vitrification of someof the current inventory in 1996; therefore, the net projected total cumulative volume of stored HLWat the end of 2000 is projected to be 341,000 m (90 million gal) at a total radioactivity ofapproximately 7 x 10⁸ Ci.
2.2.1 Hanford
The HLW currently stored at the Hanford Site is a result of fuel reprocessing operationscarried out since 1943. The waste, abundant in fission products and transuranics, is currently storedin 177 underground storage tanks built between 1943 and 1986. The 177 tanks are comprised of149 older SSTs and 28 newer DSTs. The SSTs, built between 1943 and 1964, are approaching theiroperating lifetime of 50 years, and as a result of safety concerns, HLW has been transferred fromSSTs to DSTs since the 1960s.
At the end of 1991, approximately 238,900 m3 (63.1 million gal) of HLW was stored atHanford. This volume represents the largest DOE inventory at a single site and is about 63% of thetotal DOE HLW. The radioactivity level of this waste totaled about 348 million Ci at the end of1991, which is approximately 36% of the total HLW radioactivity. Some of this waste is stored in

10
149 SSTs. No waste has been added to the SSTs since 1980. This waste consists of about 83,200 m3
(22 million gal) of liquid waste consisting of free tank supernatant in single- and double-shell tanksand drainable interstitial liquid in single-shell tanks, and 155,800 m3 (41 million gal) of solid tankwaste consisting of sludge and salt cake in single- and double-shell tanks. Waste was first put in theSSTs in the 1940s and considerable uncertainty exists regarding its composition because of poorrecord keeping of waste inventories and the mixing of waste streams that has occurred over theyears. The waste in the SSTs consists of HLW, TRUW, and several LLWs but is managed as HLWat Hanford. The HLW inventory in 2015 (neglecting volume reduction due to treatment) is projectedto be on the order of 213,211 m3 (56 million gal).
Projections for current and future HLW inventories at Hanford are taken from the FinalEnvironmental Impact Statement Safe Interim Storage of Hanford Tank Wastes (DOE 1995d) andthe Draft Environmental Impact Statement for the Tank Waste Remediation System (DOE 1996a),and are based on the assumptions that spent fuel reprocessing will not resume and that irradiatedspent fuel at Hanford will remain in wet storage without further processing that may result in thegeneration of HLW.
Most of the Sr-90 and the Cs-137 (plus their radiological progeny) has been removed fromthe original waste during 1974 and 1984 and converted to strontium fluoride and cesium chloride,which are solids. These solids have been placed in double-walled capsules and stored in a waterbasin. DOE leased about half of the 1,577 cesium capsules to commercial enterprises, primarily formedical sterilization purposes. Of the 1,577 cesium capsules and 640 strontium capsules produced,a total of 249 cesium capsules and 35 strontium capsules have been dismantled. In 1988, DOErecalled the capsules after one leaked a very small amount of radioactive material. The finalshipment of cesium capsules back to the Hanford site occurred during September 1996. A total of1,328 cesium capsules (totaling 2.5 m3 [88 ft3]) and 605 strontium capsules (totaling 1.1m3 [39 ft3])are currently in storage at Hanford.
The TWRS Final EIS, issued in August 1996, addresses actions to manage and dispose ofapproximately 212,000 m (56 million gal) of radioactive, hazardous, and mixed waste within theTWRS program at Hanford (61 FR 45949). The EIS also addresses actions to manage and disposeof the cesium and strontium contained in approximately 1,930 metal, double-walled capsules. TheEIS identifies Phased Implementation as the preferred alternative for remediating Hanford's high-level tank waste. Under the Phased Implementation alternative, the high-level tank waste would beremediated in a two-phase process. Phase 1 would involve design, construction, and operation ofdemonstration-scale treatment facilities. Phase 2 would be implemented following Phase 1 andwould involve the design, construction, and operation of full-scale treatment facilities to remediatethe remainder of the tank waste. Under both phases of the preferred alternative, the HLW would bevitrified and placed into canisters for interim storage pending off-site disposal at a geologicrepository. Vitrification of all Hanford HLW is expected to be completed by 2028.

The estimated number of HLW canisters to be produced from vitrification of the HanfordSite tank waste depends on the performance of separations and treatment processes implemented totreat the HLW, and the canister size. For purposes of this analysis, an estimated 15,000 standardcanisters (each containing 0.62 m [22 ft] of borosilicate glass) were assumed to be produced fromtreating existing HLW (Walters 1995). This value is based on the preliminary analysis performedfor the TWRS. The Draft Environmental Impact Statement for the Tank Waste Remediation System(DOE 1996a) indicates a total of 33,400 HLW canisters, with a range between 13,600 to 70,000canisters. Recent communication between S. Folga (Argonne National Laboratory) and R. Lober(DOE/Richland) on July 25,1996, indicated that the canister totals provided in the draft TWRS EISshould be considered to be fairly conservative, and that a value of 23,000 canisters may be moreappropriate. More recent information received from P. LaMont (DOE/Richland) on July 29, 1996,indicates a new canister total of 12,200 (each containing 1.15 m3 [40.6 ft3] of borosilicate glass),based on Hanford's submittal to the Integrated Data Base 1996 data call and the current revision ofthe draft TWRS EIS. Given the current uncertainty concerning the total number of canistersestimated to be generated at Hanford, it was conservatively assumed to be 15,000 canisters, inagreement with the canister inventory applied in the Draft Waste Management Programmatic EIS(DOE 1995b) (WM PEIS).
Preliminary analysis indicates that the impacts associated with the canister total of 12,200indicated in DOE (1996a) are similar to those for the canister inventory applied in the FinalWM PEIS (i.e., 15,000) (Table 2.1). The Final WM PEIS forecasts conservative results because thenumber of canisters applied in the Final WM PEIS analyses is greater than in the TWRS EIS (DOE1996a) and an individual canister has a greater radiological activity (by approximately 50%)compared with the TWRS EIS (as indicated by Table 2.2). Thus, an accident associated with thiscanister would have greater impacts (as an example) and the occupational dose received by the workforce during interim storage of HLW canisters pending disposal at the national geologic repositoryappears to be greater using the WM PEIS canister inventory, again due to the higher radiologicalactivity of a single canister. The overall risk of transportation would decrease on the average by 10%and at most by 12% for the No Action Alternative using the lower Hanford canister number(Table 2.1). In general, the final number of canisters at Hanford would depend on the performanceof separations and treatment processes implemented to treat the HLW. It would appear that theuncertainty in the total number of canisters at Hanford would not significantly affect comparisonsamong alternatives within the WM PEIS concerning HLW management.
Recently, DOE and state and federal environmental regulators agreed on a modification tothe Hanford Tri-Party Agreement (TPA 1994). Under this new agreement, tank waste will undergolimited pretreatment to maximize the routing of radioactivity to the HLW vitrification facility whiledirecting the bulk of the tank waste material to the LLW vitrification facility and all tank wastes willbe vitrified. The proposed changes include delaying the HLW vitrification project so thatimmobilization of low-activity radioactive waste can be factored in. Construction of the HLWtreatment facility is to begin in 2002 and facility operations are to begin in December 2009;vitrification is to be completed by December 2028.

12
TABLE 2.1 Variance in Estimated Transportation RiskWhen 12,200 versus 15,000 Canisters Are Assumed to BeProduced from Hanford's HLW
WMPEISAlternative
No Action
Decentralization
Regionalization, Case 1
Regionalization, Case 2
Centralization, Case 1
Centralization, Case 2
Truck
Crew
-11
-10
-10
-10
-11
- 8
(%>
Public
-11
-11
-11
-10
-11
-8
Rail
Crew
-12
-11
-11
-11
-11
-9
(%)
Public
-10
-10
-9
- 9
-10
- 8
TABLE 2.2 Comparison of HLW Glass Canister Contents between the Final WM PEIS and theFinal TWRS EIS for Hanford
Major Radionuclidesin Hanford HLW
SR-90
Y-90
Tc-99
Cs-137
Ba-137m
Sm-151
Pu-238
Pu-239
Pu-240
Pu-242
Am-241
Am-242
Total
Total Activityfor HLW GlassCanisters (Ci)
2.713E+07
2.713E+07
3.209E+04
1.760E+07
1.667E+07
8.205E+05
1.090E+03
2.632E+04
6.667E+03
2.801E-01
1.O07E+05
5.373E+01
8.955E+07
Final TWRS EISa
Total Numberof HLWCanisters
12,200
12,200
12,200
12,200
12,200
12,200
12,200
12,200
12,200
12,200
12,200
12,200
12,200
Activity perHLW Canister(Ci/canister)
2.22E+03
2.22E+03
2.63E+00
1.44E+03
1.37E+03
6.73E+01
8.93E-02
2.16E+00
5.46E-01
2.30E-05
8.25E+00
4.40E-03
7.34E+03
Final WMPEISb
Activity perHLW Canister(Ci/canister)
2.98E+04
2.98E+04
7.50E+00
3.61E+04
3.40E+04
6.98E+02
4.40E-01
1.20E+00
3.90E-01
7.60E-05
2.84E+02
2.20E-01
1.37E+05
Variance(%)
-93%
-93%
-65%
-96%
-96%
-90%
-80%
80%
40%
-70%
-97%
-98%
-95%
DOE (1996a).
DOE (1996b).

13
This analysis assumes the DWPF canister design for the vitrified Hanford tank waste, witha canister volume of 0.62 m3 (22 ft3) of borosilicate glass at a waste loading of 25 wt%. Theradionuclide composition of the HLW canisters assumed in this analysis is shown in Table 2.2 alongwith the mass, radioactivity, and thermal power for each radionuclide. These values represent theactivity level of the HLW at the beginning of 1990 and are based on nominal values of theneutralized cladding acidic waste (NCAW) reference feed to the HWVP. It was previously intendedby DOE to remove the NCAW prior to other wastes (GAO 1993). The NCAW constitutes about6 percent of the waste in DSTs, has a relatively well defined composition, and is currently stored intwo DSTs.
The current Hanford approach is to blend the HLW retrieved from all 177 tanks prior topretreatment. It would be expected that canisters produced from the vitrification of the blended DSTand SST wastes will have significantly lower values for radioactivity content and thermal power thanfor the canisters produced from only the DST waste at Hanford. One approach to estimate the"average" canister radioactivity for the blended DST and SST wastes is to divide the totalradioactivity of the two streams (2.12 x 10⁸ Ci) by the estimated number of canisters (15,000) toarrive at an average value of approximately 14,000 Ci per canister, which is an order-of-magnitudelower than that estimated based on the DST waste alone (137,000 Ci/canister). This result indicatesthat the nominal NCAW radionuclide concentration may be too conservative in comparison with theblended SST and DST waste compositions. It should be noted that a more accurate approach whichaccounts for the amount of radioactivity associated with the low-level waste (LLW) fraction afterwaste pretreatment would result in a canister radioactivity lower than the value of 14,000 Ci percanister calculated above. However, because of the uncertainty concerning tank retrieval andpretreatment, the data used in this report for the canister contents at Hanford are from (Mitchell andNelson 1988), which is based on the HLW in the 10 DSTs at Hanford.
As previously mentioned, the specific disposal method for the existing strontium andcesium capsules has not been selected. One possibility is to place the capsules in overpacks forrepository emplacement. An issue is that this overpack concept may not meet the waste acceptancecriteria (WAC) for disposal in a national repository. Another possibility is to open the capsules andcombine the strontium and cesium with one of the low-heat feeds to the HWVP for vitrification. Ifthis is done, the maximum radioactivity and thermal output per canister could conceivably exceedthe quantities shown in Table 2.3.
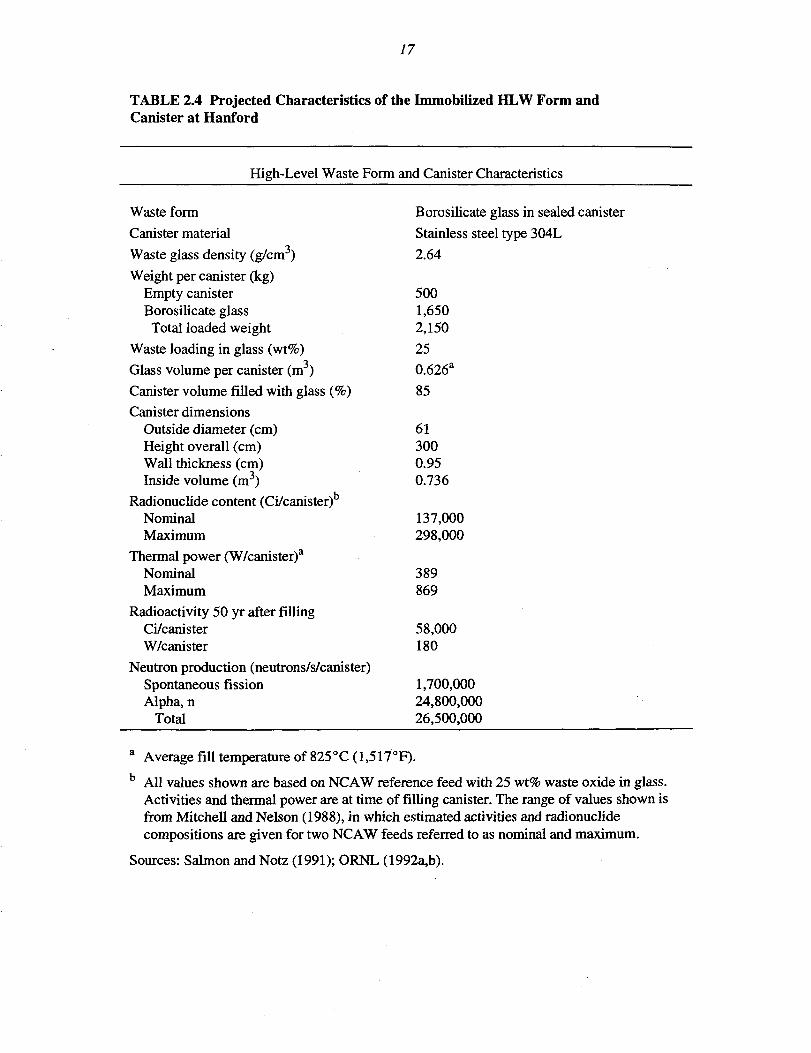
The HLW canister assumed in this analysis is made of 304L stainless steel pipe with anoutside diameter of 61 cm (24 in.), a length of 300 cm (118 in.), and a thickness of 0.95 cm(0.37 in.). The canister is identical to that planned for use at the Savannah River DWPF. Table 2.4gives additional information on the canister and the HLW glass. The fill level of the canister isapproximately 85% of the available internal canister fill volume, which results in a canister glassvolume of 0.63 m3 (22 ft3). A 15% void volume minimizes the potential of canister overfill.Table 2.5 gives the decay of radioactivity and thermal power for a single vitrified HLW canister.

14
TABLE 2.3 Radionuclide Content per Hanford Canister for NCAWGlass: Nominal Case3
Radionuclide
Fe-55
Ni-59
Co-60
Ni-63
Se-79
Sr-89
Sr-9O
Y-90
Y-91
Nb-93m
Zr-93
Zr-95
Nb-95
Tc-99
Ru-103
Rh-103m
Ru-106
Rh-106
Pd-107
Ag-llOm
Cd-113m
In-113m
Sn-113
Cd-115m
Sn-119m
Sn-121m
Sn-123
Sn-126
Sb-124
Sb-126
Sb-126m
Sb-125
Te-125m
Te-127
Mass(g/canister)
7.2E-03
1.4
1.3E-03
2.0E-01
4.5E-02
1.8E-17
2.2E+02
5.5E-02
5.6E-15
2.2E-03
4.2E+02
1.4E-13
1.7E-13
4.4E+02
1.0E-22
9.3E-26
1.3E-02
1.2E-08
5.9E+01
4.7E-07
3.9E-02
6.0E-15
1.0E-11
1.3E-22
1.5E-06
1.3E-03
4.4E-09
1.3E+01
6.6E-19
6.1E-07
4.7E-09
2.5E-01
3.4E-03
2.5E-12
Radioactivity(Ci/canister)
1.8E+01
1.1E-01
1.5
1.2E+01
3.1E-03
5.4E-13
2.9E+04
2.9E+04
1.4E-10
6.2E+01
1.1
2.9E-09
6.7E-09
7.5
3.4E-18
3.0E-18
4.2E+01
4.2E+01
3.0E-02
2.2E-03
8.5
1.0E-07
1.0E-07
3.2E-18
6.8E-03
7.8E-02
3.7E-05
3.7E-01
1.2E-14
5.1E-02
3.7E-01
2.5E+02
6.2E+01
6.6E-06
Thermal Power(W/canister)
6. IE-04
4.3E-06
2.3E-02
4.9E-03
7.8E-07
1.9E-15
3.5E-01
1.7E+02
5.0E-13
1.1E-04
1.2E-04
1.5E-11
3.2E-11
3.8E-03
1.1E-20
7.0E-22
2.5E-03
4.0E-01
1.8E-06
3.7E-05
1.4E-02
2.4E-10
1.7E-11
1.2E-20
3.5E-06
1.6E-04
1.1E-07
4.6E-04
1.5E-16
9.4E-04
4.6E-03
7.9E-01
5.2E-02
8.8E-O9

TABLE 2.3 (Cont.)
Radionuclide
Te-127mTe-129Te-129m1-129Cs-134Cs-135Cs-137Ba-137mCe-141Ce-144Pr-144Pr-144mPm-147Pm-148mSm-151Eu-152Gd-153Eu-154Eu-155Tb-160U-234U-235U-236U-238Np-237Pu-238Pu-239Pu-240Pu-241Pu-242Am-241Am-242Am-243
Mass(g/canister)
7.1E-101.5E-301.6E-277.3E-027.2E-021.8E+024.2E+026.3E-051.0E-262.5E-021.1E-065.3E-095.6
2.9E-232.7E+018. IE-033.8E-095.4E-012.9E-018.4E-177.3E-018.8E+016.5
1.0E+042.2E+022.61.9E+011.7
1.2E-012.0E-028.3E+012.7E-071.9E-01
Radioactivity(Ci/canister)
6.7E-063.1E-234.8E-231.3E-059.3E+012.0E-013.6E+043.4E+042.9E-228.0E+018.0E+019.6E-015.2E+036.2E-196.7E+021.4
1.4E-051.5E+021.4E+029.5E-134.6E-031.9E-044.2E-043.5E-031.6E-014.4E-011.2
3.9E-011.3E-017.6E-052.8E+022.2E-013.8E-02
Thermal Power(W/canister)
3.6E-091.1E-258.4E-266.0E-099.5E-016.7E-054.0E+011.3E+024.3E-255.3E-025.9E-013.3E-041.9
7.9E-218.2E-021.1E-021.2E-081.3
1.0E-017.7E-151.3E-045.0E-061.1E-058.9E-054.8E-031.5E-023.6E-021.2E-023.9E-042.2E-069.4
2.5E-041.2E-03

16
TABLE 2.3 (Cont.)
Mass Radioactivity Thermal PowerRadionuclide (g/canister) (Ci/canister) (W/canister)
Cm-242Cm-244
Total
5.5E-O56.2E-02
« 1.3E+04
1.8E-015.0
« 1.4E+05
6.7E-031.8E-01
« 3.9E+02
a This table identifies the nominal expected activity of HWVP canisters atthe time of vitrification. Canister contains 1,650 kg of HLW glass(85% fill).
Source: Mitchell and Nelson (1988).
A package consisting of immobilized radioactive wastes must have adequate shielding inorder to be handled safely. Gamma rays are emitted from the decay of the fission products, neutronparticles from the spontaneous fission of any actinides present, and alpha particles from alpha-emitting radionuclides. Table 2.6 gives the calculated neutron production rates from spontaneousfission and (alpha, n) reactions for a single vitrified HLW canister on the basis of NCAW glass. Theneutron production rates shown are uniform source terms for the glass rather than dose rates at theexterior; consequently, the shielding effects of the borosilicate glass and canister wall have not beenincluded. The results show that (alpha, n) reactions account for more than 93% of the total neutronproduction.
The strontium and cesium capsules in storage at Hanford are currently classified as wasteby-product, which means that they are available for productive use if uses can be found. DOE isattempting to find uses for the strontium and cesium capsules in storage at Hanford; for example,the strontium could be used as a source of heat and the cesium could be used to sterilize medicalequipment or to irradiate food to extend its shelf life. If the decision is made to reclassify thestrontium and cesium capsules as HLW requiring disposal in a national geologic repository, thestrontium and cesium capsules are assumed in this analysis to be placed in racks and inserted intocanisters. Two proposed designs (thin wall and cast steel) for the overpack canisters have beenproposed (ORNL 1992a). The design currently proposed in the Final TWRS EIS (DOE 1996a) isthe Hanford Multi-Purpose Canister, which would be approximately 4.6 m (15 ft) long and 1.4 m(4.5 ft) in diameter. Although the proposed canister design has not yet been decided, in this report,it is assumed that the Hanford Multi-Purpose Canister will be used to contain the strontium andcesium capsules. The annular region between the capsules and the canister may be filled withmaterial that would immobilize the capsule contents upon breakdown of the capsule integrity;examples are natural ion-exchange materials such as chabazite and clinoptilolite.
17
TABLE 2.4 Projected Characteristics of the Immobilized HLW Form andCanister at Hanford
High-Level Waste Form
Waste form
Canister material
Waste glass density (g/cm3)
Weight per canister (kg)Empty canisterBorosilicate glassTotal loaded weight
Waste loading in glass (wt%)
Glass volume per canister (m3)
Canister volume filled with glass (%)
Canister dimensionsOutside diameter (cm)Height overall (cm)Wall thickness (cm)Inside volume (m3)
Radionuclide content (Ci/canister)NominalMaximum
Thermal power (W/canister)a
NominalMaximum
Radioactivity 50 yr after fillingCi/canisterW/canister
Neutron production (neutrons/s/canister)Spontaneous fissionAlpha, n
Total
and Canister Characteristics
Borosilicate glass in sealed canister
Stainless steel type 304L
2.64
5001,6502,150
25
0.626a
85
613000.950.736
137,000298,000
389869
58,000180
1,700,00024,800,00026,500,000
a Average fill temperature of 825°C (1,517°F).b All values shown are based on NCAW reference feed with 25 wt% waste oxide in glass.
Activities and thermal power are at time of filling canister. The range of values shown isfrom Mitchell and Nelson (1988), in which estimated activities and radionuclidecompositions are given for two NCAW feeds referred to as nominal and maximum.
Sources: Salmon and Notz (1991); ORNL (1992a,b).

18
TABLE 2.5 Radioactivity and Thermal Power perHanford HLW Canister over Time
Decay Time afterImmobilization
(yr)
0125
1015203050
100200300350500
1,0002,0005,000
10,00020,00050,000
100,000500,000
1,000,000
TotalRadioactivity per
Canister(Ci)
136,900132,600128,500118,200104,20092,50082,30065,20041,00013,100
1,570375260157702412121110
9.25.33.6
Total ThermalPower perCanister
(W)
3893803703443062732431941254410
6.25.64.32.0
0.440.060.050.040.030.030.050.04
Source: Adapted from ORNL (1992a). Based on NCAWreference feed with 25 wt% waste oxide in glass.
The number of strontium or cesium capsules per canister is limited by heat load. An internalrack would support either three or four strontium or cesium capsules along the axis of the canister.This arrangement would allow the decay heat to be distributed along the entire canister area, thusavoiding excessive local heat rates. The number of capsules per canister would depend on thethermal limitations of the capsules themselves and the thermal limit based on the heat load limit ofthe HLW geologic repository. The total thermal power of the capsules at the end of 2010 would be111 kW for the strontium capsules and 181 kW for the cesium capsules, on the basis of the capsuleoverpacking completed at the end of 2010 (ORNL 1992a). The values would decrease to 85.1 kWand 143.9 kW for the strontium and cesium capsules, respectively, based on December 31, 2019. Ifit is assumed that the strontium and cesium capsules will not be placed together in a canister and that

19
the thermal limits for strontium and cesium overpacks are 1.17 kW and 0.8 kW, respectively, theneach overpack canister will contain eight strontium or cesium capsules. A total of 76 strontiumcanisters and 166 cesium canisters would result (242 total canisters). Table 2.7 gives thecharacteristics of the strontium and cesium capsules. The thermal power for the two canister contentswas estimated on the basis of the radionuclide content, using the "Q" values reported in ORNL(1992a).
2.2.2 Savannah River
SRS was established in 1950 by the U.S. Atomic Energy Commission to produce nuclearmaterials for the nation's defense (DOE 1995a). The production of these nuclear materials resultedin radioactive waste by-products and hazardous waste that have been stored at SRS. In the early1980s, the DOE initiated efforts to end the interim storage of its HLW at SRS by developing plansto vitrify the waste in the DWPF.
TABLE 2.6 Detailed Rates of Neutron Productionper Hanford Canister (neutrons/s)a
Actinide
U-238
Pu-238
Pu-239
Pu-240
Pu-242
Am-241
Cm-242
Cm-244
Total
(Alpha, n)
5.1E+01
3.2E+04
4.7E+04
1.8E+04
3.5
2.4E+07
3.0E+04
6.4E+05
2.5E+07
SpontaneousFission
1.4E+02
1.2E+02
6.2E-01
2.2E+03
5.8E+01
2.1E+02
3.3E+03
1.7E+06
1.7E+06
Total
1.9E+02
3.2E+04
4.7E+04
2.0E+04
6.1E+01
2.4E+07
3.4E+04
2.4E+06
2.7E+07
a Neutron production rates are source terms in the glass;shielding effects of the glass and the canister wall havenot been calculated.
Source: ORNL (1992a) based on NCAW reference feedwith 25 wt% waste oxide in glass.

20
TABLE 2.7 Projected Characteristics of the Strontium and Cesium Canisters at Hanford
Canister Characteristics Strontium Fluoride Cesium Chloride
Estimated number of repository canisters
Material
Dimensions
Outer diameter (cm)
Overall height (cm)
Radionuclide content as of 1990(Ci/canister)
Thermal power as of 1990(W/canister)
Radionuclide content as of 2019(Ci/canister)
Thermal power as of 2019(W/canister)
76 166
Hanford Multi-Purpose Hanford Multi-PurposeCanister Canister
140460
Sr-90:Y-90:
3,460
Sr-90:Y-90:1,120
2.8E+062.8E+05
1.7E+051.7E+05
140460
Cs-137: 2.6E+05Ba-137m: 2.5E+05
1,240
Cs-137: 1.8E+05Ba-137m: 1.7E+05
867
Sources: Adapted from ORNL (1992a,b).
The SRS has a large inventory of HLW. At the end of 1994, approximately 126,300 m3
(34 million gal) of HLW with a radioactivity level of about 535 million Ci was in storage inunderground, double-walled tanks. These figures represent about 33 and 56% of the total volumeand radioactivity, respectively, of DOE HLW (ORNL 1995). At the end of 1994, the forms of HLWat SRS included about 58,100 m3 (15 million gal) of liquid tank waste and 68,200 m3 (18 milliongal) of solids consisting of sludge, salt cake, and precipitate. Radioactivity levels at the end of 1994were about 231 million Ci in the sludge and about 302 million Ci in the solids (ORNL 1995). Asgenerated, most of the waste was in the form of an acidic liquid. Alkaline liquid and sludge areproduced when the acidic liquid is treated with caustic (sodium hydroxide) and as the mixture settleswith time, respectively. Salt cake is produced when the supernatant liquor is concentrated inevaporators and the precipitate results from treatment of the salt cake with an in-tank precipitationprocess.
Table 2.8 gives the projections of the HLW inventory at SRS based on the Savannah RiverSite Waste Management Final Environmental Impact Statement (DOE 1995a). This documentprovides estimates of the minimum and maximum amounts of wastes that may be generated in thefuture, to account for wastes that may be generated during interim management of nuclear materials.This analysis applies the inventory from the expected waste forecast. Additions to the current HLWinventory at SRS (about 15% of the total SRS HLW inventory in FY 2015) are primarily due tofacility stabilization activities such as the F- and H- Canyon stabilization and decommissioning

21
TABLE 2.8 Projected HLW Inventory at SRS
Year
199519961997
199819992000
20012002200320042005200620072008200920102011201220132014
2015
Total (1995-2015)
Current (1994)
Total SRS HLWInventory at 2015
Liquid
Expected
2,5984,3173,7522,432
1,7882,175
2,175857
228126126126126126126126126126126126126
21,834
130,581
152,415
HLW Volume
Minimum
7051,3171,158
1,240326
387387387387387387387387387387387387387387387387
10,938
(m3)
Maximum
2,598
4,3584,358
4,3212,611
2,1742,174
850227227227227227227227227227227227227227
26,395

22
projects, which may be expected to average about 1,000 m /yr of material assumed to be managedas HLW.
For purposes of this study, the estimated total number of canisters is assumed to equal thetotal planned interim storage capacity of HLW canisters, or 4,572 canisters. This value is derivedfrom the documents, Final Supplemental Environmental Impact Statement, Defense WasteProcessing Facility (DOE 1994b) and the Savannah River Site Waste Management FinalEnvironmental Impact Statement (DOE 1995a). The value of 4,572 canisters estimated to begenerated at SRS is referenced in the recent document Storage and Disposition of Weapons-UsableFissile Materials Draft Programmatic Environmental Impact Statement (DOE 1996c), based on thetwo previously-cited documents. The current storage capacity is stated to be 2,286 canisters, withcapacity for additional 2,286 canisters to be available in year 2007, for a total of 4,572 canisters.
The numbers of canisters applied in the WM PEIS analyses are based on the currentoperating plans and projected funding assumed within the Defense Waste Processing Facility(DWPF) SEIS and the SRS WM EIS, which indicated DOE expected by 2018 that the HLW at SRSwould have been processed into borosilicate glass and the HLW tanks would be empty. Operationof the DWPF would occur from FY 1996 to 2018. Decisions made pursuant to other NationalEnvironmental Protection Act (NEPA) analyses pursued after the DWPF SEIS and the SRS WM EIScould extend the period of HLW generation and increase the number of expected canisters.
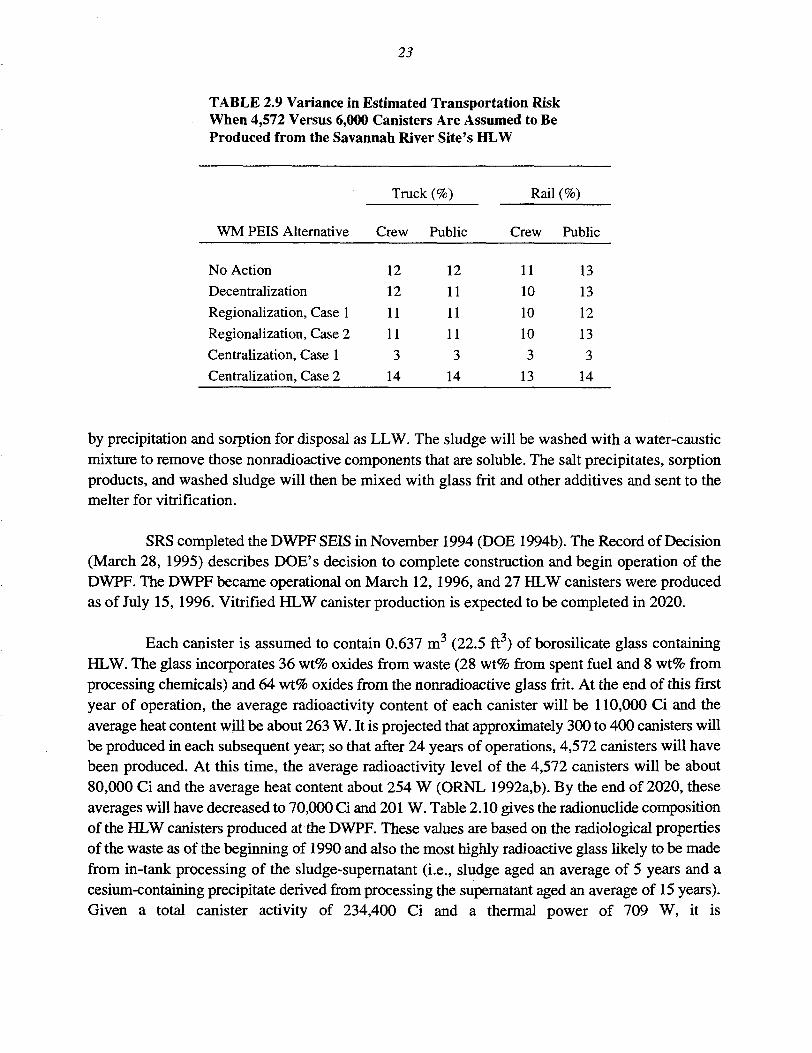
The latest version of the HLW System Plan (DOE 1995h) presents a total of approximately6,000 canisters projected to be produced at SRS. Preliminary analysis indicates that the impactsassociated with the higher total number of canisters (i.e., 6,000) are similar to those for the canisterinventory applied in the WM PEIS (i.e., 4,572). The WM PEIS forecasts conservative resultsbecause although the numbers of canisters applied in the WM PEIS analyses are lower than theHLW System Plan (DOE 1995b), an individual canister has a greater radiological activity comparedwith the HLW System Plan, and thus an accident associated with this canister would have greaterimpacts (as an example). Similarly, the occupational dose received by the work force during interimstorage of HLW canisters pending disposal at the national geologic repository appears to be greaterusing the WM PEIS canister inventory, again due to the higher radiological activity of a singlecanister. The overall risk of transportation would increase on the average by 11% and at most by14% for the Centralized Alternative, Case 2 using the higher SRS canister number (see Table 2.9).It would appear that the uncertainty in the total number of canisters at SRS would not significantlyaffect comparisons among alternatives in the WM PEIS concerning HLW management.
The DWPF was built to treat HLW at SRS. Construction of this facility was initiated in1983 and completed in 1990. An 18-month testing program for the DWPF began in March 1993. Theprogram started with cold chemical runs to test the DWPF's ability to receive and process wastestreams and will be followed with hot operations using surrogate radioactive waste stimulants. TheHLW will initially be pretreated with in-tank processing. The salt portion will be decontaminated
23
TABLE 2.9 Variance in Estimated Transportation RiskWhen 4,572 Versus 6,000 Canisters Are Assumed to BeProduced from the Savannah River Site's HLW
WM PEIS Alternative
No Action
Decentralization
Regionalization, Case 1
Regionalization, Case 2
Centralization, Case 1
Centralization, Case 2
Truck
Crew
12
12
11
11
3
14
(%)
Public
12
11
11
11
3
14
Rail
Crew
11
10
10
10
3
13
(%)
Public
13
13
12
13
3
14
by precipitation and sorption for disposal as LLW. The sludge will be washed with a water-causticmixture to remove those nonradioactive components that are soluble. The salt precipitates, sorptionproducts, and washed sludge will then be mixed with glass frit and other additives and sent to themelter for vitrification.
SRS completed the DWPF SEIS in November 1994 (DOE 1994b). The Record of Decision(March 28, 1995) describes DOE's decision to complete construction and begin operation of theDWPF. The DWPF became operational on March 12, 1996, and 27 HLW canisters were producedas of July 15, 1996. Vitrified HLW canister production is expected to be completed in 2020.
Each canister is assumed to contain 0.637 m3 (22.5 ft3) of borosilicate glass containingHLW. The glass incorporates 36 wt% oxides from waste (28 wt% from spent fuel and 8 wt% fromprocessing chemicals) and 64 wt% oxides from the nonradioactive glass frit. At the end of this firstyear of operation, the average radioactivity content of each canister will be 110,000 Ci and theaverage heat content will be about 263 W. It is projected that approximately 300 to 400 canisters willbe produced in each subsequent year; so that after 24 years of operations, 4,572 canisters will havebeen produced. At this time, the average radioactivity level of the 4,572 canisters will be about80,000 Ci and the average heat content about 254 W (ORNL 1992a,b). By the end of 2020, theseaverages will have decreased to 70,000 Ci and 201 W. Table 2.10 gives the radionuclide compositionof the HLW canisters produced at the DWPF. These values are based on the radiological propertiesof the waste as of the beginning of 1990 and also the most highly radioactive glass likely to be madefrom in-tank processing of the sludge-supernatant (i.e., sludge aged an average of 5 years and acesium-containing precipitate derived from processing the supernatant aged an average of 15 years).Given a total canister activity of 234,400 Ci and a thermal power of 709 W, it is

24
TABLE 2.10 Radionuclide Content per SRS Canistera
Radionuclide
Cr-51Co-60Ni-59Ni-63Se-79Rb-87Sr-89Sr-90Y-90Y-91Zr-93Zr-95Nb-94Nb-95Nb-95mTc-99Ru-103Ru-106Rh-103mRh-106Pd-107Ag-llOmCd-113Cd-115mSn-121mSn-123Sn-126Sb-124Sb-125Sb-126Sb-126mTe-126mTe-127Te-128mTe-129Te-129mCs-134Cs-135
Mass(g/canister)
1.0E-211.5E-013.2E-014.8E-022.4
1.0E+011.5E-093.4E+028.8E-023.1E-084.4E+024.7E-075.1E-045.4E-073.3E-1O1.8E+025.2E-136.7E-015.0E-166.3E-072.9E+012.6E-051.5E-014.8E-141.3E-033.1E-051.6E+014.1E-128.2E-017.4E-075.6E-091.5E-024.6E-081.3E-051.5E-191.6E-162.6E-018.6E+01
Radioactivity(Ci/canister)
9.3E-171.7E+022.4E-023.0
1.7E-018.7E-074.3E-054.7E+044.8E+047.6E-04
1.1
1.0E-029.6E-052.1E-021.2E-043.1
1.7E-082.3E+031.6E-082.3E+031.5E-011.3E-015.0E-141.2E-097.9E-022.5E-014.4E-017.1E-088.5E+026.2E-024.4E-012.8E+021.2E-011.2E-013.1E-124.7E-123.4E+049.9E-02
Thermal Power(W/canister)
2.0E-202.6
9.5E-073.0E-044.2E-057.3E-101.5E-075.4E+012.7E+022.7E-061.3E-045.1E-059.8E-071.0E-041.7E-021.5E-035.8E-111.3E-013.8E-122.2E+018.7E-072.1E-038.4E-174.5E-121.6E-048.0E-045.5E-049.4E-102.7
1.1E-035.6E-032.3E-011.6E-046.6E-05LIE-148.3E-153.4
3.3E-05

TABLE 2.10 (Cont)
25
Radionuclide
Cs-136Cs-137Ba-136mBa-137mBa-140La-140Ce-141Ce-142Ce-144Pr-143Pr-144Pr-144mAnd-144And-147Pm-147Pm-148Pm-148mSm-147Sm-148Sm-149Sm-151Eu-152Eu-154Eu-155Eu-156Tb-160Ti-208U-232U-233U-234U-235U-236U-238Np-236Np-237Pu-236Pu-237
Mass(g/canister)
1.1E-44
4.9E+023.2E-507.7E-051.4E-417.7E-431.3E-154.0E+023.1E-021.8E-341.3E-046.5E-074.1E+021.6E-492.6E+014.2E-164.7E-148.8E+011.9E+017.4
9.4
2.1E-022.3
1.0
9.5E-379.9E-113.8E-126.3E-041.6E-045.5
7.3E+011.7E+0131,2201.3E-061.3E+012.3E-047.4E-16
Radioactivity(Ci/canister)
7.8E-404.3E+048.6E-394.2E+041.0E-364.3E-373.6E-119.6E-069.8E+031.2E-349.8E+031.2E+024.9E-101.3E-432.4E+047.0E-111.1E-092.0E-065.8E-121.8E-122.5E+023.7
6.2E+024.8E+025.2E-321.1E-061.1E-031.3E-021.6E-063.4E-021.6E-041.1E-031.1E-021.7E-088.9E-031.2E-018.9E-12
Thermal Power(W/canister)
1.1E-424.8E+011.0E-411.6E+022.9E-397.2E-385.3E-140
6.5E-022.3E-387.3E+014.1E-020
3.0E-478.7
5.4E-131.3E-112.7E-086.9E-140
2.9E-022.8E-025.5
3.5E-015.4E-349.1E-092.6E-054.3E-044.6E-089.9E-044.1E-063.1E-052.7E-043.5E-112.7E-044.2E-033.3E-15

26
TABLE 2.10 (Cont.)
Radionuclide
Pu-238Pu-239Pu-240Pu-241Pu-242Am-241Am-242Am-242mAm-243Cm-242Cm-243Cm-244Cm-245Cm-246Cm-247Cm-248
Total
Mass(g/canister)
8.7E+012.1E+023.8E+011.6E+013.2
3.2
1.8E-O81.5E-022.9E-021.1E-051.1E-041.3
3.9E-051.7E-067.1E-091.6E-10
=3.4E+04
Radioactivity(Ci/canister)
1.4E+031.3E+018.7
1.7E+031.2E-021.1E+011.4E-021.4E-025.8E-033.5E-025.6E-031.1E+016.7E-065.3E-076.6E-136.9E-13
=2.3E+05
Thermal Power(W/canister)
4.9E+014.0E-012.7E-015.2E-013.6E-043.7E-011.6E-055.7E-061.9E-041.3E-032.0E-043.8
2.2E-071.7E-082. IE-148.5E-14
=7.1E+02
a Quantities shown are for sludge-precipitate glass and are based on Baxter(1988), assuming sludge aged an average of five years and supernatant agedan average of five years, with a canister load of 1,682 kg of glass.Radionuclide contents are at time of filling canister.
Source: Adapted from Baxter (1988).
expected that the maximum values of radioactivity and thermal power of any HLW glass producedat SRS will not exceed the values shown in Table 2.10.
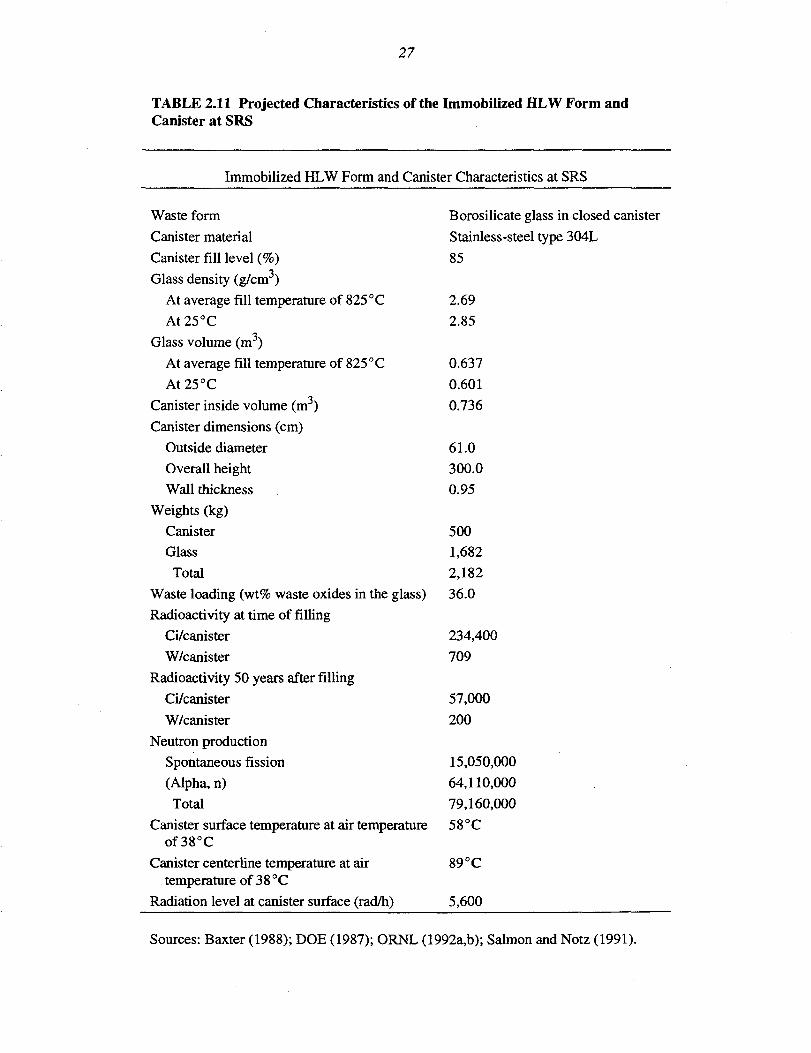
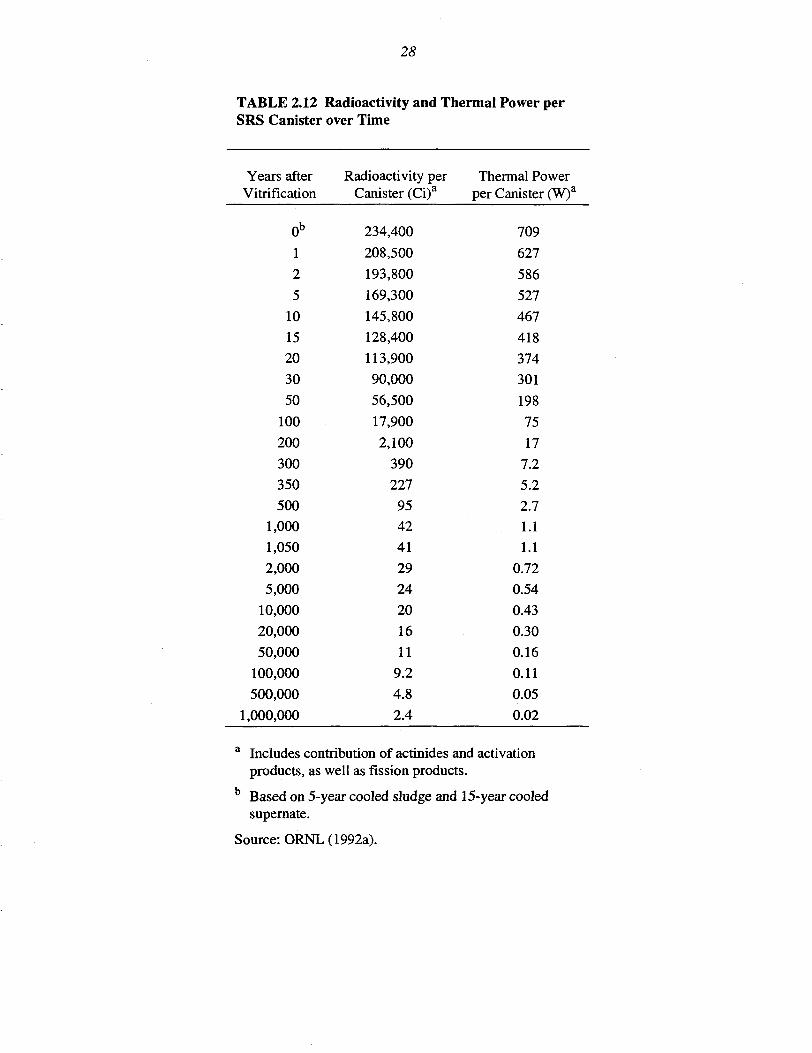
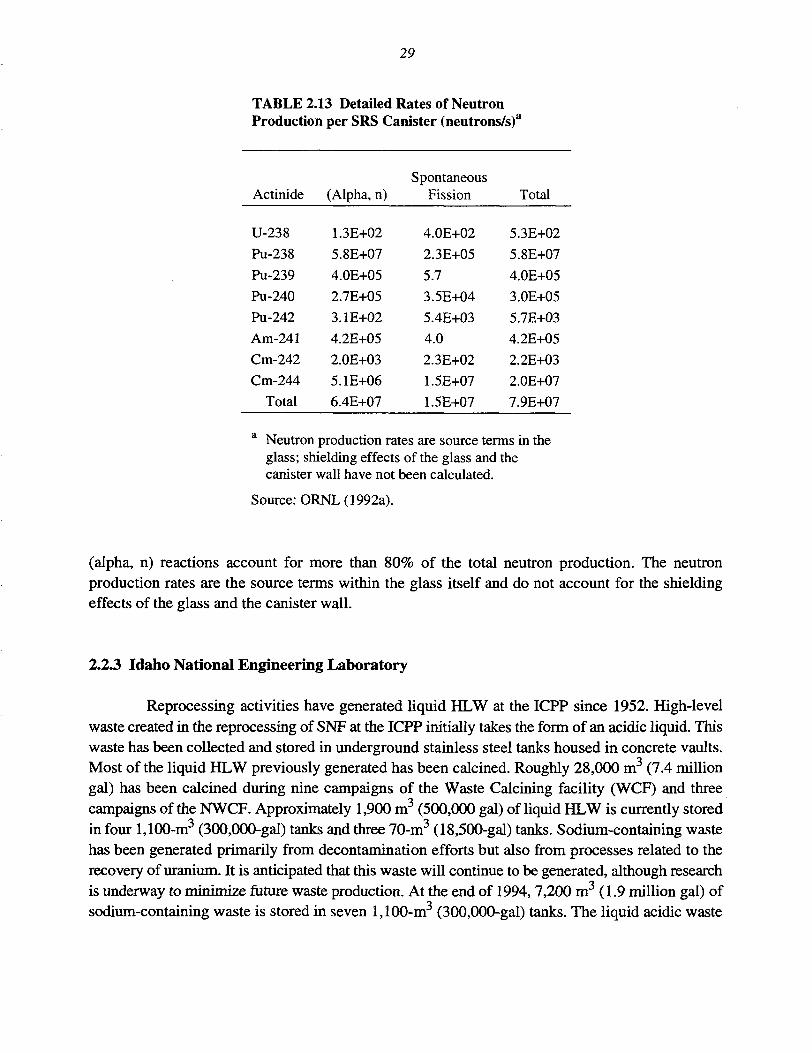
Table 2.11 provides information on the radiological, chemical, and physical characteristicsof the HLW canisters produced at SRS. The density of the HLW glass is 2.85 g/cm3 (178 lb/ft3) at25°C (77°F); consequently, on average, each canister will contain a total of 1,682 kg (3,700 lb) ofHLW glass on the basis of a reference-case fill level of 85%. The decay of radioactivity and thermalpower over time is presented in Table 2.12; the maximum total activity and thermal power at thetime of filling are 234,400 Ci and 709 W per canister. The canister radioactivity and thermal powerare estimated to have decreased to less than 0.00170% and 0.003%, respectively, of their initialvalues after one million years. Table 2.13 shows the calculated rates of neutron production percanister of HLW glass at the time of filling on the basis of radionuclide composition in Table 2.10;
27
TABLE 2.11 Projected Characteristics of the Immobilized HLW Form andCanister at SRS
Immobilized HLW Form
Waste form
Canister material
Canister fill level (%)
Glass density (g/cm )
At average fill temperature of 825°
At25°C
Glass volume (m3)
At average fill temperature of 825°
At25°C
Canister inside volume (m3)
Canister dimensions (cm)
Outside diameter
Overall height
Wall thickness
Weights (kg)
Canister
Glass
Total
and Canister Characteristics at SRS
Borosilicate glass in closed canister
Stainless-steel type 304L
85
C 2.69
2.85
C 0.637
0.601
0.736
61.0
300.0
0.95
500
1,682
2,182
Waste loading (wt% waste oxides in the glass) 36.0
Radioactivity at time of filling
Ci/canister
W/canister
Radioactivity 50 years after filling
Ci/canister
W/canister
Neutron production
Spontaneous fission
(Alpha, n)
Total
Canister surface temperature at air ten
234,400
709
57,000
200
15,050,000
64,110,000
79,160,000
tiDerature 58 °Cof38°C
Canister centerline temperature at air 89 °Ctemperature of 38 °C
Radiation level at canister surface (rad/h) 5,600
Sources: Baxter (1988); DOE (1987); ORNL (1992a,b); Salmon and Notz (1991).
28
TABLE 2.12 Radioactivity and Thermal Power perSRS Canister over Time
Years afterVitrification
0b
1
2
510
15
20
30
50
100
200
300
350
500
1,000
1,050
2,000
5,000
10,000
20,000
50,000
100,000
500,000
1,000,000
Radioactivity perCanister (Ci)a
234,400
208,500
193,800
169,300
145,800
128,400
113,900
90,000
56,500
17,900
2,100
390
227
95
42
41
29
24
20
16
11
9.2
4.8
2.4
Thermal Powerper Canister (W)a
709
627
586
527
467
418
374
301
198
75
17
7.2
5.2
2.7
1.1
1.1
0.72
0.54
0.43
0.30
0.16
0.11
0.05
0.02
a Includes contribution of actinides and activationproducts, as well as fission products.
b Based on 5-year cooled sludge and 15-year cooledsupernate.
Source: ORNL (1992a).
29
TABLE 2.13 Detailed Rates of NeutronProduction per SRS Canister (neutrons/s)a
Actinide
U-238
Pu-238
Pu-239
Pu-240
Pu-242
Am-241
Cm-242
Cm-244
Total
(Alpha, n)
1.3E+02
5.8E+07
4.0E+05
2.7E+05
3.1E+02
4.2E+05
2.0E+03
5.1E+06
6.4E+07
SpontaneousFission
4.0E+02
2.3E+05
5.73.5E+04
5.4E+03
4.0
2.3E+02
1.5E+07
1.5E+07
Total
5.3E+02
5.8E+07
4.0E+05
3.0E+05
5.7E+03
4.2E+05
2.2E+03
2.0E+07
7.9E+07
a Neutron production rates are source terms in theglass; shielding effects of the glass and thecanister wall have not been calculated.
Source: ORNL (1992a).
(alpha, n) reactions account for more than 80% of the total neutron production. The neutronproduction rates are the source terms within the glass itself and do not account for the shieldingeffects of the glass and the canister wall.
2.2.3 Idaho National Engineering Laboratory
Reprocessing activities have generated liquid HLW at the ICPP since 1952. High-levelwaste created in the reprocessing of SNF at the ICPP initially takes the form of an acidic liquid. Thiswaste has been collected and stored in underground stainless steel tanks housed in concrete vaults.Most of the liquid HLW previously generated has been calcined. Roughly 28,000 m3 (7.4 milliongal) has been calcined during nine campaigns of the Waste Calcining facility (WCF) and threecampaigns of the NWCF. Approximately 1,900 m3 (500,000 gal) of liquid HLW is currently storedin four 1,100-m3 (300,000-gal) tanks and three 70-m3 (18,500-gal) tanks. Sodium-containing wastehas been generated primarily from decontamination efforts but also from processes related to therecovery of uranium. It is anticipated that this waste will continue to be generated, although researchis underway to minimize future waste production. At the end of 1994, 7,200 m3 (1.9 million gal) ofsodium-containing waste is stored in seven 1,100-m3 (300,000-gal) tanks. The liquid acidic waste

30
represents the majority of the initial volume but a minority of the initial radioactivity (approximately2.4 million Ci).
Liquid HLW has been treated in the NWCF to result in solid HLW calcine at the ICPPsince 1962 and is contained in five CSSFs that have been constructed and filled sequentially. Twoadditional CSSFs have been constructed and will be filled during future calcination operations. Thebins containing the calcine are expected to retain their integrity for at least 500 years (DOE 1983).
By 1994, about 3,800 m3 (124,000 ft3) of calcine has been produced with a totalradioactivity of 57 million Ci. The production of calcine is anticipated to continue from thesolidification of existing liquid wastes and potential future liquid wastes generated fromdecontamination and decommissioning (D&D) activities. Without calcination, the ICPP tank farmwould have been filled to capacity, precluding generation of waste from reprocessing or futuredecontamination and decommissioning programs. Calcination of liquid HLW at INEL results in asolid that is safer to store than liquid waste (due to its physical form and lower dispersibility) butdoes not meet NRC requirements for repository disposal.
Current and projected inventories of liquid HLW at INEL are presented in Table 2.14. Thevalues in Table 2.14 represent generation of liquid HLW only and do not take into account potentialvolume reduction due to evaporation and calcination operations. INEL uses its HLW tank systemto manage radioactive wastewaters (technically not HLW) from the following sources: sodium-bearing waste from decontamination and decommissioning (D&D) activities, acid waste, solutionsgenerated during calciner operations, and filter leach processing. The projections shown inTable 2.14 were made on the assumption that the New Waste Calcining Facility would resumeoperations to pretreat HLW liquids and that radionuclide partitioning would be performed on bothliquid and calcined waste streams. It was also assumed that no new HLW would be produced in thefuture from reprocessing activities; the reprocessing facilities at the INEL were placed into coldstandby pending D&D during FY 1992.
In general, the radionuclide content in all of the various calcine types is less than 1 wt%with a radionuclide distribution typical for U-235 fissioning and neutron capture. Calcine has arelatively low activity and heat generation rate (approximately 24,000 Ci/m3 and 70 W/m3 [Ernoldet al. 1993], respectively, for aged calcine) because of the low concentration of radionuclides.However, these values vary significantly with age, fuel irradiation exposure, and type of fuelreprocessed, among other factors.
For planning purposes, the following assumptions have been made: (1) disposal of calcinewill not be allowed, (2) no pretreatment of calcine or liquid HLW will occur such that inert materialswill be removed prior to immobilization, and (3) HLW will be converted into a glass

TABLE 2.14 Projected HLW Inventory at INEL
Year
1995
1996
1997
1998
1999
2000
2001
2002
2003
2004
2005
2006
2007
2008
2009
2010
2011
2012
2013
2014
2015
Total(1995-2015)
Average(1995-2015)
Current(1994)
Total HLWInventory at2015
UnprocessedSodiumWaste
Volume(gal)
50,725
46,850
49,583
47,216
46,400
46,400
58,400
58,400
57,767
106,567
102,567
97,567
97,567
97,567
97,567
97,400
97,400
97,400
97,400
97,400
45,600
SodiumWaste
ReductionFactor
1.80
1.97
1.97
1.97
1.97
1.97
1.97
1.97
1.97
3.11
3.18
3.28
3.28
3.28
3.28
3.28
3.28
3.28
3.28
3.28
1.97
ProcessedSodiumWaste
Volume(m3)
107
90
95
91
89
89
112
112
111
130
122
113
113
113
113
112
112
112
112
112
88
2,248
107
UnprocessedAcid Waste
Volume(m3)
11,500
15,500
118,500
18,500
4,000
4,000
4,000
4,000
4,000
11,500
19,000
19,000
19,000
19,000
19,000
19,000
19,000
4,000
4,000
4,000
4,000
AcidWaste
ReductionFactor
1.21
1.14
1.60
1.28
1.00
1.00
1.00
1.00
1.00
1.00
1.00
1.00
1.00
1.00
1.00
1.00
1.00
1.00
1.00
1.00
1.00
ProcessedAcid
WasteVolume
(m3)
36
51
280
55
15
15
15
15
15
44
72
72
72
72
72
72
72
15
15
15
15
1,106
53
Numberof
CalcinerOperatingMonths
0
4
12
2
10
8
4
12
2
0
0
10
8
4
12
2
10
8
0
0
4
Gallons ofSolution
Generatedby
Calciner
5,778
5,778
5,778
5,778
5,778
5,778
5,778
5,778
5,778
5,778
5,778
5,778
5,778
5,778
5,778
5,778
5,778
5,778
5,778
5,778
5,778
SolutionGenerated
byCalciner
(m3)
0
87
262
44
219
175
87
262
44
0
0
219
175
87
262
44
219
175
0
0
87
2,450
117
Numberof
ExistingFilters
Processed
36
37
0
0
1
13
37
0
49
61
61
1
5
0
0
11
0
0
0
0
0
Numberof OtherFilters
Processed
14
38
75
75
74
62
38
75
26
14
14
74
62
38
75
38
74
62
14
14
38
FilterLeachVolume(m3)
6
8
8
8
8
8
8
8
9
9
9
8
7
4
8
5
7
6
1
1
4
138
7
AnnualVolumeAdded toExistingWaste
Inventory(m3)
148
237
646
197
331
287
223
397
178
182
203
411
366
276
455
233
411
309
129
129
194
5,942
283
10,400
16,342
32
and placed in stainless steel canisters. Under U.S. Nuclear Regulatory Commission (NRC)regulations, calcine is not considered to be an adequate final waste form because of the occurrenceof significant leaching of radionuclides on contact with water (i.e., calcine would not pass a toxicitycharacteristic leaching procedure (TCLP) test using EPA requirements). This regulation may prohibitdisposal of the calcine. The calcination process may be classified as an interim best demonstratedavailable technology by EPA under RCRA, pending development of a process to produce a stableglass, ceramic, or glass/ceramic that will meet both Atomic Energy Act and RCRA requirements.The final treatment process and waste form for the HLW at INEL is under investigation. Evaluationsof various waste immobilization processes are underway. Characteristics of the HSfEL waste suggestthe final waste form for disposal will be a borosilicate glass material, which is assumed in thisanalysis.
The estimated number of HLW canisters to be produced from immobilization of the HLWat the INEL depends on the performance of separation and treatment processes implemented to treatthe HLW, and the canister size. For purposes of this analysis, an estimated 1,700 canisters wasassumed to be produced from treating existing HLW. This value is derived from a number ofreferences, as presented below.
The most recent NEPA documentation concerning HLW activities at the INEL is the FinalProgrammatic Spent Nuclear Fuel Management and Idaho National Engineering LaboratoryEnvironmental Restoration and Waste Management Programs Environmental Impact Statement(DOE 1995c). The Record of Decision for this EIS (May 30, 1995) states in the first paragraph onpage 15 that "The technology selecting (for HLW treatment) is radionuclide partitioning forradioactive liquid and calcine waste treatment. . . and glass (vitrification) for immobilizing theresulting high-activity waste stream."
The number of HLW canisters that would result from the various processing options is notpresented in this document. Information concerning HLW immobilization that allows calculationof the number of HLW canisters at the INEL is, however, presented in Section C-4.3.2 ("WasteImmobilization Facility") of Volume 2, Part B of the above-cited document. Table C-4.3.2-1 on pageC-4.3.2-7 presents the volume of high-activity waste that would result depending upon the degreeof pretreatment and immobilization technology chosen. The option listed in Table C-4.3.2-1consistent with the ROD is Option 3a (i.e., the high-activity waste form would be glass); the finalwaste volume for the high-activity waste form (which would be disposed in the national repositoryas HLW) for Option 3a is 870 m3. Based on an 85% fill level and a standard canister size of 0.61 m3
(from the source of the values in Table C-4.3.2-1 [WINCO 1994]), the number of HLW canistersat the INEL is estimated to be:
(870 m3) / 0.85 / (0.61 m3 per canister) = 1,680 canisters.

33
The Integrated Data Base Report-1994: U.S. Spent Nuclear Fuel and Radioactive WasteInventories, Projections, and Characteristics (DOE 1995e) states on page 48 that HLW canisterproduction is assumed to start in the year 2019 and continue through 2045. Table 2.7 on page 64 ofthe same reference presents the canister production schedule for the INEL, consistent with thisprojected schedule. Summation of the annual canister production rates (27 canisters produced thefirst year, 53 canisters the second year, 33 canisters the third year, and 66 canisters annually for theremaining years) results in the following total number of HLW canisters produced at the INEL:
27 + 53 + 33 + { 66 x (2045 - 2022 + 1) } = 1,697 canisters,
which is consistent with the totals calculated from the Programmatic Spent Nuclear FuelManagement and Idaho National Engineering Laboratory Environmental Restoration and WasteManagement Programs Final Environmental Impact Statement (DOE 1995c). A conservative valueof 1,700 canisters is applied in this analysis.
The immobilization facility at the ICPP is assumed to begin operation in 2015 with anaverage annual production rate of about 81 canisters per year. All HLW would be treated so that itis ready to be moved out of Idaho by a target date of 2035 {Public Service Company of Colorado v.Philip E. Batt, U.S. District Court for the District of Idaho, Oct. 17, 1995).
The dimensions of the proposed canister proposed in this analysis for disposal of the glasswaste form are 0.7-m (27.5-in.) outer diameter and 3.28-m (129-in.) high, with a projected useablevolume of 1.25 m (44 ft3). The canister dimensions are similar to the proposed Yucca Mountain"hybrid" canister (E.R. Johnson Associates 1989) that is 0.7 m (28 in.) by 4.76 m (187.5 in.) anddesigned to hold four boiling water reactor (BWR) and three pressurized water reactor (PWR)assemblies. Based on the glass formulations provided in Table 2.17 of ORNL (1995), the glassdensity varies from 2.36 to 2.69 g/cm . Assuming an average glass density of 2.55 g/cm , a singleINEL canister would contain approximately 2,900 kg (6,400 lb) of glass. Table 2.15 gives theestimated radionuclide content of an INEL canister; Table 2.16 gives the characteristics of theimmobilized HLW form and canister. Although the final chemical composition is currentlyunknown, the glass product is expected to be composed of 50-60 wt% silica, 8-13 wt% boron oxides,2-20 wt% alkali oxides, 20-45 wt% waste oxides, and 0-7 wt% other additives (ORNL 1995).
Table 2.17 presents the estimated radioactivity and thermal power per canister as functionsof decay time ranging from zero to one million years. The values given represent the averageradioactivity of the fission and activation products per canister expected to be generated in the future.The heat generation rate of a single canister is less than the restriction of 800 W per canister at thetime of shipment to the repository.

34
TABLE 2.15 Radionuclide Content per INEL Canister
Radionuclide
Sr-90
Y-90
Ru-106
Rh-106
Cs-134
Cs-137
Ba-137m
Ce-144
Pr-144
Pm-147
Eu-154
Total
Mass (g/canister)
1.5E+01
3.8E-03
7.4E-19
6.9E-25
3.1E-09
2.9E+01
4.4E-06
4.6E-22
1.9E-26
1.9E-07
2.4E-03
4.4E+01
Radioactivity(Ci/canister)
2.1E+03
2.1E+03
2.5E-15
2.5E-15
4.0E-06
2.5E+03
2.4E+03
1.5E-18
1.5E-18
1.8E-04
6.6E-01
9.0E+03
Thermal Power(W/canister)
2.4E+00
1.2E+01
1.5E-18
4.7E-17
4.0E-08
2.5E+00
9.3E+00
9.6E-22
1.1E-20
6.5E-08
6.0E-03
2.6E+01
Source: Adapted from ORNL (1995).
2.2.4 West Valley Demonstration Project
The 1994 inventory of HLW at WVDP included approximately 2,180 m3 (580,000 gal)(24.7 million Ci of mixed fission products and transuranic radionuclides) stored in two undergroundtanks (Brown and Gordon 1988; ORNL 1995). One tank contained 2,040 m3 (about 540,000 gal)of liquid alkaline waste while the other tank contained 140 m3 (37,000 gal) of solid waste composedof both alkaline sludge and inorganic zeolite ion-exchange material contaminated with radioactivecesium.
Table 2.18 shows the current HLW inventory and projected levels at WVDP. No new HLWhas been generated at WVDP for several years, and no additional HLW will be produced. Thus, thevolume projections represent the effects of pretreating the existing inventory to reduce the quantityof material requiring vitrification and the effects of the vitrification procedure itself.
HLW pretreatment at WVDP has been completed. Supernatant in the alkaline tank wastreated by ion exchange to remove cesium. The sludge has been washed to remove nonradioactive,soluble components. The sludge-washing process was completed in 1993. The final THOREX washhas recently been performed. The decontaminated supernatant and the sludge wash water will
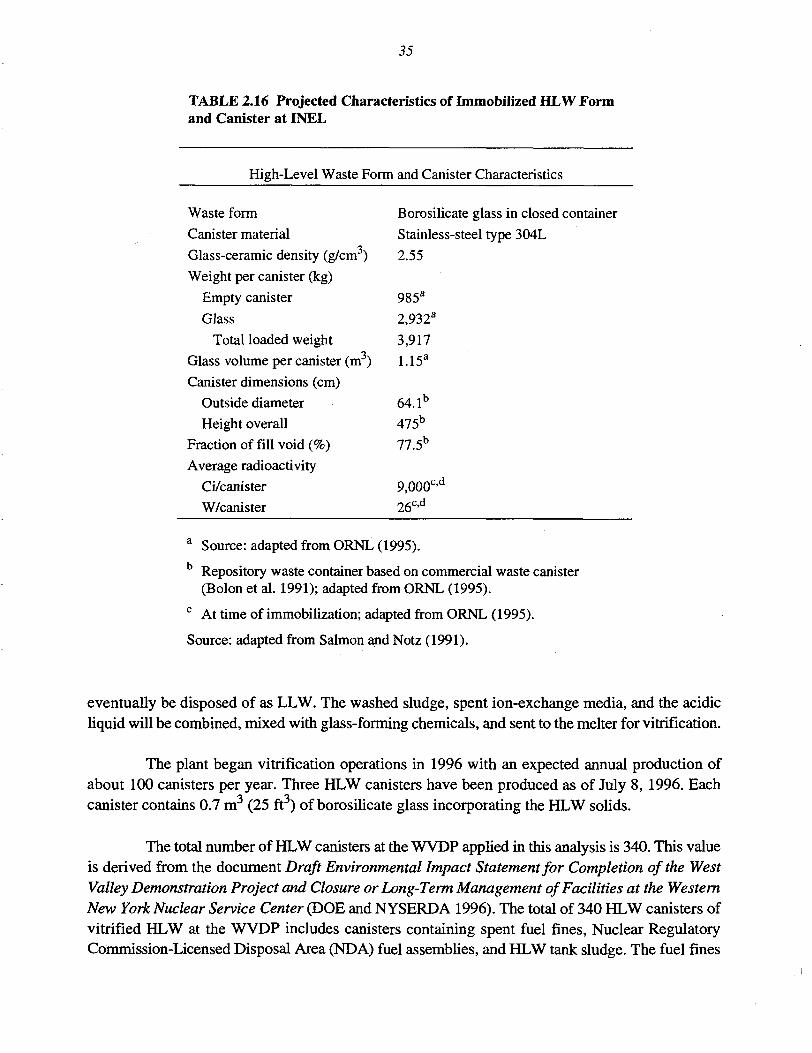
35
TABLE 2.16 Projected Characteristics of Immobilized HLW Formand Canister at INEL
High-Level Waste Form and Canister Characteristics
Waste formCanister material
Glass-ceramic density (g/cm3)
Weight per canister (kg)
Empty canister
Glass
Total loaded weight
Glass volume per canister (m )
Canister dimensions (cm)
Outside diameter
Height overall
Fraction of fill void (%)
Average radioactivity
Ci/canister
W/canister
Borosilicate glass in closed containerStainless-steel type 304L
2.55
985a
2,932a
3,917
1.15a
64.1b
475b
77.5b
9,000c'd
26c'd
a Source: adapted from ORNL (1995).b Repository waste container based on commercial waste canister
(Bolon et al. 1991); adapted from ORNL (1995).c At time of immobilization; adapted from ORNL (1995).
Source: adapted from Salmon and Notz (1991).
eventually be disposed of as LLW. The washed sludge, spent ion-exchange media, and the acidicliquid will be combined, mixed with glass-forming chemicals, and sent to the melter for vitrification.
The plant began vitrification operations in 1996 with an expected annual production ofabout 100 canisters per year. Three HLW canisters have been produced as of July 8, 1996. Eachcanister contains 0.7 m3 (25 ft3) of borosilicate glass incorporating the HLW solids.
The total number of HLW canisters at the WVDP applied in this analysis is 340. This valueis derived from the document Draft Environmental Impact Statement for Completion of the WestValley Demonstration Project and Closure or Long-Term Management of Facilities at the WesternNew York Nuclear Service Center (DOE and NYSERDA 1996). The total of 340 HLW canisters ofvitrified HLW at the WVDP includes canisters containing spent fuel fines, Nuclear RegulatoryCommission-Licensed Disposal Area (NDA) fuel assemblies, and HLW tank sludge. The fuel fines
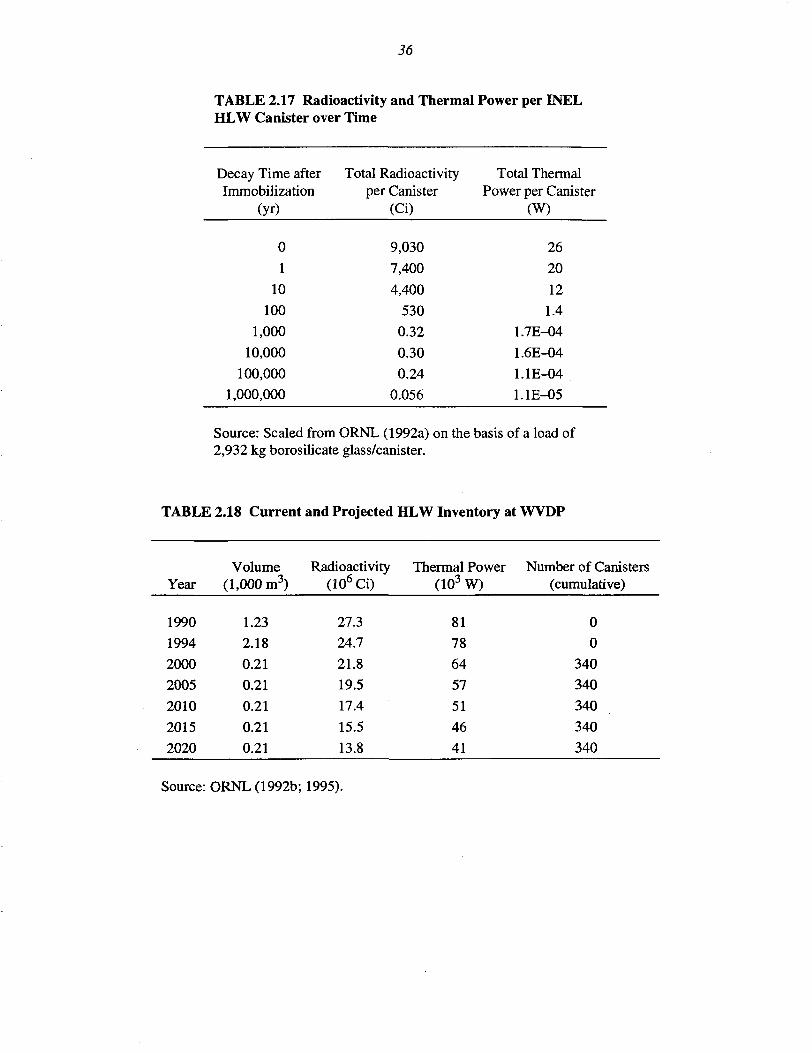
36
TABLE 2.17 Radioactivity and Thermal Power per INELHLW Canister over Time
Decay Time afterImmobilization
(yr)
0
1
10
100
1,000
10,000
100,000
1,000,000
Total Radioactivityper Canister
(Ci)
9,030
7,400
4,400
530
0.32
0.30
0.24
0.056
Total ThermalPower per Canister
(W)
26
20
12
1.4
1.7E-04
1.6E-04
1.1E-04
1.1E-05
Source: Scaled from ORNL (1992a) on the basis of a load of2,932 kg borosilicate glass/canister.
TABLE 2.18 Current and Projected HLW Inventory at WVDP
Year
1990
1994
2000
2005
2010
2015
2020
Volume(1,000 m3)
1.23
2.18
0.21
0.21
0.21
0.21
0.21
Radioactivity(106 Ci)
27.3
24.7
21.8
19.5
17.4
15.5
13.8
Thermal Power(103 W)
81
78
64
57
51
46
41
Number of Canisters(cumulative)
0
0
340
340
340
340
340
Source: ORNL (1992b; 1995).
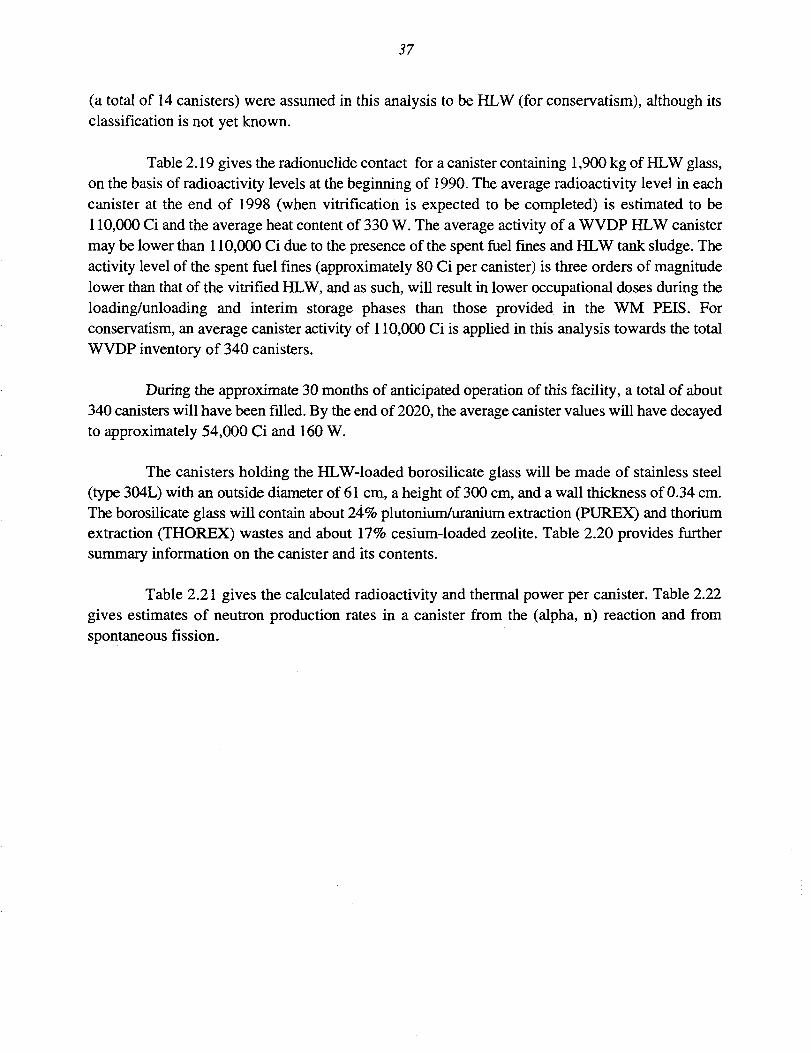
37
(a total of 14 canisters) were assumed in this analysis to be HLW (for conservatism), although itsclassification is not yet known.
Table 2.19 gives the radionuclide contact for a canister containing 1,900 kg of HLW glass,on the basis of radioactivity levels at the beginning of 1990. The average radioactivity level in eachcanister at the end of 1998 (when vitrification is expected to be completed) is estimated to be110,000 Ci and the average heat content of 330 W. The average activity of a WVDP HLW canistermay be lower than 110,000 Ci due to the presence of the spent fuel fines and HLW tank sludge. Theactivity level of the spent fuel fines (approximately 80 Ci per canister) is three orders of magnitudelower than that of the vitrified HLW, and as such, will result in lower occupational doses during theloading/unloading and interim storage phases than those provided in the WM PEIS. Forconservatism, an average canister activity of 110,000 Ci is applied in this analysis towards the totalWVDP inventory of 340 canisters.
During the approximate 30 months of anticipated operation of this facility, a total of about340 canisters will have been filled. By the end of 2020, the average canister values will have decayedto approximately 54,000 Ci and 160 W.
The canisters holding the HLW-loaded borosilicate glass will be made of stainless steel(type 304L) with an outside diameter of 61 cm, a height of 300 cm, and a wall thickness of 0.34 cm.The borosilicate glass will contain about 24% plutonium/uranium extraction (PUREX) and thoriumextraction (THOREX) wastes and about 17% cesium-loaded zeolite. Table 2.20 provides furthersummary information on the canister and its contents.
Table 2.21 gives the calculated radioactivity and thermal power per canister. Table 2.22gives estimates of neutron production rates in a canister from the (alpha, n) reaction and fromspontaneous fission.

38
TABLE 2.19 Radionuclide Content per WVDP Canister
Radionuclide
Fe-55Co-60Ni-59Ni-63Se-79Sr-90Y-90Zr-93Nb-93mTc-99Ru-106Rh-106Pb-107Cd-113mSn-121mSn-126Sb-125Sb-126Sb-126mTe-125mCs-134Cs-135Cs-137Ba-137mCe-144Pr-144Pm-146Pm-147Sm-151Eu-152Eu-154Eu-155Ti-207Ti-208
Mass(g/canister)
1.1E-032.7E-035.5
4.9E-012.0E-011.9E+024.8E-024.3E+022.5E-032.5E+011.7E-051.6E-118.4E+013.8E-021.2E-031.4E+012.8E-026.9E-075.2E-093.9E-041.6E-025.5E+023.3E+025.0E-058.0E-073.4E-119.6E-053.7E-011.3E+018.3E-031.4
2.0E-011.7E-104.3E-11
Radioactivity(C/canister)
2.8
3.0
4.2E-013.0E+011.4E-022.6E+042.6E+041.1
7.2E-014.3E-015.5E-025.5E-024.3E-028.3
6.9E-024. IE-012.9E+015.7E-024.1E-017.0
2.0E+016.3E-012.8E+012.7E+042.6E-032.6E-034.3E-023.5E+023.3E+021.4
3.8E+029.4E+013.2E-021.3E-02
Thermal Power(W/canister)
9.3E-054.7E-021.7E-053.0E-033.4E-063.1E+011.5E+021.2E-041.3E-042. IE-043.3E-065.3E-042.6E-061.4E-021.4E-045.1E-048.9E-021.1E-035.2E-035.9E-032.1E-012. IE-043.1E+011.1E+021.7E-061.9E-052. IE-041.2E-013.9E-02LIE-023.4
6.8E-029.4E-053.0E-06
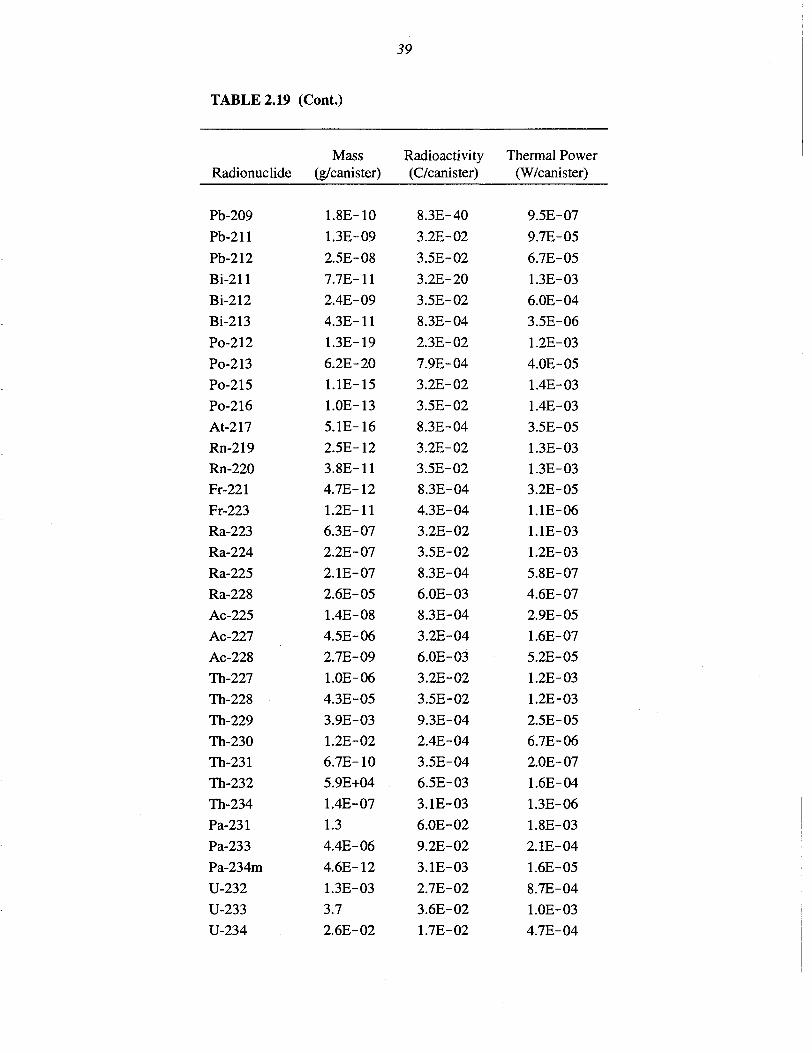
39
TABLE 2.19 (Cont.)
Radionuclide
Pb-209
Pb-211
Pb-212
Bi-211
Bi-212
Bi-213
Po-212
Po-213
Po-215
Po-216
At-217
Rn-219
Rn-220
Fr-221
Fr-223
Ra-223
Ra-224
Ra-225
Ra-228
Ac-225
Ac-227
Ac-228
Th-227
Th-228
Th-229
Th-230
Th-231
Th-232
Th-234
Pa-231
Pa-233
Pa-234m
U-232
U-233
U-234
Mass(g/canister)
1.8E-101.3E-092.5E-087.7E-112.4E-094.3E-111.3E-196.2E-201.1E-151.0E-135.1E-162.5E-123.8E-114.7E-121.2E-116.3E-072.2E-072. IE-072.6E-051.4E-084.5E-062.7E-091.0E-064.3E-053.9E-031.2E-026.7E-105.9E+041.4E-071.3
4.4E-064.6E-121.3E-033.7
2.6E-02
Radioactivity(C/canister)
8.3E-403.2E-023.5E-023.2E-203.5E-028.3E-042.3E-027.9E-043.2E-023.5E-028.3E-043.2E-023.5E-028.3E-044.3E-043.2E-023.5E-028.3E-046.0E-038.3E-043.2E-046.0E-033.2E-023.5E-029.3E-042.4E-043.5E-046.5E-033.1E-036.0E-029.2E-023.1E-032.7E-023.6E-021.7E-02
Thermal Power(W/canister)
9.5E-079.7E-056.7E-051.3E-O36.0E-043.5E-061.2E-034.0E-051.4E-031.4E-033.5E-051.3E-031.3E-033.2E-05LIE-061.1E-031.2E-035.8E-074.6E-072.9E-051.6E-075.2E-051.2E-031.2E-032.5E-056.7E-062.0E-071.6E-041.3E-061.8E-O32. IE-041.6E-058.7E-041.0E-034.7E-04

40
TABLE 2.19 (Cont.)
Radionuclide
U-235
U-236
U-238
Np-236
Np-237
Np-239
Pu-236
Pu-238
Pu-239
Pu-240
Pu-241
Pu-242
Am-241
Am-242
Am-242rn
Am-243
Cm-242
Cm-243
Cm-244
Cm-245
Cm-246
Total
Mass(g/canister)
1.6E+02
1.7E+01
9.3E+03
2.8
1.3E+02
2.1E+01
6.2E-06
1.9
1.0E+02
2.1E+01
3.1
1.7
6.1E+01
1.4E-06
1.2E-01
6.8
2.9E-04
1.0E-02
3.7E-02
2.0E-02
1.3E-03
-7.0E+04
Radioactivity(C/canister)
3.5E-04
1.1E-03
3.1E-03
3.7E-02
9.2E-02
1.4
3.3E-03
32.6
6.4
4.7
3.2E+02
6.4E-03
2.1E+02
1.2
1.2
1.4
9.6E-01
5.3E-01
3.0E+02
3.5E-03
3.9E-04
= 1.1E+O5
Thermal Power(W/canister)
9.3E-06
3.OE-O5
8.0E-05
7.5E-05
2.8E-03
3.3E-03
1.1E-04
1.1
2.0E-01
1.5E-01
9.8E-03
1.9E-04
7.0E-02
1.3E-03
4.6E-04
4.4E-02
3.5E-02
1.9E-02
1.0
1.1E-04
1.3E-05
=3.3E+02
Source: ORNL (1992a).
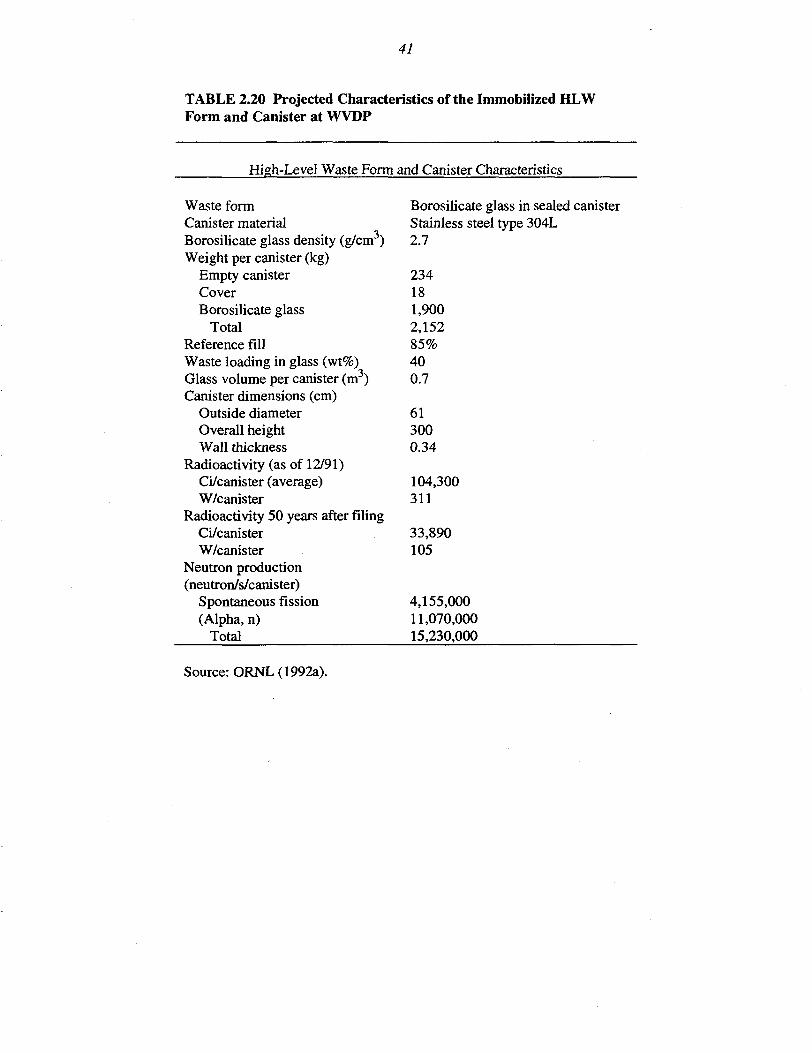
41
TABLE 2.20 Projected Characteristics of the Immobilized HLWForm and Canister at WVDP
High-Level Waste Form
Waste formCanister materialBorosilicate glass density (g/cm3)Weight per canister (kg)
Empty canisterCoverBorosilicate glass
TotalReference fillWaste loading in glass (wt%)Glass volume per canister (m3)Canister dimensions (cm)
Outside diameterOverall heightWall thickness
Radioactivity (as of 12/91)Ci/canister (average)W/canister
Radioactivity 50 years after filingCi/canisterW/canister
Neutron production(neutron/s/canister)
Spontaneous fission(Alpha, n)
Total
and Canister Characteristics
Borosilicate glass in sealed canisterStainless steel type 304L2.7
234181,9002,15285%400.7
613000.34
104,300311
33,890105
4,155,00011,070,00015,230,000
Source: ORNL (1992a).

42
TABLE 2.21 Radioactivity and Thermal Power perWVDP Canister over Time
Decay Timeafter End of
1989 (yr)
0125
1015203050
100200300350500
1,0001,0502,0005,000
10,00020,00050,000
100,000500,000
1,000,000
CalculatedRadioactivity per
Canister (Ci)
109,600106,900104,30097,08086,23076,66068,18053,97033,89010,730
1,2602912021286360
26.715.813.210.36.85.23.83.1
CalculatedThermal Power
per Canister (W)
326319311290258230205164105378.95.44.83.71.91.8
0.700.330.260.180.080.040.040.03
Source: ORNL (1992a).

43
TABLE 2.22 Detailed Rates of Neutron Productioii perWVDP Canister (neutrons/s)a
Actinide
U-238Pu-238Pu-239Pu-240Pu-242Am-241Cm-242Cm-244
Total
(Alpha, n)
4.0E+013.0E+044.7E+033.6E+03
4.02.1E+051.3E+032.8E+043.OE+O5
Spontaneous Fission
1.2E+025.0E+03
2.81.9E+042.8E+037.6E+016.3E+033.4E+063.4E+06
Total
1.6E+023.5E+044.7E+032.3E+042.8E+032.1E+057.9E+033.4E+063.7E+06
a Neutron production rates are uniform source terms in the glassrather than dose rates at the exterior and are calculated for theend of 1989.
Source: ORNL (1992a).

44
3 FACILITY ASSESSMENT
3.1 HANFORD SITE: EXISTING FACILITIES
3.1.1 History
The Hanford site began storing HLW in underground tanks in 1944. The waste came froma variety of sources, including plutonium and uranium recovery from irradiated SNF. Hanford'sHLW is contained primarily in 177 underground storage tanks built between 1943 and 1986. Thesetanks range in capacity from 208 m (55,000 gal) to more than 3,800 m (1 million gal). The wasteat Hanford is found in four main forms: sludge, salt cake, slurry (i.e., a combination of liquid andsuspended solid waste), and liquid.
3.1.2 Facility Descriptions and Environmental Releases
The chemical processing plants (T-Plant, U-Plant, Z-Plant, and Reduction/Oxidation[REDOX] Plant) and the associated tank farms (T, TY, TX, U, S, SY, and SX) are located in the 200West Area at Hanford (DOE 1992b). The B-Plant and PUREX Plant, along with their associated tankfarms (A, AN, AP, AW, AX, AY, AZ, B, BX, BY, and C) are located in the 200 East Area(Figures 3.1 and 3.2). The chemical processing plants were constructed between 1943 and 1955; thetank farms were constructed between 1943 and 1964.
The basic tank design of the first tank farms (T, TY, TX, U, S, SX, A, AX, B, BX, BY, andC) was a reinforced-concrete, domed shell with an open top carbon-steel liner known as a SST.Between 1943 and 1964, 149 SSTs were built in the 200 East and 200 West areas for storingradioactive wastes. The SSTs are located in 12 tank farms of 4 to 18 tanks each. Most SSTs are22.9 m (75 ft) in diameter and have a capacity ranging from 2,000 to 3,800 m3 (530,000 to 1 milliongal), depending on the depth of the tank (with the exception of 16 smaller 208-m3 [55,000-gal] tanksin the first tank farms—B, C, T, and U). The SSTs can be categorized into one of four types on thebasis of size and construction. Three of the four SSTs are 22.9 m (75 ft) in diameter, have a domedtop made of reinforced concrete, and can hold volumes of approximately 2,000 m3 (530,000 gal),2,900 m3 (766,000 gal), and 3,800 m3 (1 million gal), respectively. The fourth tank type has a 6.1-m(20-ft) diameter, a flat, reinforced concrete top, and a volume of about 210 m (55,000 gal).
Unit characteristics are given in Table 3.1. Forced ventilation currently provides coolingfor 16 tanks that contain materials that generate heat from radioactive decay. Single-stage highefficiency paniculate air (HEPA) filters allow atmospheric breathing for tanks that do not requirecooling. The radioactive waste stored in these underground tanks has come from various sources,

45
SADOLf MOUNTAINS
srre .- 'BOUNDARY \
HMS HAWFOMO MtTEOHOLCKJICAl STATION— — ftESTMICTED-ACCESS HKSKWAYS
- MJ«UC MIOMWAYS
_ — — — NAILROAOS
1 I I I I0 ' 2 3 « S MK.U
FIGURE 3.1 Map of the Hanford Site (Source: DOE 1992b)

46
200 West Area 200 East Area
T Tank Farm
DPlant
242-5Evaporator
BYTank Farm
BTank Farm
FIGURE 3.2 Schematic of the 200 West and 200 East Chemical Process Areas(Source: DOE 1992b)
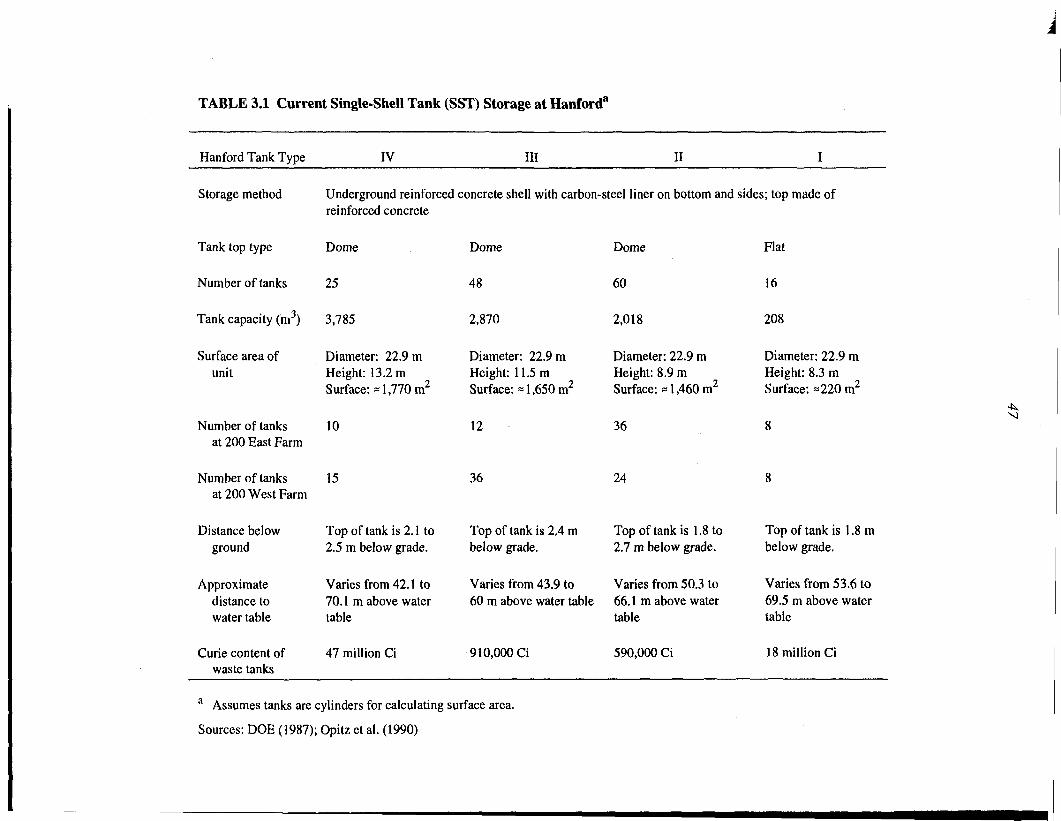
TABLE 3.1 Current Single-Shell Tank (SST) Storage at Hanford8
Hanford Tank Type
Storage method
Tank top type
Number of tanks
Tank capacity (m3)
Surface area ofunit
Number of tanksat 200 East Farm
IV
Underground reinforcedreinforced concrete
Dome
25
3,785
Diameter: 22.9 mHeight: 13.2 mSurface: ~ 1,770 m2
10
III II
concrete shell with carbon-steel liner on bottom and
Dome
48
2,870
Diameter: 22.9 mHeight: 11.5mSurface: ~ 1,650 m2
12
Dome
60
2,018
Diameter: 22.9 mHeight: 8.9 mSurface: «1,460 m2
36
I
sides; top made of
Flat
16
208
Diameter: 22.9 mHeight: 8.3 mSurface: =220 m2
8
Number of tanks 15at 200 West Farm
36 24
Distance belowground
Approximatedistance towater table
Top of tank is 2.1 to2.5 m below grade.
Varies from 42.1 to70.1 m above watertable
Top of tank is 2.4 mbelow grade.
Varies from 43.9 to60 m above water table
Top of tank is 1.8 to2.7 m below grade.
Varies from 50.3 to66.1 m above watertable
Top of tank is 1.8 mbelow grade.
Varies from 53.6 to69.5 m above watertable
Curie content ofwaste tanks
47 million Ci 910,000 Ci 590,000 Ci 18 million Ci
a Assumes tanks are cylinders for calculating surface area.
Sources: DOE (1987); Opitz et al. (1990)
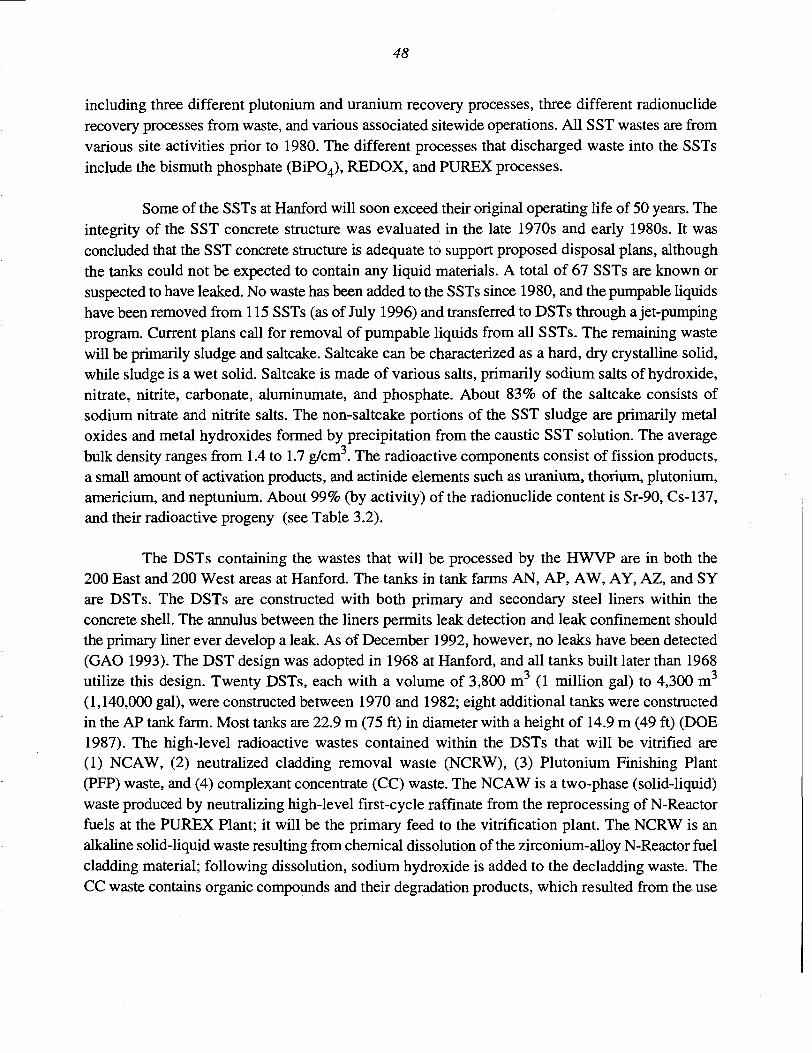
48
including three different plutonium and uranium recovery processes, three different radionucliderecovery processes from waste, and various associated sitewide operations. All SST wastes are fromvarious site activities prior to 1980. The different processes that discharged waste into the SSTsinclude the bismuth phosphate (BiPO4), REDOX, and PUREX processes.
Some of the SSTs at Hanford will soon exceed their original operating life of 50 years. Theintegrity of the SST concrete structure was evaluated in the late 1970s and early 1980s. It wasconcluded that the SST concrete structure is adequate to support proposed disposal plans, althoughthe tanks could not be expected to contain any liquid materials. A total of 67 SSTs are known orsuspected to have leaked. No waste has been added to the SSTs since 1980, and the pumpable liquidshave been removed from 115 SSTs (as of July 1996) and transferred to DSTs through a jet-pumpingprogram. Current plans call for removal of pumpable liquids from all SSTs. The remaining wastewill be primarily sludge and saltcake. Saltcake can be characterized as a hard, dry crystalline solid,while sludge is a wet solid. Saltcake is made of various salts, primarily sodium salts of hydroxide,nitrate, nitrite, carbonate, aluminumate, and phosphate. About 83% of the saltcake consists ofsodium nitrate and nitrite salts. The non-saltcake portions of the SST sludge are primarily metaloxides and metal hydroxides formed by precipitation from the caustic SST solution. The averagebulk density ranges from 1.4 to 1.7 g/cm3. The radioactive components consist of fission products,a small amount of activation products, and actinide elements such as uranium, thorium, plutonium,americium, and neptunium. About 99% (by activity) of the radionuclide content is Sr-90, Cs-137,and their radioactive progeny (see Table 3.2).
The DSTs containing the wastes that will be processed by the HWVP are in both the200 East and 200 West areas at Hanford. The tanks in tank farms AN, AP, AW, AY, AZ, and SYare DSTs. The DSTs are constructed with both primary and secondary steel liners within theconcrete shell. The annulus between the liners permits leak detection and leak confinement shouldthe primary liner ever develop a leak. As of December 1992, however, no leaks have been detected(GAO 1993). The DST design was adopted in 1968 at Hanford, and all tanks built later than 1968utilize this design. Twenty DSTs, each with a volume of 3,800 m3 (1 million gal) to 4,300 m3
(1,140,000 gal), were constructed between 1970 and 1982; eight additional tanks were constructedin the AP tank farm. Most tanks are 22.9 m (75 ft) in diameter with a height of 14.9 m (49 ft) (DOE1987). The high-level radioactive wastes contained within the DSTs that will be vitrified are(1) NCAW, (2) neutralized cladding removal waste (NCRW), (3) Plutonium Finishing Plant(PFP) waste, and (4) complexant concentrate (CC) waste. The NCAW is a two-phase (solid-liquid)waste produced by neutralizing high-level first-cycle raffinate from the reprocessing of N-Reactorfuels at the PUREX Plant; it will be the primary feed to the vitrification plant. The NCRW is analkaline solid-liquid waste resulting from chemical dissolution of the zirconium-alloy N-Reactor fuelcladding material; following dissolution, sodium hydroxide is added to the decladding waste. TheCC waste contains organic compounds and their degradation products, which resulted from the use
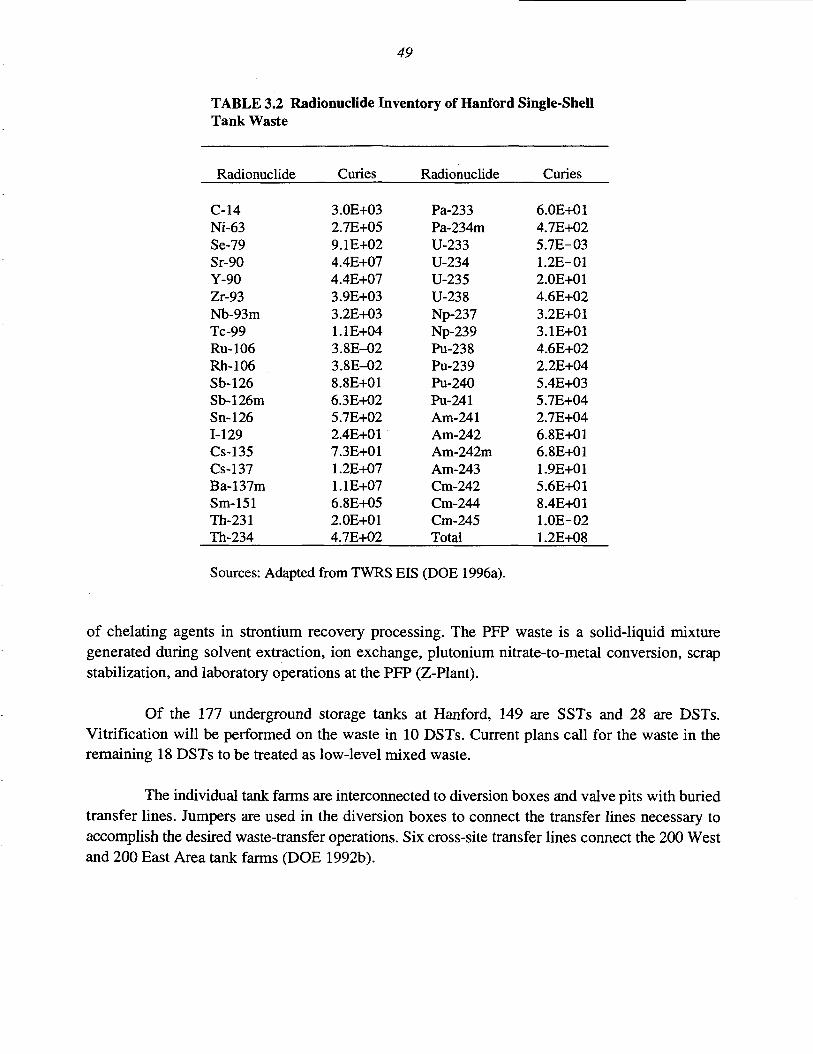
49
TABLE 3.2 Radionuclide Inventory of Hanford Single-ShellTank Waste
Radionuclide
C-14Ni-63Se-79Sr-90Y-90Zr-93Nb-93mTc-99Ru-106Rh-106Sb-126Sb-126mSn-1261-129Cs-135Cs-137Ba-137mSm-151Th-231Th-234
Curies
3.0E+032.7E+059.1E+024.4E+074.4E+073.9E+033.2E+031.1E+043.8E-023.8E-028.8E+O16.3E+025.7E+022.4E+017.3E+011.2E+071.1E+076.8E+052.0E+014.7E+02
Radionuclide
Pa-233Pa-234mU-233U-234U-235U-238Np-237Np-239Pu-238Pu-239Pu-240Pu-241Am-241Am-242Am-242mAm-243Cm-242Cm-244Cm-245Total
Curies
6.0E+014.7E+025.7E-031.2E-012.0E+014.6E+023.2E+013.1E+014.6E+022.2E+045.4E+035.7E+042.7E+046.8E+016.8E+011.9E+015.6E+018.4E+011.0E-021.2E+08
Sources: Adapted from TWRS EIS (DOE 1996a).
of chelating agents in strontium recovery processing. The PFP waste is a solid-liquid mixturegenerated during solvent extraction, ion exchange, plutonium nitrate-to-metal conversion, scrapstabilization, and laboratory operations at the PFP (Z-Plant).
Of the 177 underground storage tanks at Hanford, 149 are SSTs and 28 are DSTs.Vitrification will be performed on the waste in 10 DSTs. Current plans call for the waste in theremaining 18 DSTs to be treated as low-level mixed waste.
The individual tank farms are interconnected to diversion boxes and valve pits with buriedtransfer lines. Jumpers are used in the diversion boxes to connect the transfer lines necessary toaccomplish the desired waste-transfer operations. Six cross-site transfer lines connect the 200 Westand 200 East Area tank farms (DOE 1992b).
50
The tanks themselves contain ancillary equipment and instrumentation for wastemonitoring, pumping, agitation, condensate recovery, and ventilation control. Table 3.3 gives thedesign characteristics of the various DST types; the radionuclide content of the DSTs is shown inTable 3.4. Table 3.5 shows the staff required to maintain the tanks as well as the doses that workersreceive. The low worker dose rate results from the tanks being located below grade with at least 1.8m of soil cover, which provides a measure of shielding to minimize radiation exposure to personnel.Personnel receive routine exposures through surveying and monitoring of the tanks.
Finally, Table 3.6 shows the release fraction to be used to calculate emissions from currentstorage. Airborne emissions occur during current storage primarily due to forced ventilation, tankbreathing, and evaporation. Emissions can be calculated by multiplying the inventories given inTables 3.2 and 3.4 by the release fraction given in Table 3.6:
[Emission rate (Ci/yt)]storage = { [Species in DST waste (Ci)] +[Species in SST waste (Ci)] }x [Release fraction (yr'1)]. (3.1)
Non-radiological emissions were determined to be insignificant (e.g., on the order of 1 x 10 tonsper year of organics). Table 3.7 gives representative stack characteristics for atmospheric dispersioncalculations.
The strontium and cesium capsules are currently stored in stainless-steel-lined concretebasins at the Waste Encapsulation and Storage Facility (WESF) under 4 m (~ 13 ft) of demineralizedwater. The WESF is located in Building 225-B in the 200 East Area at Hanford. The water basinsdissipate the decay heat and reduce the radiation exposure to the workers. Table 3.8 gives the workerdose rates and labor requirements for current storage of these capsules. The number of exposedworkers for surveillance and current storage was determined from the total manpower requirementfor 100 years of continued storage (1,300 person-yr) for the No Disposal Action alternative in DOE(1987). The worker dose rate was determined by dividing the occupational dose for continuedcapsule storage at Hanford [420 person-rem/100 yr (DOE 1987)] by the total manpower requirement(1,300 person-yr). The operation duration of about 13 years is based on canisterization starting inFY 2006 (ORNL 1992b).
Various processes are located in the WESF. Emission data for 1989 reports a total of lessthan 1 x 10'6 Ci/yr gross alpha and 1.04 x 10"5 Ci/yr gross beta (Brown et al. 1990). Both Sr-90 andCs-137 (and their radioactive progeny) are beta emitters; alpha emissions will not be measured if thereported emissions are solely from the storage basins. In this report, it is assumed that insignificantemissions will occur during current storage because of the integrity and double encapsulation of thecapsules.

TABLE 3.3 Current HLW Storage at Hanforda
Waste Type NCAW NCRW PFP CC
Storage method DST: carbon-steel tankwithin a steel-linedconcrete tank
DST: carbon-steel tankwithin a steel-linedconcrete tank
DST: carbon-steel tankwithin a steel-linedconcrete tank
DST: carbon-steel tankwithin a steel-linedconcrete tank
Tank capacity
Number of tanks
3,800 m3 4,300 m3 4,300 m3 3,800 - 4,300 m3
Percent capacity filled 95% (average)
Surface area of unit Diameter: 22.9 mHeight: 14.9 mSurface: ~ 1,895 m2
68% (average)
Diameter: 22.9 mHeight: 14.9 mSurface: * 1,895 m2
59%
Diameter: 22.9 mHeight: 14.9 mSurface: * 1,895 m2
90% (average)
Diameter: 22.9 mHeight: 14.9 mSurface: « 1895 m2
On-site location 200 East Area 200 East Area 200 West Area 200 West and 200 Eastareas
Distance below ground Top of tank is 2.1 mbelow grade.
Approximate distance Bottom of tank is 59.4 mto water table above water table.
Curie content ofwaste tanks
47 million Ci
Top of tank is 2.1 mbelow grade.
Bottom of tank is 69.5 mabove water table.
910,000 Ci
Top of tank is 2.1 m belowgrade.
Bottom of tank is 42.1 mabove water table.
590,000 Ci
Top of tank is 2.1 m belowgrade.
Varies from 42.1 to65.8 m above water table(depends on specific tank).
18 million Ci
a Assumes tanks are cylinders for calculating surface area.
Sources: DOE (1987); Hanlon (1992); Johnson (1992).

52
TABLE 3.4 Radionuclide Inventory of Hanford Double-Shell Tank Waste3
Radionuclide
H-3b
C-14
Co-60
Ni-63
Sr-90
Y-90
Nb-95
Zr-95
Tc-99
Ru-106
Sb-125
1-129
Cs-134
Cs-137
Curies
6.3E+03
4.4E+02
1.2E+03
9.1E+03
2.6E+06
2.6E+06
2.6E+05
1.4E+05
6.1E+03
1.8E+05
4.2E+04
1.6
4.8E+03
3.6E+07
Radionuclide
Ba-137m
Ce-144
Eu-152
Eu-154
Eu-155
Np-237
Pu-238
Pu-239
Pu-240
Pu-241
Am-241
Pu-242
Cm-244
Total
Curies
3.4E+07
1.6E+05
3.0E+02
3.6E+03
3.7E+03
2.1
1.8E+03
2.0E+04
7.4E+03
1.2E+05
5.4E+05
1.2E-01
1.2E+02
6.3E+07
a NCAW, NCRW, PFP, and CC waste only — 10 DSTs.b H-3 derived from C-14 inventory.
Source: Adapted from Lowe (1991).
TABLE 3.5 Estimated Labor Requirements for Current Storageof HLW in DSTs and SSTs at Hanford
CategoryNumber of
Personnel (FTEa) Duration (yr)Dose Ratec
(rem/yr)
Exposed workers 108 -33 0.11
a Full-time equivalent.
Duration estimated assuming completion of vitrification operations byFY 2028.
c Worker dose rate determined by dividing occupational dose forcontinued waste storage at Hanford by annual requirement:(1,200 man-rem/100 yr) -r (108 man-yr/yr).
Source: Adapted from DOE (1987).

TABLE 3.6 Atmospheric Releases ofRadionuclides from Current HLWStorage at Hanford
Type of Release Release Fraction
Tritium (H-3) 1.0E-03All other radionuclides 5.0E-12
Source: Adapted from DOE (1987).
TABLE 3.7 Release Point Characteristics forAtmospheric Emissions for Current Storage andTransfer of HLW at Hanford
Stack Parameter
Release pointStack height (m)Height above surrounding structures (m)Stack diameter (m)Stack exit velocity (m/s)Exit temperature
Value
296-A-404.14.1
0.258.7
Ambient
Source: DOE (1990a).
TABLE 3.8 Estimated Personnel Requirements and Exposure forCurrent Storage of Strontium and Cesium Capsules at Hanford
Number ofCategory Personnel (FTEa) Duration (yr) Dose Rate (rem/yr)
Exposed (all) 13 13 0.32
a Full-time equivalent.
Source: Adapted from DOE (1987).
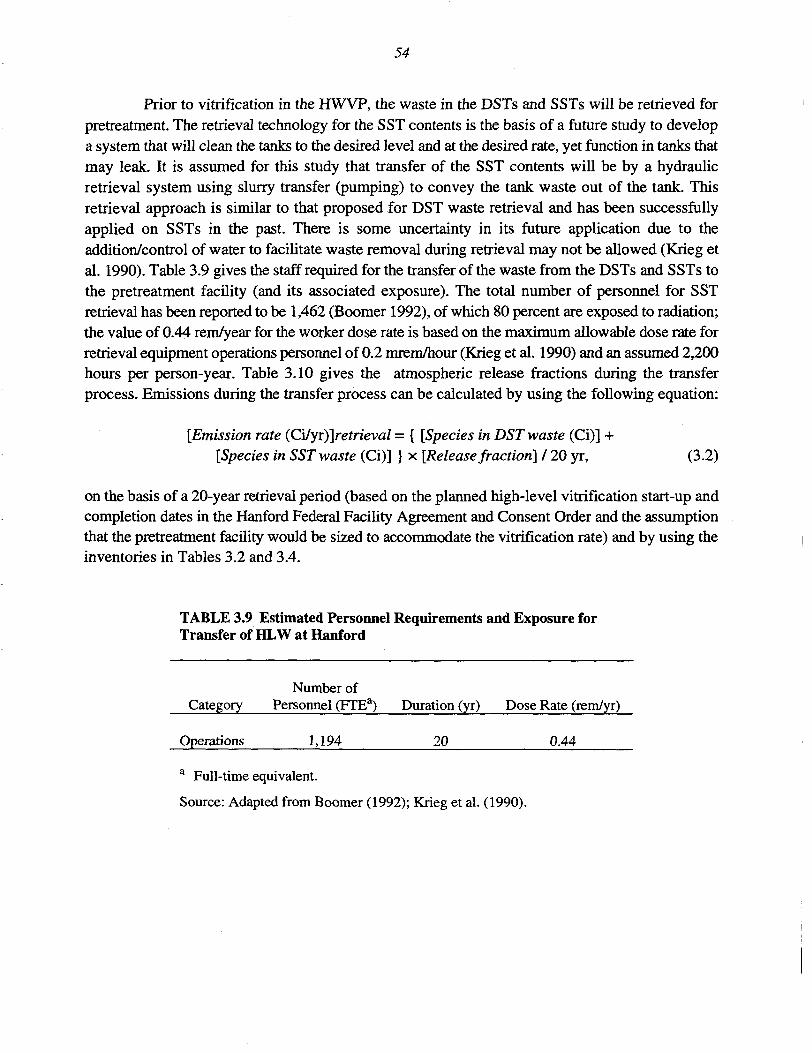
54
Prior to vitrification in the HWVP, the waste in the DSTs and SSTs will be retrieved forpretreatment. The retrieval technology for the SST contents is the basis of a future study to developa system that will clean the tanks to the desired level and at the desired rate, yet function in tanks thatmay leak. It is assumed for this study that transfer of the SST contents will be by a hydraulicretrieval system using slurry transfer (pumping) to convey the tank waste out of the tank. Thisretrieval approach is similar to that proposed for DST waste retrieval and has been successfullyapplied on SSTs in the past. There is some uncertainty in its future application due to theaddition/control of water to facilitate waste removal during retrieval may not be allowed (Krieg etal. 1990). Table 3.9 gives the staff required for the transfer of the waste from the DSTs and SSTs tothe pretreatment facility (and its associated exposure). The total number of personnel for SSTretrieval has been reported to be 1,462 (Boomer 1992), of which 80 percent are exposed to radiation;the value of 0.44 rem/year for the worker dose rate is based on the maximum allowable dose rate forretrieval equipment operations personnel of 0.2 mrem/hour (Krieg et al. 1990) and an assumed 2,200hours per person-year. Table 3.10 gives the atmospheric release fractions during the transferprocess. Emissions during the transfer process can be calculated by using the following equation:
[Emission rate (CUyx)~[retrieval = { [Species in DST waste (Ci)] +[Species in SST waste (Ci)] } x [Release fraction] 120 yr, (3.2)
on the basis of a 20-year retrieval period (based on the planned high-level vitrification start-up andcompletion dates in the Hanford Federal Facility Agreement and Consent Order and the assumptionthat the pretreatment facility would be sized to accommodate the vitrification rate) and by using theinventories in Tables 3.2 and 3.4.
TABLE 3.9 Estimated Personnel Requirements and Exposure forTransfer of HLW at Hanford
Number ofCategory Personnel (FTEa) Duration (yr) Dose Rate (rem/yr)
Operations 1,194 20 044
a Full-time equivalent.
Source: Adapted from Boomer (1992); Krieg et al. (1990).

55
TABLE 3.10 Atmospheric Releases of Radionuclidesfrom Transfer of HLW at Hanford3
Release Description Release Fraction
Assume 10% of the liquid becomes 2.0E-10 for gasairborne annually via evaporation 1.0E-01 for tritiumand is released from the tank farmventilation system with an overalldecontamination factor of 5.0E+08.
a The release characteristics at Hanford are taken to be thesame as at WVDP. The release fraction for gases iscalculated by dividing 10% by 5.0E+08. For tritium, therelease fraction is 10% because the filter system isassumed to be ineffective in removing tritium.
Source: Adapted from DOE (1982b).
3.1.3 Current Status
Numerous tank waste activities are ongoing to provide for the continued safe storage of thetank waste until remediation measures are implemented. These activities consist of a number ofroutine activities as well as a number of additional activities required for safe storage.
Routine operations include management oversight, regulatory compliance and reportingactivities, and operations and maintenance of facilities and equipment. Tank monitoring activitiessupport waste management by gathering information on waste temperature, liquid levels, solidlevels, and tank status. Leak detection activities involve in-tank liquid level monitoring, leakdetection monitoring of the annulus for the DSTs, dry-well monitoring around tanks for increase inradioactivity levels, and groundwater monitoring.
Safety management activities include the following:
• Calculating operational waste volume projections that involve comparingprojected waste volumes against tank capacity. The projections also providefor identification and management of risk that could negatively impactavailable tank storage space;
• Combining compatible waste types. Transferring tank waste between tanksand tank farms through the existing cross-site transfer system to provide therequired tank space and to address safety issues;

56
• Implementing a waste minimization program to reduce the generation of newwaste requiring storage in the tanks;
• Screening and characterizing the waste on a tank-by-tank basis to gather datain support of safety and remedial action design activities;
• Isolating and removing pumpable liquid from SSTs to reduce the potential offuture leakage (interim stabilization by saltwell pumping); and
• Operating the 242-A Evaporator to concentrate waste and treat residual liquidto remove the contaminants.
On December 1,1995, DOE and Ecology published their Record of Decision for the SafeInterim Storage EIS in the Federal Register (60 FR 61687). The decision was to implement most ofthe actions of the preferred alternative, including:
• Construct and operate a replacement cross-site transfer pipeline system;
• Continue operating the existing cross-site transfer pipeline system until thereplacement system is operational; and
• Continue operating the mixer pump in tank 101-SY to mitigate theunacceptable accumulation of hydrogen and other flammable gases.
The existing cross-site transfer system has been used to transfer waste from the 200 WestArea for 40 years. This underground pipeline system is at the end of its original design life.Currently, four of the six lines are out of service and unavailable to perform transfers because ofplugging. The two useable lines do not meet current engineering standards, such as doublecontainment and leak detection, which are required for waste management facilities. Constructionof the replacement cross-site transfer system has begun.
The mixer pump in tank 101-SY was proven to be effective in mitigating the flammablegas as a safety issue in that tank during more than one year of operations. It was determined that theconstruction of new tanks to resolve safety concerns was not necessary.
Based on new information available to DOE regarding nuclear criticality safety concernsduring retrieval, transfer, and storage actions, DOE has decided to defer a decision on theconstruction and operation of a retrieval system in tank 102-SY. Based on the quantities ofplutonium in tank 102-SY sludge, retrieval of the solids falls within the scope of the criticality safetyissues that will be evaluated over the next few months.

57
Currently, DOE is considering contracting with private companies for waste remediationservices for the tank waste. DOE is interested in encouraging industry to use innovative approaches,and in using competition within the private marketplace to bring new ideas and concepts to tankwaste remediation. The goal of the privatization effort is to streamline the TWRS mission, transfera share of the responsibility, accountability, and liability to industry, improve performance, andreduce cost without sacrificing worker and public safety or environmental protection.
DOE plans on issuing contracts to perform the first phase of the work in late summer 1996.As currently envisioned, DOE would select contractors to construct and operate commercialdemonstration facilities for two tank waste separations and low-activity waste (LAW)immobilization facilities, one of which may include a HLW vitrification facility. If these commercialdemonstrations are successful, DOE may use the lessons learned from those demonstration facilitiesand proceed with contracting for full-scale facilities to remediate the remainder of the tank waste.
3.2 HANFORDSITE: PLANNED FACILITIES
3.2.1 Hanford High-Level Waste Vitrification Facility
The DOE is currently considering building two vitrification plants at Hanford, one for LLWand the other for HLW. The 1988 TPA among DOE, Washington State, and the U.S. EnvironmentalProtection Agency (EPA) establishing cleanup milestones has been altered to now mandate that thecontents of the SSTs be processed as well. The HLW vitrification facility will be designed to besimilar to the DWPF at SRS; originally, it was designed to process four types of waste from 10 ofthe DSTs: (1) NCAW, (2) NCRW, (3) PFP waste, and (4) CC waste. The NCAW was produced fromthe reprocessing of N-Reactor fuels at the PUREX Plant. This waste contains approximately 80%of the radioactive inventory and would therefore be the primary high-heat source of feed tovitrification. It was expected to be the initial feed to the vitrification plant and is also the referencefeed for the design of the HWVP. The remaining feeds are expected to follow in the order of NCRW,PFP, and CC.
The ability of the HLW vitrification facility to process both the DST and SST waste, willdepend on the pretreatment process selected and the resulting quantities of HLW that will be fed tothe facility.
Figure 3.3 shows the flowsheet for the borosilicate glass immobilization process at Hanford.The process consists of (1) transferring the HLW from current storage to a pretreatment process,(2) transferring the pretreated HLW to the vitrification facility for processing into canisters,(3) storage of the canisters in an interim storage facility, and (4) final disposal in a geologicrepository.

AirborneReleases
Waste in 10Double-Shell
Tanks
AirborneReleases
AirborneReleases
AirborneReleases
VitrificationFacility Repository
Current Storage Pretreatment Treatment Interim Storage
FIGURE 3.3 Flow Diagram of the HWVP Process
Disposal

59
The HLW vitrification facility is intended to be a freestanding, single train plant designedto produce 20 metric tons of HLW glass per day. The HLW vitrification facility would have sixoperational areas that would include feed receipt and sampling, process evaporation, melteroperations, maintenance areas, canister loading, cold chemical makeup, and off-gas processing. Thefacility would have an overall height of 45 m (150 ft), of which 13 m (45 ft) would extend belowgrade. The facility's dimensions would be 55 by 165 m (175 by 545 ft) with an area of 8,800 m(94,700 ft2).
The facility's process levels would contain feed receipt and sampling equipment,centrifuges, process evaporation equipment, melter operations equipment, and the maintenance area.The feed tanks would be located in an adjacent structure. Three other areas would provide theremainder of the support facilities. The 13 m (45 ft) level would house the canister loading andhandling equipment. The +20 m (+65 ft) level would provide crane maintenance and cold chemicalstorage makeup.
The final HLW glass form would be a glass canister measuring 0.61 by 4.57 m (2.0 ft by15.0 ft). The HLW interim on-site storage facility would allow enough interim storage space for allof the HLW glass produced.
The HLW vitrification facility would receive HLW slurry from the sludge washingoperation and cesium solution from the LAW separation facility. After sampling, water would beremoved first by centrifuging and then evaporating the centrate. The solids and the slurry from theevaporator would be recombined to feed the HLW melter feed system. The feed would be sampledand analyzed. Based on the resulting analyses, fluxes would be added to provide the desired vitreousproduct, a borosilicate glass that would contain 20 percent waste oxides.
A cold cap melter would use joule heating where current is passed through the moltencharge that serves as the resistance element for the furnace. This type of furnace would have a crustover the surface of the melt, which receives the slurry feed, hence the term cold cap. The water inthe slurry would be evaporated from the cold cap, and the dried waste would sink as the bottom ofthe cap enters the melt.
The hot glass would be semi-continuously poured into cylindrical stainless-steel canisters,which would be 0.61 m (2 ft) in diameter and 4.57 m (15 ft) high.
A canister would be moved from storage into position under a filling tube that would belowered to mate tightly with the canister. The fill tube would contain a passage for molten glass toflow into the canister and a separate passage for air to vent out of the canister. The canister wouldbe filled with molten glass. After canister filling was completed, the filled canister would then betransferred to the canister weld cell where it would be welded shut.

60
A transfer cart would move the canister into the decontamination cell from the weld cell.The crane would lift the canister from the cart and move it to a decontamination area.Decontamination solution would be sprayed onto the canister followed by a water rinse. After thecanister is dried, the crane would transport it to the smear test cell, where the canisters would besmear-tested for surface contamination. If the canisters fail the test they would be returned to thedecontamination cell. If the canisters pass the test they would be forwarded to the load-out cell andthen transferred to interim storage pending shipment to a potential geologic repository for disposal.
It should be noted that the design information is at an early planning stage. The details arelikely to change as the planning and design process matures.
Table 3.11 summarizes information on safety classifications of the high-level wastevitrification buildings and structures, the dimensions of the vitrification building, electric energyrequirements, and approximate construction material requirements.
3.2.2 Schedules and Uncertainties
The processing rate of the HLW vitrification facility will be affected by the pretreatmentoption selected. Pretreatment reduces the amount of waste feed to the immobilization plant; thenumber of HLW canisters is therefore dependent on the extent of the pretreatment performed. Theprevious DOE approach was to remove strontium, cesium, technetium, and transuranic waste(TRUW) elements from the soluble salts, which would be then combined with sludges and otherstreams containing high concentrations of fission products and TRUW elements. Pretreatment maypotentially include an ion-exchange process for extracting cesium and strontium from the liquidportion of the waste and sludge washing for dealing with the precipitate at the bottom of the tanks.The exact pretreatment option is to be assessed between 1994 and 1997; a design for the HLWpretreatment facility is to be completed by March 1998. Based on an estimated total of 15,000Hanford HLW canisters and the planned high-level vitrification start-up and completion dates(December 2009 and December 2028, respectively) in the Hanford Federal Facility Agreement andConsent Order, the average annual processing rate is estimated to be approximately 790 canistersper year.
3.3 SAVANNAH RIVER SITE: EXISTING FACILITIES
3.3.1 History
The SRS was established in 1950 by the U.S. Atomic Energy Commission to producenuclear materials for the nation's defense. The production of these nuclear materials has resulted in

61
TABLE 3.11 Resource Requirements for Constructionof the HLW Vitrification Facility and Support Structuresat Hanford
Hanford High-Level Waste Vitrification Facility
Safety classificationsVitrification BuildingAuxiliary structures
Number of levels in Vitrification Building
Exterior walls of Vitrification Building
Vitrification Building dimensionsLength (m)Width (m)Height (m)
Building footprint (m2)
Annual electric energy requirement (GWh)
l a
3b
4C
Reinforced-concrete,shielded construction
16555458,800
620
Approximate Construction Material Requirements
Concrete (m3)Steel (t)
Stainless steel
Hastelloy/Inconel (t)
Water (m3)
Diesel (m3)
715,000
142,000
24,400
3,130
678,000
28,400
a Exterior concrete walls and roof slab are Safety Class 1. Someparts interior to the building are Safety Classes 2 and 3. Adiscussion of Hanford's facility usage categories is given inWodrich et al. (1991).
The sand filter building is Safety Class 1. Inter-area transfer linesare Safety Class 2.
c First level (13 m) is below grade.
Sources: DOE (1996a).

62
radioactive waste that has been stored at SRS. In the early 1980s, DOE initiated efforts to end thestorage of the liquid high-level radioactive waste at SRS by developing plans to treat the waste andconvert it into a more stable glass form that would then be shipped to a geologic repository forpermanent disposal. Figure 3.4 is a schematic of the HLW management approach to be implementedat SRS.
The high-level radioactive waste that was generated during reprocessing of SNF and targetmaterials was transferred from the separations facilities to large underground tanks (Mclntosh andPapouchado 1990). Prior to storage in 51 underground carbon-steel tanks, the waste stream wasalkalinized to pH 13 for corrosion prevention. The fresh waste consisted of two phases: liquid andsolid. The liquid phase is a solution of salts in water under alkaline conditions. The solid phase iscomposed of chemicals that are insoluble in alkaline solution. The bulk of these solids settles in thestorage tanks and is referred to as "sludge." The sludge phase consists primarily of oxides andhydroxides of aluminum, iron, and manganese. Except for Cs-137, virtually all radionuclides canbe found in the sludge. The sludge contains more than 60 percent of the radionuclides. To minimizethe volume of waste stored, the salt solution is concentrated by evaporation, which reduces the wastevolume by about 60%. The chemical salts in the waste crystallize out and a salt cake forms.
3.3.2 Facility Descriptions and Environmental Releases
Existing HLW facilities at SRS include the Liquid Radioactive Waste Handling Facilities(LRWHFs) and the DWPF (Figure 3.5). The LRWHFs, commonly referred to as the tank farms, arelocated in the F- and H-areas at SRS; the tank farms occupy about 20 ha (50 acres) of the 80,000-ha(198,000-acre) SRS. The tank farm facilities consist of underground waste tanks with a nominalcapacity of 3,800 m3 (1 million gal) each. The HLW tank farms also maintains four evaporators forwaste concentration (two are currently operational), transfer pipelines, 14 diversion boxes, 13 pumppits, and associated tanks, pumps, and piping for transferring the waste (DOE 1995a).
The HLW tanks are located in two tank farms in the 241-F and 241-H areas. The F-Areafarm accommodates 22 tanks, and the H-Area farm houses 29 tanks. The tanks can be one of fourdifferent types; each type has unique design characteristics. The HLW tanks are built of carbon steeland reinforced concrete. Types I through in are constructed of double-walled carbon-steel withforced cooling (outer diameter ranging from 23 to 26 m [75 to 85 ft]) and between 7.5 and 10 m[24.5 and 33 ft] high); Type IV tanks have a single carbon-steel wall without forced cooling (26-m[85-ft] outer diameter by 10-m [33-ft] high). Tank types I, II, and HI are used primarily for high-heatwaste; Type IV tanks are reserved for low-heat waste. The Type HI design is the newest design andis most commonly used for receipt of fresh waste from chemical processing operations (Hobbs etal. 1992). Table 3.12 gives the number of tanks, capacities, and construction times for tanks ofeach design.

63
Releases
Treatment Interim Storage Disposal
Pretreatment
FIGURE 3.4 Flow Diagram for Defense Waste Processing Facility
The size of the tanks ranges from 2,840 m3 (750,000 gal) to 4,921 m3 (1.3 million gal) witha total capacity of 188,000 m3 (49.7 million gal). Table 3.13 gives the design characteristics of eachtank type. At present, the tanks are at greater than 90 percent of usable capacity (DOE 1995a). Ofthe 50 tanks currently in use, 23 (Types I, II, and IV designs) do not meet criteria for leak detectionand secondary containment, and will be retired by 1997. This will leave 27 tanks for HLW storagewith a total capacity of about 133,000 m3 (35 million gal). The radionuclide distribution of the wastecurrently stored in the tanks is given in Table 3.14.
The ventilation system for the waste storage tanks vary; some do not have active ventilationwhile others maintain negative pressure to ensure that unfiltered air would flow into the potentiallycontaminated tank during loss of containment. For most tanks, air enters a tank through a HEPAfilter on one side, passes to the other side of the tank where it exits through a demister, condenser,heater, and HEPA filter. The air then exits through an exhaust blower to the atmosphere. All of theType HI and some of the Type I, II, and IV tanks have permanently installed instruments thatcontinuously monitor the vapor space for flammable vapor mixtures. The other tanks are monitoredwith portable instruments on a weekly basis.
Atmospheric releases from the HLW storage tanks are the result of the continuous ventingof the tanks. The venting is required to remove the hydrogen that is generated by the radiolyticdecomposition of organic material in the tanks. On the basis of experience at WVDP, 1% of theliquid inside the tanks is expected to evaporate per year and become airborne (Table 3.15). Theradionuclides entrained in the ventilation air stream are assumed to be passed through a HEPA filterwith an overall decontamination factor (DF) of 5 x 10⁸ (except for tritium, H-3). With thisinformation, an annual release fraction of 2 x 10"11 for all the gaseous entrainments can be

64
Inset Kilometers 0 , 2 3 4 5
Note: OWPF facilities are located in S-, H-, and Z-Areas.
FIGURE 3.5 Map of the Savannah River Site (Source: Davis et al. 1989)

65
TABLE 3.12 Savannah River Waste Tank Designs
TankType
I
nmIV
Number ofTanks
12
4
27
8
Capacity(m3)
2,840
4,000
4,920
4,920
Cooling
Yes
Yes
Yes
No
Constructed
1951-1953
1955-1956
1967-1981
1958-1961
Source: Hobbs et al. (1992).
calculated. Because HEPA filters are ineffective for tritium, the release fraction for hydrogen-3 is0.01/yr. The release fractions have to be multiplied with the inventory for each radioisotope providedin Table 3.14 to obtain annual emissions in curies per year. The emissions are released to theatmosphere through a 7.62-m (25-ft) stack with an inside diameter of 0.254 m (10 in.) (Table 3.16).
The HLW storage tanks must be monitored and maintained on a regular basis. For the tankfarm surveillance and maintenance, labor requirements and dose rates can be found in DOE (1979).After scaling the original number to the current storage volume, it was determined that a total of33 workers are needed until 1997 when all Type I, n, and IV tanks will be retired (Table 3.17). After1997, 21 workers will be required for this task. The individual worker dose is estimated to be0.36 rem/yr.
Waste from the separation canyons flows to a receiving tank in the tank farm through adiversion box in which appropriate jumper connections are made to establish the desired flow path.The individual tank farms are interconnected to diversion boxes and valve pits with buried transferlines. The original waste transfer lines consists of a stainless steel pipe surrounded by a bitumen-coated carbon-steel pipe for secondary containment which is itself surrounded by a waterproofconcrete encasement. Hydraulic pumps and steam-jet eductors are used for waste transfer(WSRC 1992).
The F- and H-Area tank farms, located approximately 3.2 km (2 mi) apart, areconnected by inter-area transfer lines. The inter-area transfer lines consist of a pair of parallel7.62-cm (3-in.) stainless steel lines enclosed in 10.16-cm (4-in.) carbon-steel pipe jackets forsecondary containment and are located below grade.

TABLE 3.13 Current HLW Storage at SRS
TankCharacteristics Tank Type I Tank Type II Tank Type III Tank Type IV
Storage method
Radiationprotection
Date ofretirementb
Underground, carbon-steel,double-walled tank with forcedcooling; sits within a pan that is1.5 m deep and 1.5 m larger indiameter than tank;encapsulated in a concretevault.
Unit capacity 2,838,750 L
Number of units 12
Percent of total 12waste stored in thistank type
Percent of total 27radioactive content
1997
Underground, carbon-steel,double-walled tank with forcedcooling; sits within a pan that is1.5 m deep and 1.5 m larger indiameter than tank;encapsulated in a concretevault.
2.7 m of soil cover over 0.56 m Not availableconcrete roof
3,898,550 L
4a
4
1997
Underground, stress-relievedcarbon-steel, double-walled tankwith forced cooling; sits within atank of same height;encapsulated in a concrete vault.
Elevated above ground,surrounded with mounded earth;no soil cover over 1.2 m ofreinforced concrete roof.
4,920,500 L
27
77
64
Not available
Underground, carbon-steel, single-walled tank without forced cooling;encapsulated in a concrete vaultwithout water stops.
F-Area, 0.8 m of soil cover over 0.18-mconcrete roof;H-Area, 1.1m of soil cover over0.18-m concrete roof.
4,920,500 L
8
<1
1997

TABLE 3.13 (Cont.)
TankCharacteristics Tank Type I Tank Type II Tank Type HI Tank Type IV
Surface area ofunitc
Location
Diameter: 22.9 mHeight: 7.5 mSurface area: 1,363 m2
8 tanks in 241-F Area; 4 tanksin241-HArea
Diameter: 25.9 m Height: 8.2 mSurface area: 1,721 m
4 tanks in 241-H Area
fDiameter: 25.9 mHeight: 10.1 mSurface area: 1,876 m2
10 tanks in 241-F Area; 17 tanksin 241-H Area
Diameter: 25.9 mHeight: 10.1 m Surface area: 1,876 m2
4 tanks in 241-F Area; 4 tanks in 241-HArea
a One of the four Type II tanks (i.e., tank 16H) has been taken out of service and is currently empty.
b DOE (1989a, 1991a, 1995a).
c Surface area calculated by assuming that the tanks are cylindrical in shape.
Sources: DOE (1979,1982a, 1989a); Mclntosh and Papouchado (1990).

68
TABLE 3.14 Radionuclide Content of Current HLW Inventory at SRS
Radionuclide
H-3
C-14
Co-60
Ni-59
Ni-63
Se-79
Rb-87
Sr-90
Y-90
Zr-93
Zr-95
Nb-95
Tc-99
Ru-106
Rh-106
Pd-107
Sn-121m
Sn-126
Sb-125
Curies
3.2E+03
9.2E-02
4.0E+05
5.5E+01
7.3E+03
4.2E+02
2.1E-03
1.1E+08
1.1E+08
2.6E+03
2.4E+01
5.0E+01
7.6E+03
5.3E+06
5.3E+06
3.4E+01
2.1E+02
1.0E+03
1.9E+06
Radionuclide
Sb-126
Sb-126m
Te-125m
1-129
Cs-134
Cs-135
Cs-137
Ba-137m
Ce-144
Pr-144
Pr-144m
Pm-147
Sm-151
Eu-152
Eu-154
Eu-155
U-232
U-233
U-234
Curies
1.4E+02
1.0E+03
6.8E+05
3.6E-02
8.7E+05
2.6E+02
1.1E+08
1.0E+08
2.3E+07
2.3E+07
2.7E+05
5.7E+07
5.7E+05
8.6E+03
1.5E+06
1.1E+06
3.1E+01
3.7E-03
8.2E+01
Radionuclide
U-235
U-236
U-238
Np-237
Pu-236
Pu-238
Pu-239
Pu-240
Pu-241
Pu-242
Am-241
Am-242
Am-242m
Am-243
Cm-242
Cm-243
Cm-244
Total
Curies
3.7E-01
2.6
2.4E+01
5.0
2.9E+02
3.6E+06
3.1E+04
2.1E+04
4.0E+06
2.7E+01
2.6E+04
3.4E+01
3.4E+01
1.4E+01
8.2E+01
1.3E+01
2.6E+05
5.7E+08
Source: Adapted from ORNL (1992b).
TABLE 3.15 Atmospheric Releases of Radionuclides during CurrentStorage of HLW at SRS
Release Description Release Fraction8
Assume 1% of liquid becomes airborne byevaporation into ventilating system air streamwith overall decontamination factor of 5.OE+O8before release to the atmosphere.
2.0E-11/yr for gasesl.OE-02/yr for tritium
a The release characteristics at SRS are taken to be equal to those ofWVDP. The release fraction for gases is calculated by dividing 1% by5.0E+08. For tritium, the release fraction is 1 % because the filter systemis assumed to be ineffective in its removal.
Source: DOE (1982b).

69
TABLE 3.16 Release Point Characteristics for AtmosphericEmissions for Current Storage of HLW at SRS
Stack Parameter
Release point
Stack height (m)
Height above surrounding structures (m)
Stack diameter (m)
Stack exit velocity (m/s)
Exit temperature (°C)
Value
Tank Type m a
7.6
7.6
0.25
4.9
40
a Because tank types I, n, and IV are in the process of beingretired, the release point characteristics of tank type III areused for storage.
Source: Hunter (1990).
TABLE 3.17 Estimated Personnel Requirements andExposure for Current Storage of HLW at SRS
Number ofPersonnel Dose Rate
Category (FTE)a Duration (date) (rem/yr)b
Exposed (all) 33 1994-1997 0.36Exposed (all) 21 1998-2007 0.36
a The quoted number of 21 full-time-equivalent (FTE) workersfor tank-farm maintenance and surveillance is based on25 Type in tanks. This number is used for the period after1997 when all waste tanks other than Type HI will be retired.For the period until 1997, the 21 workers are scaled up toaccount for the 24 tanks of types I, n, and IV. The scaleup isnot done linearly to account for the gradual phaseout of thesewaste tanks. A factor of (51/25)06 is applied (DOE 1979).
b 7.6 rem/yr for all workers divided by 21 workers (DOE 1979).

70
The HLW will be transferred from the F- and H-Area tank farms, where the waste is storedand the pretreatment facilities (in-tank precipitation and in-tank sludge processing) are located, tothe DWPF for treatment. For the transfer, a system of above-grade and underground transfer lineswill be used, together with diversion boxes and pump pits. The diversion boxes and pump pits arebelow-grade concrete cells with concrete covers that will allow SRS to transfer waste from tank totank, from one tank farm to the other, or from the tank farms to the DWPF. Pump pits are locatedat a low point in the system and contain tanks to receive the waste and pumps to transfer the wastethrough the connecting lines.
According to experience at WVDP, air entering the transfer system via the pits causes about10% of the liquid to evaporate and become entrained in the system air stream. Before being releasedto the atmosphere through a 25-ft stack, the air is passed through a HEPA filter with an overall DFof 5 x 10⁸ (except for tritium). The release fractions can be calculated as 2 x 10~10/yr for gases and0.1/yr for tritium, as given in Table 3.18. The release point characteristics are assumed to be thesame as for current storage presented in Table 3.16.
Table 3.19 gives the labor requirements for transferring the HLW at Savannah River fromthe tank farms to the DWPF. The estimates in DOE (1979) were used and scaled accordingly toreflect the lower throughput of the transfer system. To transfer the current HLW backlog of about132,000 m (34.8 million gal), it is estimated that four workers will be needed during the 15 yearsof transfer operations. The worker dose rate is estimated to be about 0.42 rem/yr.
Pretreatment will take place in seven Type in storage tanks (four for in-tank precipitationand three for sludge processing); a pump tank at the New Waste Transfer Facility (capacity of29.3 m3 [7,750 gal]) will be used for the sludge feed to the DWPF. Four Type III tanks will beallocated to the in-tank salt processing, which consists of three steps. The feed for in-tank saltprocessing will be the salt cake that has been redissolved with corrosion-inhibited water plusrecycled wash water and agitated by slurry pumps. When the solution reaches saturation, it will beremoved in batches and sent to a salt processing tank. Salt concentrate from the in-tank sludgeprocessing plus any liquid waste recycled from the DWPF are blended into the feed. The first stepremoves cesium and potassium from the 35 wt% salt solution. The addition of an aqueous sodiumtetraphenyl borate (NaTPB) solution causes Cs-137 and potassium (K) to precipitate out as cesiumtetraphenyl borate (CsTPB) and potassium tetraphenyl borate (KTPB). For complete precipitation,NaTPB is added 50% in excess of the stoichiometric amount. Portions of mercury in the stream areprecipitated in this step as diphenylmercury. Next, Sr-90 and plutonium are removed by adsorptionon sodium titanate (NaTi) particles after mixing the salt solution with a 17 wt% NaTi slurry inalcohol. Finally, the precipitate is separated from the salt solution by cross-flow filtration with about28.4 million L (7.5 million gal) per year of decontaminated filtrate going to the Saltstone Facility.The slurried precipitate is sent back to the processing tanks and mixed with the next batch thatundergoes in-tank salt processing.

71
TABLE 3.18 Atmospheric Releases of Radionuclides during TransferofHLWatSRS3
Release Description Release Fraction
Assume 10% of liquid becomes airborne annually 2.0E-10 for gasesby evaporation and is released from the tank-farm 1.0E-01 for tritiumventilation system with an overall decontaminationfactor of 5.0E+08 before release to the atmosphere.
a The release characteristics at SRS are taken to be equal to those atWVDP. The release fraction for gases is calculated by dividing 10% by5.0E+08. For tritium, the release fraction is 10% because the filtersystem is assumed to be ineffective in its removal.
Source: DOE (1982b).
TABLE 3.19 Estimated Personnel Requirements and Exposurefor HLW Transfer at SRS
Number ofCategory Personnel (FTE)a Duration Dose Rate (rem/yr)b
Exposed (all) 5 15 0.42
a DOE (1979) states that it will take 10 workers over 10 years totransfer 60 x 106 gal (227 x 106 L) of waste. As planned, 132 x 106 Lwill be transferred to the DWPF over 15 years. By scaling to thelower throughput, the number of workers is determined as follows:
[100 worker-yr x (132/227)06] / 15 yr.
b The total personnel exposure of 4.2 rem/yr is divided by the numberof workers to obtain the individual dose rate of 0.42 rem/worker-yr(DOE 1979).

72
One full cycle of in-tank salt processing involves three consecutive batches. Sodiumtetraphenyl borate and NaTi are added only to the first batch since their increased use providesvirtually no additional gains in decontamination. At the end of the cycle, the accumulatedprecipitates are washed and corrosion inhibitors (caustic [NaOH] and sodium nitrite [NaNO2])added. The precipitates are then sent to the salt processing cell in the DWPF in 30-m3 (8,000-gal)batches.
The slurried sludges will be transferred from the storage tanks to three Type HI tanksdedicated to in-tank extended sludge processing. Sludges low in aluminum will be sent theredirectly. High-aluminum sludges, however, will first be reacted with 50 wt% hot caustic to dissolvean expected 75% of the hydrated alumina (A12O3). The excess caustic and the resulting solublesodium aluminate plus other soluble salt species will be washed out with water, which reduces thewaste volume by approximately 50% and improves the waste characteristics significantly,particularly viscosity. The sludge will be allowed to settle over a period of about three weeks. Next,the supernatant will be decanted, concentrated by evaporation, and fed to the in-tank salt processing.The complete wash-settle-decant cycle will take approximately one month. It is estimated that thefirst batch will provide feed to the DWPF for about three years of operation (2.5 million L[660,000 gal] of 13 wt% sludge). A pump tank at the New Waste Transfer Facility will be used tofeed sludge to the DWPF; pump tank capacity will be 7,750 gallon. The sludge will be delivered tothe DWPF in microbatches of about 30 m3 (8,000 gal).
The vitrification process at SRS is similar to that at Hanford. After processing to removemercury from the pretreated HLW, glass-forming frit is added and the mixture concentrated byevaporation. The resulting mixture is fed to a melter where it is heated, and the molten glass ispoured into stainless steel canisters. The outer surfaces of the canisters are decontaminated and thetop is welded closed. Each canister will contain about 0.62 m (165 gal) of vitrified waste. An annualaverage production rate of 190 canisters per year is assumed in this analysis. The "High-Level WasteSystem Plan" (WSRC 1995) indicates a maximum production rate of about 300 canisters per year.
The facility design adopted for the DWPF is based on the separations canyons operatedsuccessfully at Hanford and SRS for processing SNF. Design of the DWPF is based on totallyremote operation and maintenance (O&M) of all chemical and mechanical processes that handle anyradioactive materials or are conducted in a radioactive environment (McKibben et al. 1990). Theprincipal operating facility is the Vitrification Building, which is designed as a reinforced-concreteshielded facility 110 m (360 ft) long, 35 m (115 ft) wide, and 27 m (90 ft) in height (DOE 1994b).This structure contains the glass melter and associated facilities for solidification of the high-levelradioactive waste supplied from the tank farms. It is designed with two parallel canyons. The eastcanyon contains the maintenance repair cell, backup off-gas cell, melter cell, and decontaminationcell. The west canyon contains most of the conventional wet chemical processing equipment. Theprincipal cell areas of the DWPF are the process cell (sludge acidification, mercury removal, andglass frit addition), the melter cell (glass melter and cooldown station for filled canisters), the
73
canister decontamination cell (canister decontamination), and the weld test cell (to seal weld thecanisters).
The DWPF vitrification building is designed as a Category 1 facility (DOE 1989b; Kennedyet al. 1990). Table 3.20 summarizes information on the dimensions of the Vitrification Building,electric energy requirements, and other process requirements. Further information concerning theDWPF is provided in the Defense Waste Processing Facility Final Supplemental EIS (DOE 1994b).
A second major facility is the GWSB, which is designed as a natural convection air-cooledvault for storage of 2,286 canisters with a maximum canister heat load of 470 W.
3.3.3 Current Status
SRS completed the DWPF EIS in November 1994 (DOE 1994b). The DWPF includes theHLW pretreatment process, the Vitrification Facility, saltstone manufacturing and disposal (LLWresulting from the pretreatment of HLW), radioactive glass waste storage facilities, and associatedsupport facilities. The Record of Decision (March 28,1995) describes the Department's decision tocomplete construction and begin operation of the DWPF. The DWPF became operational onMarch 12, 1996. Vitrified HLW canister production began in 1996, with 27 canisters produced asof July 15, 1996.
3.4 SAVANNAH RIVER SITE: PLANNED FACILITIES
Vitrification of the HLW at SRS is expected to take 24 years. The glass canisters are storedon-site in an interim storage facility until the year 2015, when it is assumed that a geologicrepository will be available.
Storage capacity is currently provided for 2,286 vitrified HLW canisters. In accordance withthe Final DWPF Supplemental EIS (DOE 1994), a second glass canister storage building will beconstructed in 2007 for an additional estimated 2,286 HLW canisters. The second facility, like thefirst storage building, will hold canisters in vertically sealed cavities within a concrete structureforming the storage vault. The second glass canister storage building is projected to accommodatecanisters with heat loads up to 670 W, in comparison with the 470 W limit of the first building(WSRC 1991). Table 3.21 summarizes estimated facility characteristics for the second glass canisterstorage building on the basis of a storage capacity of 2,286 canisters and a maximum loading rateof 410 canisters per year; further details on the derivation of the various parameters in Table 3.21are given in the Appendix. (Facility characteristics for the first glass storage facility at SRS are givenin Table 1.2.)

74
TABLE 3.20 Defense Waste Processing Facility at SRS
Building features
Number of stories in DWPF building
Shielding for operating personnel
Building dimensions'3
Building length (m)
Building width (m)
Building height (m)
Approximate footprint (m2)
Total land requirements (m2)
Seismic- and tornado-resistant concrete structure;designed with two parallel canyons; east canyonsfor maintenance repair cell, backup off-gas cell,melter cell, and decontamination cell; west canyonfor most of the conventional wet chemicalprocessing equipment.3 a
1.2-mthicka
110
36
28
3,960
161,880b
Resource Commitments during Operations0
Electricity (GWh/yr)
Water (m3/yr)
Glass frit (t/yr)
Sodium hydroxide (t/yr)
Sodium tetraphenylborate (t/yr)
32
7,600
680
1,490
245
Carlson (1989).
State of South Carolina (1984).
Defense Waste Processing Facility Final Supplemental EIS (DOE 1994b).

75
TABLE 3.21 Facility Characteristics for the Second Glass Canister StorageBuilding at SRS
Parameter
Construction
Quantity
Resource
Parameter
Requirements
Operations
Quantity
Water (nr5)Concrete (m )Steel (t)
9,300250,00041,000
Water (nr/yr)LoadingStorage
Electricity (GWh/yr)
Total effort (worker-yr)Construction duration
(months)
5152
Loading (FTE)Support (FTE)
5,7002.5
Occupied land (ha)
Disturbed land (ha)
Peak (persons)
0.44
0.80
390
LoadingStorage
Land Requirements
Number of floors
Facility size (m2)
Employment
Storage (FTEa)
0.6Negligible
1
4,800
9
41
18
Costs
Capital cost ($ million) =43 Loading O&M ($ million/yr)
Storage O&M ($ million/yr)
12
0.66
Secondary Waste Streams
Hazardous
Sewage
Negligible
Negligible
Contact-handled LLW: loading 940(m3/yr)Contact-handled LLW: storage 200(m3/yr)
Air Emissions
Fugitive Dust (t)
NOX (t)
SOx(t)
33
5.7
0.5
Radiological
Hazardous
Potential pollutant
Negligible
Negligible
Negligible
Full-time equivalent.

76
3.5 IDAHO NATIONAL ENGINEERING LABORATORY: EXISTING FACILITIES
3.5.1 History
The INEL, formerly known as the National Reactor Testing Station, was established in1949 as a site for constructing, testing, and operating nuclear facilities. Eventually, 52 nuclearreactors were constructed and operated; as of 1992,13 were currently operational (DOE 1992a). Inaddition, various support facilities were built and tested to demonstrate the applications of nuclearreactor technology, conduct safety research, and support defense programs. Currently, INELactivities include treating and storing HLW.
Recovery of nuclear materials at INEL is centered at the ICPP. This plant was built in 1951and is located on an 82-ha (203-acre) site in the southwest portion of INEL. The ICPP processeshigh-level liquid radioactive waste generated at the facility and that generated from other INELactivities. These wastes, which are generated primarily by the processing of SNF anddecontamination operations, are concentrated by evaporation and converted to a solid in the NWCF.The waste at INEL has two main forms: acidic liquid and solid calcine.
3.5.2 Descriptions and Environmental Releases
Existing HLW facilities include the HLW tank farm (Tanks WL-101, WM-100 throughWM-102 and WM-180 through WM-190), CSSFs (CPP 729,742,746,760,765,791, and 795), andthe NWCF (CPP-659), which are all located at the ICPP site (Figure 3.6).
Two types of liquid HLW generated at INEL are fluorinel and sodium-containing waste.Fluorinel waste is generated during SNF reprocessing; sodium-containing waste is primarilyproduced during solvent cleanup and from decontamination waste streams. The sodium-containingwaste, although not generated by reprocessing of SNF, is managed the same way as is HLW becauseof site practice. Decontamination wastes and process condensates are evaporated prior to tank farmstorage. In general, about 70-90% of the liquid HLW at INEL is fluorinel waste (Bolon and Nelson1992). The acidic, liquid HLW contains aluminum nitrate, zirconium fluoride, and sodium-containing wastes. Current practice is to blend sodium-containing waste with fluorinel waste priorto calcination. As of 1994, the inventory of calcine at INEL is approximately 3,800 m3 (134,000 ft3);7,200 m3 (1.9 million gal) of liquid HLW remain. The calcine (at the end of 1994) accounted forabout 50 million Ci with the remaining acidic, liquid portion of the waste representing the majorityof the initial volume but a minority of the initial radioactivity (about 2 million Ci). The fluorinel-sodium calcine is expected to be the most prevalent composition at the ICPP. Table 3.22 gives thecompositions of the fluorinel-sodium high-level liquid waste and calcine (Berreth and Knecht 1987).

77
INEL Major Facility Areas
NORTH
'26\ To BlacWoot64 km (40 mi)*
'Miles from Central Facilities Area
Legend:
ARAANL-WCFAEBR-1ICPPNRFPBFRWMCTANTRA
Auxiliary Reactor AreaArgonne National Laboratory-WestCentral Facilities AreaExperimental Breeder Reactor • IIdaho Chemical Processing PlantNaval Reactors FacilityPower Burst FacilityRadioactive Waste Management ComplexTest Area NorthTest Reactor Area
Miles 0 2 4 6 8
Kilometers 0 4 8 12
FIGURE 3.6 Map of the Idaho National Engineering Laboratory(Source: DOE 1993d)

78
TABLE 3.22 Major Components of ICPP High-Level Wastes
Sodium-Bearing Liquid
Component
Fluoride (F)
Nitrate (NO3")
Zirconium (Zr44)
Aluminum (Al+3)
Cadmium (Cd+2)
Boron (B+3)
Sodium (Na+)
Potassium (K+)
Chloride (Cl")
Sulfate (SO^
Density (kg/m3)
Waste
Molesperm3
64
4,700
6.4
540
1.9
16
1,300
150
23
33
1,240
Calcined
Aluminum(kg per m3)
45
-
530-
2
25
-
-
13
1,100
High-Level Waste
Zirconium Mix(kg per m3)
360
68
230
140
8.1
14
34
7.4—
4.7
1,600
Note: — = not present in significant quantity.
Source: WINCO (1994).
The ICPP tank farm has been storing liquid HLW since 1953; the newest tank was placedin service in 1964. The ICPP tank farm consists of eleven 1,140-m3 (300,000-gal) stainless steeltanks housed in underground concrete vaults (WM-180 through WM-190); one tank (WM-190) iskept empty for use as a spare should a leak occur in one of the other 10 tanks. The 1,140-m(300,000-gal) tanks are 18.9 m (62 ft) in diameter and 4.1 m (13.5 ft) in height; the top of the vaultis a minimum of 3 m (10 ft) below grade. The vault structure is founded 16 m (52.5 ft) belowground level on bedrock, with a 4.3 m (14 ft) separation between vaults (Uldrich and Malik 1991).Additional storage capacity is available from four 69.6-m3 (18,400-gal) tanks resting on concretepads with curbing (WL-101 and WM-100 through WM-102). These tanks are generally kept emptyand may be used for waste storage only with prior approval by DOE-IDO. Tank farm activitiesinclude continuous level, density, temperature, and pressure monitoring; transfer operations; tankoff-gas system operation; tank cooling; and periodic corrosion monitoring tests. Each tank and vaultis separately monitored to detect any possible leak; none of the storage tanks has ever leaked.Table 3.23 gives the design characteristics of the underground HLW tanks.
HLW calcine is stored in stainless steel underground bins called calcine solids storagefacilities (CSSFs) also located at the ICPP site. The CSSFs are designed to provide interim storage

79
TABLE 3.23 Current HLW Storage at INEL
Waste Storage Type Liquid HLW Storage TanksaCalcine Solids Storage
Facilities
Storage method
Unit capacity
On-site unit number
Number of units
Percent capacity rilled
Dimensions/surfacearea of unit
Distance below/aboveground
Underground stainless steeltanks in concrete vault
= 1,136 m3
WM-180 through WM-190
10 filled with 1 empty, usedas spare
80%
Tank diameter: 18.9 mTank height: 4.1 mSurface area: =805 m2
Top of vault is minimum of3 m below grade.
Reinforced-concretevaults containing 3 to7 stainless steel bins
» 1,785 m3
CPP 729, 742, 746,760,765,791,and 795
7
CSSF 1 to 5 full, CSSF 6 and7 currently being filled
Vault diameter: 18 mVault height: 32 mSurface area: =2,320 m2
Variable; nominal designis between 6.1 to 9.1 mabove ground.
a Tanks WL-101 and WM-100 to WM-102 are not included because of low percentage ofutilization.
Sources: IDO (1982); Berreth (1988); Wheeler et al. (1986).
(up to 500 years) for the calcined solids and consist of vertical stainless steel bins that are housedin reinforced concrete vaults anchored on bedrock. Each vault contains from three to seven stainlesssteel storage bins bolted to the vault floor, with the top of the vault projecting above grade. The vaultwalls and roof provide required radiation shielding as well as structural support. The bins and thevaults provide the primary and secondary containment, respectively, for the calcined solids. The heatgeneration from the radionuclides in the solid calcine is removed from the calcine bins by naturalconvection; the maximum storage temperature is 600°C (1,122°F). A representative vault is 18 m(59 ft) in diameter and 32 m (105 ft) tall. Five calcined solids storage facilities are currently filledat the ICPP, with a sixth still receiving calcine and a seventh ready to receive calcine. Table 3.23gives the design characteristics of the calcine storage facilities.
Public information on the radionuclide content of INEL's high-level liquid waste isgenerally unavailable. However, radionuclide content data for a repository canister containingimmobilized three-year-old calcine are available (Table 2.11 [ORNL 1992a]). Although, in general,the feed calcine to the Idaho Waste Immobilization Facility (IWIF) may be older than three years,

80
this appears to be the only publicly available information. Calcines older than three years would havea lower activity so that the radionuclide composition given in Table 2.11 (ORNL 1992a) for arepository canister containing 2,725 kg of calcine can be considered to represent the maximumactivity. Assuming that the amount lost (from atmospheric emissions, etc.) of a given radionuclideis negligible, so that most of the radionuclide in the liquid HLW will be immobilized, the"representative" liquid HLW composition (shown in Table 3.24) can be calculated from the volumeof the current liquid HLW inventory (2.3 x 10 gal) through the use of the following equation fornonvolatile radionuclides (i.e., other than H-3, C-14, and 1-129):
[Liquid HLW composition (Ci)] = [Canister radioactivity (Ci/canister)]/ (3.3)(2.725 x 10⁶ g/canister calcine) x (1.4 g/cm3 calcine)/f(6.,3985 cm3 liquid HLW/cm3 calcine)
x (3,785.4 cm3/gal) x (2.3 x 10⁶ gal liquid HLW).
Elements such as H-3, C-14, and 1-129 volatilize completely before the immobilizationprocess and thus will not appear in the canister contents. Their composition was determined byassuming that these elements are completely emitted during primary pretreatment, and that theiremission rate from the NWCF is proportional to the product of their liquid HLW concentration andits calculated release fraction during primary pretreatment:
[Liquid HLW composition (Ci)] = ([Emission from primary pretreatment (Ci/yr)]/ (3.4)[Component release fraction])/([Sr-90 Emission from primary pretreatment (Ci/yr)]/
[Sr-90 Release fraction]) x [Sr-90 in liquid HLW (Ci)],
where
Component release fraction = 1.0 (for H-3, C-14,1-129),Sr-90 release fraction = 1.805 x 10"11,Component emission from primary pretreatment (Ci/yr) = 1.1 x 10"10 for nonvolatiles,Component emission from primary pretreatment (Ci/yr) = 3.9 x 10 for semivolatiles,Sr-90 emission from primary pretreatment (Ci/yr) = 2.09 x 10'4, andSr-90 in liquid HLW (Ci) = 2.4754 x 10⁷.
Strontium-90 is used as the reference radionuclide; other radionuclides used fromTable 3.24 gave similar results. Comparison of the values in Table 3.24 with a limited set ofradionuclides in Schindler (1991) showed order-of-magnitude agreement.
Off-gases are generated during venting of the liquid HLW storage tanks. The annual releaseof radionuclides during current liquid HLW storage at INEL is calculated on the basis of the currentliquid HLW inventory (2.3 x 10⁶ gal), the assumption that 1% per year of the liquid becomesairborne into the ventilating system air stream (DOE 1982b), and a DF of 5 x 10⁸. The DF is based
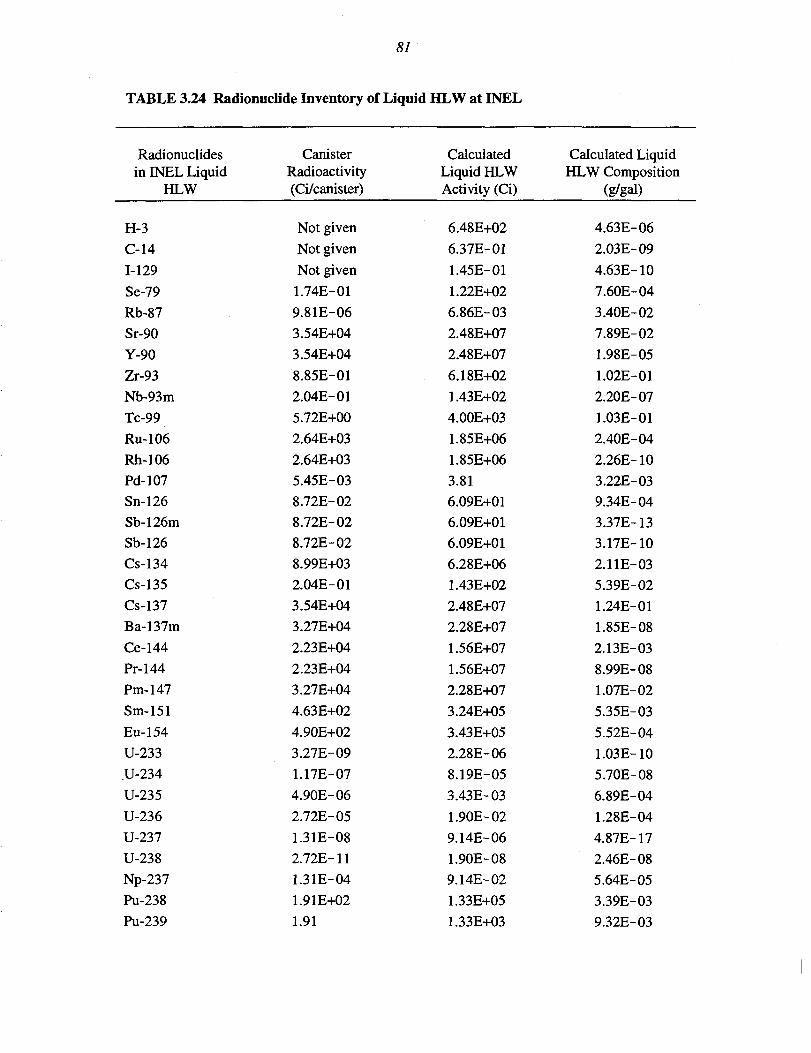
81
TABLE 3.24 Radionuclide Inventory of Liquid HLW at INEL
Radionuclidesin ENEL Liquid
HLW
H-3
C-141-129Se-79Rb-87Sr-90Y-90Zr-93Nb-93mTc-99Ru-106Rh-106Pd-107Sn-126Sb-126mSb-126Cs-134Cs-135Cs-137Ba-137mCe-144Pr-144Pm-147Sm-151Eu-154U-233U-234U-235U-236U-237U-238Np-237Pu-238Pu-239
CanisterRadioactivity(Ci/canister)
Not givenNot givenNot given1.74E-019.81E-063.54E+043.54E+048.85E-012.04E-015.72E+002.64E+032.64E+035.45E-038.72E-028.72E-028.72E-028.99E+032.04E-013.54E+043.27E+042.23E+042.23E+043.27E+044.63E+024.90E+023.27E-091.17E-074.90E-062.72E-051.31E-082.72E-111.3 IE-041.91E+021.91
CalculatedLiquid HLWActivity (Ci)
6.48E+026.37E-011.45E-011.22E+026.86E-032.48E+072.48E+076.18E+021.43E+024.00E+031.85E+061.85E+063.816.09E+016.09E+016.09E+016.28E+061.43E+022.48E+072.28E+071.56E+071.56E+072.28E+073.24E+053.43E+052.28E-068.19E-053.43E-031.90E-029.14E-061.90E-089.14E-021.33E+051.33E+03
Calculated LiquidHLW Composition
(g/gal)
4.63E-062.03E-094.63E-107.60E-043.40E-027.89E-021.98E-051.02E-012.20E-071.03E-012.40E-042.26E-103.22E-039.34E-043.37E-133.17E-102.11E-035.39E-021.24E-011.85E-082.13E-038.99E-O81.07E-025.35E-O35.52E-041.03E-105.70E-086.89E-041.28E-044.87E-172.46E-085.64E-053.39E-039.32E-03

82
TABLE 3.24 (Cont.)
Radionuclidesin INEL Liquid
HLW
Pu-240Pu-241Pu-242Am-241Am-243Cm-242Cm-244
CanisterRadioactivity(Ci/canister)
1.774.36E+024.90E-032.482.26E-021.771.42
CalculatedLiquid HLWActivity (Ci)
1.24E+033.05E+053.431.73E+031.58E+O11.24E+039.90E+02
Calculated LiquidHLW Composition
(g/gal)
2.36E-031.29E-033.90E-042.19E-043.45E-051.63E-075.32E-06
on the current practice of passing the liquid HLW tank-farm emissions at the ICPP through a misteliminator, a heater, one bank of HEP A filters, a second heater, and a second bank of HEPA filters.The overall release fraction is thus 2 x 10"11. The emission rate during current storage is calculatedby using the following formula:
[Emission rate (Ci/yr)] = [Species "i" in liquid HLW (Ci)] x [Release fraction]. (3.5)
It is assumed that negligible emissions would occur during calcine storage because of thecalcine's stable (i.e., nonvolatile at ambient conditions), solid form and the absence of venting withinthe CSSF.
Nonradiological atmospheric emissions during current storage can be calculated on thebasis of similar assumptions for radiological emissions; approximately 5.9 x 10'8 tons of NOV and6 x 10 tons of sulfur dioxide (SO2) are emitted annually.
The CPP-708 Main Stack is the common release point for off-gases from the liquid HLWtank farm vessels, the NWCF, and other ICPP operations. Stack characteristics are given inTable 3.25 (State of Idaho 1989). The projected height of the INEL Waste Immobilization Facility(60 ft) was used to determine the value of the height above surrounding structures. The exit flow ratewas calculated on the basis of the stack's other parameters.
Worker dose rates and labor requirements for current storage were estimated as follows.The number of exposed workers was determined on the basis of SRS experience (i.e., 21 workersfor surveillance and monitoring of 25 liquid HLW tanks [DOE 1979]) and scaled by the number ofHLW storage tanks at INEL; this resulted in a total of nine workers for liquid HLW storage and sixworkers for calcine storage. The worker dose rate for current storage of liquid HLW is based on SRS
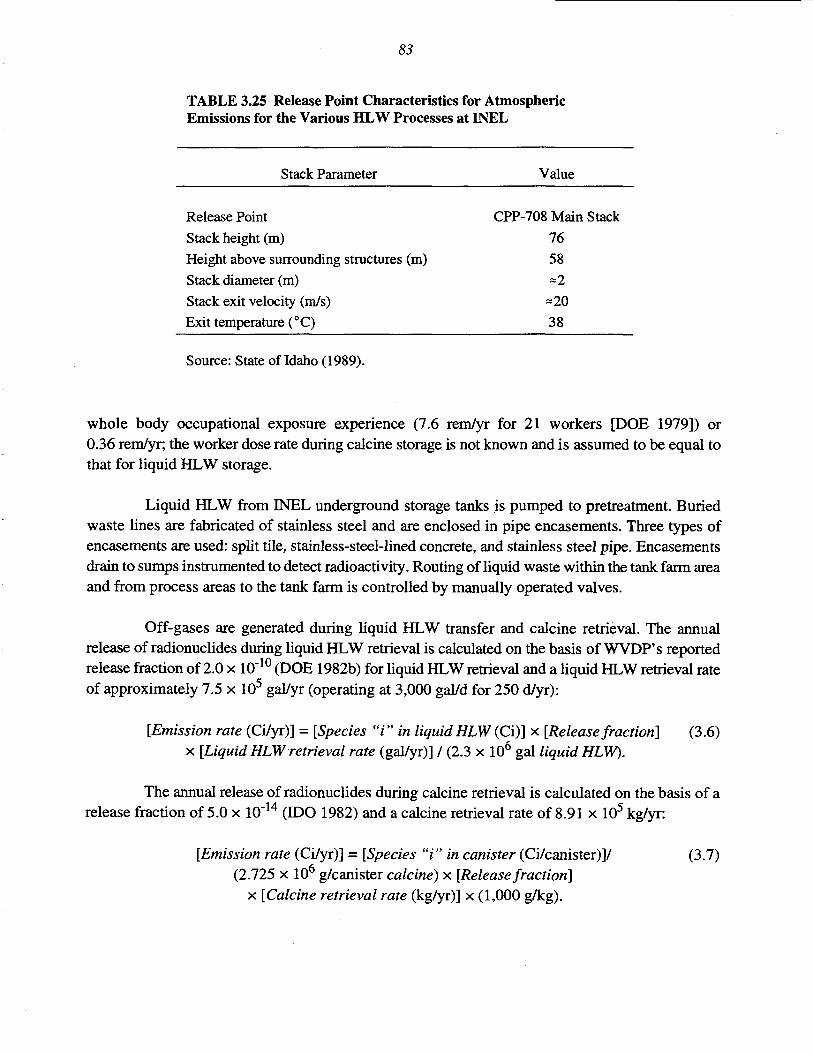
83
TABLE 3.25 Release Point Characteristics for AtmosphericEmissions for the Various HLW Processes at DSfEL
Stack Parameter
Release PointStack height (m)Height above surrounding structures (m)Stack diameter (m)Stack exit velocity (m/s)Exit temperature (°C)
Value
CPP-708 Main Stack7658=2=2038
Source: State of Idaho (1989).
whole body occupational exposure experience (7.6 rem/yr for 21 workers [DOE 1979]) or0.36 rem/yr; the worker dose rate during calcine storage is not known and is assumed to be equal tothat for liquid HLW storage.
Liquid HLW from INEL underground storage tanks is pumped to pretreatment. Buriedwaste lines are fabricated of stainless steel and are enclosed in pipe encasements. Three types ofencasements are used: split tile, stainless-steel-lined concrete, and stainless steel pipe. Encasementsdrain to sumps instrumented to detect radioactivity. Routing of liquid waste within the tank farm areaand from process areas to the tank farm is controlled by manually operated valves.
Off-gases are generated during liquid HLW transfer and calcine retrieval. The annualrelease of radionuclides during liquid HLW retrieval is calculated on the basis of WVDP's reportedrelease fraction of 2.0 x 10"10 (DOE 1982b) for liquid HLW retrieval and a liquid HLW retrieval rateof approximately 7.5 x 10⁵ gal/yr (operating at 3,000 gal/d for 250 d/yr):
[Emission rate (Ci/yr)] = {Species "i" in liquid HLW (Ci)] x [Release fraction] (3.6)x [Liquid HLW retrieval rate (gal/yr)] / (2.3 x 10⁶ gal liquid HLW).
The annual release of radionuclides during calcine retrieval is calculated on the basis of arelease fraction of 5.0 x 10"14 (IDO 1982) and a calcine retrieval rate of 8.91 x 10⁵ kg/yr:
[Emission rate (Ci/yr)] = [Species "i" in canister (Ci/canister)]/ (3.7)(2.725 x 10⁶ g/canister calcine) x [Release fraction]
x [Calcine retrieval rate (kg/yr)] x (1,000 g/kg).

84
Labor requirements for liquid HLW transfer were estimated on the basis of WVDPexperience (five workers to transfer 2 x 10 L over three years) and scaled by the operating capacityof the NWCF (3,000 gal/d), assuming 250 operating d/yr; the number of exposed personnel is 21.The number of personnel for calcine retrieval was estimated by assuming four worker-shifts perweek; one worker per shift is required for each of the following activities: (1) controlling the locationof the retrieval nozzle within the calcine bin; (2) monitoring the discharge of calcine from thecyclone separator into the receiver, (3) monitoring the operation of the suction pump(s) to ensureproper calcine transport (correct pressure drop to prevent particle saltation) to the vitrificationfacility, and (4) monitoring the discharge from the off-gas treatment system. The number of exposedpersonnel during calcine retrieval is assumed to be 16. Two worker dose rate values have been foundin the literature for liquid HLW transfer: the higher worker dose rate of 0.65 rem/yr is taken fromDOE (1982a). This rate was developed on the basis of experience at the Hanford tank farms; thelower value of 0.42 rem/yr is from historic SRS data (DOE 1979). The higher value is used here forconservatism. The worker dose rate for calcine retrieval is assumed to equal that for liquid HLW(0.65 rem/yr).
Liquid HLW in acidic solution is stored in stainless steel tanks that may not meet allseismic regulations and do not have a secondary containment system that is acid resistant. The IdahoOperations Office entered into a consent order in April 1992 to resolve secondary containmentissues. This consent order requires continued calcination, thus reducing waste volume and resultingin a material that is much easier to handle and store. The acidic, liquid HLW is calcined to form adry granular solid. Calcination is desirable because the solid calcine is less corrosive than theoriginal liquid waste, consumes approximately one-seventh to one-eighth of the original liquid wastevolume, and is chemically and physically more stable than the radioactive liquids.
Without calcination, the ICPP tank farm would have filled to capacity, precludinggeneration of waste from reprocessing or future decontamination and decommissioning programs.Since startup of the original WCF, 26,000 m3 (6.9 million gal) of liquid HLW has been convertedto 3,600 m3 (127,000 ft3) of solid calcine. The ICPP was the first plant in the world to usecalcination for converting highly radioactive liquid waste into a radioactive solid waste. The NWCFstarted operation in September 1982 and has a design throughput of 11.4 m3 (3,000 gal) per day. Thebuilding is a concrete and steel structure approximately 76 m (250 ft) long by 38 m (125 ft) wide by23 m (75 ft) high; half of the structure is located below grade (Waite 1989). The processingequipment is located below grade and is divided by subsystem into isolated cells separated byconcrete shielding walls. The principal cell areas of the NWCF are the blend and hold cell (calcinerfeed preparation), the calciner cell (calciner and associated equipment), the off-gas cell (cooling ofoff-gas and removal of solids), the filter cell (containing HEPA filtration units), and the adsorber cell(containing absorber cells for ruthenium removal).
Additional cells hold valves, sampling equipment, and other equipment. An attacheddecontamination facility is located in the west side of the NWCF building. The NWCF is designed

85
as a Category 1 facility (DOE 1989b; Kennedy et al. 1990). Table 3.26 summarizes the relevanttechnical information.
The NWCF uses a fluidized bed calcining process that is operated at 500°C (932°F) byinternal combustion of kerosene. The initial fluidized bed material is a dolomite rock (calciummagnesium carbonate) with a particle size between 0.3 and 0.6 mm (0.012 to 0.024 in.). Calcium isadded in a 10-to-40-mol% excess to react with the fluoride in the liquid HLW to form an inertcalcium fluoride (CaF2). Compressed air is used to atomize the acidic HLW, which is then sprayedinto the fluidized bed. The moisture in the HLW evaporates and leaves the residual radioactive solidsto deposit on the fluidized bed material. The calcined solids are pneumatically transferred from theNWCF to the nearby CSSFs.
The resulting HLW calcine is stored in stainless steel underground bins (CSSFs) alsolocated at the ICPP site. The CSSFs are designed to provide interim storage (up to 500 years) for thecalcined solids and consist of vertical stainless steel bins that are housed in reinforced concrete vaultsanchored on bedrock. Each vault contains from three to seven stainless steel storage bins bolted tothe vault floor. The bins and the vaults provide the primary and secondary containment, respectively,for the calcined solids. The heat generation from the radionuclides in the solid calcine is removedfrom the calcine bins by natural convection; the maximum storage temperature is 600 °C (1,112°F).A representative vault is 18 m (59 ft) in diameter and 32 m (105 ft) tall. The ICPP currently hasseven CSSFs; six have been filled. Table 3.23 gives the design characteristics.
3.5.3 Current Status
The latest NWCF campaign went from December 1990 through 1993. Approximately570 m (150,000 gal) of waste was calcined during the campaign. By court order (U.S. District Court[USDC] 1993), DOE is required to calcine all high-level liquid radioactive waste that does notcontain sodium on or before January 1,1998. In addition, this court order requires that DOE calcineor otherwise process as much sodium-containing high-level liquid radioactive waste (sodium liquidwaste) as DOE and the State of Idaho mutually agree is practicable by January 1,1998. Therefore,it is not possible to determine the exact schedule for NWCF operations at this time.
An amended Notice of Noncompliance Consent Order was issued to DOE in March 1994by the Idaho Department of Health and Welfare. The Order included provisions for proposing wastetreatment technologies and deadlines for removing liquid waste from specific tanks.
The Record of Decision (May 30, 1995) for the Final Programmatic Spent Nuclear FuelManagement and Idaho National Engineering Laboratory Environmental Restoration and WasteManagement Programs Environmental Impact Statement (DOE 1995c) indicated DOE's decisionto construct a facility to treat the calcined HLW and remaining liquid waste, and selected the

86
TABLE 3.26 New Waste Calcining Facility at INEL
Building features Seismic- and tornado-resistant concretestructure; decontamination facilityattached to west side; process equipmentlocated below grade with the above-gradeportion primarily being a clean area.
Number of stories in NWCF building
Shielding for operating personnel
Building dimensions8
Length (m)
Width (m)
Height (m)
Approximate footprint (m2)
Total land requirement (m2)
4a
1.2-mthicka
76
38
23
=2,800
8,000-12,000b
Resource Commitments during Operations
Electricity (kW) 500-2,000
Calcium magnesium carbonate (t/yr) =450
Fuel oil (nvVyr) 570-1,900
a Includes two subgrade floors and two above-grade floors (Waite 1989).b Includes NWCF and CSSFs (Idaho Nuclear Corporation [INC] 1974).
Source: INC (1974).
technology for potential use in a treatment facility. The technology selected is radionuclidepartitioning for radioactive liquid and calcine waste treatment, grout for immobilizing the resultinglow-activity waste stream, and vitrification for immobilizing the resulting high-activity waste stream.The Record of Decision also stated that two INEL projects related to HLW management would beimplemented in the future: the Tank Farm Heel Removal Project, and the Calcine Transfer Project.
3.6 IDAHO NATIONAL ENGINEERING LABORATORY: PLANNED FACILITIES
Five of the liquid HLW tanks must cease operations by March 2009, with the remainingsix tanks by June 2015. The Tank Farm Heel Removal Project would provide for the design,

87
construction, and operation of equipment to perform tank internal rinsing and removal of the 5,000-to-20,000 gallon heel (liquid and solids remaining when the tanks have been emptied using existingtransfer equipment) from the eleven 300,000 gallon storage tanks at the ICPP. Further informationconcerning the proposed Tank Farm Heel Removal Project is described in DOE (1995f).
A mobile calcine retrieval system has not yet been designed to remove the calcine from thestorage bins and transfer it for treatment. A demonstration project has been scheduled to proveretrieval methods for extracting calcine from bin sets (DOE 1995f). Calcine retrieval is assumed tobe accomplished by vacuuming the calcine particles from the bins, followed by transport by apneumatic conveyor to the vitrification facility. Further information concerning the proposed CalcineTransfer Project for bin set #1 is described in DOE (1995f).
Of the four DOE sites containing HLW, INEL HLW will be processed last because it is ina fairly stable solid form. The schedule for construction of a facility to treat the calcined HLW (andany remaining liquid waste) at the INEL is to be negotiated between DOE and the State of Idahounder the Federal Facility Compliance Act. However, in this analysis, it is assumed that physicalconstruction of the Idaho WIF is to begin in FY 2005, with hot operation commencing in FY 2015(WINCO 1994).
The facility design adopted for the Idaho WIF is based on the vitrification design providedin DOE (1995f). The IWIF would incorporate totally remote O&M of all chemical and mechanicalprocesses that handle any radioactive materials or are conducted in a radioactive environment. Theprincipal operating facility is the immobilization building, which is designed as a reinforced-concreteshielded facility approximately 110 m (360 ft) long, 36 m (120 ft) wide, and 45 m (150 ft) in height.This structure contains the separations process used to partition the incoming HLW into high- andlow-activity fractions (and, if necessary, to remove heavy metals from the low-activity stream), andthe vitrification unit and associated operations for solidifying the high-level radioactive wastesupplied from either the CSSFs or the NWCF. The principal cell areas are the vitrification cell(containing vitrification melter and feed mix tanks), the maintenance cell, the separation cell, thecanister decontamination cell, and the off-gas processing cell.
The Idaho WIF is assumed to be designed as a Category 1 facility (DOE 1989b; Kennedyet al. 1990). Table 3.27 summarizes information on the dimensions of the HLW immobilizationbuilding and construction, electric energy, and other process requirements.
Treatment of the calcine to a form suitable for permanent disposal in a geologic repositoryis assumed in this analysis to begin in FY 2015 (DOE 1995c). Treatment by vitrification is assumedin this analysis. The calcine would first be dissolved to allow separation of the radioactive liquid andcalcine waste into low-activity waste and high-activity streams (Figure 3.7). The resulting high-activity waste stream would then be immobilized using vitrification. In the vitrification process, the

Airborne AirborneReleases Releases
AirborneReleases
88
AirborneReleases
AirborneReleases
Disposal
Current Storage Pretreatment
FIGURE 3.7 Flow Diagram for the Idaho Waste Immobilization Facility (Source:Adapted from DOE 1995f)
dissolved calcine would be slurried with glass-forming sands of varying composition (frit) andintroduced to the vitrification melter. The calcine would first have to be thoroughly mixed with thefrit to obtain a homogeneous melter feed and might have to be stabilized and ground to improve themelter operation efficiency. The molten glass mixture from the vitrification melter would be castdirectly into canisters, and then cooled.
The method of interim storage at INEL has not been determined, but dry storage in modularvaults is assumed in this analysis. The facility would hold canisters in vertically sealed cavitieswithin a concrete structure forming the storage vault. Table 3.28 summarizes estimated facilitycharacteristics for the INEL glass canister storage building on the basis of a storage capacity of1,700 canisters and a maximum loading rate of 81 canisters per year.
Annual releases of radionuclides, under normal operations, would be limited to those fromcanister surface contamination. Surface contamination levels may be expected to be less than370 Bq/m for alpha contaminants and less than 3,700 Bq/m for beta-gamma contaminants (Gurleyand Minor 1985), assuming that INEL's HLW canisters will undergo the same level ofdecontamination as at HWVP. Given the canister dimensions in Table 1.1, the amount of alphacontaminants adhering to a single canister is approximately 1 x 10"7 Ci, with about 1 x 10 Ci ofbeta-gamma contaminants. It is therefore expected that radiological atmospheric emissions will benegligible.

89
TABLE 3.27 Resource Requirements for HLW Immobilization at INEL
Conceptual Waste Immobilization Facility
Assumed number of stories in building 3 a
Exterior walls Reinforced-concrete, masonry unit construction
Shielding for operating personnel 1.2 m thick
Approximate building dimensions
Length (m) 110c
Width (m) 36C
Height (m) 45d
Approximate footprint (m ) 4,000e
Electrical energy consumed annually (GWh/yr) 40e
Annual water usage (liter/yr) 150 millione
Approximate Construction Requirements
Peak construction manpower (person) 300e
Concrete (m3) 32,000
Reinforcing steel (t)f 3,800
Structural steel (t)g 1,700
Water (liter) 11.5 million6
a IDO (1982) states that the waste immobilization facility will be a two- to three-story reinforced-concrete-mat-foundation structure; the three-story structure was chosen here because of the inclusion of the calcinestabilization process.
b Adapted from Grantham et al. (1983).c A three-to-one aspect ratio assumed.
d Building height taken to equal that for the conceptual Hanford High-Level Waste Vitrification Facility (DOE1996a).
e Adapted from DOE (1995c).f Amount of reinforcing steel taken to be the average value for a BWR power plant (120 kg/m3 of concrete)
(United Engineers & Constructors, Inc. 1977; Ball et al. 1984).g Amount of structural steel taken to be the average value for a BWR power plant (54 kg/m3 of concrete)
(United Engineers & Constructors, Inc. 1977; Ball et al. 1984).

90
ro SPRiHCvn.Lt(s H
WNYNSC BOUNOARY
PROJECT SITE BOUNOARY
2 KILOMETERS
APPRO*. S O L E
FIGURE 3.8 Map of the West Valley Demonstration Project(Source: WVDP 1991)

91
TABLE 3.28 Facility Characteristics for the Glass Canister Storage Building at INEL
Construction
Parameter
Water (m3)Concrete (m3)Steel (t)
Occupied land (ha)
Disturbed land (ha)
Peak (persons)
Total effort (worker-yr)
Construction duration(months)
Capital cost ($ million)
Hazardous
Sewage
Fugitive Dust (t)
NOX (t)
SOx(t)
Quantity
Operations
Parameter
Resource Requirements
8,00019,00031,000
Water (m3/yr)LoadingStorage
Electricity (GWh/yr)LoadingStorage
Land Requirements
0.38
0.68
310
39
45
=36
Number of floors
Facility size (m2)
Employment
Storage (FTEa)
Loading (FTE)
Support (FTE)
Costs
Loading O&M ($ million/yr)
Storage O&M ($ million/yr)
Secondary Waste Streams
Negligible
Negligible
24
4.3
0.3
Contact-handled LLW: loading(m3/yr)
Contact-handled LLW: storage(m3/yr)
Air Emissions
Radiological
Hazardous
Potential pollutant
Quantity
1,1001.9
0.3Negligible
1
3,800
8
21
16
5.6
0.5
190
150
Negligible
Negligible
Negligible
Full-time equivalent.

92
3.7 WEST VALLEY DEMONSTRATION PROJECT: EXISTING FACILITIES
3.7.1 History
The WVDP is being undertaken at the Western New York Nuclear Services Center(WNYNSC) near West Valley, New York (Figure 3.8), in order to conduct a HLW managementoperation of immobilizing the 2,500 m3 (660,000 gal) of HLW which was stored on-site. The onlycommercial nuclear fuel reprocessing facility in the United States operated at West Valley from 1966to 1972. The facility was shut down in 1972 to expand its capacity. However, increasing state andfederal regulations made the required investment more costly than planned, and the operator decidedto close the facility in 1976 (Borisch et al. 1988). In 1980, the West Valley Demonstration ProjectAct (Public Law 96-368) was enacted to demonstrate solidification that can be used to prepare HLWfor disposal. This act authorized DOE to conduct a nuclear waste management project at West Valleythat includes waste minimization, reduction, treatment, and storage. The DOE assumed control ofthe West Valley project premises in February 1982.
3.7.2 Facility Descriptions and Environmental Releases
Existing HLW facilities include the Vitrification Facility Building, adjacent glass canisterstorage area in the CPC, Integrated Radwaste Treatment System (IRTS), Sludge Mobilization andWash System (SMWS), and a tank farm consisting of four tanks.
Most of the HLW stored at West Valley is alkaline waste that was produced in the PUREXreprocessing of low-burnup commercial and Hanford N-Reactor spent fuel. Prior to the initiation ofpretreatment, the HLW inventory in storage at WVDP was 2,270 m3 (600,000 gal) of alkalinePUREX waste and 45 m3 (12,000 gal) of acidic THOREX waste. Ninety percent by volume of thealkaline waste was in the supernatant liquid form; the remaining 10% was in a sludge form at thebottom of the tank (Mclntosh et al. 1992). The acidic waste can be considered to be a single-phasesolution (ORNL 1992b).
The current HLW inventory of 2,180 m consists of 2,040 m of liquid alkaline sludge and140 m of solid waste composed of alkaline sludge and inorganic zeolite ion-exchange materialcontaminated with cesium. Alkaline waste was stored in an underground carbon-steel tank (8D-2)in the form of a supernatant alkaline liquid containing Cs-137 and an alkaline sludge containingSr-90. Tank 8D-2 resides in a tank farm consisting of four tanks enclosed in three undergroundconcrete vaults (Tanks 8D-3 and 8D-4 are contained in the same vault). Tank 8D-1 is identical to8D-2 and contains loaded zeolite; Tank 8D-1 has a capacity of 2,800 m (740,000 gal), an outerdiameter of 21 m (70 ft), a height of 8.2 m (27 ft), and is located about 2.4-2.7 m (8-9 ft) belowgrade. Tank 8D-4 is constructed of stainless steel and contains the acidic THOREX waste; it has a

93
capacity of 57 m3 (15,000 gal), an outer diameter of 3.7 m (12 ft), a height of 4.8 m (15.75 ft), andis located about 1.8 m (6 ft) below grade. Tank 8D-3 is identical to 8D-4 and serves as its backup.Table 3.29 gives the design characteristics of the various HLW tanks.
To estimate atmospheric releases from current storage, it is assumed that 1% of liquidTHOREX waste becomes airborne annually by evaporation into the ventilation system air stream.The ventilation system is assumed to have an overall DF of 5 x 10⁸ for all species except tritium;it is further assumed that the off-gas system is ineffective in removing tritium and gaseous organicchemicals from the tank off-gas stream (DOE 1982b). This assumption results in a release fractionof 2 x 10'!1/yr for gases and 1 x 10"2/yr for tritium. Table 3.30 gives the mass amounts of variouscompounds in the THOREX liquid waste, and Table 3.31 gives the waste's radionuclide compositionas of the end of 1989 (ORNL 1992a). The emission rate for species i during current storage is givenby the following equation:
[Emission rate (Ci/yr)]CT = [Species "i" activity (Ci)] x [Releasefraction (yr'1)]. (3.8)
TABLE 3.29 Current HLW Storage at WVDP
Waste Type
Storage method
Unit capacity
Number of units
Percent capacityfilled*
Surface area ofunit
Location oninstallation
Distance belowgrade
Alkaline Sludge
Underground carbon-steel tank in concretevault
2,800 m3
1
=3%
Diameter: 21.3 mHeight: 8.2 mSurface area: =1,260 m2
North end of installation
Top is minimum of 2.4 mbelow grade.
Acidic Liquid
Underground stainlesssteel tank in concretevault
57 m3
1
=82%
Diameter: 3.7 mHeight: 4.8 mSurface area: -77 m
North end of installation
Top is minimum of 2.4 mbelow grade.
Cesium-Load Zeolites
Underground carbon-steel tank in concretevault
2,800 m3
1
=3%
Diameter: 21.3 mHeight: 8.2 mSurface area:* 1,260 m2
North end ofinstallation
Top is minimum of2.4 m below grade.
a It is assumed that all the alkaline sludge has been washed, that washing reduced its volume by 61 % to89 m3, and that the washed sludge has been returned to Tank 8D-2.
Sources: Ploetz and Leonard (1988); DOE (1982b).

94
TABLE 3.30 Mass Amounts of Various Compounds in theTHOREX Liquid Waste at WVDP
Compound
AgNO3
A12O3
B2O3
BaO
CaO
CoO
Cr2O3
Cs2O
CuO
FeO
HNO3
KMnO4
KNO3
La2O3
MgO
Na2MoO4
Na2SO4
Mass (kg)
8.0E-02
1.0E+03
2.7E+02
1.6E+01
1.0E+01
1.2
6.1E+02
2.0E+01
3.0E-01
2.5E+03
2.8E+03
9.8E+02
1.9E+02
1.1E+01
1.6E+01
5.4E+01
1.8E+02
Compound
N a 2 SiO 3
Na3PO4
NaCl
NaF
NaNO3
NaTcO4
NiO
Pd(NO3)2
PuO2
RhO2
RuO2
SrO
ThO2
UO2(COOH)2
Y2O3
ZnO
ZrO2
Mass (kg)
1.3E+02
1.2E+01
5.0E+01
1.0
2.3E+02
1.1E+01
2.4E+01
8.0
4.0E-01
5.1
1.6E+01
7.8
1.7E+04
4.6
5.7
4.3
4.4
Source: ORNL (1992b).
Table 3.32 gives information on the stack release from the current storage facility (andtransfer operations) on the basis of WVDP's permit application (WVDP 1992).
To estimate atmospheric releases during transfer, it was assumed that 10% of the liquidTHOREX waste becomes airborne via evaporation and is released from the current storage facility'sventilation system with a DF of 5 x 10⁴. It was also assumed that the overall DF for the currentstorage facility and its stack filtration system is 1 x 10⁴ (DOE 1982b), which yields a release fractionof 2 x 10' for gases and 1 x 10'1 for tritium. Assuming three years of HLW retrieval and the aboverelease fractions, the annual release of radionuclides during HLW transfer is given by the followingequation:
[Emission rate (Ci/yr)]rf = [Species "i" activity (Ci)] x [Release fraction] 13. (3.9)

95
TABLE 3.31 Radionuclide Composition of THOREX Liquid HLW at WVDPas of the End of 1989
Radionuclide
H-3
C-14Fe-55Co-60Ni-59Ni-63Se-79Sr-90Y-90Zr-93Nb-93mTc-99Ru-106Rh-106Pd-107Cd-113mSn-121mSn-126Sb-125Sb-126Sb-126mTe-125m1-129Cs-134Cs-135Cs-137Ba-137mCe-144Pr-144Pm-146Pm-147
Ci
1.5
1.3E-012.5E+027.7E+022.0E+012.4E+033.4
4.2E+054.2E+051.6E+011.1E+011.0E+028.0E-028.0E-021.1E-013.2E+015.8E-013.1
1.4E+024.4E-013.1
3.3E+011.8E-011.1E+025.5
4.4E+054.2E+059.6E-039.6E-033.5E-014.1E+03
Radionuclide
Sm-151Eu-152Eu-154Eu-155Tl-207Tl-208Pb-209Pb-211Pb-212Bi-211Bi-212Bi-213Po-212Po-213Po-215Po-216At-217Rn-219Rn-220Fr-221Fr-223Ra-223Ra-224Ra-225Ra-228Ac-225Ac-227Ac-228Th-227Th-228Th-229
Ci
4.7E+034.1E+012.0E+035.6E+028.2
2.2
2.1E-018.2
6.1
8.2
6.1
2.1E-013.9
2.0E-018.2
6.1
2.1E-018.2
6.1
2.1E-011.1E-018.2
6.1
2.1E-011.5
2.1E-018.2
1.5
8.1
6.1
2.1E-01
Radionuclide
Th-230Th-231Th-2342Th-234Pa-231Pa-233Pa-234mU-232U-233U-234U-235U-236U-238Np-236Np-237Np-239Pu-236Pu-238Pu-239Pu-240Pu-241Pu-242Am-241Am-242Am-242mAm-243Cm-242Cm-243Cm-244Cm-245Cm-246
Ci
4.4E-025.2E-031.6
7.1E-051.5E+013.0E-017.1E-052.7
2.1
2.2E-015.2E-039.8E-037.1E-051.2E-013.0E-017.8
LIE-024.7E+021.5E+018.1
7.4E+021.2E-022.4E+026.7
6.7
7.8
5.5
2.2E-011.2E+012.0E-022.3E-03
Source: ORNL (1992a).

96
TABLE 3.32 Release Point Characteristics for Atmospheric Emissionsduring Current Storage and Transfer of HLW at WVDP
Stack Parameter
Release pointStack height (m)Height above surrounding structure (m)Stack exit velocity (m/s)Stack diameter (m)Exit temperature (°C)
Value
Main Stack for HLW Storage3.7-4.32.6
0.07625
Source: WVDP (1992).
To estimate the occupational exposure from current HLW storage, it is assumed that twofull-time workers are needed — a technician and a health physicist. It is also assumed that averageradiological exposure information for WVDP operations for 1987 is applicable to current storageoperations. In that year, a collective dose of 70 rem was received by 425 workers who received ameasurable dose (PNL 1989). The average dose per worker is therefore taken to be 165 mremannually, or 0.08 mrem/h.
Radioactive process operations for pretreatment are planned to be conducted totally withinthe existing HLW storage tanks 8D-1, 8D-2, and 8D-3. To accomplish this, a new transfer line wasconstructed from Tank 8D-2 to a Supernatant Treatment System (STS) using interconnected double-contained piping housed in a containment conduit. The waste transfer facility includes piping, acontainment trench, pump pits, and mobilization pumps.
Occupational exposure is also associated with transfer of the HLW from the current storagefacilities to the vitrification facility. The estimate given here is based on information contained inthe Phase I EIS (DOE 1982a). A dose rate of 0.65 rem/worker-yr was assumed on the basis ofexperience with exposure to workers at the tank farm at Hanford. The Phase I EIS estimates that fivepersons are needed for transfer operations and that the operations continue for four years (i.e., threeyears to retrieve the waste and one year to flush and decontaminate the tanks used in current storage).Table 3.33 summarizes information on the number of personnel required and worker exposure.
The IRTS consists of the STS, Liquid Waste Treatment System (LWTS), CementSolidification System (CSS), and the Drum Cell. The LWTS, CSS, and Drum Cell are concernedprimarily with LLW processing; the zeolite product from the STS is managed as HLW.

97
TABLE 3.33 Estimated Personnel Requirements and Exposurefor Transfer of HLW at WVDP
Number of Duration Dose RateCategory Personnel (FTEa) (yr) (rem/yr)b
Exposed (all) 5 3C 0.65Exposed (all) 5 1* 0.65
a Full-time equivalent.b Dose rates taken from experience at Hanford tank farms
(DOE 1982a).c D t i f ti h
(DOE 1982a).c Duration of operations phase.d Duration of tank-flushing phase.
The STS removes Cs-137 from the supernatant wash solutions in Tank 8D-2 by runningit through three zeolite ion-exchange columns located in Tank 8D-1; the decontaminated supernatantis then transferred to the LWTS for further processing. The major process components include aprefilter, feed tank, supernatant cooler, the four ion-exchange columns, and a filter fordecontaminated supernatant. The solution is cooled to less than 13 °C (55 °F) to improve the cesiumremoval efficiency. Once the solution is cooled, it is pumped, in series, through the ion-exchangecolumns. Four columns are required, and each column contains 1.5 m^ (53 ft3) of zeolite. The spention-exchange medium is stored underwater in Tank 8D-1.
The SMWS is designed to resuspend the insoluble solids in the sludge in Tank 8D-2, washthe salts from the sludge, and decontaminate the wash solutions to ensure that the cement productdoes not exceed NRC radioactive waste Class C limits (Schiffhauer and Thompson 1993). Thesystem consists of five low-pressure, high-flow, long-shafted centrifugal pumps installed inTank 8D-2. The mobilization pumps mix the settled sludge solids and added caustic solution,resulting in dissolution of the salt crystals. The mixing is stopped when the desired salt concentrationis reached and the solids are allowed to settle. The wash solution is then drawn from Tank 8D-2 witha floating suction removal pump and transferred to the IRTS for processing.
Both sludge-wash processing cycles were completed in 1994. The washed sludge, the acidicwaste, and the cesium-loaded zeolite are to be combined.
The vitrification process at WVDP is similar to that at Hanford and SRS (Figure 3.9). High-level waste enters the vitrification process through the concentrator feed makeup tank (CFMUT).In the CFMUT, excess water is removed from the HLW, which is then mixed with glass-formingchemicals to form a slurry. The slurry is then fed to a holding tank, that is, the melter feed hold tank

98
Releases
Releases
Repository
Treatment Interim Storage Disposal
LLW
Current Storage
FIGURE 3.9 Flow Diagram for West Valley Demonstration Project
(MFHT). The slurry fed ceramic melter (SFCM) is where the vitrification into borosilicate glassactually takes place. The slurry is fed to the SFCM from the MFHT by an air displacement pumpthat meters the amount of slurry fed into the melter. The output from the melter overflows intocanisters held on a turntable (Barnes et al. 1988).
During the initial part of the project, full-scale developmental testing was conducted in theComponent Test Stand (CTS) by using nonradioactive materials to simulate the sludge expected inthe storage tanks. The existing CTS is now being converted for radioactive operations into theVitrification Facility (VF). The major components of the VF, including parts of the off-gaspurification system, are housed in a new below-grade, shielded pit and Butler-type buildingconstructed in the mid-1980s. The remainder of the off-gas system is located in the formerreprocessing facility (Mclntosh et al. 1988). A list of the various process equipment characteristicsis given in Barnes et al. (1988).
3.7.3 Current Status
Construction of the VF began on August 12, 1985, and was completed during FY 1995. OnJune 24, 1996, liquid HLW was transferred to the Vitrification Facility for immobilization. The firstcanister of glass was completed on July 5, 1996, with three canisters produced as of July 8, 1996.
99
Vitrification operations using the HLW at WVDP are expected to proceed from 1996 to 1998, duringwhich an estimated total of 340 HLW canisters will be produced.
100
4 DEFINITION OF ALTERNATIVES
4.1 METHODOLOGY AND ASSUMPTIONS
The DOE Waste Management (WM) Programmatic Environmental Impact Statement(PEIS) (DOE 1996b) is being prepared to assess the potential environmental consequences ofdifferent alternatives for consolidating waste management facilities at the major DOE sites. TheHLW alternatives to be considered in the WM PEIS are as follows:
• No Action Alternative
- Store HLW canisters at Hanford, SRS, INEL, and WVDP in existing andapproved storage facilities;
- Continue current treatment approaches at each site;
- Continue interim storage of liquid and calcine HLW at INEL; and
- Continue activities necessary for ultimate disposal of HLW in a geologicrepository.
• Decentralized Alternative
- Continue storage of HLW at Hanford, SRS, INEL, and WVDP;
- Continue current treatment approaches at the above sites;
- Begin immobilization of INEL HLW in 2015.
- Continue interim storage of stabilized (vitrified) HLW at each site; and
- Continue activities necessary for ultimate disposal of HLW in a geologicrepository.
• Regionalization Alternative (Case 1)
- Same as Decentralized Alternative, except provide interim storagefacilities for treated HLW at SRS for WVDP vitrified HLW canisters.

101
• Regionalization Alternative (Case 2)
- Same as Decentralized Alternative, except provide interim storagefacilities for treated HLW at Hanford for WVDP vitrified HLW canisters.
• Centralization Alternative (Case 1)
- Same as Regionalization Case 1, except provide interim storage facilitiesfor treated HLW at Hanford for WVDP, SRS, and INEL HLW canistersuntil acceptance of HLW canisters at a geologic repository. This caseassumes that the repository opens on time in FY 2015.
• Centralization Alternative (Case 2)
- Same as Case 1, except provide interim storage facilities for all treatedHLW at Hanford for WVDP, SRS, and INEL HLW canisters. This caseassumes the repository is not ready to accept delivery of HLW canisters inFY 2015 and all HLW is stored temporarily at Hanford.
The No Action Alternative includes only existing and approved waste managementfacilities and will provide a baseline against which the other alternatives can be assessed. High-levelwaste at Hanford, SRS, and WVDP is to be immobilized by glass-based vitrification. Currently,DOE is proceeding with operation of facilities for vitrification of HLW at Hanford, SRS, andWVDP. The HLW will be retrieved, pretreated to remove soluble and nonradioactive species,vitrified, and then poured into canisters to complete the immobilization process. Existing HLWcanister storage facilities include the GWSB at SRS (for a total storage capacity of 2,286 canisters)and the CPC at WVDP (storage capacity of approximately 350 canisters). In accordance with theRecord of Decision based on the previous EIS for the Hanford Site (DOE 1987), a storage facilitywill be available for storing approximately 750 HLW canisters (about 5 years of production fromthe original HWVP design). The interim storage facility at Hanford is expected to be operational by2009. The more recent TWRS EIS (DOE 1996a) considers storage for a total of 12,200 HLWcanisters. Because DOE has not issued a Record of Decision based on the TWRS EIS, the WM PEISapplies the storage capacity given in DOE (1987). No HLW canister storage facility exists or isapproved for INEL (DOE 1995f).
The Decentralized Alternative is similar to the No Action Alternative except that the HLWat INEL undergoes immobilization. High-level waste immobilization at INEL is assumed to occurvia vitrification with prior radionuclide partitioning. Existing calcine at INEL would be retrievedfrom underground calcine bins and separated into high- and low-activity fractions (and if necessary,heavy metals would be removed from the low-activity stream). On-site interim storage would beprovided for all treated HLW awaiting shipment to a geologic repository for permanent disposal.

102
The Regional Consolidation Alternative is the same as the Decentralized Alternative exceptthat the vitrified HLW canisters produced at one site (or sites) would be transported for interimstorage at another. Two HLW sites exist in the western portion of the United States — Hanford andINEL. The majority of the radioactivity of INEL HLW is in the form of a solid calcine stored inhigh-integrity stainless steel bins with a design lifetime of 500 years. Because the calcine isphysically and chemically stable, adequately stored, and would require further processing to put itin a physical form suitable for transport, establishing Hanford as a regional HLW site to receiveINEL waste is not reasonable. These considerations indicate that establishing INEL as a regional sitefor Hanford's HLW is also not reasonable.
The two HLW sites in the eastern portion of the United States are WVDP and SRS. WestValley is by law a demonstration cleanup project and, therefore, not a reasonable location for aregional HLW interim storage site. However, SRS is a potential regional HLW interim storage sitefor the vitrified HLW canisters at WVDP because of the similarity in canister characteristics.
The vitrified HLW canisters that will be produced at WVDP are also similar to those thatmay be produced at Hanford and, therefore, if ultimate disposal of HLW canisters occurs in theWest, then Hanford could be considered a reasonable storage site for WVDP vitrified HLWcanisters. Because of the different physical forms and unavailability of current storage facilities forhandling canisters from WVDP at INEL, INEL is not considered suitable to store either SRS orWVDP vitrified waste.
If ultimate disposal of HLW is to occur in the West, it is unreasonable to consider usingSRS as a storage location for Hanford HLW. Hanford, however, is a potential site for regionalizedstorage of SRS HLW canisters.
The Centralized Consolidation Alternative is the same as the Regional ConsolidationAlternative except that interim storage for all HLW canisters would be provided at one site. Asdiscussed previously, it is unreasonable to consider WVDP or INEL for storage of HLW fromHanford and SRS, and to consider using SRS as a storage location for Hanford HLW if ultimatedisposal is to occur in the West. Under the Centralized Alternative, the HLW canisters produced atSRS, WVDP, and INEL would be transported to the Hanford Site, where adequate storage capacitywould be provided until the canisters are accepted at a geologic repository.
This study assumes that DOE will construct interim glass canister storage facilities basedon a modular design. The model for future storage is taken to be the GWSB at SRS. The capacityof each module is assumed to range from 2,200 to 2,900 canisters. Therefore, storage of a total of21,612 HLW canisters at a single centralized site would require 10 interim storage facilities, eachwith a storage capacity of approximately 2,160 canisters.

103
For conservatism, the loading rate during interim storage is taken to equal the averageannual vitrification rate (i.e., 190 canisters per year for SRS and 790 canisters per year for Hanford).
4.2 DESCRIPTIONS OF HLW CASES
4.2.1 No Action Alternative
The existing glass canister storage facility at SRS has a current capacity of 2,268 canisters;design characteristics of an interim storage facility for the remaining 2,268 additional canisters tobe produced at Savannah River are given in Table 3.21 (assuming a constant loading rate of410 canisters per year). The characteristics of the CPC at WVDP are given in Table 1.2. A canisterstorage area for approximately 750 canisters is to be provided at the Hanford Site. The storagefacility was expected to be modular in design to allow expansion if a storage period longer than5 years was required. The HLW canisters at Hanford were to be stored in dry cells, with a negativepressure maintained through a monitored HEPA filter system (DOE 1987). The impacts associatedwith the construction and operation of the interim canister storage area are included in the resourcerequirements for the previous design for the HWVP (Table 3.11).
4.2.2 Decentralized Alternative
A comparison of the existing and projected interim storage facilities for this alternative isgiven in Table 1.2. It is assumed that six interim storage facilities, each with a storage capacity of2,500 canisters, would be required for the 15,000 canisters estimated to be produced at Hanford.Design characteristics for one of the six interim storage facilities are given in Table 4.1 (assuminga constant loading rate of 790 canisters per year).
4.2.3 Regionalized Alternatives
The approach taken for the following cases assumes that the limited number of WVDPcanisters (340 total) would not have a significant impact on the assumed loading rates for the variousinterim storage facilities (i.e., WVDP canisters are sent during periods when production is lower thanthe maximum canister loading rate).
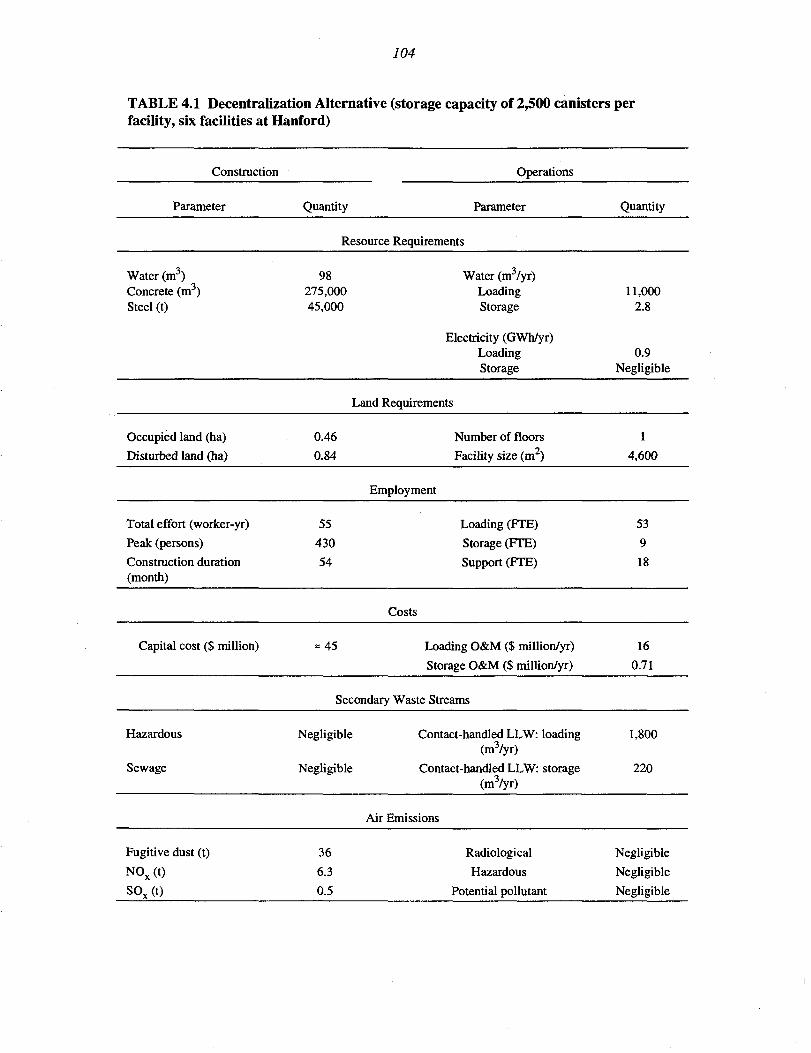
104
TABLE 4.1 Decentralization Alternative (storage capacity of 2,500 canisters perfacility, six facilities at Hanford)
Construction
Parameter
Water (m3)Concrete (m3)Steel (t)
Occupied land (ha)
Disturbed land (ha)
Total effort (worker-yr)Peak (persons)Construction duration(month)
Capital cost ($ million)
Hazardous
Sewage
Fugitive dust (t)
NOx(t)
SOx(t)
Quantity
Operations
Parameter
Resource Requirements
98275,00045,000
Water (m3/yr)LoadingStorage
Electricity (GWh/yr)LoadingStorage
Land Requirements
0.46
0.84
55
430
54
= 45
Number of floors
Facility size (m2)
Employment
Loading (FTE)
Storage (FTE)
Support (FTE)
Costs
Loading O&M ($ million/yr)
Storage O&M ($ million/yr)
Secondary Waste Streams
Negligible
Negligible
36
6.3
0.5
Contact-handled LLW: loading(m3/yr)
Contact-handled LLW: storage(m3/yr)
Air Emissions
Radiological
Hazardous
Potential pollutant
Quantity
11,0002.8
0.9Negligible
1
4,600
53
9
18
16
0.71
1,800
220
Negligible
Negligible
Negligible

105
4.2.3.1 Casel
This case calls for shipping WVDP vitrified HLW canisters to SRS for storage. The secondinterim storage facility at SRS would be expanded from its current projected capacity of2,268 canisters to accommodate the 340 WVDP canisters (for a total of 2,626 canisters). Table 4.2gives the design characteristics of the second glass storage facility at SRS (assuming a constantloading rate of 190 canisters per year).
4.2.3.2 Case 2
This case calls for shipping WVDP vitrified HLW canisters to Hanford for storage. Theproposed glass canister storage facility design at Hanford would be expanded from its currentprojected capacity of 2,500 to 2,560 canisters to accommodate the 340 WVDP canisters (for a totalof 15,340 canisters). Table 4.3 gives the design characteristics of one of the six interim storagefacilities (assuming a constant loading rate of 790 canisters per year).
4.2.4 Centralized Alternatives
This case calls for shipping WVDP and SRS vitrified HLW canisters to Hanford forstorage. In addition, the immobilized glass-ceramic HLW canisters at INEL would also betransported to Hanford for interim storage prior to ultimate disposal in a geologic repository. It isassumed that the difference in canister dimensions and thermal power between the three vitrificationsites (Hanford, SRS, WVDP) and the glass-ceramic design at INEL would not significantly affectthe design characteristics of the interim canister storage facility such as the spacing between theindividual HLW canisters in the storage vault (taken to be approximately 2 ft).
4.2.4.1 Casel
This case assumes the geologic repository begins acceptance of HLW canisters in FY 2015.A total of approximately 17,700 canisters is to be stored at Hanford in seven facilities (each with astorage capacity of approximately 2,530 canisters) prior to transport to the repository. Designcharacteristics of an interim storage facility with a storage capacity of 2,530 HLW canisters at theHanford Site are given in Table 4.4; the loading/unloading rate of 980 canisters per year is based onHanford's annual production rate of 790 canisters per year plus SRS's average annual productionrate of 190 canisters per year.

106
TABLE 4.2 Regionalization Alternative: Case 1 (2,626 canisters at SRS)
Construction
Parameter
Water (m3)Concrete (m3)Steel (t)
Occupied land (ha)
Disturbed land (ha)
Total effort (worker-yr)Peak (persons)
Construction duration(month)
Capital cost ($ million)
Hazardous
Sewage
Fugitive dust (t)
NOX (t)
SOx(t)
Quantity
Operations
Parameter
Resource Requirements
100280,00046,000
Water (m3/yr)LoadingStorage
Electricity (GWh/yr)LoadingStorage
Land Requirements
0.47
0.85
56
440
54
= 45
Number of floors
Facility size (m2)
Employment
Loading (FTE)
Storage (FTE)
Support (FTE)
Costs
Loading O&M ($ million/yr)
Storage O&M ($ million/yr)
Secondary Waste Streams
Negligible
Negligible
37
6.4
0.5
Contact-handled LLW: loading(m3/yr)
Contact-handled LLW: storage(m3/yr)
Air Emissions
Radiological
Hazardous
Potential pollutant
Quantity
5,7002.8
0.6Negligible
1
4,700
41
9
19
12
0.73
940
230
Negligible
Negligible
Negligible
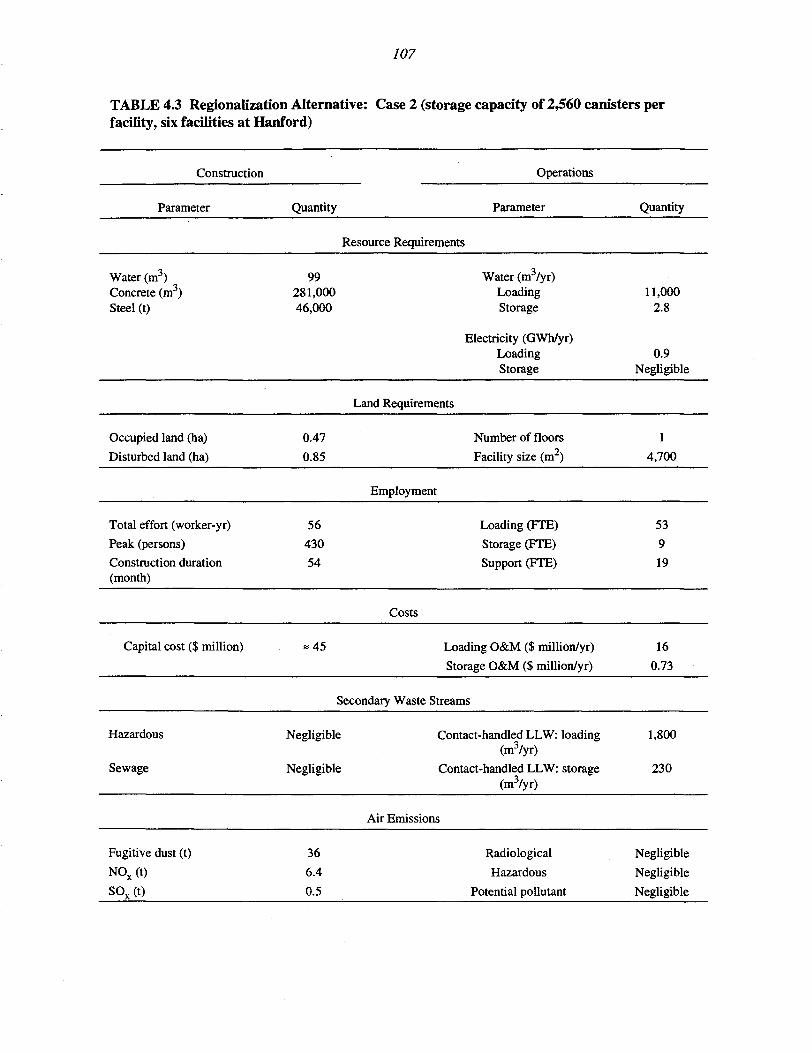
107
TABLE 4.3 Regionalization Alternative: Case 2 (storage capacity of 2,560 canisters perfacility, six facilities at Hanford)
Construction
Parameter
Water (m3)Concrete (m3)Steel (t)
Occupied land (ha)
Disturbed land (ha)
Total effort (worker-yr)
Peak (persons)
Construction duration(month)
Capital cost ($ million)
Hazardous
Sewage
Fugitive dust (t)
NOX (t)
SOx(t)
Quantity
Operations
Parameter
Resource Requirements
99281,00046,000
0.47
0.85
56
430
54
= 45
Water (m3/yr)LoadingStorage
Electricity (GWh/yr)LoadingStorage
Land Requirements
Number of floors
Facility size (m2)
Employment
Loading (FTE)
Storage (FTE)
Support (FTE)
Costs
Loading O&M ($ million/yr)
Storage O&M ($ million/yr)
Secondary Waste Streams
Negligible
Negligible
36
6.4
0.5
Contact-handled LLW: loading(m3/yr)
Contact-handled LLW: storage(m3/yr)
Air Emissions
Radiological
Hazardous
Potential pollutant
Quantity
11,0002.8
0.9Negligible
1
4,700
53
9
19
16
0.73
1,800
230
Negligible
Negligible
Negligible

108
TABLE 4.4 Centralization Alternative: Case 1 (storage capacity of 2,530 canisters perfacility, seven facilities at Hanford)
Construction
Parameter
Water (m3)Concrete (m3)Steel (t)
Occupied land (ha)Disturbed land (ha)
Total effort (worker-yr)Peak (persons)Construction duration(month)
Capital cost ($ million)
Hazardous
Sewage
Fugitive Dust (t)NOX (t)SOV (t)
Quantity
Operations
Parameter
Resource Requirements
99283,00046,000
Water (m3/yr)LoadingStorage
Electricity (GWh/yr)LoadingStorage
Land Requirements
0.470.85
5644054
= 45
Number of floorsFacility size (m2)
Employment
Loading (FTE)Storage (FTE)Support (FTE)
Costs
Loading O&M($ million/yr)Storage O&M($ million/yr)
Secondary Waste Streams
Negligible
Negligible
376.40.5
Contact-handled: LLWloading (m3/yr)
Contact-handled: LLWstorage (m3/yr)
Air Emissions
RadiologicalHazardous
Potential pollutant
Quantity
17,0002.8
1.1Negligible
14,700
63919
19
0.73
2,700
230
NegligibleNegligibleNegligible

109
4.2.4.2 Case 2
This case assumes that the geologic repository is unavailable to receive HLW canisters inFY 2015 and all HLW is stored temporarily at Hanford. A total of 21,612 canisters is to be storedat Hanford in 10 facilities (each with a storage capacity of approximately 2,161 canisters). Designcharacteristics of an interim storage facility for 2,160 HLW canisters at the Hanford Site are givenin Table 4.5; the loading/unloading rate of 980 canisters per year is based on Hanford's annualproduction rate of 790 canisters per year plus SRS's average annual production rate of 190 canistersper year.

110
TABLE 4.5 Centralization Alternative: Case 2 (storage capacity of 2,160 canisters perfacility, fourteen facilities at Hanford)
Construction
Parameter
Water (m3)Concrete (m3)Steel (t)
Occupied land (ha)
Disturbed land (ha)
Total effort (worker-yr)
Peak (persons)
Construction duration(month)
Capital cost ($ million)
Hazardous
Sewage
Fugitive Dust (t)
NOX (t)
SOx(t
Quantity
88223,00037,000
0.42
0.75
46
360
49
= 40
<
Negligible
Negligible
29
5.1
0.4
Operations
Parameter
Resource Requirements
Water (nrVyr)LoadingStorage
Electricity (GWh/yr)LoadingStorage
Land Requirements
Number of floors
Facility size (m )
Employment
Loading (FTE)
Storage (FTE)
Support (FTE)
Costs
Loading O&M ($ million/yr)
Storage O&M ($ million/yr)
Secondary Waste Streams
Contact-handled: LLW loading(m3/yr)
Contact-handled: LLW storage(m3/yr)
Air Emissions
Radiological
Hazardous
Potential pollutant
Quantity
17,0002.2
1.1Negligible
1
4,200
63
9
17
19
0.59
2,700
180
Negligible
Negligible
Negligible

Ill
5 COST ANALYSIS
5.1 METHODOLOGY AND ASSUMPTIONS
Waste management costs can be a very significant concern in any operation. To reach soundmanagement decisions for handling both radioactive and nonradioactive wastes, a knowledge of thelife-cycle costs (LCCs) is required (DOE 1983, 1986c, 1990a). The LCCs are the "cradle to grave"costs, that is, the costs incurred from the time the waste is generated to the end of its institutionalcontrol. The total LCC must include all costs associated with waste handling following itsgeneration, current storage and treatment, transportation, future disposal, and monitoring. The WMPEIS will not analyze environmental impacts of HLW disposal at Yucca Mountain or alternativelocations for a geologic repository. Because of the possibility of a prolonged delay of HLW disposal,alternatives for longer interim storage of HLW will be addressed in the WM PEIS.
Projecting the cost of the alternatives involves developing estimates of the individual costcomponents. The cost is divided into two components: capital investment and costs associated withannual operating charges. The capital cost of a facility includes process equipment, constructionmaterials (e.g., steel and concrete), and labor, as well as indirect costs such as those for design,contingencies, and environmental compliance. The annual O&M costs are expenses for operationand maintenance staff, fixed and variable supplies, annual operating fees, administration and generalexpenses. These two cost components were estimated by updating available data on the cost oftreatment, storage, and transportation of HLW. These costs cover all the major elements thatcontribute to the LCC. To facilitate comparison, data normalization was necessary but was limitedprincipally to adjustments of all costs to beginning-of-year (BOY) 1994 dollars. Escalation factorsused for these adjustments were obtained from the U.S. Department of Commerce Survey of CurrentBusiness (DOC 1994).
Given the current operations schedule of the Savannah River DWPF, it may be possible totransport the canisters directly from West Valley to SRS without ever placing the canisters in interimstorage at West Valley, thereby reducing costs at West Valley. This action was not consideredbecause it is not discussed in the Implementation Plan.
5.2 CURRENT HLW STORAGE
The unit cost of HLW storage was estimated on the basis of annual operating cost data fromSRS, Hanford, and INEL. It was assumed that no capital investments would be required in the near-term, so that the only relevant costs are those from annual operations. Inclusion of tank farmupgrades, construction of new tanks, or the final D&D of the tank farms would increase the unitstorage cost above that reported in this section.

112
The SRS has a large HLW inventory, with approximately 32 million gal in underground,double-walled tanks. The unit cost of operation of the HLW tank farms at SRS was estimated on thebasis of an annual operating cost for the HLW tank farms ($162,901 million/yr [Street et al. 1992]),which was divided by the total inventory at the time the cost estimate was generated (32 million gal)to arrive at a value of $5.5/yr/gal HLW in BOY 1994 dollars.
Approximately 61 million gal of HLW are stored at Hanford. The total funding for thewaste tank safety and operations program at Hanford was reported to be $166.8 million for FY 1992(DOE 1992b); the HLW inventory at that time was 24.5 million gal of DST waste and 36.2 milliongal of SST waste for a total of 60.8 million gal (ORNL 1992b). The unit storage cost is therefore$2.8/yr/gal HLW in BOY 1994 dollars. The Westinghouse Hanford Company completed a study inwhich it was determined that the funding requirements for operation of the tank farms in compliancewith DOE and industry standards would require $262 million per year (DOE 1992b); this equatesto a unit storage cost of $4.5/yr/gal HLW in BOY 1994 dollars. Therefore, the unit storage cost atHanford ranges between $2.8 to $4.5/yr/gal HLW in BOY 1994 dollars.
Funding allocated during FY 1991 for HLW tank farm/calcine storage at INEL wasreported to be $2.59 million (DOE 1991a). The inventory at INEL during 1991 was 6,800 m3 (1.8million gal) of liquid HLW and 3,600 m3 (130,000 ft3) of solid calcine, for a total of 10,400 m3
(2.75 million gal). The unit storage cost at INEL is estimated to be $0.9/yr/gal HLW in BOY 1994dollars. This assumes that the calcine requires the same level of management as liquid HLW, whichmay not be correct, because its more stable form may require less surveillance.
The 1991 inventory of HLW at WVDP included approximately 1,729 m3 (460,000 gal)stored in two underground tanks. In this analysis, it is assumed that HLW pretreatment has beencompleted at West Valley, and, therefore, current storage and pretreatment are excluded from furtheranalysis in the WM PEIS.
Table 5.1 compares the individual unit storage cost values. The unit storage cost rangesfrom $0.9 to $5.5/yr/gal HLW. This comparatively small range is remarkable given the differencesin physical and chemical form, amount in storage, and number of storage vessels.
5.3 HLW PRETREATMENT/TREATMENT
The major facility involved in HLW treatment at SRS is the DWPF. Table 5.2 gives recentcost estimates for DWPF, along with some of the assumptions in making these estimates. The in-tank precipitation process is estimated to cost $97 million in BOY 1994 dollars. The treatmentfacility, the actual vitrification plant, is projected to cost $2.25 billion. Investment costs of$83 million are projected for the interim storage facility. Additional support facilities are expected

113
TABLE 5.1 Unit Storage Cost of HLW at the Three Main DOE Sites
Annual Storage HLW Inventory Unit Storage CostHLW Site Cost ($ million/yr) (million gal) (BOY 1994 $/yr/gal HLW)
SRSHanford
INEL
WVDP
162.091166.8 to 262
2.59
NAa
3260.8
2.75
NA
5.52.8 to 4.5
0.9
NA
NA = not applicable.
TABLE 5.2 Cost Summary for HLW Pretreatment and Treatment at SRS
Capital Cost (millions of BOY 1994 dollars)3
Annual OperatingIn-Tank Interim Other DWPF Cost
Precipitation DWPF Storageb Support Facilities ($ million/yr)c
97 2,250d 83 1,730 168
a Source: GAO (1992).b Covers storage facilities for canisters and for failed equipment, such as
melters.c Source: Buice (1992).d This number includes construction plus start-up costs for the DWPF. An
additional $1.8 billion will be needed for DWPF support facilities to bring thetotal to about $4 billion.
to add an additional $1.73 billion. The total capital investment, including the support facilities comesto about $4.2 billion in BOY 1994 dollars. Annual O&M costs are given for the whole facility(pretreatment, treatment, and interim storage) as $168 million.
Once the DWPF becomes operational, DOE estimates that it will take approximately17 years before all waste is vitrified (ORNL 1992b). The (undiscounted) total LCC is estimated tobe approximately $6.7 billion in 1992 dollars. A total of 5,242 vitrified-HLW canisters are projectedto be generated during the 17 years of operations; each canister will contain approximately 9,014 gal(34.1 m3) of SRS HLW (Choi and Fowler 1990). The unit cost of HLW treatment is approximately
114
$150/gal ($0.6/m3) ($7.1 billion divided by 5,242 canisters, with 9,014 gal [34.1 m3] HLW percanister).
A unit treatment cost of $26.29/gal ($0.1/m3) HLW at SRS has been quoted in the literature(Street et al. 1992). This lower value results from the cost of the existing HLW treatment facilitiesat SRS being considered to be "sunk," that is, already incurred and not impacting current or futurewaste generation and/or treatment. However, exclusion of these sunk costs does not allow a full-costrecovery determination for the LCC.
The DOE plans to construct a facility similar to the DWPF at SRS for the Hanford site inWashington State; this facility is called the HWVP. Table 5.3 gives cost information for HLWpretreatment and treatment of the DST waste at Hanford. The total projected capital cost of theHWVP will be approximately $1.2 billion (1991 dollars) (LaRue and Cross 1991). This cost estimateis only for the vitrification plant itself and its auxiliary buildings and structures (including the CSBfor glass canister interim storage) and does not include costs for pretreatment facilities. Thepretreatment option to be used at Hanford has yet to be defined. Depending upon the pretreatmentoption(s) chosen, the capital cost may be increased by anywhere from $1.5 billion to over $3 billion(1991 dollars) (Grygiel 1991); the latest estimate is $1.7 billion for pretreatment of the DST wasteusing advanced actinide separation (Boomer 1992). This puts the total capital cost of the HWVP(including pretreatment facilities) from $2.7 billion to over $4.2 billion. The total annual operatingcosts (both fixed and variable) are estimated to be between $67 million (Boomer 1992) and$80 million (Stegen 1992), including the operating charges for the pretreatment facility. The largestcomponent of the annual operating cost was attributable to fixed costs; the variable componentconsisted primarily of consumables such as frit, the cost of which is a few million dollars.
Only very broad estimates of the LCC for HLW pretreatment/treatment at Hanford can befound in the literature. For purposes of this cost analysis, all waste in the DSTs and SSTs at Hanfordwill be considered to be HLW. One recent report placed the LCC between $25 to $45 billion for allHLW at Hanford, including that contained within the SSTs; this cost estimate included research anddevelopment, waste characterization, waste pretreatment and facilities, vitrification facility designand construction, on-site canister storage facilities, and operational and other capital costs necessaryto prepare and store the HLW pending shipment to a geologic repository (GAO 1993). Retrieval,however, was not mentioned. The cost to retrieve the HLW in the DSTs and SSTs has been projectedto exceed $16 billion in BOY 1994 dollars. The latest numbers indicate that the total LCC couldapproach $53 billion in BOY 1994 dollars for the included research and development, wastecharacterization, waste pretreatment and facilities, vitrification facility design and construction, on-site canister storage facilities, and operational and other capital costs necessary to prepare and storethe HLW pending shipment to a geologic repository (GAO 1993). Retrieval, however, was notmentioned. The cost to retrieve the HLW in the DSTs and SSTs has been projected to exceed$16 billion in BOY 1994 dollars. The latest numbers indicate that the total LCC could approach$53 billion in BOY 1994 dollars for the HLW at Hanford. The current HLW inventory at Hanford

115
TABLE 5.3 Cost Summary for HLW Pretreatment and Treatment of Double-Shell Tank Waste at Hanford
Total Annual O&M CostCapital Cost ($ millionf ($ million/yr)b
Pretreatment
1,700
HWVP
1,060
InterimStorage0
35
AuxiliaryBuildingsd
105
Staff
65.5
Materials
1.5
a Source: Boomer (1992); costs given in 1992 dollars.
Annual costs determined from Boomer (1992) assuming a 40-year pretreatmentcampaign.
0 Interim storage cost taken from Boomer (1992) for a storage facility for 2,000 HLWcanisters.
d Determined by subtracting costs of other facilities ($1,095 million) from total cost($1,200 million).
includes 36 million gal (= 140,000 m3) of SST waste and 25 million gal (=95,000 m3) of DST waste,for a total of 61 million gal (=230,000 m3). The unit cost of HLW treatment at Hanford is therefore$860/gal (=$3.3/m3) HLW ($53 billion per 61 million gal [=230,000 m3]) HLW.
The WVDP is being conducted at the WNYNSC in order to conduct a HLW managementoperation to immobilize the 660,000 gal (=25,000 m3) of HLW stored on-site. This analysis assumesthat the pretreatment phase at West Valley will have been performed by 1994 and is thereforeexcluded from further analysis in the WM PEIS. Hot vitrification operations are expected to proceedfrom CY 1996 to 1998, during which a total of 300 HLW canisters will be produced. The fundingsupport for fiscal years 1991 to 1997 is projected to approach $869 million in BOY 1994 dollars(DOE 1991a), with a FY 1997 operating budget of $142 million in BOY 1994 dollars duringvitrification operations. On the basis of an estimated capital cost of $500 million and operations overthree years at $135 million per year, the (undiscounted) LCC is approximately $0.9 billion. The unitcost of HLW treatment at West Valley is about $l,440/gal HLW in BOY 1994 dollars.
Pretreatment at INEL is divided into two steps: one is the on-going calcination of liquidHLW at the ICPP and the second is projected to start operations in FY 2014. Primary pretreatmentis currently performed at INEL in the NWCF; the annual operating cost has been reported to beapproximately $15.3 million per year (DOE 1991b). The secondary pretreatment process will belocated in the IWIF. The treatment process for HLW at INEL is assumed to follow the glass-ceramicwaste form since it appears to offer a promising technology for HLW immobilization at INEL;

116
however, other technologies are currently being considered. One estimate of the capital cost of theIWIF is between $500 million and $1 billion (Knecht 1992), less than that for the DWPF at SRS.One reason is that support facilities (such as the NWCF, calciner bins, Atmospheric ProtectionSystem for off-gas treatment, etc.) that can be utilized for the IWEF already exist at INEL, which isnot the case at SRS. The existing support facilities may, however, reach the end of their operatinglives before the presumed startup (FY 2014) of the IWIF; the cost to refurbish (or potentiallyreplace) these facilities was not considered. The capital cost for a conceptual glass-ceramicimmobilization plant that would process a total of 3,400 canisters has been reported to be $500million in 1981 dollars (Grantham et al. 1983). The capital cost for an 8,500 total canister plantbecomes approximately $1.4 billion when the "six-tenth" factor is used for scaling and the 1981 costis escalated to 1994 dollars. The upper value of $1 billion given recently by Knecht (1992) appearsto be more reasonable and has been used in this analysis. The total annual operating cost is estimatedto be on the order of $250 million per year (Berreth and Knecht 1987). The LCC for a glass-ceramicimmobilization plant operating a total of 35 years (FY 2015-2049) has been reported to be about$9.44 billion with a capital cost of about $1.6 billion (Cornelius 1994); these costs include the glass-ceramic facility, equipment, calcine conveyance system, support facilities, support facilitiesequipment, and balance of plant utilities upgrades. On the basis of a total glass-ceramic volume of4,865 m3 (171,783 ft3), 0.47 m3 (16.5 ft3) calcine per m3 liquid, and between 0.49 m3 (17.3 ft3)(aluminum calcine) to 0.62 m3 (21.8 ft3) (zirconium calcine) per m of glass-ceramic, the unittreatment cost at INEL ranges from $1,700 to $2,100/gal liquid HLW. The higher unit cost incomparison with the other three sites reflects the additional costs of interim stabilization bycalcination and calcine retrieval. Cost information is presented in Table 5.4. These values should beconsidered very preliminary because of the uncertainty of the immobilization process to be chosen(borosilicate glass or glass-ceramic), overall process design, starting date for immobilization, andother issues for development.
Table 5.5 compares the unit treatment cost as a function of DOE site. The unit treatmentcost ranges from $147 to $2,100/gal HLW because of the differences in physical form, chemicalconstituents, amount to be treated, annual processing rate, and other variables. The high unittreatment cost (relative to other radioactive waste categories such as low-level, low-level mixed, etc.)is due to the remote operations from heavy protective shielding required to confine penetratingradiation. The treatment cost, however, when placed on an unit canister basis (Table 5.5) ranges fromonly $1.1 to $3.8 million per HLW canister.
5.4 INTERIM CANISTER STORAGE
The canisters of vitrified HLW from Hanford, SRS, and WVDP would be placed in aninterim on-site storage facility awaiting transport to a geologic repository. The operating lifetime ofthe various interim storage facilities is assumed to be 50 years; the actual value will depend on thetransportation schedule of the HLW canisters to a geologic repository for permanent disposal andon the transportation schedule of the WVDP canisters to Hanford or SRS.

117
TABLE 5.4 Cost Summary for HLW Pretreatment and Treatment at INELa
Total Annual O&M CostCapital Cost ($ million) ($ million/year)
NWCFb
NA
IWIF
1,000
InterimStorage0
2
AuxiliaryBuildings15
N/A
NWCF*1
15.3
IWIF
250
InterimStorage6
0.4
a An LCC of $9.44 billion has been reported for the glass-ceramic facility,equipment, calcine conveyance system, support facilities, support facilitiesequipment, and balance of plant utilities upgrades (Cornelius 1994).
b These facilities have been constructed and operated over a number of years. Thecapital cost to construct a similar facility today could not be estimated based onprevious costs because of varying cost escalation, regulations, etc.
c Cost of HLW interim storage based on a total of 327 repository canisters at theINEL and a capital cost of $114.76 million for a total of 18,720 drywells ($6,100per drywell) (Fletcher and Smith 1989). This reference also states that the D&Dcost is 10% of initial capital cost.
d Annual operating charges assuming 184 full-time equivalents (FTEs) at a fullyloaded annual cost of $73,000/yr and a materials cost of $1.8 million (DOE1991b).
e Annual operations charges based on a dedicated crew of six FTEs to load a HLWrepository canister into a drywell and a fully loaded cost of $73,000 per FTE.
Because of the lack of information on the shipping rate to be assumed for the various
alternatives, the loading rate during interim storage is conservatively taken to equal the average
annual vitrification rate (190 canisters per year for SRS, 790 canisters per year for Hanford). The
various cost components for the different HLW alternatives are presented in Table 5.6. The
(undiscounted) LCC is given by the following equation:
[Life-cycle cost ($)] = [Capital cost ($)] + [Loading/unloading duration (yr)] (5.1)
x [Annual O&M: loading ($/yr)] + [Storage duration (yr)]
x [Annual O&M: storage ($/yr)].
Because the loading/unloading duration is dependent on the shipping rate, the operation
durations of the various interim glass canister storage facilities are unknown. The 50-year LCC was
estimated assuming that the total time for unloading the HLW canisters prior to shipment to the
national geologic repository would be equal to the total loading time.

118
TABLE 5.5 Cost Summary for HLW Pretreatment andTreatment
Unit Pretreatment/Treatment Cost(BOY 1994$)
Total ProjectedNumber of HLW $ million/HLW
DOE Site Canisters $/galHLW canister
SRSHanfordINELWVDP
5,242
14,000 - 37,000
8,500a
300
150
860
1,700-2,100
1,440
1.41.5 - 3.8
1.1
3.2
a The number of HLW canisters is not given in Cornelius (1994)nor is the canister size waste loading. Preliminary estimatesbased on a 70% waste loading and a canister volume of 0.6 mresult in an approximate total of 8,500 canisters.
TABLE 5.6 Cost Characteristics of Interim Glass Canister Storage for the Various HLWAlternatives8
HLWAlternative
Decentralization
Regionalization,Casel
Regionalization,Case 2
Centralization,Case 1
Centralization,Case 2
FacilityName
MCSB
SGCSB
MCSB
MCSB
MCSB
HLWSite
Hanford
SRS
Hanford
Hanford
Hanford
FacilityCapacity(HLW)
Canisters)
2,500
2,626
2,560
2,575
2,160
TotalNumber
ofStorage
Facilities
6
1
6
7
10
CapitalCost
($ million)
= 45
= 45
= 45
= 45
= 41
Annual O&M Cost($ million/yr)
Loading/Unloading
16 b
8.2 c
1 6 b
17 d
17 d
StorageOnly
0.71
0.75
0.73
0.73
0.62
a Abbreviations: SGCSB = second glass canister storage building and MCSB = modified canister storage building.b Based on a (constant) loading/unloading rate of 790 HLW canisters per year.c Based on a (constant) loading/unloading rate of 190 HLW canisters per year.d Based on a (constant) loading/unloading rate of 980 HLW canisters per year (Hanford's annual production rate of
790 canisters per year plus SRS's annual production rate of 190 canisters per year).

119
Table 5.7 gives the LCCs based on a total operations period of 50 years for the variousinterim storage facilities. The differential LCC for the situation where both WVDP and SRScanisters are shipped to Hanford was determined by subtracting both the costs of current designfacilities at Hanford and SRS. Neither the annual storage costs (on the order of $100,000/yr) nor thecapital costs associated with construction of a receiving and shipping area at the WVDP for off-sitecanister shipments (on the order of $2 million, based on floor area of approximately 3,500 ft2 at$500/ft for a shipping rate of 100 canisters per year) were included in the comparison of storagecosts at Hanford and SRS.
Analysis of the results in Table 5.7 indicates that the cost of interim storage of WVDP,INEL and SRS canisters at Hanford may not result in any appreciable cost savings. In addition, thedifference in interim storage costs of the additional 300 WVDP canisters at either Hanford or SRSis not significant. Given the broad estimates of the capital and annual O&M costs, it does not appearpossible to distinguish between the costs of storing the 300 WVDP canisters at Hanford and at SRS.However, it should be noted that the cost estimates given in this section are order-of-magnitudevalues based on similar previous cost data and as such may neglect design differences due to sitecharacteristics. In addition, it was assumed that the difference in canister characteristics betweenINEL's and the other three HLW site's canister designs would not require any modification of theinterim storage technology proposed for the Hanford and SRS canisters. Also, transportation costshave not been included in the results summarized in Table 5.7.
5.5 TRANSPORTATION OF HLW CANISTERS
Very limited cost information exists for shipment of HLW canisters. However, on the basisof numerous reports, there is general agreement that transportation costs for HLW would be similarto SNF, for which cost data are available. The total cost of transport is defined to be the sum ofcapital costs, maintenance costs, and shipping costs. A unit transportation cost (by truck) of $10,000per canister has been quoted in the literature (Tang and Saling 1990; DOE 1990a). The unittransportation cost was developed on the basis of a total of 17,750 HLW canisters generated fromdefense operations; these canisters would be shipped from the three major HLW sites (Hanford,INEL, and SRS) to Yucca Mountain. Detailed cost algorithms exist to estimate the cost of shippingSNF in repository casks from a reactor site to another site, including the national geologic repository(DOE 1986a, 1991c; Tang and Saling 1990). In general, to calculate the total required number oftransportation casks, average speeds, cask turnaround times, and availability of casks must be knownor estimated. This then determines the required number of shipping casks to support the scheduledshipment of HLW canisters from one site to another and from a given site to the geologic repository.
This report utilizes a cost estimation procedure developed by DOE for the MRS study(DOE 1986a), as more recent cost models do not allow comparison of track and rail costs on a

TABLE 5.7 Life-Cycle Cost Analysis for HLW Management Alternatives
Variable
No. of canisters in newInterim StorageFacility(ies)
Capital cost ($ million)
Annual O&M, loading($ million/yr)
Annual O&M, storage($ million/yr)
LCC($ million)
A LCC ($ million)8
Savannah River Site"
CurrentDesignb
2,286
=43
=8
=0.66
=273
Including340 WVDPCanisters0
2,626
=45
=8
«0.75
«279
«6
CurrentDesignb
15,000
=45 x 6 =270
= 16
=0.71
» 886
Including340 WVDPCanisters'1
15,300
«45 x 6 =270
«16
=0.73
=888
Hanford Site
Including 340 WVDPCanisters, and
2,373 SRSCanisters e
17,713
=45x7=315
= 17
=0.72
= 1,001
= 115h
Including 340 WVDPCanisters, 4,572 SRS
Canisters, and1,700 INELCanisters f
21,612
=40x10=410
= 17
=0.62
= 1,091
=205h
a Excluding current interim storage capacity of 2,286 canisters. It is assumed that SRS will require additional canister storage space above that currently planned(2,286 canisters) because of the unavailability of a national repository at the time the current facility becomes full.
b Decentralization alternative.
c Regionalization alternative, Case 1. Assumes 24 total years for loading/unloading.
d Regionalization alternative, Case 2. Assumes 24 total years for loading/unloading.e Centralization alternative, Case 1. Assumes 38 total years for loading/unloading.
f Centralization alternative, Case 2. Assumes 38 total years for loading/unloading.
g Change in LCC between current design and alternatives.
h Figure does not include the potential LCC savings associated with direct shipment of INEL and SRS canisters to Hunford, without ever placing the HLW canisters ininterim storage at the INEL and SRS, respectively. The potential LCC savings could not be determined due to lack of information.

121
consistent basis. The LCC for HLW transportation can in general be calculated by summing overthe following cost categories:
1. Shipping cost,
2. Security cost,
3. Cask capital and decommissioning cost,
4. Cask maintenance cost,
5. Inspection cost,
6. Demurrage cost,
7. Handling cost (loading and unloading), and
8. Transportation support system costs.
The following assumptions are made in this analysis:
1. The costs associated with the Inspection cost category are included in theannual operating charges for the various HLW interim storage facilities;
2. Demurrage is defined to be the charge for the detention of a freight car ortruck by the shipper or receiver beyond the time allowed for loading,unloading, or shipping. It is assumed to be negligible in comparison with theother cost components (this component is actually not applicable to railshipping);
3. The handling cost for loading and unloading at the HLW interim storagefacility have already been considered; the handling cost at the repository isassumed to be out-of-scope;
4. Transportation support system costs include the costs to maintain the railcarsand trailers which are assumed to be negligible as the average annual O&Mcost is approximately $14,000 for a truck-trailer and $5,000 for a railcar.
The LCC therefore becomes the sum of the shipping, security, cask capital &decommissioning, and cask maintenance costs. The overall cost estimating methodology,assumptions, and cost data used in this analysis are the same as those utilized in the documentEnvironmental Assessment for a Monitored Retrievable Storage Facility, Volume II [DOE 1986a].The transportation cost estimates were however modified to reflect the above assumptions.

122
Other transportation cost models were reviewed for applicability (e.g., [DOE 1987; DOE1991c]). These models either do not consider transportation of HLW canisters (i.e., designed forshipments of spent nuclear fuel) or consider only one mode of transportation. It should be noted thatfair agreement in the various models exists: [DOE 1991c] lists the capital cost of a HLW rail caskto be approximately $3 million (presumably in 1990 dollars) which is equal to the value given in[DOE 1986a] ($2.5 million in 1986 dollars, which escalates to $3 million in 1990 dollars).
The rail and truck distances between the four HLW sites and the repository were providedby the ANL Transportation group. The average rate for rail shipments is not given in [DOE 1986a](the text states that the "average rate . . . varies from 5 km/h for short hauls to 19 km/h for cross-country shipments"). It was however estimated by the following equation, which is based on the U.S.average for a dedicated train shipment [DOE 1991c]:
[Avg. Rail Speed (mph)] = [Distance traveled (one-way miles)7 / (0.04204x [Distance traveled (one-way miles)7 + 4)
The cost relationships assumed in this analysis are presented in Table 5.8. A factor of 1.3 (based onthe GNP Deflator) is used to convert 1985 dollars to BOY 1994 dollars. The number of HLWcanisters to be shipped from site-to-site and to the repository were taken from the HLW alternatives(Chapter 4).
The results of the transportation-cost estimates as a function of HLW alternative arepresented in Table 5.9 for rail-based shipping, and in Table 5.10 for truck-based shipping. In general,cask maintenance costs contribute least to the total cost and represent about 4 to 6 percent of the totaltransportation estimate. The major difference in cost between truck and rail transport is the cost ofsecurity/safeguards; this is due to the regulations that require road shipments within heavilypopulated areas to be accompanied by armed escorts in separate vehicles, with two armed escortsrequired for rail shipments. Cask capital costs for truck transport are less than for rail due to thehigher truck speed assumed in this study which in turn decreases the annual cask requirement.
Comparison of the estimated shipping costs for rail and truck transport are shown inTable 5.11. The estimated transportation cost for the Decentralized alternative is the lowest amongthe four alternatives studied. This reflects the fact that it is less costly to ship HLW canisters fromthe four HLW sites directly to the geologic repository than to ship the HLW canisters to a secondHLW site and then on to the geologic repository, due to the shorter shipping distance. The highestcost is predicted for centralization at Hanford (due to the increased shipping distances) while it isnot possible to distinguish between costs for Regionalization Alternative Cases 1 and 2.

123
TABLE 5.8 Assumed Relationships for the Four Transportation Cost Components
Relationship Assumed in This Study
Cost Variable Rail-Based Truck-Based
SPEED (mph)
Annual Cask Requirement(ACR)
Shipping Cost, less than1,000 miles ($1985)
Shipping Cost, greater than1,000 miles ($1985)
Security Cost ($1985)
Cask Capital Cost ($1985)e
Cask Maintenance Cost($1985)f
DIS/(0.04204 x DIS + 4)a
I {[(2 x DIS)/SPEEDrai,]/24 + 2 x (5days)}c
£ ([2.32+0.0067 x DIS] x 2,000) +([2.15+0.0063 x DIS] x 1,800) x [No.
of Canisters]/5c4
£ ([5.07+0.004 x DIS] x 2,000) +([4.72+0.0037 x DIS] x 1,800) x [No.
of Canisters]/5Cld
£ { 291.65 x [DIS"0S987] x DIS } x[No. of Canisters]/5
£ (ACR/300) x [No. of Canisters] x(2.5 x 10⁵)
£ (ACR/300) x [No. of Canisters] x(2.5 x 10⁴)
35 (i.e., a constant value)
£{[(2xDIS)/SPEED t ruck]/24+ 2 x (3 days)}c
X ([1.493+0.0033 x DIS] x500) + ([0.428+0.0034 x DIS]x 475) x [No. of Canisters]0
£ ([-0.16+0.0049 x DIS] x500) + ([-0.19+0.004 x DIS] x
475) x [No. of Canistersf
£ { 7.93 x [DIS-01855] x DIS }x [No. of Canisters]
£ (ACR/300) x [No. ofCanisters] x (1.5 x 10⁵)
£ (ACR/300) x [No. ofCanisters] x (1.5 x 10⁴)
a DIS = distance traveled (one-way miles); is a function of WM PEIS alternative.b Conservative value, based on DOE (1986a); a value of 40 mph is cited in DOE (1991c).c The summations are to be performed over all shipping routes.d Assumes five HLW canisters per rail shipping cask, one HLW canister per truck shipping cask (DOE
1986a).e Assumes a capital cost of $2.5 million for rail cask, $1.5 million for truck cask (both in $1985 dollars)
(DOE 1986a).f Assumes an annual maintenance cost of $125,000 for rail cask, $75,000 for truck cask (both in $1985
dollars) (DOE 1986a).
This analysis predicts rail transport to be more costly than truck transport, which is ingeneral agreement with the results of the MRS study (DOE 1986a). This study's cost estimate forthe Decentralized alternative is consistent with the estimated cost for defense high-level wastetransportation to a single repository in DOE (1990a).

TABLE 5.9 Rail Transportation Cost for HLW
Total Rail Transportation Cost — No Action
Routefrom
WVDPSRSINELHattford
to
Yucca MountainYucca MountainYucca MountainYucca MountainTOTAL:
Canisters(total)
3404,572
015,00019,912
Distance(miles)
2,5402,839
7561,302
33,373,508
Distance (km)
4,0884,5691,2172,095
53,706,965
ShippingCost ($)
3,799,32355,097,849
1,850,514113,169,960173,917,646
SecurityCost ($)
461,0326,482,663
015,555,23722,498,932
CaskCapitalCost ($)
4,141,17257,682,060
0155,591,708
217,414,940
Mainten. Cost($)
414,1175,768,206
015,559,17121,741,494
Total Rail($1985)
8,815,644125,030,778
1,850,514299,876,076435,573,012
Total Rail($BOY 1994)
1.14E+071.62E+082.40E+063.89E+085.66E+08
Total Rail Transportation Cost—Decentralization
Routefrom
WVDPSRSINELHanford
to
Yucca MountainYucca MountainYucca MountainYucca MountainTOTAL:
Canisters(total)
3404,5721,700
15,00021,612
Distance(miles)
2,5402,839
7561,302
34,658,708
Distance (km)
4,0884,5691,2172,095
55,775,198
ShippingCost ($)
3,799,32355,097,849
1,850,514113,169,960173,917,646
SecurityCost($)
461,0326,482,6631,417,398
15,555,23723,916,329
CaskCapitalCost ($)
4,141,17257,682,06016,278,813
155,591,708233,693,753
Mainten. Cost($)
414,1175,768,2061,627,881
15,559,17123,369,375
Total Rail($1985)
8,815,644125,030,77821,174,606
299,876,076454,897,103
Total Rail($BOY 1994)
1.14E+071.62E+082.75E+073.89E+085.91E+08
Total Rail Transportation Cost—Regionalizatlon Case 1
Routefrom
WVDPSRSINELHanford
to
SRSYucca MountainYucca MountainYucca MountainTOTAL:
Canisters(total)
3404,9121,700
15,00021,952
Distance(miles)
1,2172,839
7561,302
35,174,148
Distance {km)
1,9584,5691,2172,095
56,604,680
ShippingCost ($)
2,480,45159,195,239
1,850,514113,169,960176,696,164
SecurityCost ($)
343,1616,964,7511,417,398
15,555,23724,280,547
CaskCapitalCost ($)
3,484,55961,971,62716,278,813
155,591,708237,326,708
Mainten. Cost($)
348,4566,197,1631,627,881
15,559,17123,732,671
Total Rail($1985)
6,656,627134,328,78021,174,606
299,876,076462,036,089
Total Rail($BOY 1994)
8.64E+061.74E+082.75E+073.89E+O86.00E+08
NJ

TABLE 5.9 (Cont.)
Total Rail Transportation Cost — Regionalization Case 2
Routefrom
WVDPSRSINELHanford
to
HanfordYucca MountainYucca MountainYucca MountainTOTAL:
Canisters(total)
3404,5721,700
15,34021,952
Distance(miles)
2,6542,839
7561,302
35,140,148
Distance (km)
4,2714,5691,2172,095
56,549,965
ShippingCost ($)
3,912,96855,097,849
1,850,514115,735,146176,596,476
SecurityCost ($)
469,2266,482,6631,417,398
15,907,82224,277,109
Cask CapitalCost ($)
4,197,75157,682,06016,278,813
159,118,454237,277,077
Mainten. Cost($)
419,7755,768,2061,627,881
15,911,84523,727,708
Total Rail($1985)
8,999,719125,030,77821,174,606
306,673,267461,878,370
Total Rail($BOY 1994)
1.17E+O71.62E+082.75E+073.98E+086.00E+08
Total Rail Transportation Cost—Centralization Case 1
Routefrom
WVDPSRSINELHanfordSRSINEL
to
HanfordHanfordHanfordYucca MountainYucca MountainYucca MountainTOTAL:
Canisters(total)
3402,373
017,7132,1991,700
24,325
Distance(miles)
2,6542,953
6581,3022,839
75638,500,316
Distance (km)
4,2714,7521,0592,0954,5691,217
61,957,380
ShippingCost($)
3,912,96829,390,545
1,685,647133,638,63326,500,47410,104,446
205,232,713
SecurityCost ($)
469,2263,418,271
018,368,6603,117,9741,417,398
26,791,529
Cask CapitalCost ($)
4,197,15130,333,542
0183,733,06227,743,40616,278,813
262,286,572
Mainten. Cost($)
419,7753,033,354
018,373,3062,774,3411,627,881
26,228,657
Total Rail($1985)
8,999,71966,175,711
1,685,647354,113,66260,136,19429,428,538
520,539,472
Total Rail($BOY 1994)
1.17E+078.59E+O72.19E+064.60E+087.81E+073.82E+076.76E+08
Total Rail Transportation Cost—Centralization Case 2
Routefrom
WVDPSRSINELHanford
to
HanfordHanfordHanfordYucca MountainTOTAL:
Canisters(total)
3404,5721,700
21,61228,224
Distance(miles)
2,6542,953
6581,302
43,660,900
Distance (km)
4,2714,7521,0592,095
70,262,150
ShippingCost ($)
3,912,96856,626,031
1,685,647163,055,278225,279,923
SecurityCost ($)
469,2266,585,8971,340,587
22,411,98530,807,695
Cask CapitalCost ($)
4,197,75158,442,87916,035,623
224,176,533302,852,786
Mainten. Cost($)
419,7755,844,2881,603,562
22,417,65330,285,279
Total Rail($1985)
8,999,719127,499,09420,665,419
432,061,450589,225,682
Total Rail($BOY 1994)
1.17E+071.66E+082.68E+075.61 E+087.65E+08

TABLE 5.10 Truck Transportation Cost for HLW
Total Truck Transportation Cost — No Action
Routefrom
WVDPSRSINELHanford
to
Yucca MountainYucca MountainYucca MountainYucca MountainTOTAL:
Canisters(total)
3404,572
015,00019,912
Distance(miles)
2,4072,448
7461,162
29,440,636
Distance (km)
3,8743,9391,2011,870
47,377,914
ShippingCost ($)
3,502,06847,907,931
073,266,750
124,676,749
SecurityCost($)
1,530,96220,872,108
037,322,85359,725,923
CaskCapitalCost ($)
1,994,26227,040,114
065,750,00094,784,376
Mainten. Cost($)
267,4263,618,411
09,575,000
13,460,838
TotalTruck
($1985)
7,294,71899,438,564
0185,914,603191,647,885
Total Truck($BOY 1994)
9.61E+061.31E+080.00E+0O2.45E+083.86E+08
Total Truck Transportation Cost—Decentralization
Routefrom
WVDPSRSINELHanford
to
Yucca MountainYucca MountainYucca MountainYucca MountainTOTAL:
Canisters(total)
3404,5721,700
15,00021,612
Distance(miles)
2,4072,448
7461,162
30,708,836
Distance (km)
3,8743,9391,2011,870
49,418,790
ShippingCost ($)
3,502,06847,907,9315,227,245
73,266,750129,903,994
SecurityCost ($)
1,530,96220,872,1082,948,274
37,322,85362,674,197
CaskCapitalCost ($)
1,994,26227,040,1146,609,762
65,750,000101,394,138
Mainten. Cost($)
267,4263,618,4111,000,9769,575,000
14,461,814
Total Truck($1985)
7,294,71899,438,56415,786,257
185,914,603308,434,143
Total Truck($BOY 1994)
9.61E+061.31E+082.08E+072.45E+084.06E+08
Total Truck Transportation Cost—Regionalization Case 1
Routefrom
WVDPSRSINELHanford
to
SRSYucca MountainYucca MountainYucca MountainTOTAL:
Canisters(total)
3404,9121,700
15,00021,952
Distance(miles)
8832,448
7461,162
31,022,996
Distance (km)
1,4213,9391,2011,870
49,924,358
ShippingCost ($)
1,248,07251,470,6385,227,245
73,266,750131,212,705
SecurityCost ($)
676,45222,424,2772,948,274
37,322,85363,371,856
Cask CapitalCost ($)
1,377,40529,050,971
6,609,76265,750,000
102,788,138
Mainten. Cost($)
205,7403,887,4971,000,9769,575,000
14,669,214
Total Truck($1985)
3,507,669106,833,383
15,786,257185,914,603312,041,913
Total Truck($BOY 1994)
4.62E+061.41E+082.08E+072.45E+084.11E+08

TABLE 5.10 (Cont.)
Total Truck Transportation Cost — Regionalization Case 2
Routefrom
WVDPSRSINELHanford
to
HanfordYucca MountainYucca MountainYucca MountainTOTAL:
Canisters(total)
3404,5721,700
15,34021,952
Distance(miles)
2,5562,448
7461,162
31,154,576
Distance (km)
4,1133,9391,2011,870
50,136,106
ShippingCost ($)
3,722,43947,907,9315,227,245
74,927,463131,785,078
SecurityCost ($)
1,607,72020,872,1082,948,274
38,168,83863,596,940
CaskCapitalCost ($)
2,054,57127,040,1146,609,762
67,240,333102,944,781
Mainten. Cost($)
273,4573,618,4111,000,9769,792,033
14,684,878
Total Truck($1985)
7,658,18899,438,56415,786,257
190,128,668313,011,677
Total Truck($BOY 1994)
1.01E+071.31E+082.08E+072.50E+084.12E+08
Total Truck Transportation Cost—Centralization Case 1
Routefrom
WVDPSRSINELHanfordSRSINEL
to
HanfordHanfordHanfordYucca MountainYucca MountainYucca MountainTOTAL:
Canisters(total)
3402,373
017,7132,1991,700
24,325
Distance(miles)
2,5562,727
5991,1622,448
74634,574,069
Distance (km)
4,1134,388
9641,8703,9391,201
55,638,991
ShippingCost ($)
3,722,43927,745,591
086,518,26323,042,3315,227,245
146,255,869
SecurityCost ($)
1,607,72011,828,685
044,073,31310,038,8812,948,274
70,496,874
CaskCapitalCost ($)
2,054,57114,822,775
077,641,98313,005,5146,609,762
114,134,606
Mainten. Cost($)
273,4571,956,878
011,306,7981,740,3511,000,976
16,278,461
Total Truck($1985)
7,658,18856,353,928
0219,540,35847,827,07815,786,257
347,165,809
Total Truck($BOY 1994)
1.01E+077.42E+070.00E+002.89E+086.30E+072.08E+074.57E+08
Total Truck Transportation Cost—Centralization Case 2
Routefrom
WVDPSRSINELHanford
to
HanfordHanfordHanfordYucca MountainTOTAL:
Canisters(total)
3404,5721,700
21,61228,224
Distance(miles)
2,5562,727
5991,162
39,468,328
Distance (km)
4,1134,388
9641,870
63,515,172
ShippingCost ($)
3,722,43953,456,7384,140,180
105,562,733166,882,091
SecurityCost ($)
1,607,72022,790,0332,465,677
53,774,76780,638,197
Cask CapitalCost ($)
2,054,57128,558,6716,312,262
94,732,600131,658,105
Mainten. Cost($)
273,4573,770,267
971,22613,795,66018,810,610
Total Truck($1985)
7,658,188108,575,71013,889,346
267,865,760397,989,003
Total Truck($BOY 1994)
1.01E+071.43E+081.83E+073.53E+085.24E+08
XI
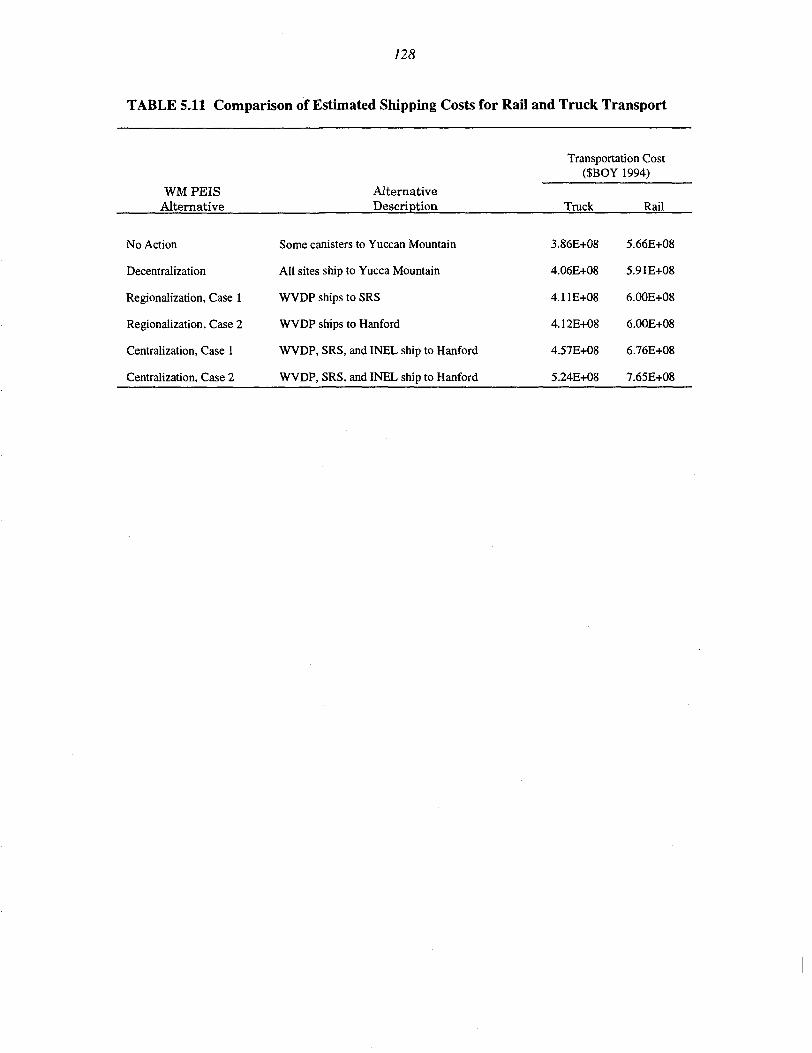
128
TABLE 5.11 Comparison of Estimated Shipping Costs for Rail and Truck Transport
WM PEISAlternative
No Action
Decentralization
Regionalization, Case 1
Regionalization, Case 2
Centralization, Case 1
Centralization, Case 2
AlternativeDescription
Some canisters to Yuccan Mountain
All sites ship to Yucca Mountain
WVDP ships to SRS
WVDP ships to Hanford
WVDP, SRS, and INEL ship to Hanford
WVDP, SRS, and INEL ship to Hanford
Transportation Cost($BOY 1994)
Truck
3.86E+08
4.06E+08
4.11E+08
4.12E+08
4.57E+08
5.24E+08
Rail
5.66E+08
5.91E+08
6.00E+08
6.0OE+O8
6.76E+08
7.65E+08

129
6 UNCERTAINTIES ASSOCIATED WITH HLW
Uncertainties must be addressed in regulatory analyses, both for risk and cost measures.Uncertainties associated with risk assessments are generally difficult to estimate because bestestimates of the relevant parameters are generally applied. The uncertainties in the source termsdelivered to ORNL for calculation of health effects are in part due to uncertainties associated withthe following tasks that were used to determine those source terms:
1. Waste characterization (inventory, isotopic and chemical composition,physical form),
2. Technology listing (technical information on existing and planned facilities),and
3. Facility assessment (for new facilities required for the various WM PEISalternatives).
The uncertainties for the above components are addressed below.
6.1 WASTE CHARACTERIZATION
The reference case inventories used in this analysis are based on the most recent NEPAliterature at the time of the Final WM PEIS (DOE 1996). However, the waste inventories assumedin this analysis may change due to the effect of changing regulatory and legal requirements on futurewaste generation (e.g., more rigid compliance or disciplines in operations than in the past).
This analysis assumes that the final waste form for the INEL HLW is based on aborosilicate glass contained within a "hybrid" spent fuel repository canister. It should be noted thatthe other three HLW sites assume a standard DWPF canister size of 0.62 m3.
The projected startup date for the INEL immobilization facility is assumed in this study tobe FY 2015; however, the recent INEL sitewide EIS included an alternative that considers start ofHLW immobilization operations in FY 2008. This difference should not significantly impact thetotal number of canisters produced at the INEL, nor their radioactive content.
Other uncertainties concerning the total number of HLW canisters at the INEL are asfollows:
• The technologies for HLW pretreatment are currently under investigation andmay change radically in the future as a result of current R&D activities.

130
• The waste loading (i.e., how much high-activity waste can be placed in asingle HLW canister without exceeding thermal power and activitylimitations) is currently uncertain awaiting R&D activities and a performanceassessment of the projected canister contents within the national geologicrepository. A change in the waste loading from that assumed in the documentICPP Radioactive Liquid and Calcine Waste Technologies Evaluation InterimReport (WINCO 1994) will result in a revised number of canisters at theLNEL.
HLW vitrification is underway at the DWPF at the SRS. Uncertainties concerning the totalnumber of HLW canisters at the SRS are as follows:
• A number of recent EISs such as the Interim Management of NuclearMaterials (DOE 1995g) deal with potential reprocessing of existing nuclearmaterials resulting in additional HLW generation at the SRS. The EISs thatcould impact the future inventory of HLW at the SRS are listed in Chapter 1of the Final WMPEIS.
• As operations continue to occur at the DWPF, changes to the current treatmentprocess may be implemented which would impact the canister inventory.These operational changes may be enacted due to changes in the HLWinventory resulting from actions such as recovery of highly enriched uranium,processing of plutonium-238 materials, etc. which would change the chemicaland radiological composition of the HLW inventory from that applied in thedesign of the DWPF.
The current Hanford approach is to blend the HLW retrieved from all 177 tanks prior topretreatment. In this case, the canisters will have significantly lower values for radioactive contentand thermal power than assumed in this analysis. However, because of uncertainty concerning tankretrieval and pretreatment, the data used in this study for the canister radioactivity are based on theHLW in the 10 DSTs at Hanford. This should result in conservative estimates for the risk analysis.
The specific disposal method for the cesium and strontium capsules at Hanford has not beenselected. This study assumes that the capsules would be placed in overpacks for repositoryemplacement. Another option is to blend the cesium and strontium with the existing HLW liquid atHanford prior to vitrification. The increase in the number of HLW canisters likely to be producedat Hanford, as well as the radionuclide content of the canisters, cannot be quantified due to lack ofinformation on the waste loading that could be achieved.
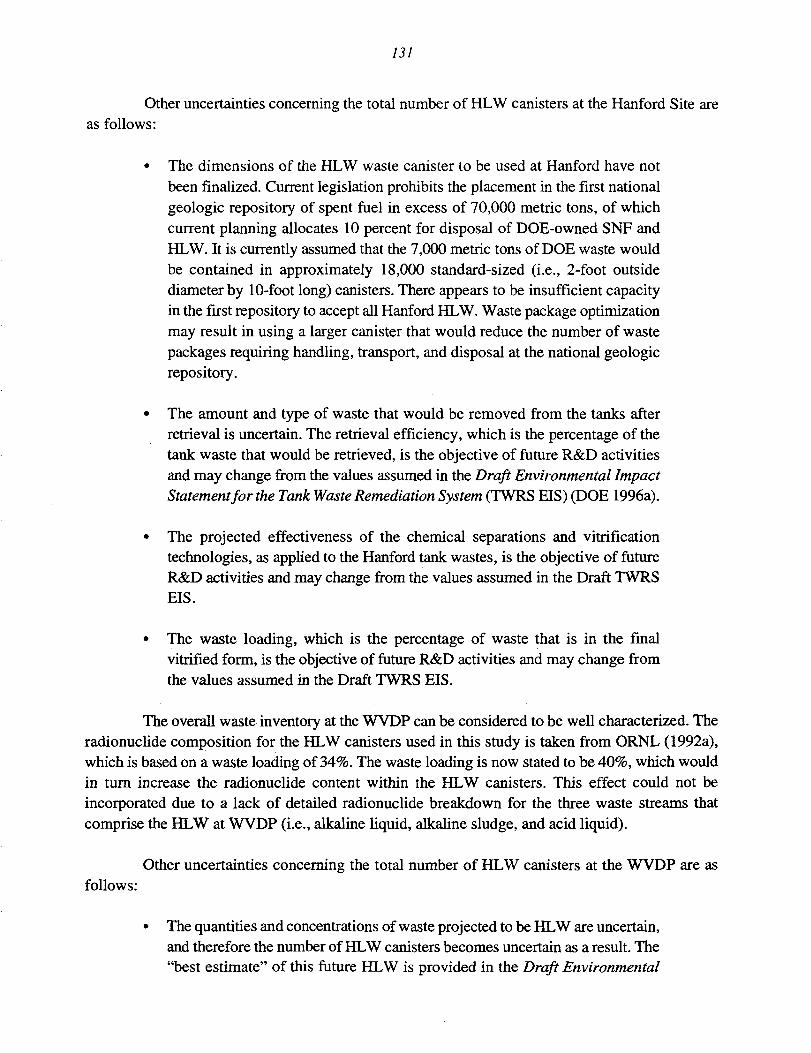
131
Other uncertainties concerning the total number of HLW canisters at the Hanford Site areas follows:
• The dimensions of the HLW waste canister to be used at Hanford have notbeen finalized. Current legislation prohibits the placement in the first nationalgeologic repository of spent fuel in excess of 70,000 metric tons, of whichcurrent planning allocates 10 percent for disposal of DOE-owned SNF andHLW. It is currently assumed that the 7,000 metric tons of DOE waste wouldbe contained in approximately 18,000 standard-sized (i.e., 2-foot outsidediameter by 10-foot long) canisters. There appears to be insufficient capacityin the first repository to accept all Hanford HLW. Waste package optimizationmay result in using a larger canister that would reduce the number of wastepackages requiring handling, transport, and disposal at the national geologicrepository.
• The amount and type of waste that would be removed from the tanks afterretrieval is uncertain. The retrieval efficiency, which is the percentage of thetank waste that would be retrieved, is the objective of future R&D activitiesand may change from the values assumed in the Draft Environmental ImpactStatement for the Tank Waste Remediation System (TWRS EIS) (DOE 1996a).
• The projected effectiveness of the chemical separations and vitrificationtechnologies, as applied to the Hanford tank wastes, is the objective of futureR&D activities and may change from the values assumed in the Draft TWRSEIS.
• The waste loading, which is the percentage of waste that is in the finalvitrified form, is the objective of future R&D activities and may change fromthe values assumed in the Draft TWRS EIS.
The overall waste inventory at the WVDP can be considered to be well characterized. Theradionuclide composition for the HLW canisters used in this study is taken from ORNL (1992a),which is based on a waste loading of 34%. The waste loading is now stated to be 40%, which wouldin turn increase the radionuclide content within the HLW canisters. This effect could not beincorporated due to a lack of detailed radionuclide breakdown for the three waste streams thatcomprise the HLW at WVDP (i.e., alkaline liquid, alkaline sludge, and acid liquid).
Other uncertainties concerning the total number of HLW canisters at the WVDP are asfollows:
• The quantities and concentrations of waste projected to be HLW are uncertain,and therefore the number of HLW canisters becomes uncertain as a result. The"best estimate" of this future HLW is provided in the Draft Environmental

132
Impact Statement for Completion of the West Valley Demonstration Projectand Closure or Long-Term Management of Facilities at the Western NewYork Nuclear Service Center (DOE and NYSERDA 1996).
6.2 TECHNOLOGY LISTING
Information about the characteristics of existing and planned facilities was taken from avariety of literature sources that tended to agree with each other. Uncertainty exists in the design ofcertain facilities as described below.
The DOE is considering building two vitrification plants at Hanford, one for LLW and theother for HLW (Kramer 1993). The processing rate of the HLW vitrification facility will be affectedby the pretreatment option selected. Pretreatment reduces the amount of waste feed to theimmobilization plant; therefore, the number of HLW canisters is dependent on the extent of thepretreatment performed. The previous DOE approach was to remove strontium, cesium, technetium,and TRUW elements from the soluble salts, which would be then combined with sludges and otherstreams containing high concentrations of fission products and TRUW elements. The vitrificationfacility design used in the WM PEIS was based on this approach. Pretreatment may now potentiallyinclude an ion-exchange process for extracting cesium and strontium from the liquid portion of thewaste and sludge washing for dealing with the precipitate at the bottom of the tanks. The exactpretreatment option is to be assessed between 1994 and 1997; a design for the HLW pretreatmentfacility is to be completed by March 1998. The vitrification facility design used in this study,therefore, may not be the final design used to immobilize the HLW at Hanford. Due to theuncertainty in assessing which pretreatment approach will be taken in the future, it is not possibleto quantify its effect on the resource requirements (both construction and operations) for the futureHanford High Level Waste Vitrification Facility.
6.3 FACILITY ASSESSMENT
The Facility Assessment of new HLW facilities in the WM PEIS focused primarily oninterim storage of the vitrified HLW glass canisters. The various resource requirements for bothconstruction (e.g., amount of structural steel) and operations (e.g., number of operating personnel)were determined by parametric scaling, based on an extensive literature review for similar facilitydesigns. Modular sizing is dependent upon parameters such as loading capacity (HLW canisters/yr),storage capacity (number of HLW canisters), total heat release, and local thermal conditions. It wasassumed in this study that the last two variables did not significantly affect various cost andperformance characteristics of the interim storage facilities. The correlation coefficient (R ) of thevarious correlations was always > 0.95, and generally > 0.99. Over the range in which thecorrelations were applied, it could be expected that some uncertainty could exist on the absolute

133
value for the different variables. This uncertainty should only be small (generally on the order of10%) and can only be quantified on a variable-by-variable basis.
For comparison of interim storage facility designs for HLW with SNF, it was assumed thata HLW canister is equivalent to 0.5 MTHM of spent fuel. Analysis of the HLW canisters for SRSand Hanford indicates a heavy metal content greater than 0.5 MTHM (a difference < 10%). Giventhat the exponent for all correlations was always less than unity, this means that the resourcerequirements could be underestimated by a maximum of 10%.
The resource requirements during the loading/unloading phase of interim HLW glasscanister storage were determined assuming a constant uniform shipping rate. The shipping rate ofHLW canisters could be expected to vary over time due to variations in the production rate of thevitrification facility with time. The effect of this variation on the operations resource requirementscannot be quantified but could be expected to be not greater than one order of magnitude.
This study was directed to assume that DOE would construct interim glass canister storagefacilities based on a modular design. The model for future storage was taken to be the GWSB atSRS. The capacity of each module was assumed to range from 2,200 to 2,900 canisters. Therefore,storage of a total of 21,612 HLW canisters at a single centralized site would require 10 interimstorage facilities. The economies-of-scale associated with construction and operation of a singlefacility compared with a series of smaller facilities with lower capacities were not addressed,although they may be considerable (e.g., a total occupied land of 4.3 ha for 10 small facilities versus1.5 ha for one large facility and a capital cost of $410 million for 10 facilities versus $140 millionfor one facility).
The number of canisters that may be placed on top of each other is determined by thethermal power of the canisters and the heat removal rate of the glass canister storage facility. TheGWSB at SRS does not allow for stacking of HLW canisters on top of each other. The interim HLWcanister storage design previously advanced at Hanford (Boomer 1992; Braun et al. 1993) wouldstack up to three canisters within a single storage sleeve. Exclusion of stacking for Hanford'scanisters could increase the land occupied by the interim storage facility by up to three times.

134
7 REFERENCES
Ball, J.R., et al., 1984, A Handbook for Cost Estimating, NUREG/CR-3971, U.S. NuclearRegulatory Commission, Office of Resource Management, Washington, D.C.
Ballou, L.B., 1989, Current Status of Waste Package Designs for the Yucca Mountain Project,UCRL-100790, Lawrence Livermore National Laboratory, Livermore, Calif.
Barnes, S.M., et al., 1988, "Three Year's Progress of the West Valley Demonstration ProjectVitrification System," in Proceedings of Waste Management '88, Feb. 28-March 3,1988, Tucson,Ariz., pp. 195-202.
Baxter, R.G., 1988, Defense Waste Processing Facility Waste Form and Canister Description,DP-1606-Rev.2, E.I. DuPont de Nemours and Company Inc., Savannah River Laboratory, Aiken,S.C.
Berreth, J.R., 1988, Inventories and Properties oflCPP Calcined High-Level Waste, WINCO-1050DE88 006562, prepared by Westinghouse Idaho Nuclear Co. Inc., Idaho Falls, Idaho, for U.S.Department of Energy, Idaho Operations Office, Idaho Falls, Idaho.
Berreth, J.R., and D.A. Knecht, 1987, "Potential Process Options to Minimize Immobilized HLWVolume at the Idaho Chemical Processing Plant," in Proceedings of Spectrum '86, Volume 2,Sept. 14-18, 1986, Niagara Falls, N.Y., pp. 1905-1914.
Bolon, W.D., and L.O. Nelson, 1992, "Treatment Options for High-Level Radioactive Waste at theIdaho Chemical Processing Plant," in Spectrum '92: Proceedings of the International TopicalMeeting on Nuclear and Hazardous Waste Management, Aug. 23-27, 1992, Boise, Idaho,pp. 942-951.
Bolon, W.D., et al., 1991, Status Report: The Glass-Ceramic Processing Flowsheet for ICPP High-Level Waste, WDSfCO-1090, Westinghouse Idaho Nuclear Co., Idaho Falls, Idaho.
Boomer, K., 1992, Tank Waste Systems Engineering Study, WHC-EP-0405-Rev. 0, prepared byWestinghouse Hanford Co., Richland, Wash., for U.S. Department of Energy, Office ofEnvironmental Restoration and Waste Management, Washington, D.C.
Borisch, R.R., et al., 1988, "Construction and Cold Testing of the West Valley SupernatantTreatment System," in Proceedings of Waste Management '88, Feb. 28-March 3, 1988, Tucson,Ariz., p. 831.

135
Braun, D.J., et al., 1993, "Hanford Waste Vitrification Building Limited Scope Risk Assessment,"in Proceedings of the International Topical Meeting on Probabilistic Safety Assessment, PSA '93,Vol. 1, American Nuclear Society, La Grange, 111., pp. 458-464.
Brown, M.J., et al., 1990, Westinghouse Hanford Company Effluent Discharges and Solid WasteManagement Report for Calendar Year 1989: 200/600 Areas, WHC-EP-0141-2, WestinghouseHanford Co., Richland, Wash.
Brown, S.H., and J.W. Gordon, 1988, "Development of Site Specific Radiological DecommissioningCriteria for a High-Level Waste Processing and Vitrification Project," in Proceedings of WasteManagement '88, Feb. 28-March 3, 1988, Tucson, Ariz., pp. 603-609.
Buice, J., 1992, personal communication from Buice (General Accounting Office, Washington,D.C.), to G. Conzelmann (Argonne National Laboratory, Argonne, 111.), Oct.
Carlson, M.K., 1989, Vitrification at the Savannah River Site, WSRC-RP-89-782, WestinghouseSavannah River Co., Aiken, S.C.
Choi, A.S., and J.R. Fowler, 1990, Material Balance Tables for the DWPF Basic Data Report.Revision 138: Appendix G, Table 19-1, WSRC-TR-90-93, Westinghouse Savannah River Co.,Aiken, S.C.
Christensen, A.B., et al., 1986, "Lessons Learned during Start-Up of a Facility for Storing SpentLWBR Fuel in Dry Wells at the Idaho Chemical Processing Plant," in Proceedings of the ThirdInternational Spent Fuel Storage Technology Symposium/Workshop, April 8-10, 1986, Seattle,Wash., pp. S-156-S-174.
Cornelius, K., 1994, HLW Options Study for INEL, memorandum from Cornelius (Argonne NationalLaboratory, Washington, D.C.), to S. Folga (Argonne National Laboratory, Argonne, HI.), April 7.
Daling, P.M., et al., 1992, Preliminary Characterization of Risks in the Nuclear Waste ManagementSystem Based on Information in the Literature, PNL-6099, prepared by Pacific NorthwestLaboratory, Richland, Wash., for U.S. Department of Energy, Office of Civilian Radioactive WasteManagement, Washington, D.C.
Davis, H.A., et al., 1989, Savannah River Site Environmental Report for 1988 (U),WSRC-RP-89-59-1, Vol. 1 Text, prepared by Westinghouse Savannah River Co., Aiken, S.C., forU.S. Department of Energy, Washington, D.C.
DOC: See U.S. Department of Commerce.

136
DOE: See U.S. Department of Energy.
Ernold, L.F., et al., 1993, "Disposal of Defense Spent Fuel and HLW from the Idaho ChemicalProcessing Plant," in Proceedings of the Fourth Annual International Conference, High LevelRadioactive Waste Management, April 26-30, 1993, Las Vegas, Nev., pp. 1200-1206.
Feizollahi, F., and D. Shropshire, 1993, Waste Management Facilities Cost Information Report forGreater-Than-Class C and DOE Equivalent Special Case Waste, EGG-WM-10701, EG&G Idaho,Idaho Falls, Idaho, July.
Fletcher, J.F., and R.I. Smith, 1989, Re-Evaluation of Monitored Retrievable Storage Concepts,PNL-5176-Add.l, prepared by Pacific Northwest Laboratory, Richland, Wash., for U.S. Departmentof Energy, Washington, D.C.
GAO: See General Accounting Office.
General Accounting Office, 1992, Defense Waste Processing Facility — Cost, Schedule, andTechnical Issues, GAO/RCED-92-183, Washington, D.C.
General Accounting Office, 1993, Hanford Tank Waste Program Needs — Cost, Schedule, andManagement Changes, GAO/RCED-93-99, Washington, D.C.
Grantham, L.F., et al., 1983, Process Description and Plant Design for Preparing Ceramic High-Level Waste Forms, DOE/ET/41900-16, prepared by Rockwell International, Energy SystemsGroup, Canoga Park, Calif., for U.S. Department of Energy, Washington, D.C.
Grygiel, M.L., 1991, Tank Waste Disposal Program Redefinition, WHC-EP-0475, prepared byWestinghouse Hanford Co., Richland, Wash., for U.S. Department of Energy, Washington, D.C.
Gurley, R.N., and J.E. Minor, 1985, "Hanford Waste Vitrification, An Overview," in Proceedingsof Waste Management '85, Volume I, March 24-28,1985, Tucson, Ariz., pp. 179-184.
Hanlon, B.M., 1992, Tank Farm Surveillance and Waste Status Summary Report for June 1992,WHC-EP-0182-51, prepared by Westinghouse Hanford Co., Richland, Wash., for U.S. Departmentof Energy, Office of Environmental Restoration and Waste Management, Washington, D.C.
Helminski, E.L., 1993, "DOE, EPA, State of Washington Reach New Agreement at Hanford,"Weapons Complex Monitor 5(7):3-7.

137
Herborn, D.I., and D. A. Smith, 1990, Hanford Waste Vitrification Plant Preliminary Safety AnalysisReport, WHC-EP-0250-Draft-Rev. B-Vol. 3, prepared by Westinghouse Hanford Co., Richland,Wash., for U.S. Department of Energy, Washington, D.C.
Hobbs, D.T., et al., 1992, "Hydrogen Generation Rates in Savannah River Site High-Level NuclearWaste," in Proceedings of Waste Management '92, March 1-5,1992, Tucson, Ariz., pp. 1063-1066.
Hunter, C.H., 1990, Dispersion Calculations for Non-Radiological Hazardous Chemical Emissionsfrom the Defense Waste Processing Facility and Related Activities, WSRC-RP-90-1209,Westinghouse Savannah River Co., Aiken, S.C.
Idaho Nuclear Corporation, 1974, New Waste Calcining Facility, Environmental Statement,WASH-1531, Idaho Falls, Idaho.
Idaho Operations Office, 1982, Environmental Evaluation of Alternatives for Long-TermManagement of Defense High-Level Radioactive Wastes at the Idaho Chemical Processing Plant,IDO-10105, Idaho Falls, Idaho.
IDO: See Idaho Operations Office.
INC: See Idaho Nuclear Corporation.
E.R. Johnson Associates Inc., 1989, Acceptance of Canisters of Consolidated Spent Nuclear Fuelby the Federal Waste Management System, Draft, June.
Johnson, M., 1992, personal communication from Johnson (Westinghouse Hanford Co., Richland,Wash.), to L. Poch (Argonne National Laboratory, Argonne, 111.), Oct. 20.
Jungfleisch, F.M., 1983, Preliminary Estimation of the Waste Inventories in Hanford Tanks Through1980, SD-WM-TI-057, Rockwell Hanford Operations, Richland, Wash.
Kennedy, R.P., et al., 1990, Design and Evaluation Guidelines for Department of Energy FacilitiesSubjected to Natural Phenomena Hazards, UCRL-15910, Lawrence Livermore National Laboratory,Livermore, Calif.
Knecht, D.A., 1992, personal communication from Knecht (Westinghouse Idaho Nuclear Company,Inc., Idaho Falls, Idaho), to S. Folga (Argonne National Laboratory, Argonne, 111.). Sept. 11.
Knecht, D.A., and J.R. Berreth, 1989, The Management of Defense High-Level Radioactive Wasteat the Idaho Chemical Processing Plant, WINCO-1063, Westinghouse Idaho Nuclear Co., IdahoFalls, Idaho.

138
Kramer, D., 1993, "New Hanford Pact Relies on Cleanup Technologies Not Yet Selected," InsideEnergy, p. 7, Oct. 11.
Krieg, S.A., et al., 1990, Single-Shell Tank Waste Retrieval Study, WHC-EP-0352, prepared byWestinghouse Hanford Co., Richland, Wash., for U.S. Department of Energy, Office ofEnvironmental Restoration and Waste Management, Washington, D.C.
LaRue, J.H., and S.I. Cross, 1991, "Permitting of the Hanford Waste Vitrification Plant," inProceedings of Waste Management '91, Feb. 28-March 3, 1991, Tucson, Ariz., pp. 459-464.
Lowe, S.S., 1991, Preliminary Material Balance for Pretreatment of NCAW, NCRW, PFP, and CCWastes, WHC-SD-WM-TI-492-Rev. 0, prepared by Westinghouse Hanford Co., Richland, Wash.,for U.S. Department of Energy Field Office, Richland, Wash.
McCray, J.A., and R.D. Boardman, 1992, "The NOX Abatement Program at the Idaho ChemicalProcessing Plant," in Spectrum '92, Proceedings of the International Topical Meeting on Nuclearand Hazardous Waste Management, Aug. 23-27, 1992, Boise, Idaho, pp. 174-178.
Mclntosh, D.L., and L.M. Papouchado, 1990, "High Level Radioactive Waste Management at theSavannah River Site," in Proceedings of High Level Radioactive Waste Management, Vol. 2,April 8-12, 1990, Las Vegas, Nev., pp. 794-801.
Mclntosh, T.W., et al., 1988, "An Overview of Waste Management Systems at the West ValleyDemonstration Project," in Proceedings of Waste Management '88, Feb. 28-March 3,1988, Tucson,Ariz., pp. 785-790.
Mclntosh, T.W., et al., 1992, 'The West Valley Demonstration Project: A Decade of Progress," inProceedings of Waste Management '92, March 1-5, 1992, Tucson, Ariz., p. 1011.
McKibben, J.M., et al., 1990, "Design and Construction of the Defense Waste Processing Facility,"in Proceedings of Waste Management '90, Vol. 2, Feb. 25-March 1, 1990, Tucson, Ariz.,pp. 853-859.
Mitchell, D.E., and J.L. Nelson, 1988, Hanford Waste Vitrification Plant Preliminary Descriptionof Waste Form and Canister —FY1988 Update, WHC-EP-0008 Rev. 1, Westinghouse HanfordCo., Richland, Wash.
Nebeker, R.L., and D. Gombert n, 1989, "Required Development and Installation of NOX AbatementProcess at the Idaho Chemical Processing Plant," in Proceedings of Waste Management '89,Feb. 26-March 2, 1989, Tucson, Ariz., pp. 287-291.
139
Nyman, D.H., et al., 1993, Description of a Multipurpose Processing and Storage Complex forHanford's Site Radioactive Material, WHC-SA-1773-FP, prepared by Westinghouse Hanford Co.,Richland, Wash., for U.S. Department of Energy, Washington, D.C.
Oak Ridge National Laboratory, 1992a, Characteristics of Potential Repository Wastes,DOE/RW-0184-R1, U.S. Department of Energy, Washington, D.C.
Oak Ridge National Laboratory, 1992b, Integrated Data Base for 1992: U.S. Spent Fuel andRadioactive Waste Inventories, Projections, and Characteristics, DOE/RW-0006, Rev. 8,U.S. Department of Energy, Washington, D.C.
Oak Ridge National Laboratory, 1995, Integrated Data Base Report— 1994: U.S. Spent NuclearFuel and Radioactive Waste Inventories, Projections, and Characteristics, DOE/RW-0006, Rev. 11,prepared for the U.S. Department of Energy Office of Civilian Waste Management, Oak Ridge,Tennessee, Sept.
Opitz, B.E., et al., 1990, Long-Term Management of Hanford Site Single-Shell Tank Waste,WHC-SA-0646, Westinghouse Hanford Company, Richland, Wash., May.
ORNL: See Oak Ridge National Laboratory.
Pacific Northwest Laboratory, 1989, Twentieth Annual Report: Radiation Exposures for DOE andDOE Contractor Employees—1987, DOE/EH-0128, U.S. Department of Energy, Washington, D.C.
Peters, F.E., and D.R. Leap, 1987, Preliminary Design of the High-Level Waste Canister StorageSystem, DOE/NE/44139-40, prepared by West Valley Nuclear Service Co., Inc., West Valley, N.Y.,for U.S. Department of Energy, Washington, D.C.
Ploetz, D.K., and I.M. Leonard, 1988, Supernatant Treatment System Design through Testing,DOE/NE/44139-47, prepared by West Valley Nuclear Services Co., Inc., West Valley, N.Y., for U.S.Department of Energy, Washington, D.C.
PNL: See Pacific Northwest Laboratory.
Salmon, R., and K.J. Notz, 1991, "A Comparison of High-Level Waste Form Characteristics," inProceedings of the Second Annual International Conference on High Level Radioactive WasteManagement, April 28-May 3, 1991, Las Vegas, Nev., pp. 1126-1131.
Saylor, R.E., et al., 1990, Data Package for the Atomic Vapor Laser Isotope Separation (AVLIS)Plant Environmental Impact Statement, ORNl/TM-11482, Oak Ridge National Laboratory, OakRidge, Tenn.

140
Schiffhauer, M.A., and S.C. Thompson, 1993, "Installation, Start-Up and Operation of a PUREXHLW Sludge Mobilization and Wash System at the West Valley Demonstration Project," inProceedings of Waste Management '93, Feb. 28-March4, 1993, Tucson, Ariz., pp. 957-962.
Schindler, R.E., 1991, Distribution of Airborne Emissions Evaluation for the HLWTFR Project,interoffice memorandum from Schindler to P.B. Summers (Westinghouse Idaho Nuclear Co., Inc.,Idaho Falls, Idaho), May 16.
Simpson, B., 1993, personal communication from Simpson (Westinghouse Hanford Company,Richland, Wash.) to L. Poch (Argonne National Laboratory, Argonne, 111.), Jan. 25.
State of Idaho, 1989, "INEL Permit to Construct FPR/ICPP/NWCF to State of Idaho, ApplicationNo. 0340-0001-30," Aug. 11.
State of South Carolina, 1984, Construction Permit Application, Defense Waste Processing Facility(DWPF), Savannah River Plant (SRP), Columbia, S.C., April 17.
Stegen, G., 1992, personal communication from Stegen (Westinghouse Hanford Co., Richland,Wash.), to L. Poch (Argonne National Laboratory, Argonne, 111.), Sept. 22.
Street, G.H., et al., 1992, SRS Waste Cost Analysis, WSRC-RP-92-631, Westinghouse SavannahRiver Co., Aiken, S.C.
Tang, Y.S., and J.H. Saling, 1990, Radioactive Waste Management, Hemisphere PublishingCorporation, New York, N.Y.
TPA: See Tri-Party Agreement.
Tri-Party Agreement, 1994, Hanford Federal Facility Agreement and Consent Order, FourthAmendment, Jan.
Uldrich, E.D., and L.E. Malik, 1991, Seismic Analysis of the ICPP High Level Liquid Waste Tanksand Vaults, WINCO-11725, Westinghouse Idaho Nuclear Co. Inc., Idaho Falls, Idaho.
United Engineers & Constructors Inc., 1977, Capital Cost: Boiling Water Reactor Plant,Commercial Electric Power Cost Studies, Volume 2, NUREG-0242, U.S. Nuclear RegulatoryCommission, Washington, D.C.
U.S. Congress, 1983, Nuclear Waste Policy Act of 1982, Public Law 97-425.
U.S. Department of Commerce, 1994, Survey of Current Business, 74(1):21, Jan.

141
U.S. Department of Energy, 1979, Long-Term Management of Defense High-Level RadioactiveWastes: Research and Development Program for Immobilization, DOE/EIS-0023, Washington, D.C.
U.S. Department of Energy, 1982a, Final Environmental Impact Statement — Defense WasteProcessing Facility, Savannah River Plant, Aiken, S.C., DOE/EIS-0082, UC70, Washington, D.C.
U.S. Department of Energy, 1982b, Long-Term Management of Liquid High-Level RadioactiveWastes Stored at the Western New York Nuclear Service Center, West Valley, DOE/EIS-0081,Washington, D.C.
U.S. Department of Energy, 1983, The Defense Waste Management Plan, DOE/DP-0015,Washington, D.C.
U.S. Department of Energy, 1986a, Environmental Assessment for a Monitored Retrievable StorageFacility, DOE/RW-0035/1, Vol. 2, Office of Civilian Radioactive Waste Management, Washington,D.C.
U.S. Department of Energy, 1986b, "Environmental, Safety, and Health Program for DOEOperations," DOE Order 5480.1 A, Washington, D.C., Sept. 23.
U.S. Department of Energy, 1986c, Perspective on Methods to Calculate a Fee for Disposal ofDefense High-Level Waste in Combined (Civilian Defense) Repositories, DOE/RL-86-10,Washington, D.C.
U.S. Department of Energy, 1987, Final Environmental Impact Statement, Disposal ofHanfordDefense High-Level, Transuranic and Tank Wastes, DOE/EIS-0113, Washington, D.C.
U.S. Department of Energy, 1988a, "Disposal ofHanford Defense High-Level, Transuranic, andTank Wastes, Hanford Site, Richland, Washington; Record of Decision (ROD)," Federal Register 53(72): 12449-12453, April 14.
U.S. Department of Energy, 1988b, "Radioactive Waste Management," DOE Order 5820.2A,Washington, D.C., Sept. 26.
U.S. Department of Energy, 1989a, Savannah River Waste Management Program Plan — FY1990,DOE/SR-WM-90-1, Savannah River Operations Office, Aiken, S.C.
U.S. Department of Energy, 1989b, "United States Department of Energy General Design Criteria,"DOE Order 6430.1 A, Washington, D.C., April 6.
142
U.S. Department of Energy, 1990a, Estimates of the Total-System Cost for the RestructuredProgram: An Addendum to the May 1989 Analysis of the Total-System Life Cycle Cost for theCivilian Radioactive Waste Management Program, DOE/RW-0295P, Office of Civilian RadioactiveWaste Management, Washington, D.C.
U.S. Department of Energy, 1990b, Hanford Waste Vitrification Plant Clean Air Act PermitApplication, DOE/RL-89-26, Washington, D.C.
U.S. Department of Energy, 1991a, Environmental Restoration and Waste Management Five-YearPlan, Fiscal Years 1993-1997, FYP DOE/S-0089P, Washington, D.C.
U.S. Department of Energy, 1991b, "High-Level Waste and Storage and Treatment," EnvironmentalRestoration and Waste Management Five-Year Plan, Activity Data Sheet No. 1002-C, Washington,D.C.
U.S. Department of Energy, 1991c, Reference Transportation Data for the Civilian RadioactiveWaste Management Program, Revision 1, Office of Civilian Radioactive Waste Management,Washington, D.C.
U.S. Department of Energy, 1992a, Environmental and Other Evaluations of Alternatives for Siting,Constructing, and Operating New Production Reactor Capacity, DOE/NP-0014, Vol. 1,Washington, D.C.
U.S. Department of Energy, 1992b, Independent Technical Review of the Hanford Tank FarmOperations, DOE/EM-0095P, Washington, D.C.
U.S. Department of Energy, 1992c, "Notice of Intent to Prepare an Environmental Impact Statementfor Environmental Restoration and Waste Management Activities at the Idaho National EngineeringLaboratory, Department of Energy - Idaho Field Office, Idaho Falls, ID," FederalRegister 57(193):45773-45778, Feb. 4.
U.S. Department of Energy, 1993a, DOE Management of High-Level Waste at the Hanford Site,DOE/IG-0325, Washington, D.C.
U.S. Department of Energy, 1993b, Environmental Restoration and Waste Management Five-YearPlan, Fiscal Years 1994-1998, DOE/S-00097P, Vol. 1, Washington, D.C.
U.S. Department of Energy, 1993c, "Hanford Tank Pumped," DOE This Month, April 4.

143
U.S. Department of Energy, 1993d, 1992 Idaho National Engineering Laboratory (INEL) NationalEmission Standards for Hazardous Air Pollutants (NESHAPs) Annual Report, DOE/ID-10342(92),Idaho Operations Office, Idaho Falls, Idaho.
U.S. Department of Energy, 1994a, Department of Energy Programmatic Spent Nuclear FuelManagement and Idaho National Engineering Laboratory Environmental Restoration and WasteManagement Programs Draft Environmental Impact Statement, DOE/EIS-0203-D, Office ofEnvironmental Management, Idaho Operations Office, Idaho Falls, Idaho.
U.S. Department of Energy, 1994b, Final Supplemental Environmental Impact Statement, DefenseWaste Processing Facility, DOE/EIS-0082-S, Aiken, S.C., Nov.
U.S. Department of Energy, 1995a, Savannah River Site Waste Management Draft EnvironmentalImpact Statement, DOE/EIS-0217D, Vol. II, Savannah River Operations Office, Aiken, SouthCarolina.
U.S. Department of Energy, 1995b, Office of Waste Management Programmatic EnvironmentalImpact Statement, Draft, Washington, D.C.
U.S. Department of Energy, 1995c, Programmatic Spent Nuclear Fuel Management and IdahoNational Engineering Laboratory Environmental Restoration and Waste Management ProgramsFinal Environmental Impact Statement, DOE/EIS-0203-F, Office of Environmental Management,Idaho Falls, Idaho, April.
U.S. Department of Energy and Washington State Department of Ecology, 1995d, FinalEnvironmental Impact Statement, Safe Interim Storage ofHanford Tank Wastes, DOE/EIS-0212,Richland Operations Office, Richland, Washington, Oct.
U.S. Department of Energy, 1995e, Integrated Data Base Report —1994: U.S. Spent Nuclear Fueland Radioactive Waste Inventories, Projections, and Characteristics, DOE/RW-0006, Rev. 11,Washington, D.C., Sept.
U.S. Department of Energy, 1995f, Department of Energy Programmatic Spent Nuclear FuelManagement and Idaho National Engineering Laboratory Environmental Restoration and WasteManagement Programs Final Environmental Impact Statement, DOE/EIS-0203-F, Office ofEnvironmental Management, Idaho Operations Office, Idaho Falls, Idaho.
U.S. Department of Energy, 1995g, Interim Management of Nuclear Materials, DOE/EIS-0220D,Aiken, S.C., March.

144
U.S. Department of Energy, 1995h, High-Level Waste System Plan Revision 5(U), HLW-OVP-95-0031, Savannah River Site, Aiken, South Carolina, April 26.
U.S. Department of Energy, 1996a, Draft Environmental Impact Statement for the Tank WasteRemediation System, DOE/EIS-0189D, U.S. Department of Energy and the Washington StateDepartment of Ecology, Richland, Washington, April.
U.S. Department of Energy, 1996b, Waste Management Programmatic Environmental ImpactStatement for Managing Treatment, Storage, and Disposal of Radioactive and Hazardous Waste,DOE/EIS-0200-F, Office of Environmental Management, Washington, D.C.
U.S. Department of Energy, 1996c, Storage and Disposition of Weapons - Usable Fissile MaterialsDraft Programmatic Environmental Impact Statement, DOE/EIS-0229-D, Washington, D.C., Feb.
U.S. Department of Energy and New York State Energy Research and Development Authority,1996, Draft Environmental Impact Statement for Completion of the West Valley DemonstrationProject and Closure or Long-Term Management of Facilities at the Western New York NuclearService Center, DOE/EIS-0226-D, Jan.
U.S. District Court, 1993, "Order Granting Motion for Summary Judgement, Injunction andAdministratively Terminating Action," U.S.A. and Public Service Company of Colorado versus CD.Andrus, Governor of the State of Idaho, Civil No. 91-0035-S-HLR, June 28.
USDC: See U.S. District Court.
Waite, T.H., 1989, "Operation and Maintenance of the New Waste Calcining Facility," inProceedings of the 1989 Joint International Waste Management Conference, Oct. 22-28, Kyoto,Japan, pp. 553-558.
Walters, H., 1995, personal communication from Walters (U.S. Department of Energy, Washington,D.C.) to S. Folga (Argonne National Laboratory, Argonne, 111.), Nov. 6.
West Valley Demonstration Project, 1991, West Valley Demonstration Project Site: AnnualReport to Congress, West Valley Nuclear Services, Inc., West Valley, N. Y.
West Valley Demonstration Project, 1992, "Application for Permit to Construct a Process, Exhaust,or Ventilation System," received by the New York State Department of EnvironmentalConservation, July 7.

145
Westinghouse Idaho Nuclear Company, Inc., 1994, ICPP Radioactive Liquid and Calcine WasteTechnologies Evaluation Interim Report, WINCO-1216, Department of Energy Idaho OperationsOffice, Idaho Falls, Idaho, June.
Westinghouse Savannah River Co., 1991, Support Facilities Descriptions for the New ProductionReactor at Savannah River, Volume 1, Heavy Water Reactor (U), WSRC-RP-89-263, Vol. 1,Version 4, Aiken, S.C.
Westinghouse Savannah River Co., 1992, Savannah River Site Liquid Radioactive Waste HandlingFacilities: Justification for Continued Operation (U), WSRC-RP-62-964, Westinghouse SavannahRiver Co., Aiken, S.C.
Wheeler, B.R., et al., 1986, "High-Level Waste Management at the Idaho Chemical ProcessingPlant, Idaho National Engineering Laboratory," WINCO-M-10091, presented at Spectrum 86-ANSTopical Meeting, Sept. 14-18, 1986, Niagara Falls, N.Y.
WINCO: See Westinghouse Idaho Nuclear Company, Inc.
Wodrich, D., 1992, "Hanford Site Tank Waste Remediation System," in Spectrum '92: Proceedingsof the International Topical Meeting on Nuclear and Hazardous Waste Management, Aug. 23-27,1992, Boise, Idaho, pp. 681-686.
Wodrich, D.D., and E.A. Bracken, 1988, "Progress in Defense High-Level Waste Disposal," inProceedings of Waste Management '88, Feb. 28-March 3, 1988, Tucson, Ariz., pp. 141-148.
Wodrich, D., et al., 1991, Designation of Facility Usage Categories for Hanford Site Facilities,WHC-SA-1145, Westinghouse Hanford Co., Richland, Wash.
Woods, W.D., et al., 1988, MRS Action Plan Task B Report: Analyses of Alternative Designs andOperating Approaches for a Monitored Retrievable Storage Facility, PNL-6770, Pacific NorthwestLaboratory, Richland, Wash.
WSRC: See Westinghouse Savannah River Co.
WVDP: See West Valley Demonstration Project.

146

147
APPENDIX:
MODULAR VAULT DRY STORAGETECHNOLOGY

148

149
APPENDIX:
MODULAR VAULT DRY STORAGE TECHNOLOGY
A.I DESCRIPTION
The vitrified product from high-level waste (HLW) treatment will be placed in interimstorage awaiting final disposal at a geologic repository. It is assumed that the interim canister storagefacility at Hanford and at the Savannah River site (SRS) for the vitrified HLW would hold canistersin vertically sealed cavities within a concrete structure forming the storage vault. Each CanisterInterim Storage Vault (CISV) will be an air-cooled, dry storage vault for vitrified HLW.
The storage vault is designed on the basis of the modular concept; that is, the storage vaultis divided into subblocks to help isolate the various compartments in case of an emergency oraccident. The main floor of the vault building supports an array of storage tubes that extend into avault below the main floor and into a support plate mounted above the floor of the vault. Concreteplugs provide a cover for the tubes. The storage tubes are cooled (to dissipate the decay heat of theHLW canisters) by air that is drawn by natural convection into distributing ducts on the outside wallof the building, through the vault and around the storage tubes, and then up a stack. Thethermosiphon ventilation system is self-regulating and can compensate for changes in heat load orweather conditions.
Activities at a given CISV include receipt and unloading of transportation casks containingcanisters of vitrified waste, inspection of the canisters, and storage of the waste until transfer to ageologic repository. The canisters are to be stored in sealed sleeves so that the cooling air does notcome directly into contact with the potentially contaminated surfaces of the HLW canisters. The air(or cover gas) in the interior of the storage tubes and air flow through the vault are continuouslymonitored to detect any leakage of radioactive material from the canisters; if a leak were detected,the control system would shut down all operating roof fans and the contaminated air would then beexhausted through a ventilation system equipped with high efficiency paniculate air (HEPA)filtration.
The above interim storage technology is known as the Modular Vault Dry Storage (MVDS)technology. Example facilities are the Irradiated Fuel Storage Facility (IFSF) at Idaho NationalEngineering Laboratory (INEL) and the Independent Spent Fuel Storage Installation (ISFSI) at theFort St. Vrain power station in Colorado. These facilities are similar to the vitrified HLW storagevault for the Defense Waste Processing Facility (DWPF) at SRS.
The following operations description is adapted from DOE (1989). The HLW glasscanisters are transferred to the modular dry-storage system in a transportation cask using a shieldedcanister transporter (SCT). At the vitrification building, a concrete plug is lifted from a load-outhatch and a hoist and grapple arrangement is used to place the HLW canister into the shielded
150
transportation cask mounted on the SCT. The SCT is driven to the CISV where the SCT ispositioned over a loading port in the floor. The shield plug is removed from the loading port by thehoist and grapple arrangement in the SCT, the HLW canister is lowered into the storage tube, andthe shield plug is reinstalled. The storage tubes are sealed after loading, providing a redundant barrierbetween any leakage from the sealed canisters and the environment. The canister tube can be purgedof air and filled with inert cover gas, if necessary (primarily to avoid corrosion and dry oxidation).The HLW canister can be moved from dry storage back to the SCT by reversing the sequence.
A parametric approach was used to determine correlations between the various dependentvariables (e.g., capital cost and annual work force) and the performance parameters (e.g., canisterstorage capacity and annual loading rate); the primary performance parameters were determinedfrom U.S. Department of Energy (DOE) (1986a) and Bonnet and Gallagher (1993).
A.2 RESOURCE CHARACTERISTICS FOR CONSTRUCTION OF ANMVDS FACILITY
Resource characteristics for construction (including variables such as the total capital cost,facility size, construction materials, work force, and schedule) are given in Table A.I; the followingparagraphs, along with Tables A.2 through A.5, discuss and elaborate on the information inTable A.I. Table A.I is designed to allow evaluation of the various HLW interim canister storagealternatives, given the total required storage capacity and the annual canister loading rate.
A.2.1 Anchor Facilities
The BFSF at INEL and the independent spent fuel storage installation (ISFSI) at the FortSt. Vrain power station in Colorado are anchor facilities. These facilities are similar to the vitrifiedHLW storage vault for the DWPF at SRS.
A.2.2 Occupied Land Area
The modular structure of the MVDS technology allows considerable flexibility ofexpansion as capacity requirements increase. The facility would be contained within a secured,fenced area to minimize intrusion. It is assumed in this study that a HLW canister is equivalent to0.5 metric tons of heavy metal (MTHM) of spent nuclear fuel (SNF). The occupied land area wasestimated using the literature results shown in Table A.2 for the facility area.
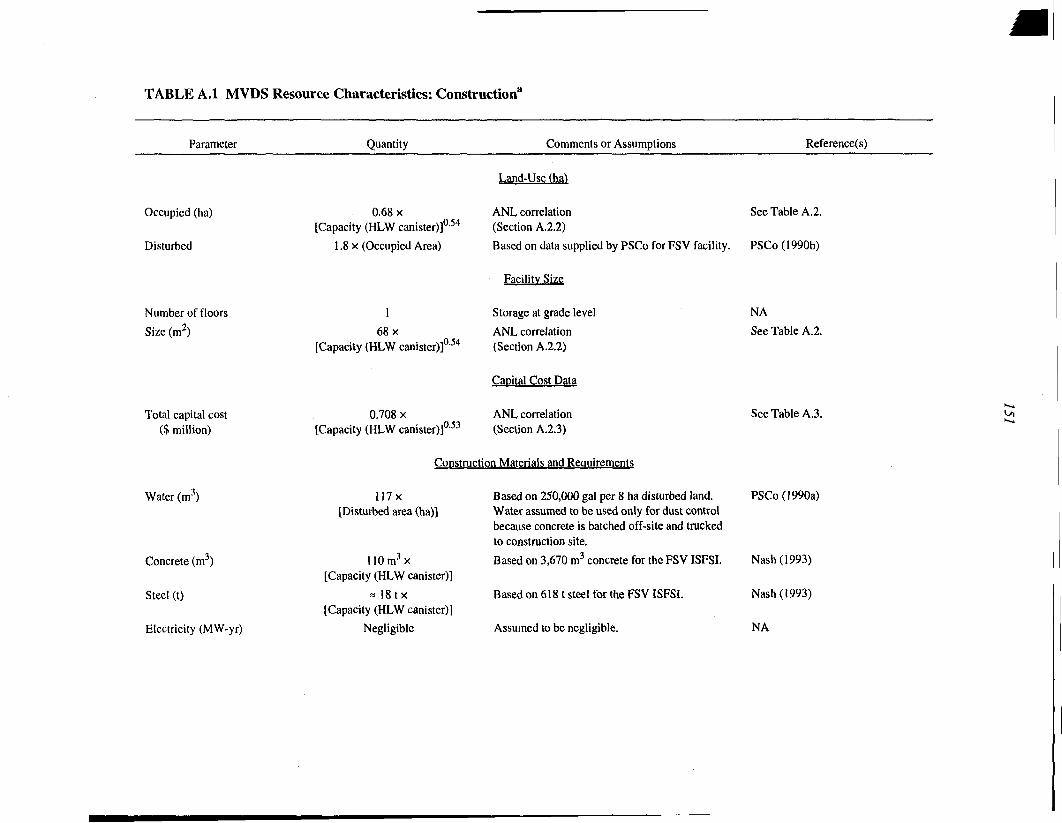
TABLE A.I MVDS Resource Characteristics: Construction3
Parameter Quantity Comments or Assumptions Reference(s)
Occupied (ha)
Disturbed
Number of floors
Size (m2)
Total capital cost($ million)
Water (m3)
Concrete (m3)
Steel (t)
Electricity (MW-yr)
0.68 x[Capacity (HLW canister)]054
1.8 x (Occupied Area)
1
68 x[Capacity (HLW canister)]054
0.708 x[Capacity (HLW canister)]053
Land-Use (ha)
ANL correlation(Section A.2.2)
Based on data supplied by PSCo for FSV facility.
Facility Size
Storage at grade level
ANL correlation(Section A.2.2)
Caoital Cost Data
ANL correlation(Section A.2.3)
Construction Materials and Requirements
117x[Disturbed area (ha)]
110m3x[Capacity (HLW canister)]
~ 18tx[Capacity (HLW canister)]
Negligible
Based on 250,000 gal per 8 ha disturbed land.Water assumed to be used only for dust controlbecause concrete is batched off-site and truckedto construction site.
Based on 3,670 m3 concrete for the FSV ISFSI.
Based on 6181 steel for the FSV ISFSI.
Assumed to be negligible.
See Table A.2
PSCo (1990b)
NA
See Table A.2
See Table A.3
PSCo (1990a)
Nash (1993)
Nash (1993)
NA
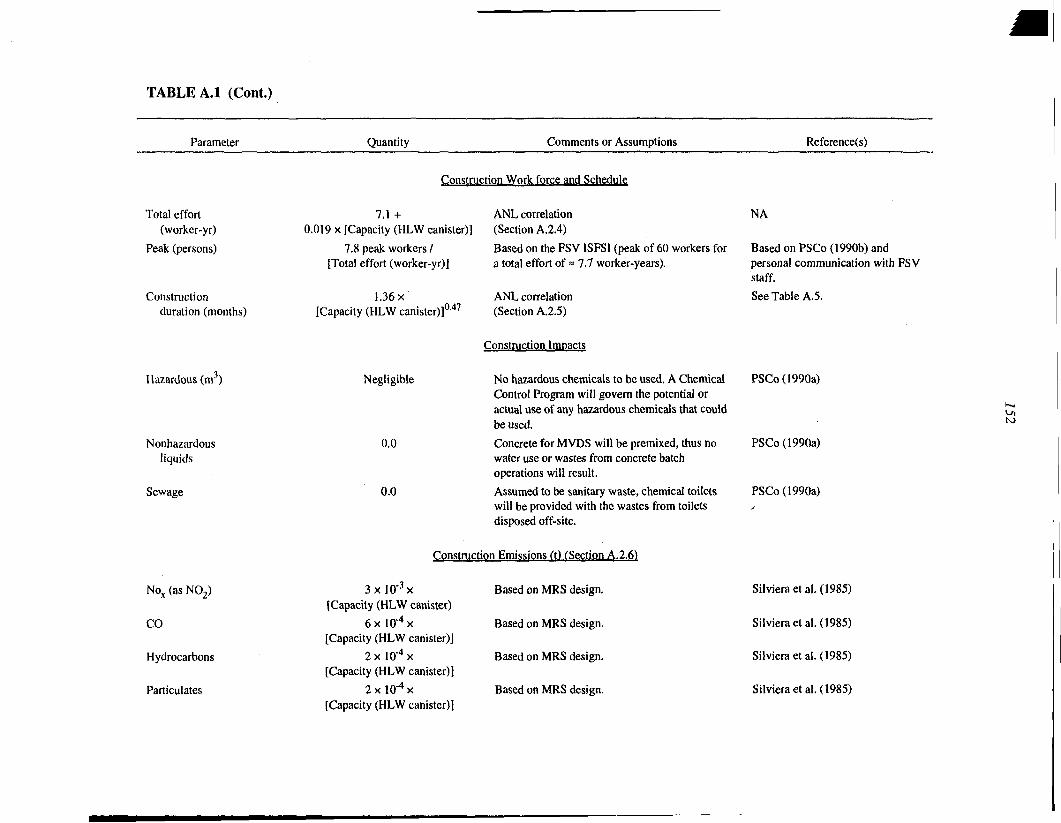
TABLE A.I (Cont.)
Parameter Quantity Comments or Assumptions Reference(s)
Construction Work force and Schedule
Total effort(worker-yr)
Peak (persons)
Constructionduration (months)
Hazardous (m )
Nonhazardousliquids
Sewage
Nox (as NO2)
CO
Hydrocarbons
Particulates
7.1 +0.019 x [Capacity (HLW canister)]
7.8 peak workers /[Total effort (worker-yr)]
1.36 x[Capacity (HLW canister)]047
ANL correlation(Section A.2.4)
Based on the FSV ISFSI (peak of 60 workers fora total effort of » 7.7 worker-years).
ANL correlation(Section A.2.5)
Construction Impacts
Negligible No hazardous chemicals to be used. A ChemicalControl Program will govern the potential oractual use of any hazardous chemicals that couldbe used.
0.0 Concrete for MVDS will be premixed, thus nowater use or wastes from concrete batchoperations will result.
0.0 Assumed to be sanitary waste, chemical toiletswill be provided with the wastes from toiletsdisposed off-site.
Construction Emissions (t) (Section A.2.6)
3 x l 0 ' 3 x[Capacity (HLW canister)
6x 10 4 x[Capacity (HLW canister)]
2 x l 0 4 x[Capacity (HLW canister)]
2x lO" 4 x[Capacity (HLW canister)]
Based on MRS design.
Based on MRS design.
Based on MRS design.
Based on MRS design.
NA
Based on PSCo (1990b) andpersonal communication with FSVstaff.See Table A.5.
PSCo (1990a)
PSCo (1990a)
PSCo (1990a)
Silvieraetal.(1985)
Silvieraetal. (1985)
Silvieraetal. (1985)
Silvieraetal. (1985)

TABLE A.I (Cont.)
Parameter Quantity Comments or Assumptions Reference(s)
SOX (as SO2) 2 x 10"4 x Based on MRS design. Silviera et al. (1985)[Capacity (HLW canister)]
Fugitive dust (TSP) ~ 1.3 x 10"4 x Based on dust emissions of 0.2 lb/yd3 concrete DOE (1986a)[Concrete (m3)] for concrete batching.
a Abbreviations: ANL = Argonne National Laboratory, FSV = Fort St. Vrain, NA = not applicable, NRC = U.S. Nuclear Regulatory Commission, PSCo:Public Service Company of Colorado, TSP = total suspended particles/particulates, MRS = monitored retrievable storage.
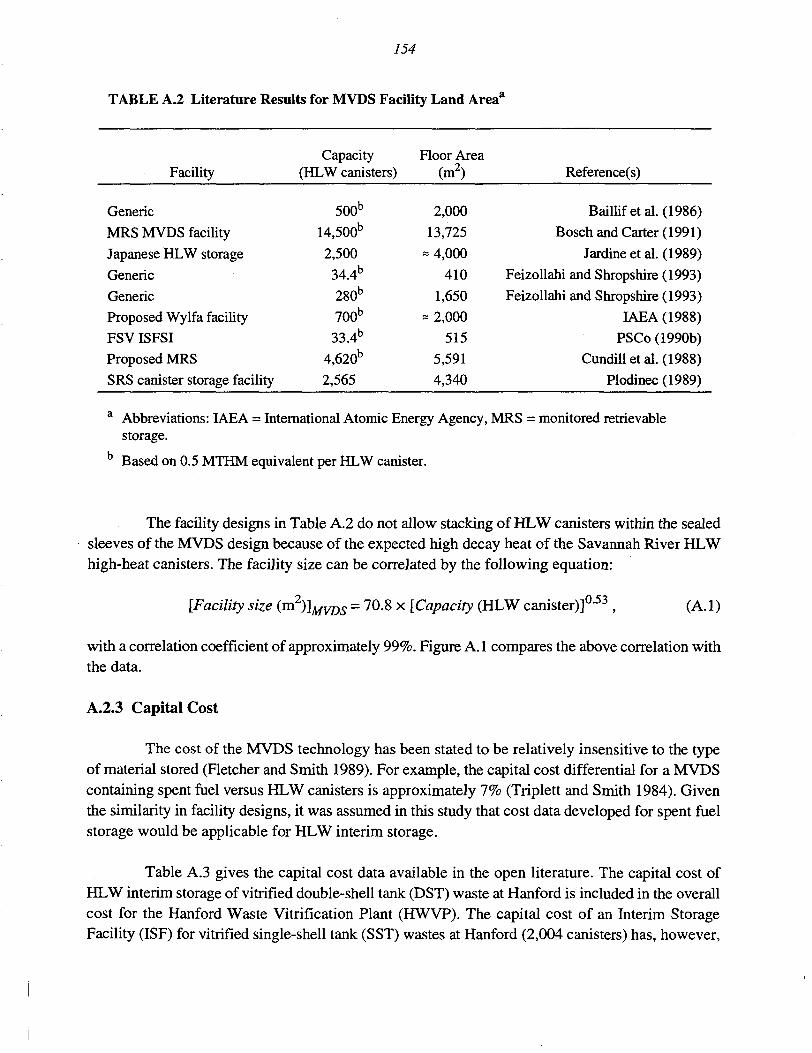
154
TABLE A.2 Literature Results for MVDS Facility Land Areaa
Facility
GenericMRS MVDS facilityJapanese HLW storageGenericGenericProposed Wylfa facilityFSV ISFSIProposed MRSSRS canister storage facility
Capacity(HLW canisters)
500b
14,500b
2,50034.4b
280b
700b
33.4b
4,620b
2,565
Floor Area(m2)
2,00013,725
« 4,000410
1,650= 2,000
5155,5914,340
Reference(s)
Baillifetal. (1986)Bosch and Carter (1991)
Jardineetal. (1989)Feizollahi and Shropshire (1993)Feizollahi and Shropshire (1993)
IAEA (1988)PSCo (1990b)
Cundill et al. (1988)Plodinec (1989)
a Abbreviations: IAEA = International Atomic Energy Agency, MRS = monitored retrievablestorage.
b Based on 0.5 MTHM equivalent per HLW canister.
The facility designs in Table A.2 do not allow stacking of HLW canisters within the sealedsleeves of the MVDS design because of the expected high decay heat of the Savannah River HLWhigh-heat canisters. The facility size can be correlated by the following equation:
[Facility size (m2)]MV7W = 70.8 x [Capacity (HLW canister)]053 (A.1)
with a correlation coefficient of approximately 99%. Figure A.1 compares the above correlation withthe data.
A.2.3 Capital Cost
The cost of the MVDS technology has been stated to be relatively insensitive to the typeof material stored (Fletcher and Smith 1989). For example, the capital cost differential for a MVDScontaining spent fuel versus HLW canisters is approximately 7% (Triplett and Smith 1984). Giventhe similarity in facility designs, it was assumed in this study that cost data developed for spent fuelstorage would be applicable for HLW interim storage.
Table A.3 gives the capital cost data available in the open literature. The capital cost ofHLW interim storage of vitrified double-shell tank (DST) waste at Hanford is included in the overallcost for the Hanford Waste Vitrification Plant (HWVP). The capital cost of an Interim StorageFacility (ISF) for vitrified single-shell tank (SST) wastes at Hanford (2,004 canisters) has, however,

100,000
10,000 -
CO
ooE
1,000 -
100 -
10
ANL Correlation70.8 x [Capacity (HLW canisters)]0-53
,• •
I100
i I1.000 10,000
Capacity (Number of HLW canisters)
100,000
FIGURE A.I Floor Area as a Function of Capacity: MVDS Interim Storage

TABLE A.3 Capital Cost Summary for SNF/HLW Interim Storage
Facility
GenericGenericMRSMRSMRSMRSSRS HLWHanford HLW
Capacity(HLW canisters)
34.4a
280a
30,000a
200a
l,000a
2,000a
2,2862,004
Reported CapitalCost ($ million)
5.220
156.56210.125.6
454035
DollarYear
19921992
mid-198819871987198719921991
1992 CapitalCost ($ million)
518
1731026464036
Reference(s)
Feizollahi and Shropshire (1993)Feizollahi and Shropshire (1993)
Fletcher and Smith (1989)Cundilletal. (1988)Cundill et al. (1988)Cundill et al. (1988)
Street et al. (1992)Boomer (1992)
a Based on 0.5 MTHM equivalent per HLW canister.

157
been reported to be $35 million (Boomer 1992); each HLW canister is assumed to contain0.54 MTHM on the basis of a waste loading of 32%. A cost of $40 million has been projected forstorage of 2,286 canisters at SRS (Street et al. 1992). The capital costs for the different SNF ISFswere decreased by 7% to allow equal comparison between facilities storing HLW and those storingSNF.
The cost values for the MRS were modified to subtract the cost components associated withsite preparation (site-specific) and facility licensing. In addition, the capital costs quoted inFeizollahi and Shropshire (1993) were decreased by one magnitude after discussions with theauthors. Correlation of the literature values with capacity yields the following equation:
[Capital cost ($ million)]MVD5 = 0.71 [Capacity (HLW canister)]0-53 , (A.2)
with a (rather low) correlation coefficient of 98.5%. Figure A.2 compares the above correlation withthe data summarized in Table A. 3.
The decontamination and decommissioning (D&D) cost ranges from 8.9% of theconstruction cost (Woods et al. 1988) to approximately 10% (Fletcher and Smith 1989). The uppervalue of 10% will be used for conservatism. This approach assumes that a larger capital cost willresult in a larger expected cost for decommissioning, which may not be true in all circumstances.
A.2.4 Total Construction Effort
The total construction labor was estimated by using available literature sources. Thecorrelation of the construction site labor with storage capacity was estimated from the results ofCundill et al. (1988) for alternative MRS designs using the MVDS technology. Table A.4 presentsthe estimates for alternative MVDS designs.
The above results indicate that construction site labor is linearly proportional to the storagecapacity.
[Construction effort (worker-year)]^^ = 7.1 + 0.019 x [Capacity (HLW canister)]. (A.3)
Application of the above correlation to the reported construction effort for the Fort St.Vrain ISFSI (= 7.7 person-yr for a 16.7 MTHM storage capacity) results in a difference of less than1%.
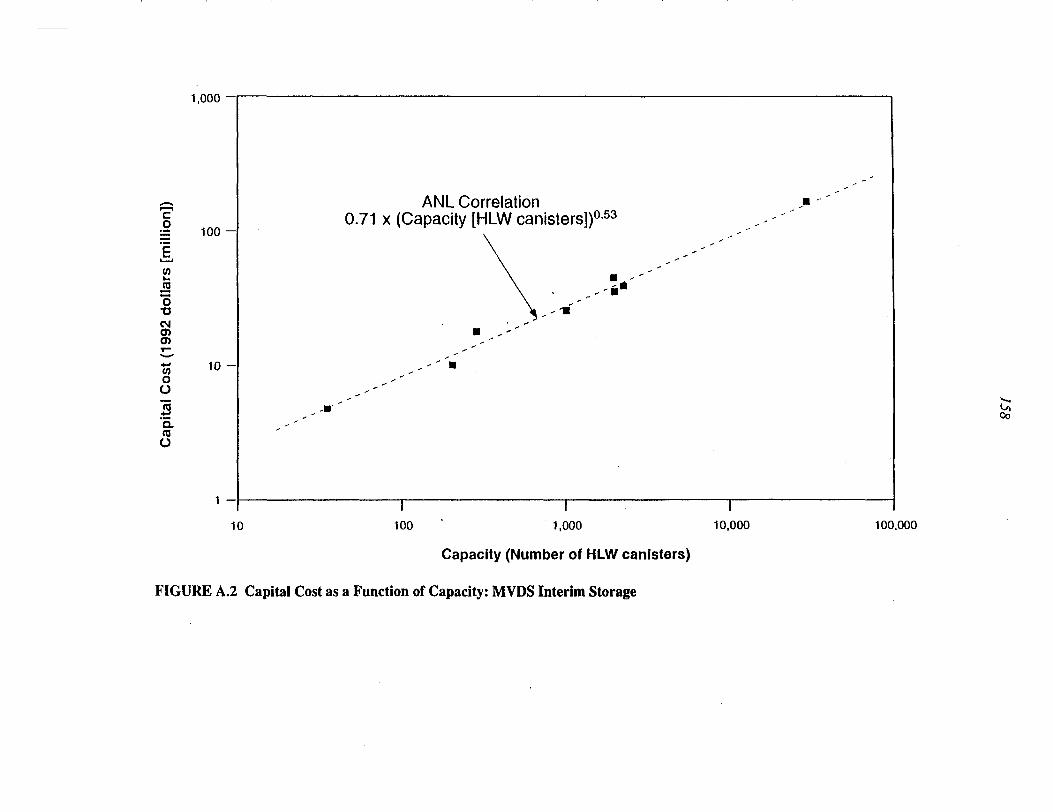
1,000 -
co
is"oT3CM0)O)
(/)OO
2a.roo
100 -
10 -
1 —
10
ANL Correlation0.71 x (Capacity [HLW canisters])0 53
is
100 1,000 10,000 100,000
Capacity (Number of HLW canisters)
FIGURE A.2 Capital Cost as a Function of Capacity: MVDS Interim Storage

159
TABLE A.4 Construction Labor as a Functionof MVDS Facility Storage Capacity
Storage Capacity(HLW canister)3
200 1,000 2,000
Site labor cost ($1987) 604 1,441 2,500Site labor (worker-yr) 11 26.2 45.5
a Based on 0.5 MTHM equivalent per HLWcanister.
b Based on an annual construction labor cost of$55,000 per construction worker.
A.2.5 Construction Duration
In general, the duration of construction depends on the level of site preparation, availabilityof construction materials and specialized construction labor, and facility licensing/environmentalstudies, among others. The construction duration for the MVDS technology is assumed to beprimarily dependent on the storage capacity. Literature results for construction duration are shownin Table A.5. Data regression resulted in the following equation:
[Construction duration ( m o n t h ) ] ^ ^ = 1.36 x [Capacity (HLW canister)]
with a correlation coefficient of 98.2%.
0.47 (A.4)
TABLE A.5 Literature Results for MVDS Facility Construction Duration
FacilityCapacity
(HLW canisters)Construction
Duration (month) Reference(s)
FSVISFSI
Proposed Wylfa facility
Proposed MRS
PAMELA facility
33.4a
700a
4,620a
1,500
7 to 8
24 to 30
84
40b
PSCo (1990b)
IAEA (1988)
Fletcher and Smith (1989)
Demonieetal. (1987)
Based on 0.5 MTHM equivalent per HLW canister.
Includes 14 months for licensing.

160
A.2.6 Construction Emissions
Air pollutant construction emissions include dust generated during construction andconstruction equipment exhaust emissions. Source terms for equipment exhausts can, in general, bedetermined by first estimating the amount of construction equipment and thereby the quantity ofdiesel fuel. These estimates are usually based on review and comparison of equipment requirementsfor construction projects of similar magnitude. The paniculate emissions from dust generated arecalculated from the land area used for construction, the duration of the construction period, and theappropriate (site-specific) emission factor.
Estimated emissions during construction of a MRS storage facility (Silviera et al. 1985)were used for the MVDS and placed on a unit HLW canister basis (based on a maximum throughputof 3,600 canisters/yr for the MRS and assuming a three-year construction period).
Fugitive dust consists of particles with a diameter equal to or less than 30 mm. Fugitive dustis were
(DOE 1986a).emissions were estimated on the basis of dust emissions of 0.2 lb/yd concrete for concrete batching
A.3 RESOURCE CHARACTERISTICS FOR OPERATION OF AN MVDS FACILITY
Resource characteristics for operations (including variables such as annual operatingcharges, chemical requirements, work force, and annual waste generation) are shown in Table A.6;the following paragraphs, along with Tables A.7 through A. 10, explain and elaborate on theinformation in Table A.6. Table A.6 is designed to allow evaluation of the various HLW interimcanister storage alternatives, given the total required storage capacity and the annual canister loadingrate.
A.3.1 Anchor Facilities
The IFSF at INEL and the ISFSI at the Fort St Vrain power station in Colorado are anchorfacilities. These facilities are similar to the vitrified HLW storage vault for the DWPF at SavannahRiver.
A.3.2 Annual Operation and Maintenance Cost
Annual operation and maintenance (O&M) costs include the routine handling, storage, andretrieval of stored spent fuel. Costs during the storage of fuel are primarily associated with the O&Mof the facility; most of these costs are for personnel. Additional fuel transfer costs are incurred for

TABLE A.6 MVDS Resource Characteristics: Operations3
Parameter Quantity Comments or Assumptions Reference(s)
Annual O&M cost ($1,000/yr)
loading/unloading
Annual O&M cost ($l,OOO/yr)storage only
Water (nr/yr)loading/unloading
Annual electrical demand(GWh/yr) loading/unloading
Water (m3/yr)storage only
Annual electrical demand(GWh/yr) storage only
Mass (kgHAZ/kgHLW)
Annual Operating Charges
,0.45770 x
[Throughput (HLW canister/yr)]
38.6 +0.27 x [Capacity (HLW canister)]
ANL correlation(Section A.3.2)
ANL correlation(Section A.3.2)
Annual Resource Reauirements during Operation (Section A.3.3)
14 x[Throughput (HLW canister/yr)]
0.031 x[Throughput (HLW canister/yr)]
1.1 x l 0 3 x[Capacity (HLW canister)]
Negligible
0.5
Based on MRS design.
ANL correlation
Assumes majority of water usedfor cask washdown.
The MVDS system is totallypassive, minimal power isrequired for monitoring devicesand lighting.
Hazardous Material Inventorv (kg)
None
See Table A.7.
See Table A.7.
Smith (1983)
NA
PSCo (1990b)
PSCo (1990b)
Assumes decontamination PSCo (1990b)solution would be nontoxic (freonnot used).
Annual Work Force
Number of workers (FTEs)loading/unloading
3.7 x[Throughput (canister/yr)]0.4
ANL correlation(Section A.3.4)
See Table A.9.
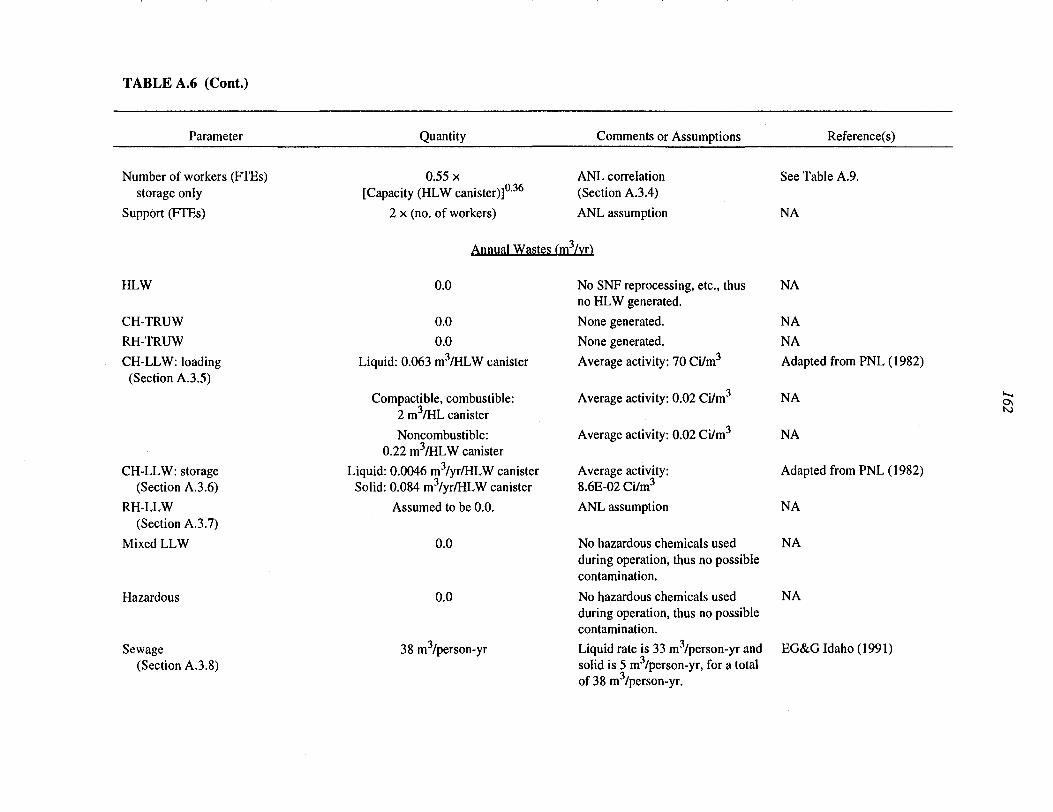
TABLE A.6 (Cont.)
Parameter
Number of workers (FTEs)storage only
Support (FTEs)
HLW
CH-TRUW
RH-TRUW
CH-LLW: loading(Section A.3.5)
CH-LLW: storage(Section A.3.6)
RH-LLW
Quantity
0.55 x[Capacity (HLW canister)]036
2 x (no. of workers)
Annual Wastes
0.0
0.0
0.0
Liquid: 0.063 m3/HLW canister
Compactible, combustible:2 m3/HL canister
Noncombustible:0.22 m3/HLW canister
Liquid: 0.0046 m3/yr/HLW canisterSolid: 0.084 m3/yr/HLW canister
Assumed to be 0.0.
Comments or Assumptions
ANL correlation(Section A.3.4)
ANL assumption
(m3/vr)
No SNF reprocessing, etc., thusno HLW generated.
None generated.
None generated.
Average activity: 70 Ci/m
Average activity: 0.02 Ci/m3
Average activity: 0.02 Ci/m3
Average activity:8.6E-02 Ci/m3
ANL assumotion
Reference(s)
See Table A.9.
NA
NA
NA
NA
Adapted from PNL (1982)
NA
NA
Adapted from PNL (1982)
NA
to
(Section A.3.7)
Mixed LLW
Hazardous
Sewage(Section A.3.8)
0.0
0.0
38 m /person-yr
No hazardous chemicals usedduring operation, thus no possiblecontamination.
No hazardous chemicals usedduring operation, thus no possiblecontamination.
Liquid rate is 33 m3/person-yr andsolid is 5 m3/person-yr, for a total
NA
NA
EG&G Idaho (1991)
-1 *
of 38 m /person-yr.

TABLE A.6 (Cont.)
Parameter Quantity Comments or Assumptions Reference(s)
Air Emission Point
Height (m)
Flowrate (m /hr)
Cross section (m )
Air emissions — activity asfunction of input (Ciou/Cijn)
NOX
voc
To be modeled as aground-level release.
To be modeled as aground-level release.
To be modeled as aground-level release.
(Section A.3.9)
Radioactive Annual Emissions CCi/vr')
Assumed to be negligible. (Section A.3.10)
Nonradioactive Annual Emissions (ke/vr)
Assumed to be negligible.
Assumed to be negligible.
Assumed to be negligible.
(Section A.3.11)
NA
NA
NA
NA
EG&G Idaho (1991)
EG&G Idaho (1991)
a Abbreviations: FTE = full-time equivalent, CH-LLW = contact-handled low-level waste, RH-LLW = low-level remote-handled waste, NOX =nitrogen oxide, SOX = sulfur oxide, PNL = Pacific Northwest Laboratory, CH-TRUW = contact-handled transuranic waste, RH-TRUW = remote-handled transuranic waste, and VOC = volatile organic compound.

164
TABLE A.7 Literature Results for MVDS Facility Operation and Maintenance
Facility
Generic
Generic
MRS
Generic
MRS
MRS
Capacity(HLW
Canister)a
34.4
280
200
1,000
1,000
2,000
Annual O&M Coslt duringStorage ($l,000/yr)
Reported
58.8
121.8
67
250
247
473
DollarYear
1992
1992
1987
1988
1987
1987
Dollars(1992)
58.8
122
84
297
308
592
Reference(s)
Feizollahi and Shropshire (1993)
Feizollahi and Shropshire (1993)
Cundill et al. (1988)
Johnson (1990)
Johnson (1990)
Johnson (1990)
Based on 0.5 MTHM equivalent per HLW canister.
TABLE A.8 Literature Results for MVDS Facility Loading/Unloading
Facility
Generic
Generic
MRS
Throughput(HLW
canister/yr)a
10
100
5,400
Annual O&M Cost duringUnloading/Loading ($l,OOO/yr)
Reported
2,316
5,431
37,100
DollarYear
1992
1992
1988
Dollars(1992)
2,316
5,431
44,000
Reference(s)
Feizollahi and Shropshire (1993)
Feizollahi and Shropshire (1993)
Woods etal. (1988)
Based on 0.5 MTHM equivalent per HLW canister.

TABLE A.9 Literature Results for MVDS Facility Work Force
Capacity(Canister)a
17.2
140
500
750
1,000
Interim Storage
Work Force(FTEs)
2
4
5
8
9.5
Reference
Feizollahi and Shropshire (1993)
Feizollahi and Shropshire (1993)
Cundilletal. (1988)
BaillifandGuay(1990)
Cundilletal. (1988)
Throughput(Canister/yr)a
5
50
125
1,800
3,000
Loading/Unloading
Work Force(FTEs)
10
24
30
105
128
Reference
Feizollahi and Shropshire (1993)
Feizollahi and Shropshire (1993)
Jardineetal. (1989)
Smith (1983)
Woods etal. (1988)
a Based on 0.5 MTHM equivalent per HLW canister.

166
TABLE A.10 Annual Waste Generation during MVDS Facility Loading/Unloading
LLW Treatability Category
Liquid (aqueous)Compactible, combustibleNoncompactible, noncombustible
Annual
VolumetricBasis (m3/yr)
381,168
133
Generation Rate
HLW Canister Basisa
(m3/HLW canister)
0.0632.0
0.22
Average Activity(Ci/m3)
740.0210.015
Based on an annual loading rate of 600 HLW canisters per year.
conveying the fuel at the beginning and end of the storage period. In general, operating costs aredependent on the type of storage technology and the size or capacity of the storing facility. Cundillet al. (1988) state that the annual O&M cost during storage is a constant percentage (i.e., 1.4%) ofthe capital cost. Table A.7 gives the available annual O&M cost data for the storage phase.
The correlation of the annual operating costs for the storage period as a function of capacityis
[Annual O&M cost ($l,000/yr)]Jtoraife = 38.6 + 0.27 x [Capacity (HLW canister)]. (A.5)
The correlation coefficient is very good (99.7%); however, this correlation should be verycarefully applied to near-zero storage capacities because the above correlation does not approach azero cost as the number of HLW canisters approaches zero. Very few cost data are available for theloading/unloading period (Table A. 8).
Correlation of the cost values in Table A.8 yields
[Annual O&M cost ($l,000/yr)] /oa<^ = 770
x [Throughput (HLWcanister/yr)]045.(A.6)
The above correlation has (unfortunately) only one degree of freedom.

767
A3.3 Resource Requirements during Operation
During the loading/unloading phase, a total of 13 million gal (=49,000 m3) of water peryear was estimated to be required for a maximum annual throughput of 1,800 MTHM/yr (Smith1983). This is equivalent to approximately 14 m (494 ft ) per HLW canister.
The electrical requirement during the loading/unloading phase was determined bycorrelating the annual electrical demand for interim storage of SNF in a modular vault dry storagefacility (Feizollahi and Shropshire 1993), assuming an average cost of electricity of 3.5 cents perkWh.
[Annual electrical demand (GWh/yi)]MVDS = 0.031x [Throughput(HLWcanister/yr)]05. (A.7)
The above correlation is expected to be accurate within the range of throughputs expected.However, it underestimates the electrical demand for a 1,800 MTHM/yr MRS design (9 GWh/yr)(Smith 1983).
The safety report for the Fort St. Vrain ISFSI estimated that approximately 10 gal/yr(0.038 m3/yr) of liquid waste would be generated annually during the storage-only phase. Assumingthe majority of liquid low-level waste (LLW) will result from water used for washdown of theshipping cask and facility decontamination, the annual water requirement can be given by
[Water (m3/yr)]Stomge = (10 gal/yr) x (m3/264.17 gal)x (0.5 MTHM/HLW canister)/(16.7 MTHM) = 1.1 x 10"3 m3/HLW canister. (A.8)
A.3.4 Estimated Work Force
The work force estimate includes only those personnel who spend an eight-hour dayworking in direct support of facility operations. The estimated work force includes analytical, healthphysics, maintenance, technical/production, and supervisory personnel. All workers are assumed tobe exposed to radiation. The available literature was reviewed to establish the dependency of theMVDS facility work force on capacity/throughput (Table A. 9).
The above values include maintenance and other direct support personnel. Assumptionsmade for the storage-only work force are an annual cost of $50,000 per FTE (Cundill et al. 1988)and a ratio of 1 to 3 operators-to-maintenance personnel for the PAMELA facility (Demonie et al.1987). The correlation of the storage work force with capacity is
[Storagepersonnel (FTE)]MVDS = 0.55 x [Capacity (HLW canister)]036, (A.9)
with a (relatively low) correlation coefficient of 94%.

168
The value in Table A.9 for the storage work force from Smith (1983) did not includepersonnel for dry rod consolidation, on-site waste treatment, and security and other service functions;these were assumed to be supplied by the DOE site. The correlation of work force with throughputduring loading/unloading can be given by
[Loading!unloading personnel (FTE)]MVDS = 3-7x [Throughput (HLW canister/yr)] ,
(A.1U)with a correlation coefficient greater than 99%.
The distribution of the work force is assumed to be approximately 50% operators,30% maintenance, and 20% health physics (Deacon 1981).
A.3.5 CH-LLW: Loading Phase
Low-level waste in liquid and solid form would be generated during the loading phase. Wetwaste streams would result from cask/vehicle washdowns, cask-flushes and cooling, and variousdecontamination operations performed at the MVDS facility. The majority of the liquid LLWproduced during the loading phase is due to decontamination/washing of the incoming/exitingshipping casks. It has been estimated that about 4 gal (0.015 m3) of decontamination solution wouldbe required during wiping and rinsing of a single HLW shipping cask (Ralph M. Parsons Co. 1985).Each shipping cask is assumed to contain one HLW canister (i.e., shipment by truck).
Radioactive solid wastes would generally either be (1) dry active waste (compactible,combustible) or (2) noncompactible, noncombustible. Dry active wastes such as protective clothing,plastic sheeting, gloves, materials suspected of being contaminated, etc., are generated as a result offacility operations. Noncompactible, noncombustible LLW would consist of spent ventilationexhaust prefilters and HEPA filters and failed equipment. Solid waste would be packaged into drumsand sent to other facilities for treatment and/or disposal.
In this analysis, the generation rate is assumed to be linearly proportional to the loadingrate. Table A. 10 gives the annual generation rate during the loading phase on the basis of athroughput of 600 HLW canisters per year (PNL 1982).
A.3.6 CH-LLW: Storage Phase
The CH-LLW wastes produced during the storage phase can be divided into solid (plastic,cloth, paper, etc.) and liquid (decontamination solutions, etc.) streams. The safety report for the FortSt. Vrain ISFSI estimated that approximately 10 gal/yr (0.038 m3/yr) of liquid and about 25 ft3/yr(0.71 m /yr) of solid waste would be produced during routine fuel storage. Assuming these values
169
depend on the amount in storage, then approximately 0.0046 m liquid waste/HLW canister and0.084 m solid waste/HLW canister would be generated during interim storage. (The assumptionthat the waste generation is dependent on the storage capacity assumes that the majority of the wasteis produced during routine equipment/facility activities such as maintenance, etc.).
It has been reported that the "annual waste volumes from a MVDS are the same as for acask storage facility" (PNL 1982). Approximately 180 m3 (6,355 ft3) of solid wastes and 5 m 3
(176 ft3) of wet wastes are expected to be generated annually, primarily from failed equipment andrare package failures. About 16 Ci of radioactive material are contained in these wastes annually.The total capacity of the cask storage facility is 3,000 MTHM. On the basis of a 0.5 MTHMequivalent per HLW canister, the annual generation rate during storage of liquid and solid LLWwould be 0.0083 (0.29 ft3) and 0.03 m3 (1.1 ft3) per HLW canister stored, respectively. The valuesestimated in PSCo. (1990b) were used in this study for conservatism.
The LLW activity during storage is estimated on the basis of a total of 16 Ci of radioactivematerial being produced out of a total of 185 m3 (6,531 ft3) generated annually from a 3,000-MTHMMVDS. The average activity of both streams is approximately 0.086 Ci/m3.
A.3.7 RH-LLW
Remote-handled low-level waste generally includes spent HEPA filters and failedequipment. Available data indicate that the expected radioactivity of the spent HEPA filters is low,primarily because of the low contamination of the shipping casks and the low failure rate of theHLW canister packages. For these reasons, it was assumed that the amount of LLW-RH would benegligible.
A.3.8 Sewage
The sanitary wastes will be processed through sanitary waste treatment to produce aclarified liquid effluent. The amount of liquid sanitary waste (35 gal/d/person/shift) is based onEG&G Idaho (1991) and can be estimated by the following equation:
[Liquid sanitary waste (m3/yr)] = (35 gal/d/person/shift) (A. 11)x (168 working days/yr) x [Number of personnel (FTEs)]
x (3 shifts) x (3.785 x 10'3 m3/gal).
It is assumed that this conceptual storage facility would operate 24 hours per day, 5 daysper week, 240 days per year, with an on-stream efficiency of 70%. The number of facility personnelis determined by correlation.

770
The amount of solid sanitary waste (5 m3/person/yr) is based on EG&G Idaho (1991) andcan be estimated by the following equation:
[Solid sanitary waste (m3/yr)] = (5 m3/person/yr) x (FTEs). (A. 12)
The number of facility personnel is determined by correlation.
A.3.9 Stack Characteristics
Justifiable stack locations and heights are not possible because the design is preliminaryand they cannot be defined until a more detailed conceptual design has been initiated and preliminarysafety analysis completed. Stack characteristics will be affected by the location of adjacent facilities,local weather, and site conditions. These effects cannot be included at this time.
The stack height of a "generic" MVDS facility is given as 72 ft (=22 m) (Cundill et al.1988). The storage facility stack for the IFSF at INEL is located 65 ft (=20 m) above ground (Stirrup1993). Following the methodology employed by INEL, it may be assumed that the emissions fromthe MVDS may be modeled as a ground-level release because the release point is not greater than2.5 times the associated building height (DOE 1993).
A.3.10 Radioactive Annual Emissions
The air circulation system of the MVDS is designed so that the cooling air does not comein contact with the HLW canisters and, therefore, should not become contaminated. Similarly, theconcrete inner surfaces of the MVDS facility are not expected to be exposed to contaminated air andshould remain clean throughout the lifetime of the facility (Block and Nash 1993). In addition, thecooling air for the vault is passed through prefilters and HEPA filtration prior to discharge forremoval of essentially all particulates.
Annual radiological emissions of 4.8 x 10 Ci/yr were reported for the IFSF at the IdahoChemical Processing Plant (ICPP) for 1992 (DOE 1993); much lower emission rates would beexpected for HLW interim storage, because of the lower frequency of canister failures resulting inatmospheric releases. Under normal operating conditions, any releases of radionuclides would belimited to those from canister surface contamination. The surface contamination level of canistersproduced from DST waste at Hanford are expected to be less than 370 Bq/m2 for alpha contaminantsand less than 3,700 Bq/m2 for beta-gamma contaminants (Gurley and Minor 1985; Knecht andBerreth 1989). The amount of alpha contaminants adhering to a single HLW canister isapproximately 5 x 10 Ci; the amount of beta-gamma contaminants is 5 x 10 Ci. On the basis ofthis data, radiological atmospheric emissions are assumed to be negligible.

171
A.3.11 Nonradioactive Annual Emissions
The standby emergency electrical generators have been identified as potential air pollutantemitters. Operation is assumed to be so infrequent as to be considered insignificant (PSCo 1990b).In agreement, negligible emissions have been reported for the 115-kW propane-fueled emergencygenerator available at the IFSF (DOE 1993).
A.4 REFERENCES
Baillif, L., and P. Guay, 1990, "Dry Storage Facility for Spent Fuel and Operating Resulting at theCASCAD Facility," in Spectrum '90: Proceedings of the International Topical Meeting on Nuclearand Hazardous Waste Management, Sept. 30-Oct. 4, 1990, Knoxville, Tenn., pp. 356-359.
Baillif, L., et al., 1986, "Dry Storage of Spent Nuclear Fuel," in Proceedings of the ThirdInternational Spent Fuel Storage Technology Symposium/Workshop, April 8-10, 1986, Seattle,Wash.
Block, M.L., and C.F. Nash, 1993, "Implementation of Spent Fuel Storage Operations at Fort St.Vrain," paper presented at the INMM Spent Fuel Seminar, Jan. 13-15, 1993, Washington, D.C.
Bonnet, C , and W.J. Gallagher, 1993, "Spent Fuel Interim Storage: French Experience with DryVaults," in Proceedings of High Level Radioactive Waste Management, April 26-30, 1992, LasVegas, Nev., pp. 77-82.
Boomer, K., 1992, Tank Waste Systems Engineering Study, WHC-EP-0405-Rev. 0, prepared byWestinghouse Hanford Co., Richland, Wash., for U.S. Department of Energy, Office ofEnvironmental Restoration and Waste Management, Washington, D.C.
Bosch, R., and C. Carter, 1991, "Early Deployment of the MRS: The Modular Vault Dry Store," inProceedings of the Second Annual International Conference on High Level Radioactive WasteManagement, April 8-May 3, 1991, Las Vegas, Nev., pp. 684-691.
Cundill, B.R., et al., 1988, "Modular Dry Storage System for Interim Storage of Irradiated Fuel,"in Proceedings of Waste Management '88, Feb. 28-March 3, 1988, Tuscon, Ariz., pp. 553-565.
Deacon, D., 1981, "The Long-Term Dry Storage of Irradiated Oxide Fuel and Vitrified Waste," inNuclear Engineering International 26 (317):32-36, Aug.
Demonie, M., et al., 1987, "Interim Storage Facility for Vitrified High Level Waste," in Spectrum'86: Proceedings: Volume 2, Sept. 14, 1986, Niagara Falls, N.Y., pp. 1148-1155.
172
DOE: See U.S. Department of Energy.
EG&G Idaho, 1991, Adaptations for Siting the Heavy-Water Reactor (HWR) and Light-WaterReactor (LWR) at the INEL, EGG-NPR-8522, Volume II, Rev. A, Idaho Falls, Idaho.
Feizollahi, F., and D. Shropshire, 1993, Waste Management Facilities Cost Information EstimatingData for Spent Nuclear Fuel, EGG-WM-10708, prepared by EG&G Idaho, Idaho Falls, Idaho, forU.S. Department of Energy, Washington, D.C.
Fletcher, J.F., and R.I. Smith, 1989, Re-Evaluation of Monitored Retrievable Storage Concepts,PNL-5176-Add. 1, prepared by Pacific Northwest Laboratory, Richland, Wash., for U.S. Departmentof Energy, Washington, D.C.
Gurley, R.N., and J.E. Minor, 1985, "Hanford Waste Vitrification, An Overview," in Proceedingsof Waste Management '85, Volume I, March 24-28,1985, Tucson, Ariz., pp. 179-184.
IAEA: See International Atomic Energy Agency.
International Atomic Energy Agency, 1988, Survey of Experience with Dry Storage of Spent NuclearFuel and Update of Wet Storage Experience, Technical Reports Series No. 290, Vienna, Austria.
Jardine, L.J., et al., 1989, "A Passive Air-Cooled Dry Storage Facility for Vitrified High-LevelWastes," in Proceedings of the Symposium on Waste Management, Feb. 26-March 2,1989, Tucson,Ariz., pp. 457-462.
Johnson, E.R., 1990, "Choosing At-Reactor Spent Fuel Storage Technologies," in Proceedings ofthe International Topical Meeting, High Level Radioactive Waste Management, April 8-12,1990,Las Vegas, Nev., pp. 1030-1036.
Knecht, D.A., and J.R. Berreth, 1989, The Management of Defense High-Level Radioactive Wasteat the Idaho Chemical Processing Plant, WINCO-1063, Westinghouse Idaho Nuclear Company,Idaho Falls, Idaho.
Nash, C.F., 1993, personal communication from Nash (Foster Wheeler Energy Corporation, Clinton,N.J.) to L. Poch (Argonne National Laboratory, Argonne, 111.), Oct. 20.
Pacific Northwest Laboratory, 1982, Nuclear Fuel Cycle Risk Assessment: Descriptions ofRepresentative Non-Reactor Facilities, NUREG/CR-2873, Vol. 2., U.S. Nuclear RegulatoryCommission, Washington, D.C.

173
Plodinec, M.J., 1989, "Establishing the Acceptability of Savannah River Plant Waste Glass," inProceedings of the 1989 Joint International Waste Management Conference, Oct. 23-28, 1989,Kyoto, Japan.
PNL: See Pacific Northwest Laboratory.
PSCo: See Public Service Company of Colorado.
Public Service Company of Colorado, 1990a, Environmental Report for Fort St. Vrain ISFSI LicenseApplication, NRC Docket No. 72-9 (50-267), Denver, Colo.
Public Service Company of Colorado, 1990b, Safety Analysis Report for Fort St. Vrain ISFSILicense Application, NRC Docket No. 72-9 (50-267), Denver, Colo.
Ralph M. Parsons Co., 1985, Integral Monitored Retrievable Storage (MRS) Facility ConceptualDesign Report, DOE/RL/10436-T2-Vol. 4-Bk. 7, U.S. Department of Energy, Washington, D.C.
Silviera, D.J., et al., 1985, Reference-Site Environmental Document for a Monitored RetrievableStorage Facility: Backup Waste Management Option for Handling 1800 MTU Per Year, PNL-5476,Pacific Northwest Laboratory, Richland, Wash.
Smith, R.I., 1983, Monitored Retrievable Storage Conceptual System Study: Open Cycle Vault,BEC-MRS-3304, prepared by Boeing Engineering Co., Richland, Wash., for U.S. Department ofEnergy, Washington, D.C.
Stirrup, T.S., 1993, Air Emission Inventory for the Idaho National Engineering Laboratory —1992Emissions Report, DOE/ED-10437(92), U.S. Department of Energy, Idaho Field Office, Idaho Falls,Idaho.
Street, G.H., et al., 1992, SRS Waste Cost Analysis, WSRC-RP-92-631, Westinghouse SavannahRiver Co., Aiken, S.C.
Triplett, M.B., and R.I. Smith, 1984, Evaluation of Concepts for Monitored Retrievable Storage ofSpent Nuclear Fuel and High-Level Radioactive Waste, PNL-5176, Pacific Northwest Laboratory,Richland, Wash.
U.S. Department of Energy, 1986a, Environmental Assessment for a Monitored Retrievable StorageFacility, DOE/RW-0035/1, Vol. 2, Office of Civilian Radioactive Waste Management, Washington,D.C.

174
U.S. Department of Energy, 1986b, Perspective on Methods to Calculate a Fee for Disposal ofDefense High-Level Waste in Combined (Civilian Defense) Repositories, DOE/RL-86-10,Washington, D.C.
U.S. Department of Energy, 1989, Final Version Dry Cask Storage Study, DOE/RW-0220, Officeof Civilian Radioactive Waste Management, Washington, D.C.
U.S. Department of Energy, 1993,1992 Idaho National Engineering Laboratory (INEL) NationalEmission Standards for Hazardous Air Pollutants (NESHAPs) Annual Report, DOE/ID-10342(92),Idaho Operations Office, Idaho Falls, Idaho.
Woods, W.D., et al., 1988, MRS Action Plan Task B Report: Analyses of Alternative Designs andOperating Approaches for a Monitored Retrievable Storage Facility, PNL-6770, Pacific NorthwestLaboratory, Richland, Wash.