Embed Size (px)
Citation preview

CBS Engineering &
Advanced Technology
High Definition Electronic News Gathering
(HD-ENG) Field Test Report
May 1, 2006
Prepared By: Walter Sidas Greg Coppa
Robert P. Seidel

HD-ENG Test Report CBS Engineering
Page 1
Table Of Contents
1.0 Scope......................................................................................................................................... 3
2.0 Introduction............................................................................................................................. 4
3.0 Test Program Objectives........................................................................................................ 5
4.0 Description of Test Program.................................................................................................. 5 4.1. Adjacent and Co-channel SD Tests ....................................................................................................................5 4.2. HDTV Data Rate Tests.......................................................................................................................................5 4.3. High Data Rate 35 Mbps Tests ...........................................................................................................................6 4.4. Data Collection Procedures ................................................................................................................................6 4.4.1. Transmit and Receive Antenna Alignment Procedure.....................................................................................6 4.4.2. Data Collection ................................................................................................................................................6 4.4.2.1. Adjacent and Co-channel Data Collection....................................................................................................7 4.4.2.2. HDTV Data Rate and 35 Mbps Data Collection...........................................................................................7 4.4.3. Calibration .......................................................................................................................................................7
5.0 System Description.................................................................................................................. 8 5.1. Modulation Characteristics .................................................................................................................................8 5.2. Transmit System.................................................................................................................................................8 5.2.1. Transmit Block Diagram .................................................................................................................................8 5.3. Receive System...................................................................................................................................................9 5.3.1. Receive Block Diagram...................................................................................................................................9
6.0 Transmit Sites........................................................................................................................ 11 6.1. HDTV Data Rate and 35 Mbps Transmit Sites ................................................................................................11 6.2. Adjacent and Co-channel transmit Sites ...........................................................................................................13
7.0 Data Analysis......................................................................................................................... 14 7.1. DVB-T Modulation and Data Rates .................................................................................................................14 7.2. DVB-T Carrier to Noise Requirements ............................................................................................................14 7.3. HDTV Data Rate Testing .................................................................................................................................15 7.3.1. Site Performance............................................................................................................................................15 7.3.1.1. Locations Within a 35 Mile Radius ............................................................................................................15 7.3.1.1.1. LOS Locations .........................................................................................................................................16 7.3.1.1.2. Bounce Locations ....................................................................................................................................16 7.3.1.1.3. LOS and Bounce Location Analysis........................................................................................................17 7.3.1.1.4. Summary of All LOS and Bounce Sites ..................................................................................................17 7.3.1.2. Locations Within a 50 Mile Radius ............................................................................................................17 7.3.1.2.1. LOS Locations .........................................................................................................................................19 7.3.1.2.2. Bounce Locations ....................................................................................................................................19 7.3.1.2.3. LOS and Bounce Location Analysis........................................................................................................19 7.3.1.3. C/N Margin Performance............................................................................................................................20 7.3.1.4. FEC Performance........................................................................................................................................23 7.3.1.5. HDTV Data Rate Test Site Failure Analysis ..............................................................................................23 7.4. High Data Rate 35 Mbps Tests .........................................................................................................................24 7.5. Adjacent and Co-channel SD Testing...............................................................................................................26

HD-ENG Test Report CBS Engineering
Page 2
8.0 Results .................................................................................................................................... 27
9.0 Conclusion ............................................................................................................................. 27
10.0 Acknowledgements ............................................................................................................. 28
11.0 References............................................................................................................................ 28
12.0 Appendix.............................................................................................................................. 28 12.1. List of Tables ..................................................................................................................................................28 12.2. List of Figures.................................................................................................................................................28

HD-ENG Test Report CBS Engineering
Page 3
1.0 Scope
This document presents the results of High Definition (HD) Electronic News Gathering (HD-ENG) field tests performed by CBS. It describes the objectives, methodology, and field tests performed to determine the optimal operating parameters of digital microwave transmission and reception in an urban environment using compressed HD signals at bit rates from 18 to 28 Mbps. The microwave signals were transmitted using the new, FCC mandated [1]-[4], 2 GHz, 12 MHz channel plan and employed Coded Orthogonal Frequency Division Multiplexed (COFDM) modulation.
The tests were performed using a typical ENG vehicle, modified to incorporate an HD encoder and the COFDM modulation equipment. Six COFDM configurations were tested to determine the maximum bit rate that could be reliably delivered.
Signals were transmitted from locations frequently used for newsgathering such as the United Nations, City Hall, and the World Trade Center, thus representing “real world” conditions and included near and distant Line of Sight (LOS) and “bounce” transmissions.
The transmitted COFDM signals were received at the Empire State Building using existing RF microwave antennas. COFDM demodulation and HD decoding equipment were added to the receive path to gather received signal quality data.
Analysis of the data collected for the variety of field conditions experienced during the tests is presented. The analysis is used to determine the optimal operating parameters and performance of HD-ENG in New York and that expected in other major US cities.
In addition to the HD-ENG results, this document describes the field tests performed that quantified Standard Definition (SD) digital (COFDM) signal transmission using the new 2 GHz plan. Tests were performed to verify single, adjacent channel and geographically diverse co-channel performance. Interference free adjacent channel performance was verified using 6 and 8 MHz transmission channels (“pedestals”) at several modulation and data rates. The result of this work is presented.
Finally, a 35 Mbps, 16 QAM (non-COFDM), fixed forward error correction (FEC) modulation, transmission system was tested. This work was undertaken to determine whether this type of modulation could be used in an urban environment. The result of this work is presented.
The scope of the work herein was not concerned with the compression quality of the audio or video, except when these signals are used as a means to determine that the data has been correctly recovered.

HD-ENG Test Report CBS Engineering
Page 4
2.0 Introduction
According to a mandate from the FCC by September 2007 the 2 GHz Broadcast Auxiliary Band will have completed the transition from the 17 MHz per channel (1990 to 2110 MHz) to a new 12 MHz per channel (2025.5 to 2109.5 MHz) spectrum plan.
This transition is expected to increase the use of digital transmission, as the reduced channel bandwidth of the new spectrum plan will degrade the performance of analog SD transmissions below “broadcast quality”. In order to have equivalent broadcast quality, digital compression and transmission must be employed.
This microwave spectrum transition also comes at a key point in the transition to High Definition News. An increasing number of News organizations have transitioned their studio operations to HD and are aggressively promoting their HD News broadcasts. The availability of low cost HD News gathering equipment is increasing and, in many cases, dual mode SD/HD camcorders cost less than the SD only equivalent. Thus, the transition to HD News gathering is imminent and the requirement to provide systems with equivalent functionality is paramount.
One such system is ENG microwave. Existing SD microwave systems are a combination of analog and digital equipment. Typical ENG digital microwave systems are based upon the DVB-T specification [5], which uses COFDM modulation and relatively low bit rates. HD-ENG requires higher bit rates to achieve the audio/video quality necessary for further processing for broadcast and yet must be reliably delivered.
In a series of tests representing “real world” conditions, data was gathered and subsequently analyzed. The focus of the data analysis was used to determine the optimal operating parameters for HD-ENG in New York City. Since the urban canyons of New York City represent an extremely difficult RF environment it is expected that these parameters will be valid for other major US cities.

HD-ENG Test Report CBS Engineering
Page 5
3.0 Test Program Objectives
The objectives of the CBS test program were:
• Determine the optimal operational parameters for the highest bit rate possible for reliable HD-ENG delivery.
• Measure transmission paths as exist in the New York City metropolitan area. This includes transmission from “real world” sites frequently used for news events at which ENG coverage is required.
• Determine the operational parameters for adjacent and co-channel SD digital microwave transmission in a 12 MHz channel.
• Provide a uniform series of measurement procedures so that other organizations in different locations can perform similar measurements and compare results.
• Identify the variables in the environment and recommend the minimum set of variables to be measured.
• Collect data useful in creating operational guidelines for digital HD-ENG at 2 GHz in the narrower 12 MHz band plan using 8 MHz pedestals.
• Test and document results of a prototype 35 Mbps non-COFDM transmission system.
4.0 Description of Test Program
The test program’s primary objective was to determine the optimal operating parameters of digital microwave transmission and reception using the new 2 GHz, 12 MHz channel plan in an urban environment using compressed HD signals at bit rates from 18 to 28 Mbps.
4.1. Adjacent and Co-channel SD Tests
A series of tests were performed in June 2005. The objective of the tests was to determine feasibility of adjacent and co-channel SD transmissions using a variety of transmission parameters e.g. power, polarization and signal paths. The tests were conducted using mostly LOS paths.
These tests, with up to three ENG microwave vans, utilized 6 and 8 MHz bandwidth channels, in the narrower 12 MHz channel plan at 2 GHz.
4.2. HDTV Data Rate Tests
A second series of tests were performed in March 2006. The objective of these tests was to determine operational parameters required to achieve the highest bit rate possible for reliable HDTV transmission. These tests used one ENG van and recorded parameters for

HD-ENG Test Report CBS Engineering
Page 6
quasi-error free HDTV transmission. The tests concentrated on collecting reception data from “difficult” transmit sites, that required a bounce. A variety of LOS locations, considered “easy” transmit sites with increasing distances from the Empire State Building, were measured for all data rates to determine the relationship between data rate and transmit distance.
4.3. High Data Rate 35 Mbps Tests
A prototype 35 Mbps, 16-QAM (non-COFDM), transmission system was evaluated as part of the March 2006 tests. The objective of this test was to evaluate the performance of a non-COFDM modulation transmission system in LOS and bounce applications.
4.4. Data Collection Procedures
4.4.1. Transmit and Receive Antenna Alignment Procedure
The control of the receive antenna was switched to local control, allowing the operator at the Empire State Building to position the receive antenna.
When the microwave van was in position, and transmitting, the van operator contacted the operator at the Empire State Building, who then adjusted the azimuth of the receive antenna until the highest receive signal level (RSL) was measured. It was further refined in coordination with the transmit van, by adjusting azimuth, and tilt of the transmit antenna, and selecting the combination of transmit power, antenna pointing and polarization, that resulted in the best combination of RSL and Link Quality (LQ). The LQ is an index that rates from 10, which is perfect, to 0, which is no reception. The LQ metric is a combination of Carrier to Noise (C/N), RSL and Bit Error Rate (BER).
At this setting, the receive angle of the antenna azimuth, LQ, and RSL were recorded on the data sheet.
A novel approach to antenna alignment for the HDTV data rate tests was developed. A low bit rate, 9.68 Mbps, QPSK, Forward Error Correction (FEC) 7/8 and Guard Interval (GI) 1/8, COFDM configuration was preset (antenna alignment preset) in the Microwave Radio Communications (MRC) transmission equipment. This preset is meant to provide a robust transmission signal that can be used to align the antennas for optimal receive performance, without having to use an analog transmission. Once the antenna position is optimized the operating preset is chosen.
4.4.2. Data Collection
Software provided by MRC displays Signal to Noise (SNR), Pre-FEC, Post-FEC and LQ parameters on a laptop computer. These parameters were recorded on the data sheet for each of the configurations that were tested.

HD-ENG Test Report CBS Engineering
Page 7
4.4.2.1. Adjacent and Co-channel Data Collection
Once the link was established and the parameters recorded, the received picture was observed and any anomalies or breakup were noted during a five-minute period and recorded on the data sheet.
The transmission settings were then changed to the preset corresponding to the next data rate and the data was recorded for that combination of parameters. This procedure was repeated for all the data rates and both the adjacent and co-channel cases.
4.4.2.2. HDTV Data Rate and 35 Mbps Data Collection
Using the antenna alignment preset, the operator at the Empire State Building adjusted the azimuth of the receive antenna until the highest RSL was received. The picture was then observed on a high definition picture monitor, and recorded for 5 minutes using a Sony XDCAM-HD disc recorder. Anomalies and/or breakup in the picture were noted. Then the microwave van changed to the next preset corresponding to a higher data rate and the data was recorded for that combination of preset parameters. This was done for Presets 1, 2, 3, 4 and 5. The corresponding parameters and data rates are shown in Table 4.1.
Bandwidth (MHz)
Modulation System
Code Rate Data Rate (Mbps)
Guard Interval
Preset
8 QPSK 7/8 9.68 1/8 6 8 16-QAM 5/6 18.43 1/8 1 8 16-QAM 7/8 19.35 1/8 2 8 64-QAM 2/3 22.12 1/8 3 8 64-QAM 3/4 24.88 1/8 4 8 64-QAM 5/6 27.65 1/8 5
Table 4.1 HDTV Data Rate COFDM Preset Settings
Upon completion of the COFDM testing, the 35 Mbps non-COFDM system was tested. For the 35 Mbps tests, the RSL, SNR, and Error Vector Magnitude (EVM) were recorded on the data sheet. The picture was then observed on a high definition picture monitor, and recorded for five minutes using a Sony XDCAM-HD disc recorder. Anomalies and/or breakup in the picture were noted and recorded on the data sheet.
4.4.3. Calibration
System Calibration was performed at the start of the tests and repeated when necessary. The transmit van would go to a known LOS site and the link performance and picture quality would be recorded and compared against known good settings. Any anomalies would be corrected before testing would continue.

HD-ENG Test Report CBS Engineering
Page 8
5.0 System Description
5.1. Modulation Characteristics
The DVB-T transmission system utilizes COFDM made up of 2,000 carriers that are spaced a few KHz apart across the operating signal bandwidth of 8, 7 or 6 MHz. Each carrier is modulated with one bit of data at a time. The modulation format of all carriers is operator selectable as QPSK, 16-QAM or 64-QAM.
The DVB-T also defines five selectable forward error correction (FEC) settings or “Code Rates”. These are 1/2, 2/3, 3/4, 5/6 and 7/8. The more error correction is used the less data will be transmitted for a given data rate, for example, an FEC of 1/2 means that for every two transmitted bits one is an error correction bit.
Another parameter that is important when using COFDM is the “Guard Interval” (GI). This guard interval improves the multi-path performance. Guard intervals are defined as 1/4, 1/8, 1/16 or 1/32 of the transmitted interval. The guard interval size affects the maximum data rate.
Typical SD digital ENG operations currently use an 8 MHz wide signal, QPSK, 1/2 FEC and GI of 1/4 resulting in a bit rate of 5.53 Mbps. Most SD digital ENG equipment in use today is delivered with these settings yielding very robust transmission however, the resulting video quality in not optimal.
5.2. Transmit System
All testing was done using an ENG van equipped with MRC CodeRunner-2 digital microwave transmitters and MPEG-2 audio/video encoders for the SD and HD signals.
The SD adjacent and co-channel tests used up to three similarly equipped ENG vans with MRC digital microwave transmitters and SD encoders.
5.2.1. Transmit Block Diagram
Figure 5.1 is the ENG van transmit block diagram. This diagram shows both the SD and HD configurations.
In both the SD and HD tests a video camera was used to provide source signals. For the HD signal, a Sony HDW-700A camera was used.
MPEG-2 compression was used to encode both the SD and HD source audio and video signals. The SD encoder used for the adjacent and co-channel tests was a Tandberg model 5750. The HD signals were encoded using a NTT Electronics (NEL) HE-3000 encoder.
The SD encoder’s output is a 70 MHz IF signal. The HD encoder’s output is an ASI signal that is connected to the input of a MRC CodeRunner-2, COFDM modulator/transmitter. The CodeRunner-2’s input is selected between the IF or ASI signal depending upon the test being conducted. The CodeRunner-2’s output is a 2 GHz RF signal that is delivered to the mast mounted RF power amplifier.

HD-ENG Test Report CBS Engineering
Page 9
For the 35 Mbps testing an MRC model SCM-4000 modem that outputs a 70 MHz IF signal was used. The IF signal is connected to the CodeRunner’s IF input where it is then delivered to the mast mounted RF power amplifier.
HD-SDI
MRCSCM 400016-QAM
MODULATORNEL
HE-3000ENCODER
COFDMMODULATOR
MRCCODERUNNER 2TRANSMITTER
XMTRASI
ASI
RF AMP
( 2 GHz
ANTENNA
70 MHz IF
HD CAMERA
SDI TANDBERG5750
ENCODERCAMERA
70 MHz IF
SD
HD 35 Mbps
Figure 5.1 Digital ENG Transmit Block Diagram
Each van has a telescoping mast, capable of raising the antenna to 30 feet. Controls in the van provide means to adjust the transmitted power level and azimuth, tilt, and polarization of the antenna.
For the HD tests, presets on the NEL encoder and the CodeRunner-2 are used to change operating parameters for the different data rates.
5.3. Receive System
5.3.1. Receive Block Diagram
The receive block diagram appears in Figure 5.2. MRC UltraScan DR-2 receive antennas are mounted on the northwest and southeast corners of the 84th floor roof of the Empire State Building. These antennas can be positioned to cover most of the sites required for newsgathering operations. The receive antennas are normally controlled remotely by WCBS-TV Microwave Control however, for the DENG tests the antennas were controlled locally in the WCBS-TV transmitter facility on the 83rd floor of the Empire State Building.

HD-ENG Test Report CBS Engineering
Page 10
RF signals at 2 GHz are input to the MRC CodeRunner-4 receiver. The receiver down-converts the received COFDM modulated signal to a 70 MHz IF signal.
For the HD-ENG tests, the received IF signal is demodulated using the MRC model MRX-4000, which outputs an ASI signal. The ASI signal is connected to the NEL decoder, which decodes the compressed audio and video signal and outputs a baseband HDSDI signal with embedded audio.
For the 35 Mbps tests, the received IF signal is demodulated using the MRC model SCM-4000, which outputs an ASI signal that contains the 35 Mbps signal. This signal is input to the NEL decoder, which decodes the compressed signals and outputs a baseband HDSDI signal.
For the adjacent and co-channel tests, the received IF signal is distributed to the input of a MRC Strata RXU receiver that demodulated the COFDM signal and decoded the MPEG-2 (4:2:0) signal. The output of the decoder was displayed on a picture monitor. A quad-split video display device was used to display the multiple received SD signals.
NEL 3100HD
DECODERMONITORMRC
CODERUNNER 4RECEIVER
MRCMRX 4000DEMOD
RECEIVEANTENNA COMPUTER
TROLLTS 950 SL
HDSDI
RF
IF ASI
CONTROL
TANDBERGDEMOD
IF
HD
SD
MRCSCM 4000DEMOD
IF ASI
35 Mbps
Figure 5.2 Digital ENG Receive Block Diagram

HD-ENG Test Report CBS Engineering
Page 11
6.0 Transmit Sites
6.1. HDTV Data Rate and 35 Mbps Transmit Sites
Transmit sites in the New York City region were selected to provide a variety of transmit paths including sites regularly used by WCBS-TV for electronic News gathering.
Selection criteria included “difficult” sites, that require the transmitted signal to be reflected or “bounced” off of an adjacent building to reach the receive site, and “easy” sites that have LOS to the receive site. For the LOS locations, various distances, near and far were selected to collect data on the performance of the path as data rate increased.
Table A.1 in the Appendix is a list of the transmit sites, site number and distance from the Empire State Building for the data rate tests.
Figure 6.1 shows the sites within 6 miles of the Empire State Building.
Figure 6.1 Sites Within 6 Miles of the Empire State Building

HD-ENG Test Report CBS Engineering
Page 12
Figure 6.2 shows the transmit sites located 10 to 25 miles from the Empire State Building
Figure 6.2 Sites Within 10 to 25 Miles of the Empire State Building
Figure 6.3 shows the transmit sites located 25 to 51 miles from the Empire State Building
Figure 6.3 Transmit Sites Within 25 to 51 Miles of the Empire State Building
HD-ENG Test Report CBS Engineering
Page 13
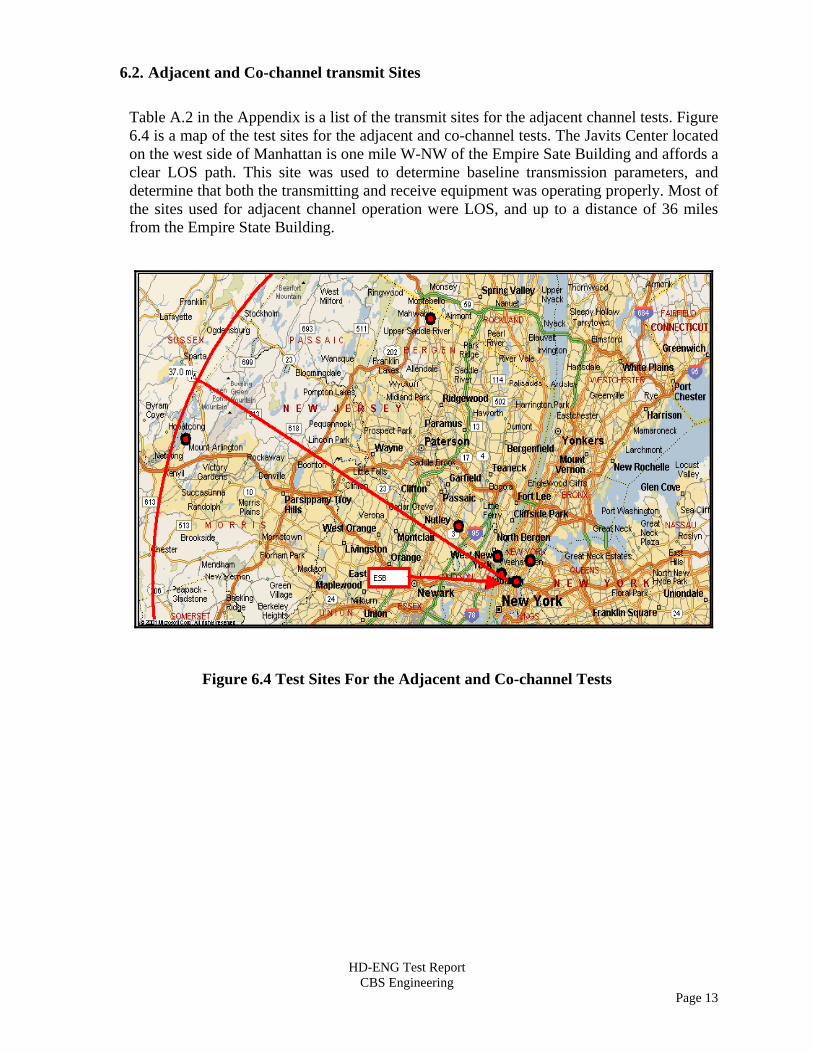
6.2. Adjacent and Co-channel transmit Sites
Table A.2 in the Appendix is a list of the transmit sites for the adjacent channel tests. Figure 6.4 is a map of the test sites for the adjacent and co-channel tests. The Javits Center located on the west side of Manhattan is one mile W-NW of the Empire Sate Building and affords a clear LOS path. This site was used to determine baseline transmission parameters, and determine that both the transmitting and receive equipment was operating properly. Most of the sites used for adjacent channel operation were LOS, and up to a distance of 36 miles from the Empire State Building.
Figure 6.4 Test Sites For the Adjacent and Co-channel Tests

HD-ENG Test Report CBS Engineering
Page 14
7.0 Data Analysis Data analysis for the HDTV data rate, 35 Mbps, and SD adjacent and co-channel tests are presented below.
7.1. DVB-T Modulation and Data Rates
When analyzing the data, it is important to understand that the different data rates encompass three different modulation schemes. The different modulation characteristics are detailed in Table 7.1.
Bandwidth (MHz)
Modulation System
Code Rate Data Rate (Mbps)
TV Resolution
8 QPSK 1/2 5.53 Manufacturer Default 8 QSPK 7/8 9.68 Antenna Aiming 8 16-QAM 5/6 18.43 HD 8 16-QAM 7/8 19.35 HD 8 64-QAM 2/3 22.12 HD 8 64-QAM 3/4 24.88 HD 8 64-QAM 5/6 27.65 HD 6 QPSK 2/3 5.53 SD 6 QPSK 3/4 6.22 SD 6 QPSK 5/6 6.91 SD 6 QPSK 7/8 7.26 SD 6 64-QAM 3/4 18.66 HD 6 64-QAM 5/6 20.74 HD 6 64-QAM 7/8 21.77 HD
Table 7.1 DVB-T Modulation Parameters, 1/8 Guard Interval
7.2. DVB-T Carrier to Noise Requirements
The different DVB-T modulation systems have different minimum Carrier-to-Noise (C/N) ratios that must be taken into consideration when analyzing the data. The minimum C/N is also different for the type of channel model. A Gaussian channel, where the direct receive signal is only impaired by white noise, will have the lowest C/N requirement. A Ricean channel, where the signal path is impaired by a number of echoes of varying levels and phases, will have a slightly higher C/N for the same modulation. A Rayleigh channel, which has no direct line of sight and has multiple echoes similar to the Ricean channel, has the highest C/N requirement of the channel models and is closest to actual field conditions.

HD-ENG Test Report CBS Engineering
Page 15
Required C/N for a 2x10⁻⁴ BER to have Quasi-Error-Free Reception after FEC Data Rate
(Mbps) Modulation FEC Gaussian
(dB) Ricean
(dB) Rayleigh
(dB) 9.68 QPSK 7/8 7.7 8.7 16.3 18.43 16-QAM 5/6 13.5 14.4 19.3 19.35 16- QAM 7/8 13.9 15.0 22.8 22.12 64-QAM 2/3 16.5 17.1 19.3 24.88 64-QAM 3/4 18.0 18.6 21.7 27.65 64-QAM 5/6 19.3 20.0 25.3
Table 7.2 QEF Performance for Gaussian, Ricean, Rayleigh Channels with 1/8 Guard Interval and 8 MHz Channel Bandwidth
For Quasi-Error-Free (QEF) reception, a bit error rate of 2x10⁻⁴, after FEC is applied, is required. Table 7.2 lists the C/N ratio required to achieve QEF for the Gaussian, Ricean, and Rayleigh channels.
7.3. HDTV Data Rate Testing
HDTV Data rate testing was undertaken to determine the maximum data rate that could be transmitted using a DVB-T 8 MHz pedestal in a 12 MHz channel. It should be noted that the 9.68 Mbps data rate was only used for antenna sighting and is insufficient to provide “broadcast quality” HDTV transmissions, since the HD-ENG signal will be concatenated with the ATSC compression process when it is broadcast to the home. Achieving the highest data rate possible with quasi-error free receive performance is thus highly desirable.
7.3.1. Site Performance
A total of 31 test locations were used for the HDTV data rate tests that included 11 LOS and 20 totally obstructed, bounce sites.
BER and RSL were recorded at each site. The audio and video signals were observed for a period of five minutes; during which time the number of audio/video disturbances or “hits” was recorded. A site was deemed to have been a success if there were less than or equal to three audio/video disturbances during a five minute interval.
7.3.1.1. Locations Within a 35 Mile Radius
Since the vast majority of ENG sites are within a 35-mile radius of the television station, data was collected and analyzed for sites with locations within a 35-mile radius. LOS and bounce sites with this radius are analyzed below.

HD-ENG Test Report CBS Engineering
Page 16
7.3.1.1.1. LOS Locations
Figure 7.1 is a bar chart, which plots the percentage of successful sites for LOS locations within a 35-mile radius for the 6 data rates under test. A 100% success rate was achieved for the 6 data rates with only 1 Watt of transmitted power.
Percentage of successful line-of-sight locations less than 35 miles
100% 100% 100% 100% 100% 100%
0%
10%
20%
30%
40%
50%
60%
70%
80%
90%
100%
9.68 18.43 19.35 22.12 24.88 27.65
Data Rate Mbps
% o
f suc
cess
ful s
ites
Bit Rate (Mbps) Modulation
Rayleigh Channel min. C/N (dB) FEC
9.68 QPSK 16.3 7/8 18.43 16-QAM 19.3 5/6 19.35 16-QAM 22.8 7/8 22.12 64-QAM 19.3 2/3 24.88 64-QAM 21.7 3/4 27.65 64-QAM 25.3 5/6
Figure 7.1 Percentage of LOS Locations Less Than 35 Miles
7.3.1.1.2. Bounce Locations
Figure 7.2 is a bar chart of the percentage of successful sites that required a bounce of the transmitted signal off adjacent buildings to reach the Empire State Building. The maximum transmission distance for any bounce site was 27.5 miles.
The baseline data rate of 9.68 Mbps, which was used for sighting the antenna, had a 100% success rate for all bounce locations. The 18.43 and 22.12 Mbps signals had comparable success rates of 95% and 90% respectively. This is expected since these two modulation schemes have the same minimum C/N requirement of 19.3 dB for a Rayleigh channel (Table 7.2).
The 19.35 Mbps signal had a receive success rate of 80%. This lower success rate is attributed to the higher C/N noise requirement of 22.8 db for a Rayleigh channel. The 24.88 Mbps signal had a success rate for bounce locations of 75% and the 27.65 Mbps had a success rate for bounce locations of 60%.

HD-ENG Test Report CBS Engineering
Page 17
Percentage of successful bounce locations less than 35 miles
100%95%
80%
90%
75%
60%
0%
10%
20%
30%
40%
50%
60%
70%
80%
90%
100%
9.68 18.43 19.35 22.12 24.88 27.65
Data Rate Mbps
% o
f suc
cess
ful s
ites
Bit Rate (Mbps) Modulation
Rayleigh Channel min. C/N (dB) FEC
9.68 QPSK 16.3 7/8 18.43 16-QAM 19.3 5/6 19.35 16-QAM 22.8 7/8 22.12 64-QAM 19.3 2/3 24.88 64-QAM 21.7 3/4 27.65 64-QAM 25.3 5/6
Figure 7.2 Percentage of Successful Bounce Locations Less Than 35 Miles
7.3.1.1.3. LOS and Bounce Location Analysis
Figure 7.3 is a bar chart of the total successful locations for both LOS and bounce sites. The baseline data rate of 9.68 Mbps had a 100% success rate. The 18.43 and 22.12 Mbps signals had a success rate of 96% and 93% respectively. The 19.35 Mbps signal had a success rate of approximately 85%. This lower success rate is again attributed to the higher C/N required for this modulation scheme. The 24.88 Mbps signal had a 81% success rate and the 27.65 Mbps signal had a 70% success rate.
7.3.1.1.4. Summary of All LOS and Bounce Sites
Figure 7.4 is a summary bar chart of the total successful locations for both LOS and bounce sites less than 35 miles.
7.3.1.2. Locations Within a 50 Mile Radius
To determine the distance limitations of each modulation format, transmissions were extended out to a 50-mile radius. Data was collected and analyzed for LOS and bounce sites within this radius and is presented below.

HD-ENG Test Report CBS Engineering
Page 18
Percentage of successful line-of-sight & bounce locations less than 35 miles
100%96%
85%
93%
81%
70%
0%
10%
20%
30%
40%
50%
60%
70%
80%
90%
100%
9.68 18.43 19.35 22.12 24.88 27.65
Data Rate Mbps
% o
f suc
cess
ful s
ites
Bit Rate (Mbps) Modulation
Rayleigh Channel min. C/N (dB) FEC
9.68 QPSK 16.3 7/8 18.43 16-QAM 19.3 5/6 19.35 16-QAM 22.8 7/8 22.12 64-QAM 19.3 2/3 24.88 64-QAM 21.7 3/4 27.65 64-QAM 25.3 5/6
Figure 7.3 Percentage of Successful LOS and Bounce Locations Less Than 35 Miles
Percentage of successful site less than 35 miles
100%
100%
100%
100%
100%
100%
93%
70%
81%
85%
96%
100%
90% 60%
75%
80%
95%
100%
0%
10%
20%
30%
40%
50%
60%
70%
80%
90%
100%
9.68 18.43 19.35 22.12 24.88 27.65
Data Rate Mbps
% o
f suc
cess
ful s
ites
Line-of-sight <35 miles total sites <35 miles Bounce sites <35 miles
Bit Rate (Mbps) Modulation
Rayleigh Channel min. C/N (dB) FEC
9.68 QPSK 16.3 7/8 18.43 16-QAM 19.3 5/6 19.35 16-QAM 22.8 7/8 22.12 64-QAM 19.3 2/3 24.88 64-QAM 21.7 3/4 27.65 64-QAM 25.3 5/6
Figure 7.4 Summary of the Percentage of Successful Sites Less Than 35 Miles

HD-ENG Test Report CBS Engineering
Page 19
7.3.1.2.1. LOS Locations
Figure 7.5 is a bar chart that plots the percentage of successful LOS locations to a radius of 50 miles. A 100% success rate was achieved for the 9.68, 18.43, and 19.35 Mbps data rates at 1 Watt of transmitted power. As expected, bit rates above 22 Mbps show a distance limitation of less than 50 miles using 1 Watt of transmitted power.
Percentage of successful line-of-sight locations less than 50 miles
100% 100% 100%
91%
73% 73%
0%
10%
20%
30%
40%
50%
60%
70%
80%
90%
100%
9.68 18.43 19.35 22.12 24.88 27.65
Data Rate Mbps
% o
f Suc
cess
ful s
ite
Bit Rate (Mbps) Modulation
Rayleigh Channel min. C/N (dB) FEC
9.68 QPSK 16.3 7/8 18.43 16-QAM 19.3 5/6 19.35 16-QAM 22.8 7/8 22.12 64-QAM 19.3 2/3 24.88 64-QAM 21.7 3/4 27.65 64-QAM 25.3 5/6
Figure 7.5 Percentage of Successful LOS Sites Less Than 50 Miles
7.3.1.2.2. Bounce Locations
The furthest bounce site was 27.5 miles therefore the bounce location analysis is the same as that for the 35-mile radius case described in Figure 7.2
7.3.1.2.3. LOS and Bounce Location Analysis
Figure 7.6 is a bar chart of the total successful locations for both LOS and bounce sites. The baseline data rate of 9.68 Mbps had a 100% success rate. The 18.43 and 22.12 Mbps signals had a success rate of 97% and 90% respectively. The 19.35 Mbps signal had a success rate of approximately 87%. This lower success rate is again attributed to the higher C/N required for this modulation scheme. The 24.88 Mbps signal had a 74% success rate and the 27.65 Mbps signal had a 65% success rate.

HD-ENG Test Report CBS Engineering
Page 20
Percentage of successful line-of-sight & bounce locations less than 50 miles
100%97%
87%90%
74%
65%
0%
10%
20%
30%
40%
50%
60%
70%
80%
90%
100%
9.68 18.43 19.35 22.12 24.88 27.65
Data Rate Mbps
% o
f suc
cess
ful s
ites
Bit Rate (Mbps) Modulation
Rayleigh Channel min. C/N (dB) FEC
9.68 QPSK 16.3 7/8 18.43 16-QAM 19.3 5/6 19.35 16-QAM 22.8 7/8 22.12 64-QAM 19.3 2/3 24.88 64-QAM 21.7 3/4 27.65 64-QAM 25.3 5/6
Figure 7.6 Percentage of Successful LOS and Bounce Locations Less Than 50 Miles
Figures 7.7 and 7.8 are plots that demonstrate the effects of distance on the different modulation techniques for LOS and bounce conditions. The plots show the success or failure of a given LOS or bounce site vs. distance. As expected the 18.43 Mbps signal and the 22.12 Mbps signal were able to achieve most successful distance performance due to the minimum C/N requirement. Additional plots for the other bit rates that were tested are listed in the Appendix Figures A.1 through A.4.
7.3.1.3. C/N Margin Performance
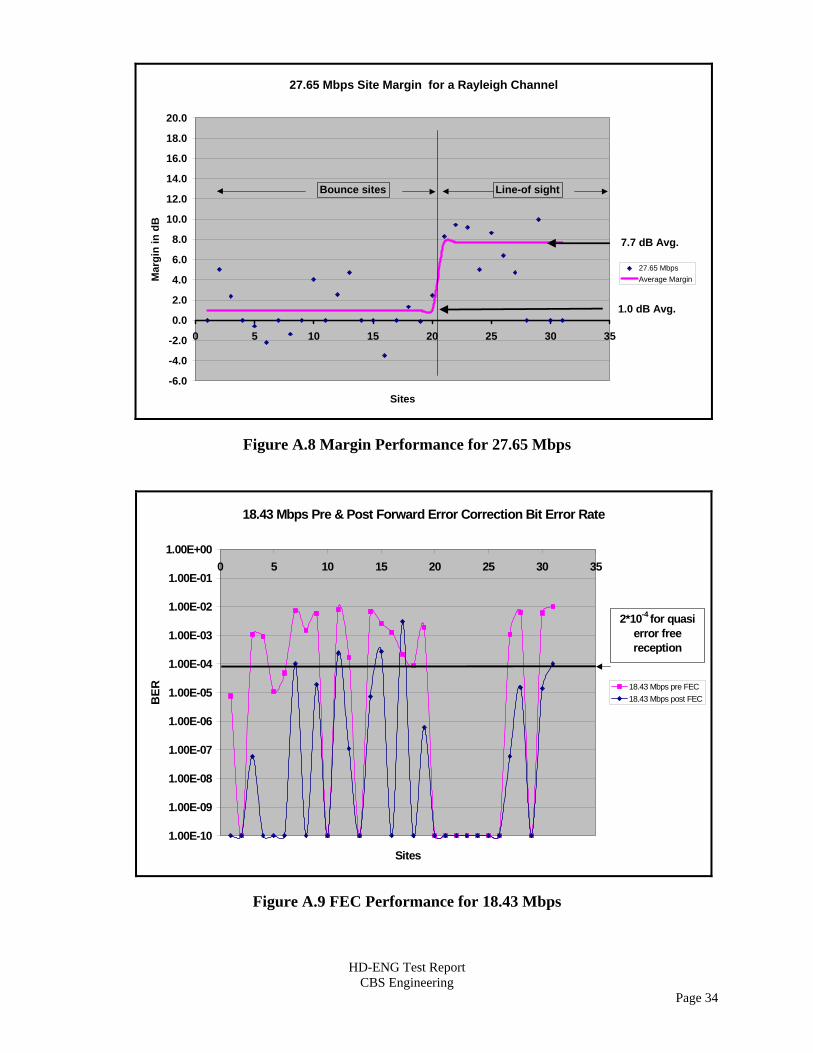
C/N Margin performance for a given site is dependent upon the channel characterization that is assumed and whether a site is LOS or bounce. A Rayleigh channel characterization assumes the highest C/N for a given modulation format and therefore provides the most conservative estimate of margin performance. Figures 7.9 and 7.10 are margin plots for the 18.43 and 22.12 Mbps cases and show comparable margin performance. Plots of the other data rate cases that were tested are listed in the Appendix Figures A.5 through A.9. Both the bounce and LOS locations are plotted with increasing distance from left to right.

HD-ENG Test Report CBS Engineering
Page 21
18.43 Mbps Successful Sites vs Distance
0.2 0.2 0.8 0.8 1.4 1.4 1.7 1.7 1.9 2.4 2.6 2.6 2.8 2.9 3.0 3.0 4.6 6.0 14.3
27.5 0.7 1.0 10
.823
.423
.626
.829
.236
.538
.038
.550
.9
Distance (miles)
18.43 Mbps
Success
Failed
Line-of-sightBounce Sites
Figure 7.7 Successful Sites vs. Distance at 18.43 Mbps
22.12 Mbps Successful Sites vs Distance
0.2 0.2 0.8 0.8 1.4 1.4 1.7 1.7 1.9 2.4 2.6 2.6 2.8 2.9 3.0 3.0 4.6 6.0 14.3
27.5 0.7 1.0 10
.823
.423
.626
.829
.236
.538
.038
.550
.9
Distance (miles)
22.12 Mbps
Success
Failed
Line-of-sightBounce Sites
Figure 7.8 Successful Sites vs. Distance at 22.12 Mbps

HD-ENG Test Report CBS Engineering
Page 22
18.43 Mbps Site Margin for a Rayleigh Channel
-4.0
-2.0
0.0
2.0
4.0
6.0
8.0
10.0
12.0
14.0
16.0
18.0
20.0
0 5 10 15 20 25 30 35
Sites
Mar
gin
in d
B
18.43 MbpsAverage Margin
Bounce sites Line-of sight
4.4 dB Avg.
9.3 dB Avg.
Figure 7.9 Margin Performance at 18.43 Mbps
22.12 Mbps Site Margin for a Rayleigh Channel
-2.0
0.0
2.0
4.0
6.0
8.0
10.0
12.0
14.0
16.0
18.0
20.0
0 5 10 15 20 25 30 35
Sites
Mar
gin
in d
B
22.12 MbpsAverage Margin
Bounce sites Line-of sight
5.0 dB Avg.
7.7 dB Avg.
Figure 7.10 Margin Performance at 22.12 Mbps

HD-ENG Test Report CBS Engineering
Page 23
7.3.1.4. FEC Performance
The effect of FEC on the received signal is to improve the received signal bit error rate. This can be clearly seen in Appendix Figures A.9 through A.13. Note: the bit error rate of 2x10⁻⁴ required for QEF reception is indicated by the dark horizontal line.
Figure 7.11 below shows the distribution of sites with their associated bit error rate after FEC.
Post FEC BER vs Number of Sites
0
5
10
15
20
25
30
35
1.00E-10 1.00E-09 1.00E-08 1.00E-07 1.00E-05 1.00E-04 1.00E-03 1.00E-02 1.00E-01
Post FEC BER
# of
Site
s
9.6818.4319.3522.1224.8827.65
2*10-4 for quasi error
free
Figure 7.11 Post FEC BER vs. Number of Sites
7.3.1.5. HDTV Data Rate Test Site Failure Analysis
A site was deemed to have failed when there were more than three audio/video disturbances or “hits” during a 5 minute period or when the receivers were unable to obtain a carrier lock, which resulted in no audio video signal.
A failed site could be the result of two possible conditions, insufficient RSL and failure to achieve the minimum C/N ratio for the modulation scheme. There was generally good correlation between a failed site and failure to achieve the minimum C/N or RSL of less than –75 dB. Figure 7.12 shows the number of failed sites for each data rate and the number of failed sites that did not achieve the minimum C/N or RSL of –75 dB.

HD-ENG Test Report CBS Engineering
Page 24
Failed Site Analysis
0 1
4
3
8
11
0 1
4
2
7
10
0
1
2
3
4
5
6
7
8
9
10
11
12
9.68 18.43 19.35 22.12 24.88 27.65
Mega bits per second
# of
faile
d si
tes
Failed site hit<=3 in 5 min. Failed sites with min. C/N or RSL< -75dB
Sample size N = 31
Figure 7.12 Failed Site Analysis 7.4. High Data Rate 35 Mbps Tests
Figures 7.13 and 7.14 are plots of the prototype 35 Mbps non-COFDM modulation test results. LOS sites less than 35 miles performed with 100% success. Bounce sites less than 35 miles were successful 15% of the time. Total successful transmissions less than 35 miles were 37%.
LOS performance for sites less than 50 miles was 72%. Bounce performance for 50-mile sites is identical to that of the 35 miles case as no bounce sites at a distance greater than 35 miles were performed.

HD-ENG Test Report CBS Engineering
Page 25
% of successful 35 Mbps 16-QAM sites less than 35 miles
15.0%
100.0%
37.0%
0%
10%
20%
30%
40%
50%
60%
70%
80%
90%
100%
Total sites Bounce sites Line-of-sightType of site
% o
f suc
cess
ful s
ites
Figure 7.13 Successful 35 Mbps 16-QAM Sites Less Than 35 Miles
% of successful 35 Mbps 16-QAM sites less than 50 miles
35.5%
72.7%
15.0%
0%
10%
20%
30%
40%
50%
60%
70%
80%
90%
100%
Total sites Bounce sites Line-of-sightType of site
% o
f suc
cess
ful s
ites
Figure 7.14 Total Successful 35 Mbps 16-QAM Sites

HD-ENG Test Report CBS Engineering
Page 26
7.5. Adjacent and Co-channel SD Testing
The first tests were with one van (MW 9) at the Javits Center, while the second van (MW 4) transmitted from Weehauken, NJ, approximately three miles away, then at one mile away from ESB at the United Nations and Gracie Mansion on the upper east side of Manhattan. For this test, 8 MHz pedestal, QPSK was used at an FEC of 1/2, GI of 1/8. This corresponds to a data rate of 5.53 Mbps. Video was decoded without anomalies.
Three vehicles drove to Mahwah, NJ a town approximately 25 miles W-NW of ESB.
Tests were conducted using 8 and 6 MHz “pedestals”, QPSK and 16-QAM modulation at various settings of FEC and GI with data rates from 4.23 to 14.51 Mbps. Adjacent channel tests were performed with two vans, upper and lower adjacent channel tests were performed using three vehicles. Performance was acceptable.
After establishing a proper link at the Meadowlands Sports Complex in NJ, a LOS path, 6 miles from ESB, one van drove to Mt. Arlington, NJ, a distance of 36 miles from ESB. Combinations of modulation, and data rates of 4.23 to 5.33 Mbps, were tested. Again performance was acceptable.
The adjacent channel tests assessed whether two digital ENG carriers could operate simultaneously.
The first test involved two trucks transmitting 8 MHz DVB-T pedestals in 12 MHz adjacent channels. Both signals were received with an error rate of 1x10⁻⁷ after FEC.
The second test involved two trucks operating 8 MHz DVB-T pedestals in 12 MHz adjacent channels with one truck transmitting with a directional antenna and the second truck transmitting an Omni antenna. Both signals were received with an error rate of 1x10⁻¹⁰ after FEC and no observed video disturbances for a period of five minutes.
The third test involved both trucks operating 8 MHz DVB-T pedestals on the same 12 MHz channel with geographically diverse receive antennas located on the east and wise side of the Empire State Building. Both signals were received with an error rate of 1x10⁻⁷ after FEC with no visible errors during a five-minute period.
The fourth test involved three trucks operating 6 MHz DVB-T pedestals located side-by-side. (i.e. one at the upper end of a 12 MHz channel and two in the next highest channel). All three were operated at equal carrier levels followed by unequal carrier levels that differed by 6 dB. All three signals were received with an error rate of 1x10⁻⁷ after FEC with no visible errors during a five-minute period.

HD-ENG Test Report CBS Engineering
Page 27
8.0 Results
Many of the most difficult ENG locations in the canyons of New York City; such as Gracie Mansion, United Nations, City Hall, Lincoln Center, Wall Street Area, World Trade Center provided reliable HD-ENG transmission paths using a variety of data rates. The success rate of these tests indicates the HD-ENG using an 8 MHz DVB-T pedestal can provide reliable transmission paths for both line of sight and bounce locations. Because high definition signal quality is of paramount importance, all six of these data rates should be loaded as pre-sets in the transmission encoders and modulators. This will afford the broadcaster the greatest flexibility and the highest quality for electronic newsgathering.
D-ENG transmission with adjacent and co-channel signals present will not present operating issues.
Since the 9.68 Mbps signal produced reliable reception for both bounce and line of sight locations, it can be used as a baseline for initial set-up and antenna positioning. For the LOS locations all six of the high definition data rates ranging for 18.43 Mbps to 27.65 Mbps produced a success rate of 100%. For bounce locations, the optimum data rate for the highest quality HDTV transmission is 22.12 Mbps, which achieved a 90% success rate for locations less than 35 miles. While the 18.43 Mbps rate produced a 5% higher success rate, the 22.12 Mbps and 18.43 Mbps rates only differed by one successful site when the transmission distances were less than 35 miles.
On average, the 22.12 Mbps data rate provided a 5.0 dB margin between the received signal level and the minimum C/N level for a Rayleigh channel for bounce sites and 7.7 dB margin for LOS locations. In most locations, the one-Watt transmit power level provided adequate RSL.
The 35 Mbps, 16-QAM (non-COFDM), transmission system should only be used for LOS locations and is not appropriate for links that involve bounce transmission paths to reach the reception antenna.
9.0 Conclusion
Microwave transmissions in the 2 GHz ENG band using the DVB-T (COFDM) transmission system with data rates from 18.43 Mbps to 27.65 Mbps can provide reliable High Definition Television links for electronic newsgathering. This range of data rates provides the broadcasters with a variety of HD quality levels that can be employed for “easy” LOS locations or “difficult bounce’ locations with no direct LOS to the receiving antenna. The tests determined that the optimal operating point for the highest quality HDTV and best C/N is 22.12 Mbps and is the recommended operating point for HD-ENG.
While 9.68 Mbps will not provide acceptable HD video quality for live action images, it can reliably be used for sighting transmit and receive antennas when first establishing the HD link.

HD-ENG Test Report CBS Engineering
Page 28
10.0 Acknowledgements
CBS Engineering would like to acknowledge and thank Jeffrey Birch, and the staff of WCBS-TV, New York, who assisted in these tests – Steve Pair, Peter McGowan and Rich Brody. A special thanks to John Cleary and Jim Fleischman, both of WCBS-TV ENG field operations, whose many years of expertise provided the necessary real world guidance the tests demanded.
Finally, the tests would not have been possible without the assistance and equipment of Microwave Radio Communications and the NTT Electronics Corporation.
11.0 References
1. COFDM Standards and Bandwidth Testing for 12 MHz Broadcast Auxiliary Spectrum Channels, Prepared by Microwave Radio Communications, for Ad Hoc 2 GHz Reallocation Committee Meeting, Washington, DC, June 18, 2003
2. COFDM Bandwidth Testing for 12 MHz Broadcast Auxiliary Spectrum (BAS) Channels, Prepared by Microwave Radio Communications, September 2003
3. Section 2.0- Overview of Digital vs. Analog Operation, Report prepared by Microwave Radio Communications, January 10, 2005
4. Federal Communications Commission, Rules, Part 74.602, Frequency Assignment 5. ETSI EN 300 744 V1.5.1 (2004-11) Digital Video Broadcasting (DVB); Framing
structure, channel coding and modulation for digital terrestrial television
12.0 Appendix
12.1. List of Tables Table A.1 Test Sites for HDTV Data Rate Tests Table A.2 Test Sites for Adjacent and Co-channel
12.2. List of Figures Figure A.1 Successful Sites vs. Distance at 9.68 Mbps Figure A.2 Successful Sites vs. Distance at 19.35 Mbps Figure A.3 Successful Sites vs. Distance at 24.88 Mbps Figure A.4 Successful Sites vs. Distance at 27.65 Mbps Figure A.5 Margin Performance at 9.68 Mbps Figure A.6 Margin Performance for 19.35 Mbps Figure A.7 Margin Performance for 24.88 Mbps Figure A.8 Margin Performance for 27.65 Mbps Figure A.9 FEC Performance for 18.43 Mbps Figure A.10 FEC Performance for 19.35 Mbps Figure A.11 FEC Performance for 22.12 Mbps Figure A.12 FEC Performance for 24.88 Mbps Figure A.13 FEC Performance for 27.65 Mbps

HD-ENG Test Report CBS Engineering
Page 29
TEST SITES FOR DATA RATE TESTS
Site # LOCATIONDISTANCE TO EMPIRE (MI)
AZIMUTH FROM EMPIRE (DEG)
AZIMUTH TO EMPIRE (DEG)
B/LOS
21 377 E33 ST NYC 0.7 121 301 LOS10 TIMES SQUARE 0.8 30 210 B9 ROCKEFFELER CENTER 0.8 29 209 B1 JAVITS CENTER 1.0 308 128 LOS
29 UNITED NATIONS 1 1.0 87 267 B30 UNITED NATIONS 2 1.0 87 267 B17 COLUMBUS CIRCLE 1.4 11 191 B16 TAVERN ON THE GREEN 1.7 15 195 B11 LINCOLN CENTER 1.7 7 187 B18 TRUMP PLAZA 1.9 357 177 B15 COLUMBUS AVE AT 79 ST 2.4 14 194 B31 100 CENTRE ST 2.4 200 20 B12 WEST SIDE MARINA 2.6 2 182 B13 MADISON AVE & 84ST 2.6 33 213 B32 WORLD TRADE CENTER 2.8 212 32 B6 GRACIE MANSION 2.9 49 229 B
14 PARK AVE AT 92 ST 3.0 34 214 B24 .SO STREET SEAPORT 3.0 199 19 B19 32 125 STREET 4.6 29 209 B3 YANKEE STADIUM 6.0 28 208 B
20 NEWARK AIRPORT- TERM B 10.8 248 68 LOS2 PRESBYT HOSP 14.3 64 244 B4 TIFFANY DINER 23.4 341 161 LOS5 TAPPAN ZEE BRIDGE 23.6 15 195 LOS
25 SEA BRIGHT, NJ 26.8 179 359 LOS23 PLAINVIEW 27.5 84 264 B7 EXIT 9 NJ TNPKE 29.2 230 49 LOS
26 ASBURY PARK, NJ 36.5 182 2 LOS28 ROBERT MOSES PARK, LI, NY 38.0 103 283 LOS27 BRIGHTWATERS, LI, NY 38.5 94 275 LOS22 LIE EXIT 63 50.9 82 263 LOS
Table A.1 Test Sites for HDTV Data Rate Tests

HD-ENG Test Report CBS Engineering
Page 30
TRANSMIT LOCATION
DISTANCE TO ESB (MILES)
AZIMUTH FROM ESB (DEGREES)
AZIMUTH TO ESB
(DEGREES)
LOS OR BOUNCE
SITE
WEEHAUKEN, NJ 2.6 331 151 LOS JAVITS CENTER, NEW YORK, NY 1.0 308 128 LOS
GRACIE MANSION, NY, NY 2.9 49 229 B UNITED NATIONS, NY, NY 1.0 87 267 B
MAHWAH, NJ 25.0 340 160 LOS MEADOWLANDS SPORTS CMPLX, NJ 6.0 313 133 LOS
MT. ARLINGTON, NJ 36.0 291 110 LOS
Table A.2 Test Sites for Adjacent and Co-channel
9.68 Mbps Successful Sites vs Distance
0.2 0.2 0.8 0.8 1.4 1.4 1.7 1.7 1.9 2.4 2.6 2.6 2.8 2.9 3.0 3.0 4.6 6.0 14.3
27.5 0.7 1.0 10
.823
.423
.626
.829
.236
.538
.038
.550
.9
Distance (miles)
9.68 Mbps
Success
Failed
Line-of-sightBounce Sites
Figure A.1 Successful Sites vs. Distance at 9.68 Mbps

HD-ENG Test Report CBS Engineering
Page 31
19.35 Mbps Successful Sites vs Distance
0.2 0.2 0.8 0.8 1.4 1.4 1.7 1.7 1.9 2.4 2.6 2.6 2.8 2.9 3.0 3.0 4.6 6.0 14.3
27.5 0.7 1.0 10
.823
.423
.626
.829
.236
.538
.038
.550
.9
Distance (miles)
19.35 Mbps
Success
Failed
Line-of-sightBounce Sites
Figure A.2 Successful Sites vs. Distance at 19.35 Mbps
24.88 Mbps Successful Sites vs Distance
0.2 0.2 0.8 0.8 1.4 1.4 1.7 1.7 1.9 2.4 2.6 2.6 2.8 2.9 3.0 3.0 4.6 6.0 14.3
27.5 0.7 1.0 10
.823
.423
.626
.829
.236
.538
.038
.550
.9
Distance (miles)
24.88 Mbps
Success
Failed
Line-of-sightBounce Sites
Figure A.3 Successful Sites vs. Distance at 24.88 Mbps

HD-ENG Test Report CBS Engineering
Page 32
27.65 Mbps Successful Sites vs Distance
0.2 0.2 0.8 0.8 1.4 1.4 1.7 1.7 1.9 2.4 2.6 2.6 2.8 2.9 3.0 3.0 4.6 6.0 14.3
27.5 0.7 1.0 10
.823
.423
.626
.829
.236
.538
.038
.550
.9
Distance (miles)
27.65 Mbps
Success
Failed
Line-of-sightBounce Sites
Figure A.4 Successful Sites vs. Distance at 27.65 Mbps
9.68 Mbps Site Margin for a Rayleigh Channel
0.0
2.0
4.0
6.0
8.0
10.0
12.0
14.0
16.0
18.0
20.0
0 5 10 15 20 25 30 35Sites
Mar
gin
in d
B
9.68 MbpsAverage Margin
Bounce sites Line-of sight
6.4 dB Avg.
14.6 dB Avg.
Figure A.5 Margin Performance at 9.68 Mbps

HD-ENG Test Report CBS Engineering
Page 33
19.35 Mbps Site Margin for a Rayleigh Channel
-6.0
-4.0
-2.0
0.0
2.0
4.0
6.0
8.0
10.0
12.0
14.0
16.0
18.0
20.0
0 5 10 15 20 25 30 35
Sites
Mar
gin
in d
B
19.35 MbpsAverage Margin
Bounce sites Line-of sight
1.7 dB Avg.
9.1 dB Avg.
Figure A.6 Margin Performance for 19.35 Mbps
24.88 Mbps Site Margin for a Rayleigh Channel
-2.0
0.0
2.0
4.0
6.0
8.0
10.0
12.0
14.0
16.0
18.0
20.0
0 5 10 15 20 25 30 35
Sites
Mar
gin
in d
B 24.88 MbpsAverage Margin
Bounce sites Line-of sight
3.7 dB Avg.
7.8 dB Avg.
Figure A.7 Margin Performance for 24.88 Mbps
HD-ENG Test Report CBS Engineering
Page 34
27.65 Mbps Site Margin for a Rayleigh Channel
-6.0
-4.0
-2.0
0.0
2.0
4.0
6.0
8.0
10.0
12.0
14.0
16.0
18.0
20.0
0 5 10 15 20 25 30 35
Sites
Mar
gin
in d
B
27.65 MbpsAverage Margin
Bounce sites Line-of sight
1.0 dB Avg.
7.7 dB Avg.
Figure A.8 Margin Performance for 27.65 Mbps
18.43 Mbps Pre & Post Forward Error Correction Bit Error Rate
1.00E-10
1.00E-09
1.00E-08
1.00E-07
1.00E-06
1.00E-05
1.00E-04
1.00E-03
1.00E-02
1.00E-01
1.00E+000 5 10 15 20 25 30 35
Sites
BER 18.43 Mbps pre FEC
18.43 Mbps post FEC
2*10-4 for quasi error free reception
Figure A.9 FEC Performance for 18.43 Mbps

HD-ENG Test Report CBS Engineering
Page 35
19.35 Mbps Pre & Post Forward Error Correction Bit Error Rate
1.00E-10
1.00E-09
1.00E-08
1.00E-07
1.00E-06
1.00E-05
1.00E-04
1.00E-03
1.00E-02
1.00E-01
1.00E+000 5 10 15 20 25 30 35
Sites
BER 19.35 Mbps pre FEC
19.35 Mbps post FEC
2*10-4 for quasi error
free reception
Figure A.10 FEC Performance for 19.35 Mbps
22.12 Mbps Pre & Post Forward Error Correction Bit Error Rate
1.00E-10
1.00E-09
1.00E-08
1.00E-07
1.00E-06
1.00E-05
1.00E-04
1.00E-03
1.00E-02
1.00E-01
1.00E+000 5 10 15 20 25 30 35
Sites
BER 22.12 Mbps pre FEC
22.12 Mbps post FEC
2*10-4 for quasi error free reception
Figure A.11 FEC Performance for 22.12 Mbps

HD-ENG Test Report CBS Engineering
Page 36
24.88 Mbps Pre & Post Forward Error Correction Bit Error Rate
1.00E-10
1.00E-09
1.00E-08
1.00E-07
1.00E-06
1.00E-05
1.00E-04
1.00E-03
1.00E-02
1.00E-01
1.00E+000 5 10 15 20 25 30 35
Sites
BER 24.88 Mbps pre FEC
24.88 Mbps post FEC
2*10-4 for quasi error free reception
Figure A.12 FEC Performance for 24.88 Mbps
27.65 Mbps Pre & Post Forward Error Correction Bit Error Rate
1.00E-10
1.00E-09
1.00E-08
1.00E-07
1.00E-06
1.00E-05
1.00E-04
1.00E-03
1.00E-02
1.00E-01
1.00E+000 5 10 15 20 25 30 35
Sites
BER
27.65 Mbps pre FEC27.65 Mbps post FEC
2*10-4 for quasi error
free reception
Figure A.13 FEC Performance for 27.65 Mbps


![keralaone.com€¦ · News - Concepts, elements, values. Sources of News, Techniques of news gathering and dissemination. News flow. Predictable & l]nprodirrahle News: Sott news and](https://img.dokumen.tips/doc/110x75/5f0bb6897e708231d431d98a/news-concepts-elements-values-sources-of-news-techniques-of-news-gathering.jpg)