Embed Size (px)
Citation preview

i
Heterogeneous Oxidation of
Alcohols
By
Hamza Mounzer
A thesis submitted to
The University of Birmingham
for the degree of
DOCTOR OF PHILOSOPHY
Department of Chemical Engineering
School of Engineering
The University of Birmingham
March 2009

University of Birmingham Research Archive
e-theses repository This unpublished thesis/dissertation is copyright of the author and/or third parties. The intellectual property rights of the author or third parties in respect of this work are as defined by The Copyright Designs and Patents Act 1988 or as modified by any successor legislation. Any use made of information contained in this thesis/dissertation must be in accordance with that legislation and must be properly acknowledged. Further distribution or reproduction in any format is prohibited without the permission of the copyright holder.

ii
To My Mother, In the Heavens…

iii
Acknowledgements
I would like to express my deepest and sincerest gratitude to the following people
and organisation for their support and assistance:
Dr Joe Wood for his patience, guidance and efforts in helping me throughout my
research. Particular thanks must be extended to Prof. Mike Winterbottom and Prof E.
Hugh Stitt for their support and advice.
My colleagues and friends in the Department of Chemical Engineering especially Dr
Fabio Chiti, Mr Andrea Gabriele, Dr Andreas Tsoligkas, Dr James Bennett, Dr. Aman
Dhir, Mr Gareth Thompson and Mr Nima Niknaf.
I also wish to express a debt of gratitude to Johnson Matthey for providing catalyst and
all the helpful discussions I had with their personnel.
Finally I wish to personally thank my family for their indispensable support through the
good times and the difficult ones, the support staff at the Department of Chemical
Engineering and TOOL for the inspiration.

iv
ABSTRACT
The selective oxidation of alcohols is one of the most challenging reactions in
green chemistry. While the current chemical industry uses organic and inorganic
oxidants to produce carbonyl compounds, it is highly desirable to use a heterogeneous
catalyst for the efficient oxidation of alcohols. The present research is focused on
increasing the activity and selectivity towards the corresponding carbonyl of the
heterogeneous oxidation for alcohols.
The low activity of 5 wt.%Pt-1 wt. %Bi/Carbon for the oxidation of 2-octanol was
investigated in a 500ml stirred tank reactor. The fast reaction rate drops dramatically
from 0.23 M/hr to 0.006 M/hr after 15 minutes reaction time when heptane was used as
solvent. Different possible causes such as overoxidation, leaching and poisoning were
examined. It was found that the loss of high conversion rate was due to product
adsorption and hence, different solvents were investigated. A mixture of 16-18% v/v
dioxane in heptane was able to effectively regenerate active sites and allow a constant
reaction rate of 0.07M/hr. The effects of temperature and pressure were also studied.
Gas-liquid, liquid-solid and internal mass transfer effects were determined experimentally
and semi-empirically. Six different Langmuir-Hinshelwood rate models were examined

v
where a modified model based on Schuurman et al. (1992) was found to adequately
describe the experimental data.
The novel 2.5%Au-2.5%Pd/titania catalyst was investigated for the oxidation of
benzyl alcohol. Different parameters such as catalyst oxidation state, pressure and stirrer
design were studied to increase the activity and selectivity of the catalyst. The selectivity
was shown to be highly dependent on the oxygen concentration. Therefore, the pressure,
temperature, catalyst treatment were optimised and the reactor configuration was re-
designed to enhance oxygen transport to the catalyst. While the conversion rate was
unaffected by the oxygen concentration, the catalyst pre-treatment significantly increased
the reaction rate. Eventually, the use of a Rushton Turbine at 20 rps with a shower disc
sparger and a treated catalyst allowed the selectivity to reach 93%. The reaction could be
described with a Power Law model satisfactorily. Transition Metal Oxide catalysts such
as 2/ SiOAgO , 232 / SiOOFe , 2/ SiOCuO and 32/ OAlCuO were investigated as an
alternative to the expensive noble metal based catalyst. However, it was shown that such
catalysts are ineffective for the oxidation of different alcohols by studying the effects of
different engineering parameters. The maximum conversion reached was 15% with
calcined copper oxide catalyst for 1-octanol oxidation.

vi
Contents Page
1. Introduction 1
1.1 The Emergence of Catalysis in the Chemical Industry 1
1.2 Green Chemistry and Alcohol Oxidation 3
1.3 Aims of this Thesis 4
1.4 Scope of the Thesis 7
2. Literature Review 8
2.1 Oxidation Mechanism on Noble Metals 8
2.2 Oxidation Catalysts 11
2.2.1 Noble Metals 12
2.2.1.1) Au and Au-Pd catalyst 12
2.2.1.2) Palladium and platinum 17
2.2.2 The role of promoters 18
2.2.3 Oxygen adsorption 21
2.2.4 Catalyst Preparation 23
2.2.5 Metal Particle Size, Loading and Distribution 25
2.2.6 Catalyst supports 26
2.2.7 Catalyst Deactivation 31
2.2.7.1) Overoxidation 31
2.2.7.2) Poisoning 32
2.2.7.3) Metal leaching/ Particle agglomeration 34
2.2.7.4) Fouling/coking 34
2.2.8 Reaction Kinetics with Deactivated Catalyst 36
2.3 Solvent Effects 37
2.4 Temperature Effects on the Oxidation 41
2.5 Stirred Tank Reactors 42
2.5.1 Reactor Design 42

vii
2.5.1.1) Reactor Geometry 43
2.5.1.2) Impeller types 46
2.5.1.3) Baffles 50
2.5.1.4) Gas Spargers 50
2.5.2 Advantages and Disadvantages of the STR 51
2.6 External Mass Transfer 52
2.6.1 Gas-Liquid Mass Transfer 56
2.6.2 Liquid-Solid Mass Transfer 57
2.7 Internal Mass Transfer 60
2.8 Reaction Modelling and Kinetics 63
3. Experimental and Analytical methods
67
3.1 Chemicals, Gases and Catalysts 67
3.2 Experimental Setup 68
3.2.1 Baskerville Reactor 68
3.2.2 Experimental Procedure 71
3.2.3 Laboratory Scale Setup 73
3.2.4 Laboratory Scale Procedure 73
3.3 Quantitative and Qualitative Analytical Methods 73
3.4 Catalyst Characterisation 75
3.4.1 Chemisorption 75
3.4.2 X-Ray Diffraction (XRD) 80
3.4.3 Scanning Electron Microscopy with Energy Dispersive X-
ray (SEM-EDX) 80
4. Heterogeneous Oxidation of 2-Octanol on 5%Pt-1%Bi/Carbon 81
4.1 Oxidation of 2-Octanol on 5%Pt-1%Bi/carbon in heptane 82
4.2 Deactivation causes 85
4.2.1 Noble metal overoxidation 85

viii
4.2.2 Noble metal leaching/agglomeration 86
4.2.3 Catalyst poisoning 87
4.3 Measurement of quantity of adsorbed ketone 89
4.3.1 Laboratory scale experimental setup 89
4.3.2 Octanone adsorption quantification 90
4.4 Solvents effects 94
4.4.1 DMSO 94
4.4.2 P-xylene 95
4.4.3 Dioxane 95
4.4.4 Dioxane/heptane 96
4.5 Internal Mass Transfer 100
4.6 Temperature effects and Arrhenius plot 101
4.7 Effect of pressure 103
4.8 Measurement of Mass Transfer Coefficients 106
4.8.1 Solid-Liquid Mass Transfer 108
4.8.2 Determination of Mass Transfer Coefficient 109
4.9 Langmuir-Hinshelwood Kinetic Model 113
4.10 Catalyst pre-treatment and recycling 121
4.11 Catalyst characterisation using CO Pulse Chemisorption 123
5. Selective Oxidation of Benzyl Alcohol on 2.5%Au-
2.5%Pd/Titania 125
5.1 Initial oxidation of BnOH with Au-Pd/Titania 126
5.2 Selectivity and Mechanism Investigation 128
5.2.1 Pressure Effects 130
5.2.2 Stirring Effects 132
5.2.3 Reactor Optimisation 134
5.2.4 Mechanism Investigation 136
5.2.5 Catalyst pre-treatment 141
5.3 Temperature effects 143

ix
5.4 Measurement of Mass Transfer Coefficients 146
5.5 Kinetic Evaluation 148
5.6 Catalyst Characterisation 151
6. Selective Oxidation of Alcohols on Metal Oxides 167
6.1 Introduction and Mechanism 168
6.2 Alcohol Oxidation and TPR Characterisation 171
6.2.1 2/ SiOAgO 172
6.2.2 232 / SiOOFe 177
6.2.3 2/ SiOCuO AND
32/ OAlCuO 179
7. Conclusion and Recommendations 186
7.1 Conclusion 186
7.1.1 2-Octanol Oxidation with 5%Pt-1%Bi/carbon 186
7.1.2 Benzyl Alcohol Oxidation with 2.5%Au-2.5%Pd 188
7.1.3 Alcohol Oxidation with Transition Metal Oxides 190
7.2 Recommendations for Future Works 191
Appendix A: External Mass Transfer Sample Calculation for
Chapter IV) 193
Appendix B:
Internal Mass Transfer Sample Calculation for Chapter IV) 199
Appendix C:
Matlab Program Sample for Chapter IV) 201
Appendix D:
Supplementary Information used for calculations 206
Appendix E:
Transition Metal Oxide 212
References 214

x
List of figures Page
Figure 2.1 Proposed mechanism for the oxidation of alcohol 9
Figure 2.2 Benzyl alcohol oxidation 16
Figure 2.3 Glucose oxidation with Pd-Bi 19
Figure 2.4 Illustration on the catalyst state 22
Figure 2.5 Alcohol oxidation with Au/Ceria catalyst 28
Figure 2.6
Scanning Electron Microscopy on activated carbon with 450
and 1000 times magnification respectively made by a) wood,
b) peat
30
Figure 2.7 Gluconic acid poisoning on platinum 33
Figure 2.8 Different deactivation mechanism 35
Figure 2.9 STR dimension nomenclature 44
Figure 2.10 Impeller variety 46
Figure 2.11 Radial and Axial Flow 48
Figure 2.12 PEPT measurements of the mean radial-axial velocity vector
plots for: a) PBT-D and b) PBT-U when i) un-gassed and ii)
gassed at 1.5vvm
49
Figure 2.13 Gas concentration profile under mass transfer resistances 53
Figure 2.14 Plot to determine the mass transfer resistances 55
Figure 2.15 Different types of diffusion 61
Figure 3.1 Rushton Turbine and Pitched Blade Turbine 69
Figure 3.2 Disc Sparger Design 69
Figure 3.3 Reactor vessel and dimensions 70

xi
Figure 3.4 Experimental setup 72
Figure 3.5 Micromeritics Autochem II 2920 77
Figure 3.6 Pulse Chemisorption graph for the 5%Pt-1%Bi/Carbon 83
Figure 4.1a) Reference reaction: conversion of 2-Octanol versus time 84
Figure 4.1b) 2nd
Regime of the reference reaction 80
Figure 4.2 Interrupted Flow: Conversion when purging air every 30
minutes for 5 minutes
86
Figure 4.3
Ketone Addition: Conversion when the catalyst is initially
immersed for 15 minutes in 2-octanone
88
Figure 4.4 Saturation amount of ketone adsorbed on Pt-Bi/Carbon 90
Figure 4.5a) 1.5g Pt-Bi/Carbon 91
Figure 4.5b) 3.0g Pt-Bi/Carbon 92
Figure 4.5c) 6.0g Pt-Bi/Carbon 93
Figure 4.6
Effects of solvent composition upon reaction rate and ketone
adsorption coefficient
97
Figure 4.7
Conversion of 2-octanol in heptane and in dioxane-heptane
mixture
98
Figure 4.8 Arrhenius Plot for the determination of the activation energy 102
Figure 4.9 Pressure Effect 104
Figure 4.10 Conversion at 4 bars air pressure 105
Figure 4.11 Liquid and Gas-Liquid mass transfer resistances for Oxygen 107
Figure 4.12 Models versus experimental data 117
Figure 4.13 Initial ketone addition effects on the solvent mixture 120

xii
Figure 4.14 Model A at a different concentration 121
Figure 5.1 BnOH oxidation with untreated catalyst 127
Figure 5.2 TPR of Au-Pd/Titania catalyst 128
Figure 5.3 BnOH oxidation with reduced catalyst 129
Figure 5.4 BnOH oxidation with reduced catalyst at different air
pressures 131
Figure 5.5 BnOH oxidation with reduced catalyst at different stirring
speeds 133
Figure 5.6 A) Before optimisation. B) After optimisation 135
Figure 5.7 Oxidation with the different reactor configuration 136
Figure 5.8 Hydrogenation of BnOH 137
Figure 5.9 Anaerobic oxidation of BnOH 138
Figure 5.10 BnO hydrogenation 139
Figure 5.11 BnOH oxidation with treated catalyst 142
Figure 5.12 Selectivity towards BnO versus conversion at different
temperatures 144
Figure 5.13 Arrhenius Plot for the determination of the activation energy 145
Figure 5.14 Solid-Liquid and Gas Liquid mass transfer resistances for
Oxygen 146
Figure 5.15 BnOH oxidation with treated catalyst 149
Figure 5.16 Initial reaction rate at different BnOH starting concentrations 150
Figure 5.17 SEM-EDX of the Au-Pt/Titania catalyst 152
Figure 6.1 Mars and van Krevelen oxidation mechanism illustration 169

xiii
Figure 6.2 TPR of silver oxide 173
Figure 6.3 Various alcohol oxidations at different temperatures with
silver oxide 174
Figure 6.4 2-pentanol oxidation with silver oxide 176
Figure 6.5 TPR of iron oxide 177
Figure 6.6 Various alcohol oxidations at different temperatures with
iron oxide 178
Figure 6.7 TPR of copper oxide on alumina 179
Figure 6.8 TPR of copper oxide on silica 181
Figure 6.9 Various alcohol oxidations at different temperatures with
calcined copper oxide 181
Figure 6.10 Various alcohol oxidations at different temperatures with
calcined copper oxide 182
Figure 6.11 2-octanol with calcined copper oxide on silica 184
Figure A1 Solid-Liquid and Gas-Liquid mass transfer resistances for
Oxygen 194
Figure C1 Plot of the experimental reaction rate and of the Excel rate
law with calculated kinetic parameters using function f(t). 203
Figure C2 Plot of the Matlab Scrip for Model A) 205
Figure E1 TMO catalyst Pictures 213

xiv
List of tables Page no
Table 2.1 Examples of different solvents used 40
Table 2.2 Optimum reactor configuration to create the highest maxε in
solid-liquid systems
45
Table 2.3 Semi-empirical correlations for bGLak 57
Table 2.4 Semi-empirical correlations for SLk 60
Table 3.1 Parameters investigated and varied for different catalysts in the
Baskerville Reactor.
71
Table 3.2 GC conditions for the analysis of octanol and benzyl alcohol
oxidation
75
Table 3.3 Pulse Chemisorption data 79
Table 4.1 Solvent characteristics and effects on initial reaction rates 96
Table 4.2 Solvent effects on initial rate for different alcohols 99
Table 4.3 Estimated liquid solid mass transfer coefficients over the Pt-Bi
catalyst at 343K using different correlations
108
Table 4.4 Estimated mass transfer resistances over the Pt-Bi catalyst at
343K and atmospheric pressure from Figure 4.10) and Table
4.3)
109
Table 4.5 Proposed models with estimated kinetic parameters and
assumptions
116
Table 4.6 Estimated kinetic and statistical parameters for model A. 120
Table 4.7 Initial reaction rates after cleaning the catalyst 123

xv
Table 4.8 Catalyst characterisation using CO chemisorption 124
Table 6.1 XRD identification of various catalysts 172
Table 6.2 Different reaction conditions for copper oxide on alumina 180
Table C1 Parameters used in the modelling of the experimental data in
Figure 4.12) 204
Table D1 Physical properties of reagents, solvents and gases 206
Table D2 Properties of catalysts 207
Table D3 Dimensionless groups 207
Table D4 Diffusivity of oxygen and 2-octanol in the solvent mixture at
343K 208
Table D5 Viscosity of solvents at 343K 209
Table D6 parameters for the determination of the solvent mixture
viscosity
210
Table D7 Surface tension values 210
Table D8 Parameters used to evaluate the surface tension of the mixture 211
Table E1 XRD data provided for the identification of the different
phases 212

xvi
NOMENCLATURE
Ba Gas-liquid interfacial area, 2m
pa External surface area of the catalyst particles per mass unit of catalyst,
kgm /2
cA Cross sectional area 2m or 2
nm
C Concentration, M
C’ Constant
D Diameter, m
bd Bubble diameter, m
pd Particle diameter, m
ABD Diffusion coefficient, sm /2
mD Molecular diffusion coefficient, sm /2
effD Effective diffusion coefficient, sm /2
AE Activation energy, kJ/mol
dE Desorption energy, kJ/mol
F Stochiometric Factor, dimensionless
g Gravity constant, 2/ sm
21 , hh Height of the first impeller from the bottom and height of the liquid, m
dk Desorption coefficient, 1−s
SLk Mass transfer coefficient from the bulk liquid to the external surface of
the catalyst, m/s
GLk Mass transfer coefficient from the gas to the liquid, m/s
intk Mass transfer coefficient from the liquid film on the catalyst surface to
the internal pores of the particle, m/s
k Specific reaction rate with internal mass transfer, sgcatdm ./3 or
skgcatm ./3

xvii
1K ,2K ..
nK Rate equilibrium constant
K Constant
L Characteristic size of a catalyst particle
m Mass, kg
M Molecular weight, g/mol
wM Wagner-Weisz-Wheeler modulus
N Impeller speed, 1−s
AN Avogadro’s Number
PN Impeller power number
bN Number of baffles
Ns Impeller speed for suspension of solid particles in unaerated liquid, rev/s
Nsg Impeller speed for suspension of solid particles in aerated liquid, rev/s
P Power draw, 32 .. −smkg
AirP Air pressure, bars
VGQ Vessel volume per minute flow, sm /3
br Resistance to gas absorption, s
cr Resistance to transport to surface of catalyst particle, 3/. dmsgcat or
3/. mskgcat
rr Resistance to diffusion and reaction within the catalyst particle,
3/. dmsgcat or 3/. mskgcat
crr Combined resistance to internal diffusion, reaction, and external
diffusion, 3/. dmsgcat or 3/. mskgcat
dr Deactivation rate, M/(kg.s)
Vr Reaction rate per unit of volume of catalyst particles, 13 .. −− smmoles cat
AR ,BR ,
CR Reaction rate, M/s
Re Reynolds number, dimensionless
rps Stirring speed, rev/s

xviii
S Reactor configuration constant
Sc Schmidt number,
Sh Sherwood number
T Temperature, K
T Tank diameter, m
TPO Temperature Programmed Oxidation
TPR Temperature Programmed Reduction
gU Superficial gas velocity, m/s
tU Terminal velocity of bubble in free rise, m/s
V Volume, l or 3dm
sV Adsorbed volume, ml
w Catalyst loading, gdm /3 or kgm /3
We Weber number
X Percentage of catalyst loading, dimensionless
Greek Symbols
γϕδ ,, Parameters
ε Energy dissipated, 32 / sm
φ Thiele Modulus
η Effectiveness factor
µ Viscosity, 11.. −− mskg
ρ Density, 3/ mkg or 3/ dmg
σ Surface tension, N/m
υ Kinematic viscosity (m2/s)
α Rate of reaction on the deactivated catalyst divided by the rate on fresh
catalyst.

1
I) INTRODUCTION AND BACKGROUND
1.1) The Emergence of Catalysis in the Chemical Industry
Before the appearance of industrial catalysts back in 1875, the chemical industry
used to rely on increasing the pressure, temperature, reactant concentration, and residence
time to increase production (Davis and Hettinger 1983). While these variables enhance
the reaction rate, they consume a significant amount of power and capital to operate.
Moreover, using harsh conditions to enhance reaction rates do not distinguish between
the different possible reaction paths, which will eventually form unwanted side products.
It becomes clear from the above that another variable must be taken into consideration,
which ideally, would only enhance specifically the wanted reaction path from an
otherwise difficult and unselective reaction. Thus, the attention turned into finding a
selective catalyst, which by definition, would decrease the activation energy of the
wanted reaction path and discriminate against other possible pathways. The optimum
catalyst would also be separable from the reaction mixture and recyclable for economic
purposes.

2
The first catalytic processes used are centuries old involving enzymes to
manufacture wine and dairy products (Heineman 1981). The earliest commercial catalyst
was platinum supported on Vanadia to produce sulphuric acid from sulphur oxide in 1875
by Peregrin Philips (British Patent No. 6096, 1831). Over the twentieth century industry
became increasingly reliant on the use of catalysts for the production of a range of
manufactured products. The economy based on catalysts was estimated to be worth 10
trillion dollars per year in 1988 (Farrauto and Bartholemew 1988). The petroleum
division is the most dependent on catalysts for different processes such as cracking,
reforming and hydrotreating. The chemical production division includes organic
synthesis, hydrogenation, oxidation and polymerisation amongst others. Finally,
catalysts are increasingly used to protect the environment by breaking down green house
gases from industrial and automotive exhausts such as NO, N2O and CO with Platinum
Group Metal (PGM) based catalysts.
However, catalysts are not the only novel way to increase the efficiency and
profits in the chemical industry. Sometimes, it is not the reaction which limits the
production rate but the transport of reactants between different phases (Fogler 2001).
This is especially true for gas-liquid-solid systems. In this case, the attention is focused
on the reactor type and configuration to maximise the mass transfer of substrates. One
example is the trickle bed using a cocurrent downflow of gas and liquid into a packed
reactor (Miller and Kaibel 2004). Stirred Tank Reactors (STR), which constitute 50 % of
reactors in the chemical production, can be more effectively designed to improve the
transport of a reactant if it limits the reaction (Kresta, Edward PL et al. 2004).
3
1.2) Green Chemistry and Alcohol Oxidation
With an increase in chemical consumption and needs, industrial processes
expanded considerably throughout the 20th
century. However, governmental regulations,
such as the Environmental Protection Act 1990-UK, were introduced as well to control
the subsequent damage inflicted upon the environment. Industrial liquid wastes have
destroyed natural habitats and the gaseous exhaust contributes significantly to global
warming and acid rain (Cheremisinoff, Rosenfeld et al. 2008). Therefore, over the last
20 years interest in solving pollution problems within the chemical industry has grown
significantly. Structured catalysts such as the monolith for example are widely used to
break down green house gases emitted from automobiles. The monolith corresponds to a
support with a number of small straight and parallel channels coated with a catalyst.
Nonetheless, this type of innovation should be extended to benefit the chemical industry
as well. For example, the replacement of the refrigerant chlorofluorocarbons with
ammonia in-vapour compression systems minimised the damage on the ozone layer.
The production of ketones and aldehyde in industry occurs via alcohol oxidation. This
process involves the stochiometric addition of an inorganic oxidant such as chromate, or
organic oxidant such as dimethyl sulfoxide DMSO (Cainelli and Cardillo 1984;
Dimitratos, Villa et al. 2006). These processes produce considerable amounts of toxic
wastes, and the poor selectivity of the reaction creates by-products which decreases the
profits. Therefore, heterogeneous catalysts for the alcohol oxidation to carbonyl
compounds are attracting interest from industry and academics alike (Kluytmans,
Markusse et al. 2000; Besson and Gallezot 2003; Muzart 2003). Unlike stochiometric

4
oxidants that produce chemical wastes, heterogeneous catalysis can effectively use
molecular oxygen to produce only water as side-products, and can be operated under mild
temperature and pressure conditions. From a cost-efficiency point of view, supported
catalysts have an advantage over homogeneous catalysts by being easily recoverable and
they can be used in continuous flow regimes (Kreutzer, Kapteijn et al. 2005).
The heterogeneous oxidation of alcohols with noble metals has been
exponentially improved since it was first studied 150 years ago (Wieland 1921; Mallat
and Baiker 1994). However, before the industry can apply heterogeneous catalysts on a
large scale for the production of carbonyl compounds and invest in new processes, it is
crucial to investigate and optimise the catalytic oxidation of alcohols.
1.3) Aims of this Thesis
While the literature is very rich in studies of oxidation for different kinds of
alcohols, catalysts and reaction conditions, there is still room to further understand and
improve the efficiency of promising catalysts. 5 wt. %Pt-1 wt. %Bi/Carbon shows a high
potential for the oxidation of alcohols and is a leading catalyst in terms of selectivity
during reactions. However, before it can be introduced for large scale uses, its versatility
for the effective oxidation of different alcohols should be established. The oxidation of
2-octanol has shown mediocre results with different catalysts including 5%Pt-
1%Bi/Carbon. Thus, this work aims to investigate the low activity and improve the
oxidation of 2-octanol with 5%Pt-1%Bi/Carbon. In particular, to understand how the

5
selection of suitable solvent mixtures can be used to control the adsorption equilibrium at
the catalyst surface and thus prevent the strong adsorption of products from blocking the
active sites.
Furthermore, a recent catalyst has been developed (Landon, Collier et al. 2002;
Hutchings 2008) composed of 2.5 wt.%Au-2.5 wt.%Pd/titania. This novel catalyst
showed promising results for the oxidation of different alcohols in terms of activity and
selectivity. However, most of the work published on this catalyst was done in small scale
reactor volumes with an emphasis on the chemistry of this particular catalyst. No
examination on the engineering parameters on this systems has been published which
underlines the importance of carrying a detailed study on the different engineering
effects. Therefore, a thorough study was undertaken to optimise the oxidation of benzyl
alcohol with 2.5%Au-2.5%Pd in a medium scale reactor, paying particular attention to
the reactor design and catalyst treatment. Ultimately, the effects investigated also
improve the understanding of the chemistry of the catalytic oxidation of benzyl alcohol
with 2.5%Au-2.5%Pd.
Finally, an attempt was undertaken to oxidise alcohols with Transition Metal
Oxides (TMO) since the previous catalysts investigated were constituted with noble
metals. TMO are significantly cheaper and more abundant than PGM. While TMO
catalysts are used for gas phase oxidation, their successful application for liquid phase
oxidation would have a significant impact on the economy and industrial processes.
Hence, TMO catalysts based on copper oxide, iron oxide and silver oxide supported on
alumina and silica were investigated for the oxidation of primary, secondary and aromatic
alcohols.

6
In summary, the aims can be presented as followed:
1. Oxidation of 2-octanol with 5%Pt-1%Bi/Carbon. The investigation of the low
oxidation rate of 2-octanol with this catalyst. Research into finding an effective
solution to increase the reaction rate.
2. Oxidation of Benzyl Alcohol with 2.5%Au-2.5%Pd. The investigation into
optimising the reaction rate and selectivity of the oxidation of benzyl alcohol with
2.5%Au-2.5%Pd by studying the STR configuration, support effects and catalyst
treatment.
3. Oxidation of 1-octanol, 2-pentanol and benzyl alcohol with TMO catalysts. A
study with unconventional catalyst to try to get the best possible conversion.
4. Catalyst characterisation. Catalyst characterisation with XRD, TPR and
Chemisorption

7
1.4) Scope of the Thesis
A brief introduction was presented above on the importance of the heterogeneous
oxidation of alcohols and the necessity to further understand and improve the catalytic
processes. A literature survey will then be presented to clarify in details all aspects of the
heterogeneous oxidation of alcohols and to report the most important findings published
in the literature in Chapter 2. Following the literature survey, the experimental setup,
equipment and analysis tools used in this work will be described in Chapter 3. The
subsequent chapters explain thoroughly the findings of this work while discussing the
results, and comparing them with the literature before the final conclusion chapter to
summarise this thesis. Supplementary information and data are incorporated in the
Appendices.

8
II) LITERATURE REVIEW
This chapter concerns the work published in the literature on the heterogeneous
oxidation of alcohols using noble metals. Different aspects of the catalytic oxidation are
discussed such as the mechanisms, catalyst properties, the engineering parameters and the
kinetics that could be adjusted to optimise such processes in industry. The main focus
will be on platinum-bismuth and gold-palladium catalysts since they are the centre of the
current work and are of academic and industrial interest. The designs and characteristics
of the stirred tank are also described in order to provide the relevant background to the
optimisation of the reactor configuration used in this study. Finally, a discussion of the
kinetic modelling of the alcohol oxidation will be presented.
2.1) Oxidation Mechanism on Noble Metals
The partial oxidation of alcohols involves the loss of hydrogen to form the
corresponding carbonyl compound. Secondary alcohols form ketones while primary
alcohols form aldehydes before becoming carboxylic acids with further oxidation. A loss

9
of a carbon dioxide molecule will occur in more forcing oxidation conditions. In order to
determine the mechanism of alcohol oxidation and the Rate Determining Step (RDS),
researchers have tried to oxidise isotopically labelled alcohols (DiCosimo and Whitesides
1989).
Figure 2.1) Proposed mechanism for the oxidation of alcohol (Van den Tillaart, Kuster et
al. 1994).
The dissociation mechanism happens when the alcohol adsorbs on the metal by
forming an alkoxide or the conjugate base of an alcohol, and hydrogen occupying two
active sites. On the other hand, it is also suggested that the alcohol can be adsorbed
associatively as a whole molecule on the catalyst surface and then will undergo
dehydrogenation (Schuurman, Kuster et al. 1992). The adsorbed alcohol or alkoxide then
may react with a free active site * in an acidic medium, an adsorbed oxygen O* if there is
a high oxygen surface coverage, and/or an adsorbed hydroxyl OH* in an alkaline medium
to abstract the H−α from the reactant (Mallat and Baiker 1994). The alcohol was
proposed to undergo the following path in a basic medium (Dijkgraaf, Rijk et al. 1988):
I) OHOCHROHOHCHR adsads 222 +−→←+− −−
II) −− +−→+− adsadsads HCHOROCHR *2
III) *+→+ −−adsads OHOH ads

10
However, it was later rejected since deprotonation of a weak acid in alkaline medium is
unlikely (Mallat and Baiker 1994; Gangwal, van der Schaaf et al. 2005). The following
mechanism was suggested:
I) adsadsads HOCHROHCHR +−→←+− 22 *
II) adsadsads HCHOROCHR +−→+− *2
III) adsOO →+ *2
12
IV) *,32 2 +→+ OHOH adsads
where the first reaction is fast and the second one is the Rate Determining Step, or RDS.
An adsorbed oxygen adsO or adsorbed hydroxyl adsOH can replace the active site *
depending on the oxygen coverage and pH.
In electrochemical studies, Kluytmans et al. (2000) suggested that the catalyst
acts as a short-circuited cell where the alcohol dehydrogenates on the surface which
causes the desorption of +H and −OH from adsH and
adsOH .
I) adsOO →+ *2
12
II) adsadsads OHOCHROOHCHR +−→←+− 22 *
III) −+ ++−→− eHCHOROCHR adsads2
IV) *+→+ −− OHOHe ads
V) OHOHH 2→+ −+

11
Consequently, the ketone formation (III) and the hydroxyl reduction (IV) may happen at
different sites on the catalyst while electrons are transported by conduction and the
proton by diffusion (V) guided by Fick’s first law. It becomes apparent that there is no
agreement on the mechanism of the alcohol oxidation (Keresszegi, Ferri et al. 2005).
The oxidation may depend on the nature of the adsorbed species, the pH of the solution,
the oxygen coverage and the metal oxidation state (Gallezot 1997).
Since C-C bonds are difficult to break under mild reaction conditions, the
oxidation of secondary alcohols yield ketones and the carbon chain is preserved (Mallat
and Baiker 1994). However, primary alcohols are oxidized to aldehyde and can further
undergo catalysis to yield carboxylic acids. A high pH or an aqueous media increases
considerably the carboxylic acid yield unless the hydroxyl function is adjacent to a C=C
bond or an aromatic ring that stabilize the carbonyl group (Muzart 2003). The selectivity
of an oxidation is strongly affected by the reaction conditions, nature and promotion of
the catalyst and by the solvent as will be discussed in the corresponding sub-chapters.
2.2) Oxidation Catalysts
This section will deal firstly with the active noble metals such as Au, Au-Pd, Pd
and Pt. The importance of promoters will then be examined before discussing the oxygen
adsorption. The physical characteristics of the catalyst and support will then be studied
before considering the main reasons of catalyst deactivation.
12
2.2.1) Noble Metals
Noble metals constitute some of the few elements that are efficient in oxidising
alcohols heterogeneously under the Sabatier principle. Catalysts containing palladium,
platinum or gold give promising results in terms of activity and selectivity when used to
oxidise alcohols (Ebitani, Ji et al. 2004). Specific examples of oxidation activity with
these metals are discussed below.
2.2.1.1) Au and Au-Pd catalyst
Gold was always thought to be an ineffective catalyst due to its chemical
inertness. It was only in the early 1980’s that Hutchings and Haruta discovered that gold
is a very valuable catalyst for acetylene hydro-chlorination and low temperature CO
oxidation (Hutchings 1985; Hutchings and Haruta 2005). Their pioneering work set in
motion numerous studies on improving catalysis by gold. The discovery that gold can be
a catalyst for alcohol oxidation was only made in the late 1990’s (Prati and Rossi 1998).
It was established that, unlike Pt/C and Pd/C that can oxidise alcohol independently of
the solution pH, a base was necessary for activity with Au/C (Hutchings 2008). Indeed,
the base would allow the abstraction of hydrogen from the alcohol to create an alkoxide
(Carrettin, McMorn et al. 2003). It was also shown that the selectivity of the highly
functional glycerol with Au/C is directly dependent on the concentration of base where a
NaOH/glycerol ratio of 4 and metal particle size of 20nm gave the best results (Porta and
Prati 2004). This underlines a fundamental difference in oxidation mechanism between
these noble metals. In a solution with neutral pH, a metal oxide support can allow gold to
be an active catalyst (Enache, Knight et al. 2005) as will be explained later on. The

13
conversion rate of gold is also strongly dependent on the metal particle size, where nano-
crystalline gold requires less base to achieve similar activity (Christensen, Betina et al.
2006). Nano-particles or a high support surface area ensure a high contact between the
gold and the support, which in turn enhances the interaction between the noble metal and
the metal oxide support (Demirel, Kern et al. 2007). Indeed, large gold particles are
unable to chemisorb reactant molecules unless the particles are small enough to be
deficient in the complete metal coordination character (Bond and Thompson 1999).
At the start of the 21st century, it was established that the alloying of gold with
palladium increases the activity of hydrogen oxidation to yield hydrogen peroxide
(Landon, Collier et al. 2002; Hutchings and Haruta 2005; Edwards, Landon et al. 2007).
Therefore, the investigation of Au-Pd catalysts for alcohol oxidation started. An early
trial was the comparison of monometallic Au, Pd and Pt with bimetallic Au-Pd and Au-Pt
(Dimitratos, Porta et al. 2005). In the absence of a metal oxide support or a base that can
abstract a hydride from the alcohol to initiate the oxidation, gold is almost unable to
oxidise alcohols. On the other hand, while Pd and Pt are effective oxidation catalyst, they
are readily deactivated by overoxidation (Mallat and Baiker 1994). It was discovered that
Au-Pd and Au-Pt alloys were resistant to overoxidation during the oxidation of D-
Sorbitol (Dimitratos, Porta et al. 2005). Gold, being almost inert to oxygen corrosion,
was partly protecting the Pd and Pt from overoxidation by limiting the exposure of Pd
and Pt to oxygen (Schwank 1985; Dimitratos, Villa et al. 2006). However, the complete
effect of adding gold upon the reaction mechanism is still not entirely understood.
Dimitratos et al. (2006) reported that adding gold to platinum decreases the activity of
benzyl alcohol oxidation but when added to palladium it is increased. The explanation of

14
this observation was attributed to two catalyst properties. First, a geometric effect
between gold and the second noble metal causes intra-atomic bond length or lattice
constants changes which ultimately affects the electronic structure of the alloyed particle
and prevents the ensemble effect. The Au atoms can also isolate palladium monomers
which increases activity, stability and the selectivity by preventing the breaking of C-C
bonds and the over-oxidation of the same molecule (Prati, Villa et al. 2007; Wang, Villa
et al. 2008). Secondly, electronic interactions appear between the two different metals.
Hence, the bonding energies of substrate on alloyed particles are affected. The gold
protects the catalyst from overoxidation since the binding energy of oxygen on palladium
decreases when the latter is surrounded with gold (Prati, Villa et al. 2007).
Imaging techniques such as scanning transmission electron microscopy combined
with x-ray photoelectron spectroscopy were performed by Enache et al. (2006). The
results showed that the gold-palladium catalysts have a gold core in a palladium shell
conformation on metal oxide supports suggesting that gold interacts electronically with
palladium. However, this shape was not observed by Dimitratos et al. (2006) or
Hutchings (2008) when the bimetallic catalyst was prepared on carbon supports. Hence,
it was deduced that the core/shell structure does not play a significant role in the
enhanced activity of the catalyst (Wang, Villa et al. 2008). In order to have a positive
effect of the bi-metal, the geometric and electronic properties must work synergistically.
Recently, another attribute was revealed; the identity of the substrate also plays an
important role in the synergy of Au and Pd/Pt bi-metals (Prati, Villa et al. 2007). In
basic conditions, poly-functional alcohols such as glycerol were more active with Au-Pt
than Au-Pd while with aliphatic octanol, the contrary was observed. Au-Pd catalyst was

15
particularly studied for the benzyl alcohol oxidation due to the high activity of the latter
and the different possible mechanistic pathways (Enache, Edwards et al. 2006). Benzyl
alcohol oxidation may undergo the following steps:

16
Figure 2.2) Benzyl alcohol oxidation. (Adapted from Enache et al. 2007).

17
Different supports were investigated for the Au-Pd catalyst including alumina,
silica, titania, carbon, iron oxide and different zeolites such as ZSM-5, β and Y types
(Enache, Edwards et al. 2006). The outcome of the benzyl alcohol oxidation was
strongly dependant on the support. Acidic supports such as iron oxide and alumina gave
respectively 66% and 87% selectivity for the benzyl alcohol oxidation while titania gave
92%. Titania support had the highest conversion/selectivity ratio. Different Au:Pd ratios
were investigated as well, ranging from 5%Au/titania without any palladium to 5%
Pd/titania without gold (Enache, Barker et al. 2007). Mono-gold on titania gave a
negligible amount of conversion. Conversely, palladium catalyst gave a selectivity of
70%. The best results were obtained using 2.5% Au-2.5% Pd/titania where the selectivity
was 90%.
2.2.1.2) Palladium and platinum
The use of heterogeneous palladium has been investigated for the last 60 years
and this metal is one of the most commonly used heterogeneous catalysts in academia
and industry (Muzart 2003). Pd differs from other metal catalysts such as Pt, Rh, Ru, Ni,
or Cu through the following characteristics (Blaser, Indolese et al. 2001):
• Pd catalysts can be easily tuned with the addition of organic and inorganic
modifiers to alter the catalyst behaviour.
• Palladium shows low activity for the hydrogenation of aliphatic ketones and
aldehyde and almost no activity at low temperature for aromatic rings.
18
• Pd has the highest activity for the hydrogenolysis reactions and the saturation of
double bonds in conjugation with aromatic rings.
The ability of platinum to oxidise alcohols with molecular oxygen was discovered one
and a half centuries ago (Mallat and Baiker 1994). Similarly to palladium, platinum has a
high affinity to adsorb hydrogen which allows it to dehydrogenate alcohol to yield the
corresponding carbonyl. However, platinum and palladium have a different catalytic
behaviour even for the same substrate. For instance, benzoic acid adsorbs irreversibly on
platinum but reversibly on palladium, as was shown by online mass spectroscopy (Souto,
Rodríguez et al. 2000). Also the oxidation of SO2 to SO3 can occur on both Pd and Pt,
however SO3 deactivates only Pd (Kent 2007).
The activity and selectivity of platinum and palladium catalysts are strongly
dependent on the metal particle size, nature of support, reaction medium and substrate
which underlines the importance of investigating the effects of these conditions (Gallezot
1997). The main challenge is to maintain the selectivity towards the carbonyl
intermediate without producing by-products or deactivating the catalyst. A novel way of
achieving this goal is with the help of promoters.
2.2.2) The role of promoters.
The effect of adding promoters was a major step forward for the heterogeneous
oxidation of alcohols since it dramatically affected the performance of the catalyst and its
life-cycle (Mondelli, Ferri et al. 2007). While adding “non-noble” metals such as
bismuth, lead and tin to Platinum Group Metals (PGM) affects the activity and increases

19
considerably the selectivity of the reaction, the promoter role was not entirely understood.
Mallat et al. (1995) suggested 3 major possible roles for bismuth promoter:
1. Bismuth adatoms have a geometric effect and act as site blockers which change
the orientation of the adsorbing alcohol. This phenomenon was witnessed for the
oxidation of glycerol (Kimura, Tsuto et al. 1993). Also, adatoms prevent the
presence of a large active metal surface, responsible for the “ensemble effect”,
which causes C-C bond cleavage that decreases selectivity (Pinxt, Kuster et al.
2000; Wenkin, Ruiz et al. 2002).
2. Since bismuth is a non-noble metal, it is much more likely to adsorb oxygen than
the PGM (Mallat, Bodnar et al. 1993; Mallat, Bodnar et al. 1995). Therefore it
creates a new active centre on the catalyst that contributes to the oxidation of
alcohol by supplying the required oxidising species for the reaction. Gallezot
(1997), proposed the following mechanism for the oxidation of glucose:
Figure 2.3) Glucose oxidation with Pd-Bi

20
3. Bismuth metal increases the selectivity and activity by preventing the adsorption
of hydrogen by-product (and other substrates) via occupying active sites on PGM
which will avert the hydrogen from reacting to yield unwanted by products.
(Parsons and VanderNoot 1988; Mallat, Bodnar et al. 1993; Wenkin, Ruiz et al.
2002).
Keresszegi et al. (2004) investigated the effect of adding bismuth to platinum for
the oxidation of phenylethanol. The presence of bismuth increases the conversion from
30% to 80%. The selectivity towards acetophenone was increases as well from 70% to
95%. Also, Keresszegi et al. (2004) used a simple technique to evaluate the role of
bismuth on activity by comparing the alcohol dehydrogenation with argon and air for
promoted and unpromoted catalysts. It was found that the bismuth led to an increased
selectivity in the presence of air but had no effect in argon. Therefore, it was deduced
that bismuth increases the oxygen transfer to remove the by-products and hence creates
available active sites. Bismuth is therefore also used to protect the PGM catalyst from
“over-oxidation” which happens when the alcohol is unable to reduce the oxygen
coverage on the metal surface resulting in the deactivation of the catalyst (Gallezot 1997).
However, Wenkin et al. (2002) have suggested that the bismuth may have a homogenous
role by leaching and forming complexes with substrate that facilitates the
dehydrogenation step. This was shown by adding a solution of bismuth to the successful
oxidation of glucose. Conversely Keresszegi et al. (2003) showed that bismuth is in
metallic form by insitu XAS studies that proved the presence of bismuth during the
oxidation of phenylethanol.

21
2.2.3) Oxygen adsorption
One of the roles of the noble metal in heterogeneous catalysis is to activate the
gaseous reactant. Oxygen can be adsorbed in three ways (Gangwal, van der Schaaf et al.
2005):
1. Physisorption: Weak adsorption, i.e. Van der Waals forces
2. Chemisorption: Strong and reversible adsorption, i.e. Covalent bonds
3. Corrosion: Strong and irreversible sub-layer penetration of oxygen in the metal.
On Pt (111), oxygen adsorbs associatively at temperatures below 120K and dissociatively
at temperature between 150K and 500K. Corrosion happens at temperature above 500K
which causes sub-surface platinum oxide. However, for liquid phase oxidation occurring
at temperature between 293K and 353K, oxygen adsorbs atomically (Lewis and Gomer
1968). The adsorption mechanism is as follows:
I) adsOO −→←+ 22 * Associative adsorption
II) adsads OO 2*2 →←+− Dissociation
Pressure effects and over-oxidation
The oxygen solubility in solution is proportional to the oxygen partial pressure
according to Henry’s law. While the presence of oxygen is vital to remove adsorbed
hydrogen and other by-products for the regeneration of free sites, a high oxygen coverage
will decrease the reaction rate (Keresszegi, Bürgi et al. 2002). Working at low oxygen
partial pressure prevents the catalyst from being over-oxidized, although the adsorbed

22
hydrogen formed from alcohol dehydrogenation may react then with an other substrate to
generate unwanted by-product instead of being oxidised to form water (Hardacre, Mullan
et al. 2005). Keresszegi et al. (2005) suggested that the oxidation of primary alcohols
such as 1-octanol and benzyl alcohol can yield CO by decarbonylation which deactivates
the catalyst. The reaction rate can then be dramatically enhanced by the introduction of
oxygen which removes adsorbed carbon monoxide. On the other hand, working at high
oxygen partial pressure tends to deactivate the catalyst by oxidizing the metal and
occupying the active sites (Kimura, Kimura et al. 1993). Overoxidation is widely
considered as a major reason for catalyst deactivation (Mallat and Baiker 1994; Gallezot
1997; Markusse, Kuster et al. 2001). A catalyst is overoxidized or covered with oxygen
when the catalyst potential is higher than 0.8V vs the Reversible Hydrogen Electrode
(RHE). The catalyst is reduced or covered with hydrogen/CO when the potential is lower
than 0.4V vs. RHE (Markusse, Kuster et al. 2001). The optimum catalyst potential then
lies between 0.4 and 0.8V vs. RHE as illustrated in Figure 2.4). Extensive modelling
work on overoxidation can be found in the following references (Gangwal et al. 2002;
Gangwal et al. 2004; Gangwal et al. 2005b).
Figure 2.4) Illustration on the catalyst state. Adapted from Keresszegi et al. 2002

23
Kluytmans et al. (2000) and Markusse et al. (2001) found that stopping the
oxygen flow during the reaction in case of overoxidation allows the alcohol to reduce the
oxidised Pt catalyst, therefore reactivating it. Another way of overcoming poisoning as
well as overoxidation is the addition of promoters. As it was previously explained, the
addition of non-noble metals such as bismuth controls the oxygen supply to the noble
metal and prevents the formation of adsorbed hydrogen and carbon monoxide (Mondelli,
Ferri et al. 2007). Therefore an optimum oxygen concentration exists that is high enough
to oxidise adsorbed hydrogen and by-products without overoxidizing the catalyst. Many
researchers have suggested working in the oxygen mass transfer limited regime to
prevent any overoxidation since working in a kinetic regime results in rapid catalyst
deactivation (Gangwal, van Wachem et al. 2002; Keresszegi, Grunwaldt et al. 2004;
Keresszegi, Mallat et al. 2004; Hardacre, Mullan et al. 2005). The selectivity towards the
partially oxidised intermediate of the reaction is also dependant on the oxygen
concentration. While ketones and carboxylic acids are resistant to further oxidation in
mild conditions, aldehyde can easily be oxidised again to carboxylic acids in oxygen rich
system, aqueous or alkaline medium (Mallat and Baiker 1994).
2.2.4) Catalyst Preparation
Catalysts are most commonly prepared using an impregnation or adsorption
methods (Bamwenda, Tsubota et al. 1997; Winterbottom and King 1999) and are
summarised from Farrauto and Bartholemew (1988).

24
Impregnation
The impregnation technique consists of dissolving the salt of the active metal in a
solvent volume equal to the pores volume of the dried support. The solution is then
added drop-wise to the support until all of the solvent is absorbed by the pores of the
carrier. This method guarantees that the desired amount of active metal is present on the
catalyst when the solvent is evaporated. The drying rate affects the deposition of the
metal inside the pores. A high temperature causes the active metal to settle at the mouth
of the pores while a low temperature causes the metal to occupy the bottom of the pore.
This is because at higher temperatures the liquid evaporates from the solution before
there is sufficient time for the metal to be transported in to the pores. A moderate
temperature causes a more uniform pore occupation of active metal. Another relevant
issue is the control of access of reacting molecules to active centres on the catalyst.
Molecular sieves for instance are very selective catalysts by discriminating against
compounds that are bigger than their regular pore size. In this case it might be desirable
to have the active sites inside the catalyst pores to prevent unwanted reaction at the pore
mouth. Zeolites are an example of a molecular sieve. The 32/ OAlNi catalyst for
hydrogenation is usually prepared with the impregnation method. The main disadvantage
of the impregnation method is the possibility of a heterogeneous deposition of active
metal within the pores of the support. A more uniformly distribution of active metal can
be achieved with the adsorption method.

25
Adsorption
The adsorption method, or ion exchange, consists of substituting a cation or anion
of the support with the ionic form of the active metal. Thus, this technique is strongly
influenced by the number of available adsorption sites on the support, concentration of
ions, the pH and the adsorption strength (Farrauto and Bartholemew 1988). However,
this method allows the formation of a variety of metal particle sizes, loadings, shapes and
surface area (Bamwenda, Tsubota et al. 1997). This process is very effective with the use
of zeolites, such as ZSM-5 or Y-type faujasite since they exchange ions efficiently.
While only low loadings can be achieved with this method, it is appropriate when
expensive active metals are used such as platinum or gold on silica. There are obviously
many other catalyst preparation processes such as precipitation or chemical reduction and
their methods can be found in Farrauto and Bartholemew (1988). Catalysts can be
characterised using XRD, TEM and Chemisorption and these methods are reviewed in
Chapter 3: Experimental Methods.
2.2.5) Metal Particle Size, Loading and Distribution
Depending on the objective of the experiment the catalyst can either be treated
under a flow of inert gas like nitrogen or argon to remove adsorbed molecules on the
catalyst or be reduced by a flow of hydrogen. Control of metal deposition on the support
is achieved by adjusting the quantity of support, pH, time of crystallization, calcination
procedure and concentrations of metal ions in solution (Bamwenda, Tsubota et al. 1997).
The metal particle size of a supported catalyst plays an important role in the activity and
selectivity of the reaction as well as on the catalyst behaviour. The use of small Pd

26
particle (<2 nm) for the oxidation of glucose results in over-oxidation deactivation due to
the higher oxygen affinity of small particles (Besson and Gallezot 2003; Gangwal, Schaaf
et al. 2004). On the other hand the use of large metal particles lowers the intrinsic
activity of the catalyst since the total exposed metal surface area decreases compared to a
catalyst with similar metal loading and smaller metal particle size (Gallezot 1997). It
becomes obvious that catalysts with similar metal identity but different metal particle size
behave differently. The use of highly dispersed Pd nano-cluster (0.13nm) on alumina for
allylic alcohols oxidation results in Turn Over Number (TON) per mole of Pd ten fold
higher than ten times bigger particle size (1.3nm) (Hackett, Brydson R.M et al. 2007).
On the other hand, by increasing the metal loading and cluster size on the catalyst the
yield was increased although at the expense of a dramatically reduced TON. The same
increase of activity with a decrease of cluster size using a gold catalyst was reported for
the benzyl alcohol oxidation (Dimitratos, Lopez-Sanchez et al. 2007). In terms of
selectivity, a catalyst with a higher metal surface area can be expected to over-oxidize the
intermediate formed and hence might decrease the selectivity. For example, it was
deduced that a gold catalyst with a larger metal surface area was considerably less
selective for the glycerol oxidation since an intermediate formed had more chance of
being over-oxidized into an unwanted by-product (Porta and Prati 2004).
2.2.6) Catalyst supports
Precious metals are supported to increase their dispersion, stability and the active
surface area even to a higher degree than ground bulk metal (Hills, Nashner et al. 1999;
Abad, Corma et al. 2008). Therefore, in the development of a novel catalyst, much

27
research and trials are performed to find the most appropriate support since it will
influence the metal particle size, structure, charge and form the specific active sites at the
metal–support boundary (Qu, Huang et al. 2005). Supports can be classified in two
categories: metal oxides and organic based supports.
Metal oxide supports
A wide range of inorganic supports exist for different catalyst preparations
including zeolites (Srinivas, Radha Rani et al. 2001), hydrotalcites (Dimitratos, Villa et
al. 2006), washcoated ceramic foams (Twigg and Richardson 2002). However only
unstructured supports will be reviewed. The common metal oxides used are
alumina 32OAl , iron oxide 32OFe , silica 2SiO , titania 2TiO and ceria 2CeO . Depending
on the method of preparation, the surface area and pore sizes may vary considerably.
However, a high surface area (>100 m2/g) and highly porous supports (~1-5 nm pore
diameter) are usually used for commercial catalyst in order to maximise the dispersion of
the expensive, active metal (Vayenas, Bebelis et al. 2001).
The support can act as a Lewis acid affecting the conversion and selectivity by
accepting a pair of electrons. The potential of a support to act as Lewis acid can
subsequently affect the conversion and selectivity. Strong Lewis acids such as alumina
and iron oxide may have +3Al and +3
Fe ions in their structure which exhibit strong
affinities to oxidise substrates which usually show a higher activity at an expense of
selectivity. These supports were investigated using gold and gold-palladium mixtures for
the oxidation of benzyl alcohol showing a loss of selectivity compared to titania and

28
silica as was mentioned in 2.2.1.1 (Enache, Knight et al. 2005; Enache, Edwards et al.
2006). Supports using alkaline earth metals such as magnesium oxide were shown to be
active as well since platinum had a higher tendency to form small metal particles on the
support (Jia, Jing et al. 1994).
The support may play a direct role in the catalysis other than dispersing the active
metal. In the case of gold based catalysts, it is the lattice oxygen of the support that
participates in the oxidation while gaseous oxygen will replenish the vacancy created in
the absence of basic conditions (Vayenas, Bebelis et al. 2001). The following
mechanism was proposed when ceria is used as support (Abad, Concepción; et al. 2005):
Figure 2.5) Alcohol oxidation with Au/Ceria catalyst

29
Figure 2.5) shows that the oxidation of alcohol happens on the gold-support boundary.
The Lewis Acid (LA) sites and the lattice oxygen are indispensable in the oxidation of
the alcohol which explains the considerable difference in activity between different
supports (Enache, Knight et al. 2005).
Carbon based supports
Carbon based supports like graphite and activated charcoal, are widely used as
supports. Typically, carbon can be activated following two methods: chemical and
physical activation (Auer, Freund et al. 1998). The chemical preparation involves the
addition of activating agents such as 43 POH or 2ZnCl to raw organic material and
increasing the temperature up to 1073 K. The physical preparation involves the heating
of pre-carbonized material in absence of air or under steam at 1073 K. The activation of
carbon creates a considerable number of pores and hence increases substantially its
surface area. While graphite has an average surface area of 10-50 m2/g, the surface area
of activated carbon can reach 800-1200 m2/g (Auer, Freund et al. 1998). Also, depending
on the precursor from which the carbonisation was prepared, different morphologies will
be expected. Figure 2.6) shows an SEM picture of activated carbons prepared with
different precursors.

30
Figure 2.6) Scanning Electron Microscopy on activated carbon with 450 and 1000 times
magnification respectively made by a) wood, b) peat (adapted from Auer et al. 1998)
A carbon support offers many advantages such as stability in acidic and basic
mediums unlike alumina and silica for example, and it can be burnt in case of catalyst
deactivation to easily recover the metals (Prati, Villa et al. 2007). Therefore, carbon
supports have been widely used for oxidation processes with precious metals (Lee A, J.J
et al. 2000; Pinxt, Kuster et al. 2000). Unlike metal oxides, carbon supports are
electronically inert but extremely conductive causing a different conversion activity for a
similar process especially for the case of gold (Dimitratos, Lopez-Sanchez et al. 2007).
Abad et al. (2008) showed that for the benzyl alcohol oxidation with similar sized
supported gold particles on carbon and metal oxides, the chemical nature of the supports
affected the activity and selectivity of the catalysis. Indeed, gold supported on ceria gave
a conversion of 45% for cinnamyl alcohol while on carbon support the conversion was
15% for the same substrate and conditions.

31
2.2.7) Catalyst Deactivation
Catalyst deactivation is a major reason that delays the application of PGM catalyst
in the fine chemical industry (Markusse, Kuster et al. 2001). It becomes crucial to
identify the reasons that cause such deactivation and investigate any possible solutions.
Mallat and Baiker (1994), Gallezot (1997) and Vleeming et al. (1997) have enumerated
different deactivation causes:
1. Overoxidation: Strongly adsorbed oxygen on the catalyst surface.
2. Poisoning: Substrate adsorption on the active sites
3. Metal leaching/ Particle agglomeration: Metal leaching is defined as the loss of
active metal during the catalysis in the solution. After leaching occurs, a metal
ion may be re-deposited on another metal particle causing, an increase in particle
size through agglomeration which decreases the efficiency.
4. Fouling/coking: The blockage of active sites by deposition of species such as
carbon.
2.2.7.1) Overoxidation
As was previously discussed in section 2.2.3), overoxidation occurs at high
oxygen coverage or a catalyst potential higher than 0.8V vs. RHE for platinum
(Markusse, Kuster et al. 2001). The catalyst activity can be restored by allowing the
catalyst to be reduced or by interrupting the oxygen flow (Dirkx and van der Baan 1981;
Nicoletti and Whitesides 1989; Bronnimann, Bodnar et al. 1994) or can be enhanced with
the addition of promoters as was previously discussed in section 2.2.2).

32
2.2.7.2) Poisoning
Poisoning is the strong chemisorption of compounds or impurities on catalytic
active site. A principal example is the presence of H2S in feeds for the steam reforming
of CO on nickel based catalysts. The formation of Ni3S2 is thus irreversible and renders
the catalyst inert (Smith, Xia et al.; Alvarez and Ancheyta 2008). In the case of alcohol
oxidation, strongly adsorbed substrate is referred to as chemical poisoning and can occur
due to alcohol, carbonyl or by-product bonding to the metal. The adsorbed molecule may
dissociate and bond chemically to the metal surface. Therefore, poisoning is highly
dependent on the identity of the substrate. Carboxylic acids (Kluytmans, Markusse et al.
2000), ketones (Nicoletti and Whitesides 1989; Vleeming, Kuster et al. 1997), and even
alcohols (Mallat and Baiker 1994) may deactivate the catalyst by strong adsorption.
Similarly to the rate of adsorption, the rate of desorption is expected to be follow an
Arrhenius-like form, RTE
ddAek
/−= , where typical energies for desorption are 100kJ/mol
(Atkins 2002). It is crucial to have the rate of product desorption faster than the rate of
reactant adsorption in order to regenerate active sites. While substrate can physisorb
and/or chemisorb, it is only the latter that inhibits the active sites due to the strong
bonding with the metal.
Poisonous substrates can be classified into two categories: Molecules containing
the CO group and non-oxygenated hydrocarbons. Carbon monoxide or carbonyl
compounds can be re-oxidised to form carbon dioxide at high catalyst electro-potential
while hydrocarbons can be hydrogenated to break the RC-M (carbon-metal bond) and
form RC-H in order to prevent deactivation. Primary alcohols exhibit more CO
poisoning than secondary alcohols and as the carbon chain length increases, the carbonyl

33
poisoning decreases (Parsons and VanderNoot 1988; Leung and Weaver 1990). For
instance, the oxidation of methanol or propanol deactivates the catalyst with a decrease in
the potential of the latter up to 0.5V vs. RHE (Pastor, Wasmus et al. 1993) which means
the catalyst has a high coverage of CO. The oxidation of benzyl alcohol decreases the
potential down to 0.3V vs. RHE (Leung and Weaver 1990) since non-oxygenated rings
such as benzene adsorbed strongly on the catalyst, lowering the potential. The best
example for chemical poisoning comes from the oxidation of glucose with platinum
(Popovic, Markovic et al. 1991; Popovic, Tripkovic et al. 1992). The intermediates
gluconic acid, gluconate and smaller fragments strongly bound on the Pt surface which
deactivates the catalyst as can be illustrated in Figure 2.7) (Bae, Xing et al. 1990).
Figure 2.7) Gluconic acid poisoning on platinum (Popovic, Tripkovic et al. 1992)
Poisonous substrates can also be created by possible side reactions which lead to
decreases in selectivity towards the intermediate carbonyl as well. Overoxidation of an
aldehyde molecule creates carboxylic acids which strongly adsorb on the surface
(Nicoletti and Whitesides 1989). Other reported side reactions are polymerization and
aldol condensation in strongly basic or acidic solution (Tsujino, Ohigashi et al. 1992).
Selectivity is also affected if the adsorbed hydrogen is not removed from the metal
surface since hydrogenation may occur, thus forming different by-products (Hardacre,

34
Mullan et al. 2005). In an anaerobic basic medium, fructose was oxidised into gluconate
with platinum, and the adsorbed hydrogen hydrogenated the fructose into mannitol and
sorbitol (Gallezot 1997).
2.2.7.3) Metal leaching/ Particle agglomeration
There are different causes for the loss of metal particles in solution, the sintering
of active metal or the sintering of the support. The common deactivation cause is thermal
sintering where a high temperature causes the support to collapse (Farrauto and
Bartholemew 1988). However, thermal deactivation is not a common phenomenon in
liquid phase oxidation due to the lower temperature used.
The presence of certain species, such as anions and carbohydrates, can enhance
the loss of the active metal into the solution (Vleeming, Kuster et al. 1997). Schuurman
et al. (1992) reported the loss of activity for the oxidation of alpha-D-glucopyranoside
due to re-deposition of platinum ions, which is known as the Ostwald effect. The
Ostwald ripening points toward small crystallites which tend to increase in size to bring
the surface to volume condition to a favourable low free energy state (Kent 2007). The
literature on this type of deactivation is scarce since catalysts might lose their efficiency
by leaching or agglomeration only after many runs (Vleeming, Kuster et al. 1997).
While poisoning and overoxidation are reversible processes, leaching and agglomeration
are irreversible and may render the catalyst completely useless (Mallat and Baiker 1994).
2.2.7.4) Fouling/coking

35
While poisoning is the selective bonding of a substrate to the active metal, fouling
is the mechanical random or non-selective deposition of species unto the catalyst surface.
The most common example is coking or carbon deposit of oil cracking in porous catalysts
that blocks active sites. The most common cause of coking is the decomposition at
temperature higher than 473K (Farrauto and Bartholemew 1988). The catalyst can be
regenerated by controlled combustion of the coke while preventing a high temperature
peak in order not to cause any sintering of the catalyst. Therefore, in liquid phase
oxidation coking is rarely a cause of catalyst deactivation. The major catalyst
deactivation causes can be summarised in Figure 2.8).
Figure 2.8) Different deactivation mechanism (Kent 2007).

36
2.2.8) Reaction Kinetics with Deactivated Catalyst
Catalyst deactivation is an inevitable phenomenon. However, being able to
predict the deactivation by modelling allows the appropriate design, in labs or industry,
of processes. Such improved designs greatly increase the commercial application of a
catalyst, its lifetime expectancy and the use of the appropriate reactor (Farrauto and
Bartholemew 1988). Therefore, a mathematical symbol was introduced in the kinetics of
catalytic reactions calledα , which is the activity function or the rate of reaction on the
deactivated catalyst divided by the rate on fresh catalyst (Butt 1980). When the activity
function occurs separately from the concentration function )(Cf of the reaction, the
deactivation rate is given by (Levenspiel 1972):
d
ddd Cfkdt
dr αη
α)(=
−=− , Eq. 2.2.8.1
)(Cf is the function of concentration of reactants and products, dη is the effectiveness
factor for deactivated processes and d is the corresponding order of deactivation of α
(Froment 1980; Butt 1982).
However, Eq. 2.2.8.1 assumes that the activity will eventually decrease to zero. In some
deactivation cases such as poisoning or sintering, the catalyst is still active. Therefore, a
constant, C', was introduced in the general reaction kinetic form with deactivated
catalysts (Fuentes 1985).
C')( +=−
=− d
dddd Cfkdt
dr αη
α, Eq. 2.2.8.2
In this case, the deactivation is included in the concentration function as well dCf )( .
Finally, by modelling and predicting the catalyst deactivation, it allows the delay of

37
activity loss which is always better than attempting to regenerate the catalyst (Kent
2007).
2.3) Solvent Effects
The choice of solvent influences certain processes depending on many of its
characteristics (Rajadhyaksha and Karwa 1986). Firstly, the gaseous reactant should be
soluble enough in the medium in order not to slow the reaction. Secondly, both liquid
and gaseous reactants should have a high diffusivity coefficient in the given solvent to be
transported to the catalyst particle. Thirdly, solvents have characteristic macroscopic and
structural effects. Macroscopic effects are the physical properties of bulk solvent such as
dielectric constants and dipole moments. The dielectric constant is the ratio of the
quantity of stored electrical energy to the permittivity of air when a potential is applied.
The dielectric constants and dipole moments strongly influence the transition state
containing charges. Solvents having a high dielectric constant enhance the dissociation
of a bond to form charges while solvents with a low dielectric constant tend to neutralise
charged species by forming bonds (Carey and Sundberg 2007). However, a solvent
interaction with solute and catalyst cannot be predicted based solely on macroscopic
properties since the solvent molecule structure also plays a considerable intermolecular
role that has been difficult to investigate.
Solvents may be classified into two categories: non-polar and polar. Non-polar
solvents have a low dipole moment and dielectric contrary to polar solvents. Polar

38
solvents can be further divided between protic, which forms hydrogen bonds and aprotic
polar which do not form hydrogen bonds. Non-polar solvents such as heptane, toluene,
and p-xylene are often used due to their inertness and higher oxygen solubility than
alcohols (Mallat and Baiker 1994; Keresszegi, Mallat et al. 2004). Another advantage of
apolar solvents is their lack of interaction toward catalysts. Different solvents including
polar and non-polar have been tested for alcohol oxidation (Kawabata, Shinozuka et al.
2005). It was deduced that reactions performed in non-polar solvents such as toluene
tend to have higher reaction rate since polar solvents such as acetonitrile would compete
with reactants to adsorb on active metallic sites, hence lowering the reaction rate.
If the solvent has a low dipole moment and dielectric constant it becomes
hydrophobic and could have detrimental effects on conversion. One of the by-products
of oxidation with molecular oxygen is water which is produced in equimolar amounts
with the carbonyl product. However, water can strongly adsorb on noble metals and on
metal oxide supports such as alumina, titania and silica via H-bonding thus blocking
active sites from reactants. Keresszegi et al. (2004) used a water surfactant to remove
adsorbed water on Pt/Alumina in order to proceed with the alcohol conversion since the
hydrophobic toluene and cyclohexane were unable to remove adsorbed water. Gallezot,
(1997) substituted the silica and titania supported platinum with carbon support due to the
excessive H-bonding of glyoxal hydrogen-bonded to the hydroxyl groups of the oxide
supports. Therefore, in order to achieve a satisfactory reaction rate, products should be
miscible enough in solvents to be removed from the catalyst surface while reactants
should not have to compete for metal site adsorption.
39
The ideal solvent for green chemistry would be water since it is the least toxic.
However water has many limitations such as the insolubility with organic compounds,
low oxygen solubility and due to its high polarity, water may strongly adsorb on the
catalyst. Mallat and Baiker (1994) suggested the use of water-detergent systems that are
more environmentally friendly than organic solvents and are as efficient, such as
dodecylbenzenesulfonic acid sodium salt.
Solvents may also help tune or determine the production distribution of a certain
reaction. When a substrate can undergo different reactions pathways resulting in
different possible products, the solvent can favour one path over the other. For example,
the use of a dioxane solvent leads to the production of benzaldehyde from the benzyl
alcohol oxidation. On the other hand, dioxane/water mixtures led to the production of
benzoic acid (Donze, Korovchenko et al. 2007; Korovchenko, Donze et al. 2007).
Hence, depending on the nature and polarity of a solvent, one product may be more
favoured than another. Consequently the solvent choice then becomes crucial where the
most desirable characteristics are: Reactant solubility and diffusion, inertness toward the
catalyst and a balance in the interaction with reactants/products (Rajadhyaksha and
Karwa 1986). Table 2.1) shows a few examples of solvents used in the literature for
alcohol oxidations.

40
Author Solvent
X(2O )at
298K and
1 bar
(410−× )
b
Dielectric
Constant Alcohol
% S
(Selectivity) at
%C
(Conversion)
Catalyst
used Comments
2,2-dimethyl-
1-propanol
64%S at
100%C (Ebitani, Ji et
al. 2004) Benzotrifluoride
a __ __
1-Octanol 97%S at
100%C
Ru
/CeO2/CoO
The efficiency
of a solvent
varies with the
nature of the
substrate
Diethyl Carbonate (basic) __ __ 99%S at
66%C (Jia, Jing et
al. 1994) Heptane 22 1.9
Cyclohexanol 100%S at
29%C
Pt/MgO
Alkaline
medium
increases the
reaction rate
Toluene 9.2 2.4 88%S at
100%C (Hardacre,
Mullan et al.
2005) Ionic liquid
(1-butyl-3-methyl-imidazolium
bis(trifluoromethylsulphonyl)imide)
__ ~ 40
cinnamyl
alcohol 96%S at
100%C
5%
Pd/Alumina
The higher
selectivity in the
ionic liquid is
due to a lower
reaction rate.
Dioxane 5.3 2.2
95%
Benzaldehyde
at 95%C
(Donze,
Korovchenko
et al. 2007)
50% Dioxane/Water __ __
Benzyl
Alcohol
98% Benzoic
acid at 95%C
1.95% Pt/C
Solvent
determines the
product and
reaction rate.
Table 2.1) Examples of different solvents used. a) Selectivity towards the carboxylic acid.
b) Battino et al. (1983)

41
2.4) Temperature Effects on the Oxidation
At high temperatures, the reaction rate of liquid phase alcohol oxidation increases
according to the Arrhenius equation. The minimum kinetic energy that reactants must
have to be oxidised, or the activation energy, depends strongly on temperature (Perry
1997). This dependence is strongly manifested if the reaction is carried out in the kinetic
regime. Sometimes, the formation of hot spots in trickle beds may result in a
heterogeneous product distribution (Kresta, Edward PL et al. 2004). In the mass transfer
regime, a variation of temperature does not result in a significant change of the reaction
rate (Winterbottom and King 1999; Fogler 2001). In addition, a temperature increase
may result in C-C bond rupture. CO molecules and CxHy by-products may form and
strongly adsorb on the active sites, decreasing selectivity and causing catalyst
deactivation by strong adsorption (Colmati, Antolini et al. 2006; Tokarev, Murzina et al.
2006). In this case a strong oxygen flow is required to oxidise CO and a hydrogen flow
to remove bonded hydrocarbon chains. Conversely, low temperature reactions have
lower reaction rates and may deactivate the catalyst by strong substrate adsorption
(Mallat and Baiker 1994). The temperature effects on oxidation vary depending on the
nature of the substrate. Molecules such as carbohydrates are more sensitive to
temperature effects in terms of degradation and poisoning effects on the catalyst. The
oxidation of D-glucose exhibited a slower rate at high temperature since it transformed
D-glucose into D-fructose which adsorbed on the platinum catalyst (Yei, Beden et al.
1988). Typical temperatures for liquid phase oxidation are below 373K and usually
between 310K and 350K (Gallezot 1997).

42
2.5) Stirred Tank Reactors
2.5.1) Reactor Design
Stirred Tanks Reactors (STR) are commonly used in industry for medium scale
chemical productions and when processes require uniform temperature and concentration
which makes them suitable for fast reaction rates (Perry 1997). The application of stirred
tanks represents around 50% of the world chemical production (Kresta, Edward PL et al.
2004). Efficient reactant mixing is highly desirable when mass transfer is limiting the
production and to increase production profit.
Uneconomical mixing may occur for example when the stirrer is incapable of
lifting the solid particles from the bottom of the vessel. It is advised to use down-
pumping impellers in this case to push the particles away from the reactor base. Flooding
may happen when gas at high velocity is supplied under an impeller at low stirring speed.
Then the gas is not dispersed effectively and the reactants don’t mix well. In three phase
systems, it is desirable to have the solids suspended and the gas well dispersed while
avoiding flooding. Therefore, there are key parameters to be considered when designing
an STR:
1. Reactor geometry
2. Impeller types
3. Baffles
4. Gas spargers

43
2.5.1.1) Reactor Geometry
A conventional STR is usually shaped cylindrically although square shaped or
horizontally orientated STR’s exist as well to prevent gross vortexing of the solution
(Kresta, Edward PL et al. 2004). The bottom may be flat or slightly concave. The
location of inlets and outlets depend on the type of batch process. For slow reaction
processes the feed inlet may be positioned on top of the reactor between the walls and the
shaft. For fast reaction processes, the feed inlet tip should discharge the chemicals in a
highly turbulent region to allow maximum mixing while keeping an appropriate nozzle
size to prevent back-mixing. For dead end reactions in which gas is only supplied to
replenish that used up by the reaction, the outlet may be located on the side or bottom of
the reactor as long as it is not blocked by the presence of solids. This configuration can
be used when the transport of the gaseous reactant is not limiting the reaction or to
prevent its loss. For continuous operation it is advised that the outlet is located far from
the inlet to prevent any loss of reactants. This configuration can be used to enhance the
gas to liquid mass transfer by enhancing the gas distribution in the vessel with
appropriate gas spargers and impellers. Gas spargers are usually rings with a number of
spaced holes just underneath the impeller. A steel mesh can also be used on the tip of the
inlet pipe to generate micro-bubbles (Nienow 1998; Kresta, Edward PL et al. 2004). A
major challenge lies in designing a stirred tank with an optimum mixing configuration.
One parameter to determine the mixing efficiency is the maximum turbulence energy
dissipation rate per unit massmaxε (Gabriele, Nienow et al.). The energy dissipation rate
evaluates the degree of bubble break-up and coalescence, chemical reaction and
segregation (Sheng, Meng et al. 2000). Zhou and Kresta (1996) have evaluated the

44
impact of different reactor configurations in order to determine the effects of baffles
number bN , clearance C, impeller diameter D and C/D ratio on maxε with various
impellers on a typical stirred tank as is illustrated in Figure 2.9).
Figure 2.9) STR dimension nomenclature
The value of maxε was determined using laser Doppler velocimetry to evaluate the mean
and fluctuating velocity near the impeller with L
A 3
max
νε = where A=1 and L=D/10 (Wu
and Patterson 1989; Zhou and Kresta 1996). A large variety of impellers exist for
commercial uses. The optimal reactor configurations for the Rushton Turbine (RT),

45
Pitched Blade Turbine (PBT), hydrofoil turbine (A310) and High-Efficiency turbine
(HE3) in order to maximise maxε are be summarised in Table 2.2).
Impellers bN C D C/D PN
RT-4 4 T/4 T/2 1/2 4.4
PBT-4 4 T/2 T/2 1 1.27
A310-3 4 T/2 0.550T ~1 0.3
HE3 2 T/2 T/2 1 0.3
Table 2.2) Optimum reactor configuration to create the highest maxε in solid-liquid
systems (Zhou and Kresta 1996)

46
2.5.1.2) Impeller types
Some commonly used impellers are illustrated in Figure 2.10).
Figure 2.10) Impeller variety. A) Rushton Turbine; B) Pitched Blade Turbine; C) A320
Turbine; D) A310 Turbine
Depending on the type of process, the appropriate impeller should be used. For example,
different stirrers may be selected for single phase, gas-liquid or gas-liquid-solid

47
operations. Impellers can be characterized by the power number and flow patterns
(Kresta, Edward PL et al. 2004). The power used by an impeller is defined by:
53DNNP LP ρ= Eq. 2.5.1.2.1
The power number PN is a dimensionless number relating the resistance force to the
inertia force. It depends on the impeller type and the Reynolds number. The Reynolds
number is defined as:
µ
ρ 2
ReNDL= Eq. 2.5.1.2.2
When Re<10 the flow is laminar and when Re>104 it is turbulent. Between these two
values the flow is in a transitional state. PN is constant in a turbulent regime. The
energy dissipated by the impeller is:
m
DNN LP
53ρε = Eq. 2.5.1.2.3
Using the energy dissipated, the Reynolds number can be calculated from the following
formula:
3/1
3
4
Re
=
ν
εD Eq. 2.5.1.2.4
The position and size of the impeller in the reactor has a large effect on the efficiency of
mixing and recommendations of the most suitable designs for different applications may
be found in Kresta et al. (2004).

48
Impellers are also characterised by the flow type they generate as can be
illustrated in Figure 2.11).
Figure 2.11) Radial and Axial Flow. (Kresta, Edward PL et al. 2004)
An RT impeller generates a radial flow with two circulating loops, above and below the
impeller while a PBT produces an axial flow. However, at high stirring speed, large D or
high viscosity liquids, the PBT will generate a radial flow as will be demonstrated in
Figure 2.12) (Kresta, Edward PL et al. 2004; Fishwick, Winterbottom et al. 2005).
In three phase stirred tanks and gas-liquid systems, the use of downward
pumping, or PBT-D, when the gas is sparged under the impeller creates instable flow
patterns (Nienow 1998; Nienow and Bujalski 2002) and may flood easily especially for
D/T<1/2 (Chapman, Nienow et al. 1983). In order to reduce the flooding tendency, a 6
blade turbine can be used instead of 4 blades and a 0.8D sparger. An increase in the
impeller speed also reduces the flooding by gas break up. Upward pumping, or PBT-U,

49
however, disperses gas very well and is energy efficient (Chapman, Nienow et al. 1983).
Fishwick et al. (2005) have used Positron Emission Particle Tracking (PEPT) technique
to further to evaluate the effects of gassing on a PBT-D and PBT-U. The PEPT
technique uses a pair of gamma-rays detector to track the position of a single
radioactively labelled particle. It can thus be used to determine velocity fields and
particle trajectories in opaque process equipment. Figure 2.12) demonstrates the results.
Figure 2.12) PEPT measurements of the mean radial-axial velocity vector plots for: a)
PBT-D and b) PBT-U when i) un-gassed and ii) gassed at 1.5vvm (Fishwick,
Winterbottom et al. 2005).
Figure 2.1 2) a(i), a(ii) clearly shows how the introduction of gas disturbs the magnitude
as well as the pattern of the flow for the PBT-D. On the other hand, the flow created by
the PBT-U is barely affected upon gas introduction in Figure 2.1 2) b(i), b(ii). Bujalski et
al. (1990) have shown that a PBT-U can achieve similar gas-liquid mass transfer

50
coefficient as an RT with comparable power input. The PBT-U can also achieve a high
gas hold-up comparable to the one produced by the RT (Aubin, Le Sauze et al. 2004).
2.5.1.3) Baffles
Baffles are used in a turbulent or transitional flow regime and rarely in Laminar
flow of viscous systems. Baffles prevent the liquid in the reactor from just swirling
around ineffectively and allow top-bottom mixing. Since the baffles increase the drag in
the system, the power draw increases as well. The width of baffles is usually 8-10% of
the tank diameter (Kresta, Edward PL et al. 2004). Having bN >8 and B/T>0.2 interrupts
the mixing, while 4< bN <8 increases the mixing efficiency (Lu, Wu et al. 1997).
2.5.1.4) Gas Spargers
A well-designed gas sparger will increase the gas-liquid mass transfer by
decreasing bubble sizes, increasing the number of bubbles produced (increasing the gas-
liquid interface area) and allowing a more homogenous distribution of bubbles
throughout the reactor. The bubble development depends on the gas flow rate, pore size
distribution and the physical characteristics of the liquid phase (Kazakis, Mouza et al.
2008). Gases are usually introduced in the tank via a shower disc plate that should be
around 0.8 times the size of the impeller (Bujalski, Nienow et al. 1990). Other
techniques involve the use of porous ceramic distributors, or steel mesh.

51
2.5.2) Advantages and Disadvantages of the STR
The use of the STR is mainly in the fine chemical and pharmaceutical industry
where flexibility in product recipe and ease of cleanliness are essential. The STR has
many advantages over other three-phase reactors, such as trickle bed reactors (TBR) or
packed bed bubble column (PBBC) (Chaudhari and Ramachandran 1980):
1. The STR allows the use of any particle size. Therefore, in case internal mass
diffusion limits a certain reaction, the catalyst can be further crushed into fine
particles to increase the effectiveness factor. While within a packed reactor such
as a trickle bed decreasing the particle size will considerably increase the pressure
drop, hence the cost of operation.
2. Similarly to mass transfer coefficients, heat transfer coefficients are higher as well
avoiding the creation of hot spots as is the case with TBR for instance.
Throughout the reactor the temperature is uniform and relatively easy to control.
3. All the external surface of the catalyst is exposed to the reaction medium in STR
while in TBR some of the catalyst may not be wet from the liquid flow which
decreases the efficiency per unit of catalyst in the packing.
4. The STR provides an easy maintenance and cleaning procedure which is valuable
in industrial processes.

52
However the STR has some limitations as well (Chaudhari and Ramachandran 1980;
Fogler 2001).
1. STR has the lowest reactant conversion per unit of reactor volume compared to
other three phase reactors. Hence the requirement to build large reactors for high
production.
2. Loss of catalyst may occur due to particle attrition which may require a further
filtration step.
3. The cost for mechanical agitation may be substantial
2.6) External Mass Transfer
In a three phase slurry reactor where the catalyst is a solid and the reactants are
gaseous and liquid, it is crucial to transport the reactants past the interface walls and onto
the catalyst surface. This means that the oxygen has to first diffuse from the gaseous
phase to the liquid phase and then to the catalyst particle, while the liquid alcohol has to
diffuse through the liquid-catalyst thin film. These diffusion steps can be considered as
resistances which may decrease the concentration of the substrate as it passes from one
phase to another depending on the mass transfer coefficients and the superficial area of
contact (Fogler 2001). Figure 2.13) shows the 3 main steps of the material transport
consisting of gas-liquid mass transfer, liquid-solid mass transfer and internal diffusion
and reaction on the catalyst.

53
Figure 2.13) Gas concentration profile under mass transfer resistances (Monteiro 2005).
The first step of mass transport in the above figure is the oxygen incorporation
into the liquid phase. The rate of oxygen absorption in the organic solvent depends on
the gas bubble superficial area ba , the mass transfer coefficient GLk and the oxygen
concentration difference between gas bubble and the liquid bulk )( Bi CC − . Hence for
first or pseudo-first order reactions, the absorption rate is:
)( BiBGLA CCakR −= Eq. 2.6.1

54
The second step of mass transport in Figure 2.9 is the reactant transport onto the
catalyst surface. The rate of reactant transport depends similarly on the external specific
surface area of the particles Pa , the mass transfer coefficient SLk , the catalyst loading w
and the reactant concentration difference between the liquid bulk and the catalyst
surface )( SB CC − . Thus the transport rate is:
)( SBPSLB CCwakR −= Eq. 2.6.2
The last step consists of internal diffusion of the reactant within the catalyst
particle and the surface reaction. The rate of internal diffusion and reaction depends on
the catalyst loading w , the specific reaction rate intk , the reactant concentration on the
catalyst surface SC and the internal effectiveness factorη . Therefore the internal
diffusion and surface reaction rate is:
wCkR SC ηint= Eq. 2.6.3
At steady state, all three mass transfer rates are equal, consequently CBA RRR == . The
components of these three equations can be rearranged to give:
)11
(11
ηkakwakR
C
pSLbGLA
i ++= Eq. 2.6.4

55
By plotting A
i
R
Cvs.
w
1, which parameters can be experimentally measured for a pseudo-
first order reaction, the following resistances can be established from the resulting
straight line as can be seen Figure 2.14):
bGL
bak
rIntercept1
== : Resistance to gas absorption
kakrrSlope
PSL
rcη
11+=+= : Resistance to liquid-solid mass transfer and internal
diffusion with surface reaction respectively.
Figure 2.14) Plot to determine the mass transfer resistances

56
2.6.1) Gas-Liquid Mass Transfer
Oxygen has a very low solubility in organic liquids (Battino, Rettich et al. 1983).
It can be expected that the oxygen concentration will be much less in the solution than in
the gas phase. The resistance to gas absorption can be determined experimentally by
equation 2.6.4 and Figure 2.14 or by an appropriate semi-empirical formula. Empirical
gas-liquid mass transfer correlations have been thoroughly investigated for different
conditions for STR in the literature (Table 2.1). Some formulas are dependant on the
Reynolds number like the one proposed by Yagi and Yoshida (1975) while Van't Riet
(1979) supposed that bGLak is dependant on the power draw, gas superficial velocity and
the liquid volume. Chaudhari et al. (1987) proposed correlations for dead-end batches
that are evidently not dependant on the gas superficial velocity (Litmans, Kukurechenko
et al. 1972). It is therefore crucial when applying a semi-empirical equation to remain
within the limitations and conditions set for such formulas in order to have valid results.
Kawase et al. (1997) developed an equation to determine gas-liquid mass transfer that
takes into effect the presence of solid particles and whether or not the liquid is
Newtonian. A survey of the different correlations can be found in literature
(Ramachandran and Chaudhari 1983).

57
Correlation Author
32.06.0
5.0
19.02
5.1
2
Re06.0
=
GL
GL
AB
bGL
u
NDSc
g
DN
D
Dak
σ
µµ (Yagi and Yoshida 1975)
ξ
ϕ
GbGL uV
PKak
= (Van't Riet 1979)
16.1
2
1
16.288.1
18.231048.1
×= −
h
h
T
D
V
VNak
L
G
bGL
5.0/,33.8,3.0/,1/ 1
21 >>>> − TDsNhhVV LG
(Chaudhari, Gholap et al.
1987)
( )
25.02/1
5/3)1(2/1
)1(10/)49(5/3
/
−
+
++
′=
w
a
t
g
n
l
nn
l
ABbGLU
U
KDCak
µ
µ
σρ
ερ (Kawase, K; et al. 1997)
5.0
376.11366
=
πb
bAB
bGLd
uDdk (Miller 1974)
5.0
3/1
2
)(42.0 −
−= Sc
guk
L
LGL
GLρ
ρρ
(Calderbank and Moo-
Young 1961)
Table 2.3) Semi-empirical correlations for bGLak
2.6.2) Liquid-Solid Mass Transfer
In three phase systems two limiting mass transfer cases may occur: the transport
of the dissolved gaseous reactant and the transport of the liquid reactant. However the
liquid reactant concentration far exceeds the oxygen solubility in organic media.
Subsequently it is the mass transport of oxygen that is expected to be limiting the
reaction. Equation 2.6.4 cannot determine directly pSLak since the slope of the

58
corresponding plot includes the internal mass transfer and surface reaction resistances as
well. However there are many semi-empirical formulae that can be used to
estimate pSLak . Frossling (1938) developed a correlation based on the Reynolds and
Schmidt number and there have been since many variations of the same formula but valid
at different conditions such as the range of the Reynolds and Schmidt number for a given
system (Fogler 2001). Frossling’s correlation evaluates the Sherwood number:
γδα ScSh sRe2 += , Eq. 2.6.5
whereα , δ and γ are variables that have been estimated for different conditions,
impellers by many researchers.
Kluytmans et al. (2000) suggested using similar correlations to evaluate liquid-
solid mass transfer coefficients. However, Kushalkar and Pangarkar (1994) developed a
different equation from the Frossling form that takes into account the effect of gas
sparging in three phases systems similar to the work presented in this work and has the
following form:
( ) 47.0
15.1
31019.1−−
×= Sc
N
Nk
sg
SL, Eq. 2.6.6
where sgN is the critical impeller speed for suspension of solid particle in aerated liquid
and is a function ofsN , which is the critical impeller speed for suspension of solid
particle in unaerated liquid. It is crucial to have the solid particle suspended in the
reactor to allow the use of the whole catalyst surface and to have uniform mixing which
will affect SLk in return. Although downward pumping impellers are recommended for

59
solid-liquid two phase system in order to disperse the sinking catalyst, this configuration
will have a negative effect on the gas-liquid mass transfer and is therefore not advised for
three phase reactors. For upward pumping in three phase stirred tanks, the critical
impeller speed for suspension of solid particle in aerated liquid sgN , can be determined by
(Bujalski, Konno et al. 1998):
( ) 11.01 VGSsg QNN += Eq. 2.6.7
VGQ is the vessel volume per minute flow.
SN is the critical speed for the suspension of
solid particles in non-aerated liquid and can be determined by the following correlation:
85.0
13.045.02.01.0 )/(
D
XgdSN
Lp
S
ρρυ ∆= (Zwietering 1958). Eq. 2.6.8
It has been shown that when the solid-liquid mass transfer is limiting the reaction rate,
increasing N above sgN does not improve the conversion since the particles are already
covered in liquid (Nienow and Bujalski 2002). A survey of the different correlations can
be found in Table 2.4).

60
Correlation Conditions Author
3/15.0Re60.02 ScSh += 4006.0
10Re
3/1
4
<<
<
Sc (Fogler 2001)
3/152.0Re52.02 ScSh += 53/1 103.1420 ×<< Sc (Armenante and
Kirwan 1989)
3/14/1Re4.02 ScSh += Micro-particles
(Kluytmans,
Markusse et al.
2000)
( ) 47.0
15.1
31019.1−−
×= Sc
N
Nk
sg
SL Three phase system (Kushalkar and
Pangarkar 1994)
36.017.062.0
3/13/4
47.02
+=
mL
L
L
Lp
m
pSL
DT
Ded
D
dk
ρ
µ
µ
ρ
35000267
10Re07.0
3/1
4
<<
<<
Sc
(Levins and
Glastonbury
1972)
Table 2.4) Semi-empirical correlations for SLk
2.7) Internal Mass Transfer
When a support is coated with an active metal, the catalytic sites will be
distributed on the particle surface as well as on the porous walls (Fogler 2001). The
reactant has to be transported inside the pores to reach the active sites in order to use the
catalyst efficiently. It then becomes crucial to determine if the reaction rate is limited
because of internal reactant diffusion. A concentration gradient will be the driving force
transporting the corresponding reactant inside the particle. If internal mass transfer is

61
important the substrates will react before reaching the end of the pores while if the
internal mass transfer is negligible no concentration gradient will exist throughout the
catalyst. Hence the substrate will be transported inside the catalyst through molecular
diffusion (liquid-solid systems) and pore walls collision by the Knudsen diffusivity
(solid-gas systems). There is no Knudsen diffusion for liquids, since the mean free paths
in liquids are smaller than pore diameters (Petersen 1965; Perry 1997; Levenspiel 1999)
as can be illustrated Figure 2.15)
Figure 2.15) Different types of diffusion.
Effectiveness factor, Thiele Modulus and Wagner-Weisz-Wheeler Modulus
In order to evaluate the outcome of internal mass transfer, the effectiveness factor
and the Thiele Modulus can be determined and they are defined as:

62
surfacetheonweresitesactivesallifratereaction
ratereactionmeanactual=η Effectiveness Factor
ratediffusion
ratereactionsurface=2φ Thiele modulus
The effectiveness factor is a function of the Thiele modulus which is dependant on the
catalyst shape, size and reactant concentration on the surface. Many researchers have
investigated the properties of different catalyst shape for many reaction orders. When the
particles are small, the reactants are highly diffusive or the reaction is too slow, the
Thiele modulus is close to zero since the diffusion rate tends be very high and the
reaction is intrinsically limited. The effectiveness factor then approaches 1. On the other
hand if the particles are large, reactants slowly diffuse and the reaction is much faster
than the diffusion rate, the Thiele modulus is very high and the reaction is diffusion
limited. The effectiveness factor then approaches zero. A problem that arises from the
determination of the Thiele modulus is that the observable experimental reaction rate
does not correspond to the surface reaction rate only but to both the diffusion and surface
reaction rate (Levenspiel 1999). Therefore in order to evaluate the internal mass transfer
effects another parameter was introduced which is the Wagner-Weisz-Wheeler
modulus WM .
2ηφ==ratediffusion
ratereactionObservedM W
The Weisz-Prater criterion can determine if the reaction is intrinsically limited or
diffusion rate limited for an nth order reaction (Petersen 1965; Perry 1997; Fogler 2001).

63
15.02
1)/( exp2 <
+−=
n
D
CrLM
eff
AV
W Diffusion free regime Eq. 2.7.1
4.02
1)/( exp2 >
+−=
n
D
CrLM
eff
AV
W Diffusion limited regime Eq. 2.7.2
Where L is the characteristic size of a catalyst particle, Vr is the observed reaction rate
per unit of volume of catalyst particles, AC is the initial concentration of reactants and
effD is the effective diffusivity (Weisz and Prater 1954).
2.8) Reaction Modelling and Kinetics
Heterogeneous catalysts provide an alternative reaction path with lower activation
energy (Atkins 2002). The catalyst activates the reactants which increases the reaction
rate (Gangwal, van der Schaaf et al. 2005). It is of crucial importance to extract kinetic
data and establish a model able to describe the reaction rate and products under different
conditions. This allows scale up for an industrial use of a certain process. A common
approach towards experimental data fitting is the power law model which provides the
activation energy and the order of reaction of different substrates. The power law model
has the following form:
n
iBa CCkCR ...βα= , Eq. 2.8.1
Where C is the concentration of different substrate defined by a, b and i with βα , and n
being the reaction order for the corresponding substrates. The power law model is
simple, fits easily the experimental data and has been recommended (Weller 1956).
64
However, the power-law model does not take into account different mechanistic steps or
the existence of intermediates. Therefore, another model is used, the Langmuir-
Hinshelwood (L-H) rate expression, to describe the mechanism and kinetics of a reaction
based on different assumptions. The L-H model presumes that substrates (reactant and/or
products) adsorb on the surface of the catalyst under the following assumptions (Perry
1997; Levenspiel 1999):
1) An active site can be occupied by only one molecule. A monolayer is a catalyst
surface covered with adsorbate.
2) The energy of adsorption is the same on all active sites.
3) An adsorbed molecule does not affect the adsorption of a neighbouring molecule.
Obviously, these assumptions over-simplify the reaction mechanism since multi-layers,
different active sites and various adsorption energies on the same catalyst have been
reported (Satterfield 1991; Kapteijn, Marin et al. 1999; Atkins 2002). Nonetheless, L-H
models are helpful in discriminating between different proposed mechanisms and even
predicting reaction rates (Boudart 1972) and will hence be used to model reaction rate in
this work
Since there is no agreement on the mechanism of the alcohol oxidation there are
different proposed rate laws (Mallat and Baiker 1994). Schuurman et al. (1992)
assumed that the oxidation of alpha-D-glucoside on Pt/C is based on reversible
adsorption of oxygen and associative adsorption of alcohol. The surface reaction
happens between the adsorbed alcohol and oxygen.

65
I) ads
KOHCHROHCHR 22
1* −→←+−
II) adsOOK 2*2 2
2 →←+
III) *2223 ++−→+− OHCHOROOHCHR
k
adsads
25.0
221
5.0
2213
)])[(][1(
])[]([
OKAK
OKAKkR
++= , Eq. 2.8.2
A is the alcohol substrate, P is the ketone product and * denotes an active site on the
catalyst. 111 / −= kkK and 222 / −= kkK are the equilibrium constants for the forward and
reverse reactions of step I) and II) respectively. Step III) is irreversible with 3k as the rate
constant.
On the other hand, van den Tillaart et al. (1994) proposed a different mechanism
for the oxidation of ethanol with Pt/C based on an irreversible adsorption of oxygen and a
reversible dissociative adsorption of alcohol. The surface reaction happens between an
alkoxide and adsorbed oxygen.
I) adsads
KHOCHROHCHR +−→←+− 22
1*2
II) adsOOk 2*2 2
2 →+
III) *3
2 ++−→+− ads
k
adsads OHCHOROOCHR
IV) *224 +→+ OHOHH
k
adsads

66
2
1
13
22
22
)][2][
][21(
][2
AKAKk
Ok
OkR
++
= Eq. 2.8.3
In electrochemistry Markusse et al. (2001) proposed a kinetic model to describe the
kinetics of alpha-glucopyranoside based on the electro-potential of the catalyst:
+=
][*][2
][*][][ln
2 3
2
Ak
OkOk
F
RTE adsox Eq. 2.8.4
Where ][ adsO is the surface coverage of oxide (which causes deactivation) and [*] are the
concentration of available sites. Therefore, based on the pH, oxygen coverage, reactant
identity, different rate laws will describe more adequately different oxidation reactions
(Gallezot 1997).
Summary
In this chapter a review on the oxidation mechanism with noble metals was given
together with a physical and chemical description of the catalysts used. The deactivation
causes, solvent and temperature effects were also investigated. The mass transfer
explanation and the optimisation of stirred tanks were presented as well before examining
the kinetics of the oxidation mechanism. This chapter will serve as a foundation and
references for the following experimental and results chapters.

67
III) EXPERIMENTAL AND ANALYTICAL METHODS
This chapter describes the experimental setup used for the alcohol oxidation
investigation. Firstly, the materials used, the experimental rig and procedures are
described. Secondly, the analytical method used to quantify and identify samples taken
during a reaction is explained. Finally, the catalyst characterisation methods are detailed
where the results can be found in the corresponding chapters.
3.1) Chemicals, Gases and Catalysts
The subsequent commercial chemicals were used as received without further
purification: n-Heptane (99%, Acros), 1,4-Dioxane ( ≥ 99%, Acros), 2-Octanol (>97%,
Alfa Aesar), 1-Octanol (>98%, Alfa Aesar), p-Xylene ( 99%, Acros), 2-pentanol ( 99%,
Acros), DMSO (>99%, Fisher), Benzyl Alcohol (>99%, Acros) and Benzaldehyde
(>99%, Acros).

68
Air (>99.9%), 40% oxygen Enriched Air, hydrogen (>99.9%) and helium (>99.9%) were
all supplied by BOC Gases. Helium was further purified using a moisture, hydrocarbon
and oxygen trap when it was used as a carrier in the GC.
3.2) Experimental Setup
3.2.1) Baskerville Reactor
All reactions were performed in a Baskerville autoclave reactor except when the
experiments consist of analysing kinetic parameters where a smaller lab scale setup was
used to prevent any interference from mass transfer limitations. The Baskerville reactor
is a 500ml autoclave shaped cylindrically that is fitted in a heating coil. It is equipped
with 4 baffles, while the impeller and gas purging pipe can be unscrewed and changed to
alternative designs in order to study different hydrodynamic regimes. A 4 blade up-
pumping impeller and a 4 blade Rushton turbine were manufactured to study the effect of
different mixing patterns on the reaction rate and selectivity of the oxidation and are
illustrated in Figure 3.1).

69
Figure 3.1) Rushton Turbine and Pitched Blade Turbine. Impeller diameter of 4.0cm,
height of blades of 1.0cm and width of 1.5cm.
The temperature was monitored digitally with the help of a thermocouple inserted
into the solution through the reactor. As to the gas purging system, initially a simple pipe
was produced to bubble gas just under the impeller. Later, a disk shower head with 21
holes was manufactured as well to produce more bubble with smaller surface area in
order to increase gas-liquid mass transfer. The recommended disc sparger diameter is 0.8
times the impeller diameter which is 3.2 cm in this work with the holes equally spaced as
is illustrated in Figure 3.2).
Figure 3.2) Disc Sparger Design. φ Represent the radii; Dimensions are in millimetres;
21 holes present; Sparger thickness is 5mm.

70
The reactor vessel is illustrated in Figure 3.3). The maximum operating pressure
of the reactor is 150 bars while the maximum temperature is 623K. The reactor is also
equipped with a safety bursting disk that can withstand up to 20 bars at 393K. After each
experiment, the reactor is allowed to cool down to minimise the amount of vapour and is
then drained through a sieve to re-collect the catalyst while the liquid chemicals are
stored in waste drums prior to professional disposal.
Characteristics Dimensions (cm)
D 4.0
T 8.0
C 3.0
H 13.0
Figure 3.3) Reactor vessel and dimensions.

71
3.2.2) Experimental Procedure
All experiments were performed according to the following method. The liquid
solution (300 ml) was added into the reactor and heated to the suitable temperature. Once
the desired temperature was achieved, the catalyst was added before sealing the reactor
and pressurising the system. The reaction began when the stirring was applied and the
gas started to flow. GC analysis was performed before the stirring was applied to verify
whether there was any conversion in the absence of stirring to ensure that the method had
not caused pre-conversion of reactants prior to starting the stirrer. Since no conversion
whatsoever could be detected, it was safe to assume that there is no conversion until
stirring is applied. Table 3.1) illustrates the range of different variables tested for the
different catalysts studied.
Catalyst Substrates Solvents Pressure
Use of
Enriched
Air
Temperature
50%
w/w22OH
addition
effect
5%Pt-1%Bi
Benzyl
Alcohol,
1-Octanol,
2-Octanol
DMSO,
Heptane,
Dioxane,
p-Xylene
1-4 Bar No 323-353K No
2.5%Au-
2.5%Pd
Benzyl
Alcohol,
2-Octanol
Solvent
free 1-7 Bar Yes 343-393K No
5%CuO
5%AgO
5%Fe2O3
Benzyl
Alcohol,
1-Octanol,
2-Pentanol
Heptane,
Octane,
Decane
1-8 Bar No 303-430K Yes
Table 3.1) Parameters investigated and varied for different catalysts in the Baskerville
Reactor.

72
Figure 3.4) shows the flow diagram of the experimental unit used in this work. The gas
flow was measured using an Alltech Digital Flow Meter on the venting valve V2. The
work with the Pt-Bi/carbon and metal oxides catalysts (Chapter 4 and 7) was done using
the PBT-U and single orifice pipe for the gas sparging while the RT, PBT, single orifice
pipe and disc shower head were investigated for the Au-Pd/titania work (Chapter 5).
Before analysing the constituents of the reaction mixture in the reactor, 4ml of the
solution were flushed out to clean the sampling valve V1 from any earlier sample
contaminants and discarded. Then, 2.5ml are taken and filtered through single use
mµ7.0 Chromacol filters to remove any catalyst particle that could block the GC column
once the solution is injected into it.
Figure 3.4) Experimental setup. V1: Sampling valve; V2: Venting Valve; P: Pressure
Gauge with bursting valve.

73
3.2.3) Laboratory Scale Setup
The laboratory scale setup consists of a 100ml three necked round bottom flask on
a heating and stirring plate. A magnetic stirrer was inserted inside the flask to stir the
solution. A high efficiency Graham condenser was placed on the vertical opening of the
flask while a mercury thermometer and a plastic air pipe were installed on the remaining
openings. The air stream from a cylinder was controlled with the help of a flow meter to
200ml/min.
3.2.4) Laboratory Scale Procedure
The main use of a lab scale rig was to study kinetic parameters of oxidation
reactions with minimum interference of mass transfer limitations. Hence, all reactions
were performed at high stirring and high bubbling where any further increase of stirring
or air flow makes no difference to the reaction rate. This setup was mostly used for the
5%Pt-1%Bi catalyst where 30ml of solution was used with 0.15g of catalyst. This setup
is also useful to test different catalysts when their quantity is scarce.
3.3) Quantitative and Qualitative Analytical Methods
All samples taken from experiments were analysed using a Perkin-Elmer 8700
Gas Chromatography equipped with a Flame Ionization Detector (FID). The FID uses
hydrogen and air to partially burn the organic constituents that are carried by helium
through a retention column. This will produce ionic sub-compounds that are detectable

74
by the FID and the resulting signal is proportional to the quantity injected into the GC.
Known chemical standards can be injected in the GC to determine the corresponding
retention time, which allows the identification of the compounds from experimental
samples. Moreover, by injecting a substrate at different concentrations, a calibration plot
between the signal versus the substrate concentration can be established which permits
the quantifications of the substrate concentrations in the experimental samples. Hence,
by choosing appropriate conditions that allows different substrate to elute at different
times and by calibrating the GC, the qualitative and quantitative analysis of chemicals
can be established. In case peaks with different retention times than the standards appear
in the chromatogram, then these by-products are unknowns that can be identified using a
Mass Spectrometry.
The GC was equipped with a CP-Wax capillary column that is made from
polyethylene glycol. This very polar column would ensure that the apolar solvent would
elute first since the alcohol reactant and ketone products have polar affinities. The
following conditions were used to analyse different substances.

75
Parameters Octanol Benzyl Alcohol
Carrier Gas Helium Gases and Flow
rate Flow rate 35.0 ml/min
Temperature 523K Injector
Injection Volume 1.0 Lµ 0.1 Lµ
Temperature 523K Detector
Range 10
Equilibrium Time 1.0 min
Isothermal
temperature and
time
373K for 10min 403K for 9 min
Ramp Rate 10K/min 30K/min
2nd
Isothermal
temperature and
time
448K for 5 min 473K for 9 min
Oven Conditions
GC Column 50m x 0.32 mm (1.2 mµ ) CP-Wax 52B
Table 3.2) GC conditions for the analysis of octanol and benzyl alcohol oxidation.
3.4) Catalyst Characterisation
3.4.1) Chemisorption
The chemisorption technique uses the principle of molecular adsorption on
catalyst sites to retrieve information on metal dispersion, active surface area and size of

76
crystallites. The adsorption of a compound depends on the temperature, pressure, surface
energy distribution and the surface area. For instance, the Temperature Programmed
Reduction (TPR) consists of applying a temperature ramp under a flow of a reducing gas
such as hydrogen. The gas stream is analysed with a Temperature Conductor Detector
(TCD) which monitors the constituents of the stream. TPR allows the determination of
the temperature at which the solid reduces and the different oxidative states of the
catalyst. For example, an amorphous metal oxide might show different desorption peaks
under the TPR since different structural phases are reduced at different temperature. The
Temperature Programmed Oxidation (TPO) works in a similar manner although an
oxidative gas is used such as oxygen with helium. The TPO is very effective in
measuring the amount of carbon deposits or coking on a catalyst.
Pulse Chemisorption is used to determine the active surface area and percent
metal dispersion. This characterisation technique involves the purging, in known specific
doses or pulses, a binding or analytical gas onto a cleaned catalyst sample until the
surface is saturated and no more adsorption can occur. The gas flow is monitored by the
TCD and when few consecutive pulses contain the same amount of initially administrated
gas, the catalyst surface is said to be saturated, i.e. a monolayer is formed on the catalyst
surface. Usually the first few pulses show no or some analytical gas since most of it is
bonds on the metal. The active metal surface area can be determined from the amount of
gas adsorbed and from the molecular area of the adsorbed species. When the amount of
metal incorporated on a catalyst is known, the metal dispersion can then be determined
by the ratio of the number of active metal atoms to the total number of metal atoms in the

77
catalyst material. Figure 3.5) shows the Micromeritics Autochem II 2920 used for TPR
and Pulse Chemisorption in this work.
Figure 3.5) Micromeritics Autochem II 2920.
For the Pt-Bi catalyst, the analytical gas used was carbon monoxide which binds
associatively on platinum. The 1.27g sample catalyst was first purged with helium to
remove any adsorbate at 363K for 10 minutes. The temperature was then lowered to
315K and the pulsing of carbon monoxide in a helium carrier flow of 50ml/min started.
Figure 3.6) depicts the TCD response to successive and consistent in volume of carbon
monoxide pulses.

78
Time (minutes)
0 5 10 15 20
TC
D s
ign
al (a
rbitra
ry u
nits)
1.1
1.2
1.3
1.4
1.5
1.6
1.7
Figure 3.6) Pulse Chemisorption graph for the 5%Pt-1%Bi/Carbon.
The area of each peak can be integrated to determine the volume it represents.
The first dose is almost completely adsorbed on the catalyst. The following doses show
little and then no adsorption on the catalyst. Hence, the adsorbed volume on the catalyst
can be determined by subtracting the total amount of volume injected and the total
amount of volume detected. The data in Table 3.3) show the parameters used for the
evaluation of Pulse Chemisorption data.

79
Element
%
Sample
atomic
weight
Stochiometric
factor,
F
Atomic
cross-
sectional
area, cA
(nm²)
Atomic
weight
Cumulative
Volume,
sV (mL at
STP)
Temperature
(K)
Platinum 5.0 1.0 0.08 195.08 0.3837 315
Table 3.3) Pulse Chemisorption data.
With the use of the data in Table 3.3), the percent metal dispersion (%D), metallic surface
area and Active Particle Size can be determined from the following equations calculated
by the software of the Micromeritics Autochem II 2920.
Mmloading
FVDispersion s
××=
)(%22414% Eq. 3.4.1
Ac
s NFAm
VAreaSurfaceMetallic
=
22414
Eq. 3.4.2
=
cA AN
MDiameterParticleActive
ρ
6 or,
)/(%110 DDiameterParticleActive = for platinum (Farrauto and
Bartholemew 1988)
Eq. 3.4.3
The chemisorption is not recommended to be used for bimetallic catalyst samples
such as Au-Pd/Titania since different metals have different binding energies and
stochiometric factors for an analytical gas. However, for the Pt-Bi catalyst, the bismuth

80
does not bind to CO which allows the use of the Chemisorption technique (Hayden
1997).
3.4.2) X-Ray Diffraction (XRD)
The XRD is used to characterise the bulk of a crystal structure by diffraction of an
X-ray beam as a function of the angle of the incident beam. The atomic planes of a
crystal cause an incident beam of X-rays to be refracted at specific angles. This allows
the identification of the structure when compared to a database of XRD patterns and the
particle size from the width of the peaks. The XRD was performed in the Department of
Chemistry at the University of Birmingham using a Siemens D5005 diffractometer with a
monochromatic high intensity CuKα radiation with an angle varied between 10 and 140
degrees at a setting of 40kV and 40mA.
3.4.3) Scanning Electron Microscopy with Energy Dispersive X-ray (SEM-EDX)
The SEM focuses a scanning electron beam on a sample. The interaction between
the electron and the atoms results in different beam emissions. Backscattering and a
lower energy reflection allows the generation of a topographic image of the sample. The
EDX bombards the compound with X-ray exciting the atom which in return emits a
characteristic beam upon relaxation allowing its identification. The SEM-EDX was also
performed in the Department of Chemistry at the University of Birmingham using a
JEOL 1200CX2 with an accelerating voltage of 80keV.

81
IV) HETEROGENEOUS OXIDATION OF 2-OCTANOL ON
5%Pt-1%Bi/CARBON
The 5%Pt-1%Bi/Carbon catalyst for the selective oxidation of alcohols has been
intensely studied in the literature and is classified as one of the most efficient catalyst for
such processes (Mallat, Bodnar et al. 1995; Kluytmans, Markusse et al. 2000; Lee A, J.J
et al. 2000; Pinxt, Kuster et al. 2000). Conversely, limitations of this catalyst such as the
deactivation, low oxidation activity and apolar medium poisoning of the catalyst have
been reported by Keresszegi et al. (2004b) where they needed to work in a water-
surfactant system to be able to oxidize aliphatic alcohols especially 2-octanol. Dimitratos
et al. (2006) also reported a very low activity for the oxidation of octanol whether they
tried supported platinum, palladium or gold where the maximum conversion in an
organic solvent was 8% with 5% platinum. By working in an aqueous solvent they were
able to increase conversion up to 45% but at the expense of selectivity towards the ketone
since 34% of the products were carboxylic acids. This underlines the importance of
finding the appropriate reaction conditions to keep a good balance between conversion

82
and selectivity. Therefore the aim of the work presented in this chapter is to investigate
the reasons why this catalyst shows lower activity for 2-octanol oxidation compared with
other alcohols, such as benzyl alcohol, and try to improve the catalyst life-time by
preventing any deactivation.
An initial preliminary experiment was performed with a typical solvent such as
heptane to demonstrate the low conversion with the platinum catalyst. The cause was
then examined and a solution was investigated. The effect of various parameters such as
temperature, solvent choice, pressure, initial alcohol concentration and catalyst loading
were studied. A Langmuir-Hinshelwood model was investigated as well. The catalyst
was characterized using CO pulse chemisorption.
4.1. Oxidation of 2-Octanol on 5%Pt-1%Bi/carbon in heptane.
Results are first reported for the reference experiment in order to provide a
comparison with other data sets presented later in this chapter. The aim of the work was
to optimise the experimental conditions so as to improve conversion of 2-octanol and
yield of 2-octanone.

83
Time (hours)
0 1 2 3 4 5 6 7
Ke
ton
e C
oncen
tra
tio
n (
M)
0.00
0.02
0.04
0.06
0.08
0.10
0.12
Figure 4.1a) Reference reaction: conversion of 2-Octanol versus time. Reproduced 3
times. Reaction conditions: T=343.15 K; AirP =1 Bar; iC =0.248M; 3g cat;
rps=22.5 1−s ; Flow=0.680L/min.
By examining Figure 4.1a) it can be observed that there are two regimes during
the alcohol oxidation. The first regime, where the catalyst is very active and the
conversion reaches over 22% in 15 minutes and the second regime where the reaction
rate dramatically decreases afterwards. Hence one of the aims of this work is to
understand the reason why the reaction rates drops and if there can be a solution to keep
the catalyst active for a prolonged period. Extending the catalyst lifetime would be
essential for industrial production.

84
Time (hours)
0 2 4 6
Keto
ne
Co
nce
ntr
atio
n (
M)
0.00
0.02
0.04
0.06
0.08
0.10
0.12
Figure 4.1b) 2nd
Regime of the reference reaction- Reaction conditions: T=343.15 K;
AirP =1 Bar; iC =0.248M; 3g cat; rps=22.5 1−s Flow=0.680L/min.
Figure 4.1b) shows a straight line regressed to the data of the second rate regime.
From the slope of the line the reaction rate was calculated to be 0.0065M/hr. This value
is considerably lower than the initial reaction rate of 0.23M/hr corresponding to the initial
fifteen minutes of the first regime.
85
4.2 Deactivation Causes
In order to determine which of the plausible 3 main reasons of catalyst
deactivation, as described by Kluytmans et al. (2000), a series of testing experiments was
undertaken. Possible causes of deactivation are a) noble metal over-oxidation, b) metal
leaching/agglomeration and c) catalyst poisoning.
4.2.1) Noble metal over-oxidation
The investigation of the over-oxidation hypothesis consists of studying the effect
of the air flow and reactor pressure on the catalyst performance. By limiting the amount
of oxygen that can be adsorbed on the metal, the catalyst should last longer by avoiding
over-oxidation even if it is at the expense of a slower reaction rate. Therefore, air was
introduced to the reactor at atmospheric pressure and a flow of 500 ml/min for a duration
of 5 minutes at intervals of 30 minutes. Kluytmans et al (2000) used a related periodic
sparging method for his system for the oxidation of methyl-glucoside and were able to
regenerate the initial reaction rate since his catalyst was being over-oxidized.

86
Time (hours)
0 1 2 3 4 5 6
% C
on
ve
rsio
n
0
5
10
15
20
25
30
35
Figure 4.2) – Interrupted Flow: Conversion when purging air every 30 minutes for 5
minutes. Reaction conditions: T=343.15 K; AirP =1 Bar;
iC =0.248M; 3g cat;
rps=22.5 1−s
In this case, by interrupting the flow of air, the conversion appears to be slower
than the continuous air flow reaction of the reference reaction as can be seen in Figure
4.2) and after two hours starts trailing which is a sign of catalyst deactivation.
4.2.2) Noble metal leaching/agglomeration
Catalyst that has been previously used, recovered and recycled should show a
different behaviour to fresh catalyst if leaching or agglomeration of platinum particles
occurs during the reaction. Therefore, used catalyst was prepared for recycling by

87
washing with acetone before mixing in a 1 M NaOH alkaline solution at 333K. The
alkaline solution was replaced by water at the same temperature, and then hydrogen was
bubbled through the flask to reduce the catalyst (Mallat and Baiker 1994). The
conversion profile shows no difference compared with the one for a fresh catalyst which
suggests that platinum leaching/agglomeration does not occur during this reaction.
4.2.3) Catalyst poisoning
The final likely cause of deactivation is catalyst poisoning. This occurrence may
be due to strong adsorption of the reactant, product, an unwanted by-product or CO
(Bond 1962; Clark and Rhodes 2000). Since the selectivity of the studied reaction is
100% at the working conditions the most likely adsorbent is either the alcohol or the
ketone. The alcohol reacts on the surface of the catalyst to become a ketone which then
can slow the reaction rate by desorbing gradually. The most straight forward way to
verify that the ketone is in fact strongly adsorbing onto the catalyst is to immerse the
catalyst in ketone and then use it without washing in an experimental reaction. If the
conversion profile is still the same as the fresh catalyst this indicates that the ketone is not
deactivating the catalyst. Figure 4.3) shows the conversion profile when the catalyst has
first been immersed in ketone prior to the experiment.

88
Time (hours)
0 1 2 3 4 5 6 7
Ke
tone
Co
nce
ntr
atio
n (
M)
0.00
0.01
0.02
0.03
0.04
0.05
Figure 4.3) – Ketone Addition: Conversion when the catalyst is initially immersed for 15
minutes in 2-octanone. Reaction conditions: T=343.15 K; AirP =1 Bar;
iC =0.248M; 3g
cat; rps=22.5 1−s
Comparing to the reference reaction profile of Figure 4.1a), the reaction rate in
Figure 4.3) is a reasonably straight line passing though the origin which does not display
the two distinct regimes observed in the initial experiment. Moreover, the rate of
conversion is almost identical to that of the second regime of the reference reaction
profile. The observed reaction rate of 0.0062M/hr is similar to the second regime of the
reference reaction (0.0065M/hr). Therefore, it was deduced that the presence of, or more
precisely the slow rate of desorption of ketone from the catalyst surface is limiting the
rate of conversion. Conversely the surface reaction is relatively fast during the initial

89
stage of the reaction since there is little or no ketone present to occupy the active sites of
the catalyst as is demonstrated in Figure 4.1a). It is only when a significant amount of
ketone is formed that the reaction rate dramatically changes to become constant. This is
supported by the fact that when the catalyst was immersed in ketone its active sites
became saturated with 2-octanone and this eliminated the fast initial reaction since there
were no available active sites left for the alcohol to adsorb.
4.3 Measurement of quantity of adsorbed ketone.
Since 2-octanone is adsorbing onto the metal surface slowing the reaction rate it is
necessary to have an estimate of the amount required to saturate a given amount of
catalyst. Consequently, the evaluation of this value was performed in a lab scale setup.
4.3.1) Laboratory scale experimental setup
The lab scale setup consists of a 100ml three-necked round bottom flask
positioned in contact with a heating and stirring plate. A magnetic stirrer was inserted
inside the flask to stir the solution. A high efficiency Graham condenser was placed on
the vertical opening of the flask while a mercury thermometer and a plastic air pipe were
installed on the remaining openings. The air stream from a cylinder was controlled by a
flow meter at a set-point of 200ml/min.

90
4.3.2) Octanone adsorption quantification
2-octanone was added every 10 minutes to a solution of 30mL of heptane and
0.3g of catalyst before a sample was taken for analysis in the lab scale experiment. The
quantity of ketone on the catalyst surface was calculated from the difference between the
known added amount of ketone and the concentration in the solution.
Concentration of ketone in solution (M)
0.00 0.02 0.04 0.06 0.08 0.10 0.12
Co
nce
ntr
atio
n o
f ke
ton
e a
dso
rbed
(M
)
0.00
0.01
0.02
0.03
0.04
0.05
0.06
0.07
y = 0.7x
R2 = 0.9836
Figure 4.4) Saturation amount of ketone adsorbed on Pt-Bi/Carbon. Reaction
conditions: T=343.15 K; AirP =1 Bar; iC =0.248M; 0.3g cat.
Figure 4.4) shows that the catalyst can adsorb a maximum ketone amount of
0.006moles/gram of catalyst. This result is surprising since it means that there is more
ketone adsorbed than there is metal in the catalyst ( 41038.1 −× moles/gram), which may

91
suggest the ketone is adsorbed on the carbon support as well or that many layers are
forming on the metal. The slope represents the adsorption constant, K4, before saturation.
After samples are taken from the autoclave reactions, the concentrations of ketone
and alcohol left in the solution were compared with the initial concentration added to the
experiment. The difference in concentration from the mass balance gave the
concentration of alcohol and ketone adsorbed on the catalyst surface. Different catalyst
loadings were tested to validate the proportionality between the quantity of adsorbed 2-
octanone and amount of catalyst. Figures 4.5a-c) show the ketone concentration in
solution and adsorbed on the catalyst for different catalyst loadings.
Time (hours)
0 1 2 3 4 5 6 7
Ke
ton
e C
once
ntr
atio
n (
M)
0.00
0.01
0.02
0.03
0.04
0.05
0.06
Su
bstr
ate
ad
sorb
ed (
mo
les)
0.00
0.01
0.02
0.03
0.04
0.05
0.06
Ketone Concentration
Substrate Adsorbed
Figure 4.5a) 1.5g Pt-Bi/Carbon Reaction conditions: T=343.15 K; AirP =1 Bar;
iC =0.248M; 3g cat; rps=22.5 1−s Flow=0.680L/min; solution volume=300mL

92
Time (hours)
0 1 2 3 4 5 6 7
Ke
ton
e C
once
ntr
atio
n (
M)
0.00
0.02
0.04
0.06
0.08
0.10
Su
bstr
ate
ad
sorb
ed (
mo
les)
0.00
0.02
0.04
0.06
0.08
0.10
Ketone Concentration
Substrate Adsorbed
Figure 4.5b) 3.0g Pt-Bi/Carbon

93
Time (hours)
0 1 2 3 4 5 6
Ke
ton
e C
once
ntr
atio
n (
M)
0.00
0.02
0.04
0.06
0.08
0.10
0.12
0.14
0.16
Su
bstr
ate
Adso
rbed
(m
ole
s)
0.00
0.02
0.04
0.06
0.08
0.10
0.12
0.14
0.16
Ketone Concentration
Substrate Adsorbed
Figure 4.5 c) 6.0g Pt-Bi/Carbon
Figures 4.5a-c) Adsorption on different catalyst loading. Reaction conditions: T=343.15
K; AirP =1 Bar; iC =0.248M; 3g cat; rps=22.5 1−s Flow=0.680L/min; solution
volume=300mL
From the above figures it can be noticed that the reaction is very active at the
beginning of the experiment where product adsorption is still low. As the catalyst
loading is doubled, the amount of product adsorbed on the catalyst is doubled as well.
Although increasing the quantity of catalyst appears to increase the conversion to ketone,
the quantity adsorbed on the catalyst also increases. This would require the catalyst to be
washed after the reaction and the collection of product adsorbed making the use of the
catalyst uneconomical. It should be stressed that the amount adsorbed corresponds to this

94
specific batch of catalyst and depends on the method of preparation, water content, metal
dispersion etc. Therefore each catalyst batch will adsorb a different amount of substrate.
In order to evaluate the role of the support, a 5%Pt-1%Bi/Al2O3 was also tried with
similar conditions as the one used in Figure 4.1a). Like with the carbon support, a
deactivation was manifested after 15 minutes which eliminates the support effects in this
case. Hence, a solvent was sought with a greater solubility of 2-octanone to reduce the
amount of ketone adsorption upon the catalyst surface, which will enhance the ketone
desorption and readily generate more available active sites.
4.4 Solvent effects
The aim of the work became focussed on finding a suitable solvent in which the
ketone would be more soluble to allow a better desorption and a longer activity of the
catalyst. The solvents that were considered beside heptane are p-xylene, DMSO and
dioxane since they do not have a C=O group that would bind to platinum nor OH groups
that can be oxidised and have an appropriate boiling point and vary in polarity.
4.4.1) DMSO
DMSO is very polar and has a higher dipole moment than water. However, the
conversion was negligible even after 6 hours of reaction since the reactant did not adsorb
on the surface making this solvent inappropriate. When the catalyst was added to this
solvent it bonds strongly to it (Zelenay and Sobkowski 1984). DMSO binds even more

95
than the ketone on the catalyst given that when a lab scale reaction similar to the one
shown in Figure 4.4) was performed and ketone is added and measured in the solution
there was no ketone adsorption whatsoever on the catalyst.
4.4.2) P-xylene
The reaction profiles still showed two distinctive reaction regimes where the first
one corresponds to 17% conversion after 15 minutes and then the reaction slows down
abruptly and becomes constant as is shown in Table 4.1). Replacing heptane with p-
xylene that contains a conjugated ring did in fact decrease the performance of the reaction
without eliminating the ketone desorption effect. The lower reaction rate might be due to
the lower oxygen solubility in p-xylene (Battino, Rettich et al. 1983).
4.4.3) Dioxane
Oxygen has a very low solubility in dioxane (Battino, Rettich et al. 1983). This
can partly explain why the oxidation of 2-octanol is slow in it. Another reason is that the
ketone was not removed from the catalyst surface since the slower reaction rate of the
second regime corresponding to ketone adsorption was exhibited as well.

96
Solvent
)10( 4
2
−×O fraction
solubility
at 298Ka
Dielectric
Constant
at 298K
Dipole
moment
at 298K
(D)
Initial
reaction
rate
(M/hr)
Comments
DMSO 1.5 47.2 3.96 0.005
-No substrate
adsorption
P-Xylene 9.2 2.2 0.0 0.18 -Substrate adsorbs
Heptane 22 1.9 0.0 0.23 -Substrate adsorbs
Dioxane 5.3 2.2 0.45 0.027 -Substrate adsorbs
Table 4.1 – Solvent characteristics and effects on initial reaction rates. a Battino, R et al.
(1983). Reaction conditions: T=343.15 K; AirP =1 Bar; iC =0.248M; 3g cat;
rps=22.5 1−s Flow=0.680L/min.
4.4.4) Dioxane/heptane
The reactions carried out in DMSO, p-xylene and dioxane show that neither polar
nor non-polar solvents were able to remove effectively the substrates from the catalyst
surface. 2-Octanone has a long carbon chain giving it a lipophilic character but at the
same time the C=O bond exhibits polar properties responsible for the bonding to the
metal. Therefore different mixtures of dioxane and heptane were tried as solvents
(Korovchenko, Donze et al. 2007). Donze et al (2007) found that changing the solvent
made it possible to tune the product distribution and modify the rate of reaction of benzyl
alcohol oxidation using dioxane and dioxane/water mixtures.

97
% v/v Dioxane
0 20 40 60 80 100
2-o
cta
none a
dsorp
tion c
oeffecie
nt (1
/(m
ol.L))
0.3
0.4
0.5
0.6
0.7
0.8
Reaction r
ate
after
15 m
inute
s (
M/h
r)
0.01
0.02
0.03
0.04
0.05
0.06
0.07
0.08
K4 adsorption coefficient
Reaction rate
Figure 4.6) Effects of solvent composition upon reaction rate and ketone adsorption
coefficient. Reaction conditions: T=343.15 K; AirP =1 Bar; iC =0.248M; 0.3g cat.
Figure 4.6) shows that the reaction rate passes through a maximum at 16-18% v/v
dioxane. This corresponds to a minimum in the adsorption coefficient of ketone, K4,
which can be calculated from the slope in a similar way to that in Figure 4.4) before
saturation of the catalyst. The maximum reaction rate occurs when the lowest amount of
ketone is adsorbed on the surface of the catalyst, such that the catalyst surface can allow
adsorption of octanol reactant. However it should be stressed that the oxygen solubility
will also change with the different dioxane concentration and that also affects the reaction
rate. On the other hand, the change in oxygen solubility cannot explain the difference in
reaction rates throughout the different solvent compositions, since a change of pressure

98
has no similar impact as will be discussed later in Section 4.7. This shows how the
solvent can affect the reaction in different ways other than the gaseous reactant solubility
in it but also by the interaction with the liquid reactant and product. Bond (1962) also
suggested that there is an inverse relationship between catalytic activity and the bonding
strength of the reactants.
Time (hours)
0 2 4 6 8 10
% c
on
ve
rsio
n
0
20
40
60
80
100
Heptane solvent
18%dioxane in heptane
Figure 4.7) Conversion of 2-octanol in heptane and in dioxane-heptane mixture.
Reaction conditions: T=343.15 K; AirP =1 Bar; iC =0.248M; rps=22.5 1−s
Referring to Figure 4.7), the initial lower conversion rate of the solvent mixture
can be explained by the lower adsorption coefficient of the substrate on the catalyst due
to its better solubility in the solvent mixture. But since the product adsorbs less strongly

99
in the dioxane/heptane mixture on the catalyst, the rate of conversion does not slow down
contrary to what happens in the heptane solvent. Hardacre et al. (2005) found that the
use of an ionic liquid organic solvent such as 1-butyl-3-methyl-imidazolium bis-
(trifluoromethylsulphonyl) imide for the oxidation of cinnamyl alcohol decreases the
activity compared to toluene although the selectivity increases. The oxidation had a
lower activity rate in the ionic organic solvent which explains why the selectivity was
higher than in toluene since an oxidized molecule did not undergo further oxidation. This
is an example of how the selectivity (or catalyst longevity in this work) can be enhanced
whilst decreasing the initial reaction rate.
Heptane 18% v/v Dioxane-Heptane
Initial reaction
rate
(M/hr)
Reaction rate
after 15 min
(M/hr)
Initial reaction
rate
(M/hr)
Reaction rate
after 15 min
(M/hr)
2-Octanol 0.23 0.0062 0.07 0.07
1-Octanol 0.25 0.0065 0.08 0.08
Benzyl alcohol*
1.0 1.0 0.8 0.8
Table 4.2) Solvent effects on initial rate for different alcohols. Reaction conditions:
T=343.15 K; AirP =1 Bar; rps=22.5 1−s ; 3g catalyst; iC =0.248M; * Solvent free.
Table 4.2) shows the effects of using 18% v/v dioxane-heptane mixture on the
oxidation of different substrates. While the use of a mixed dioxane/heptane solvent
improves the oxidation of aliphatic primary and secondary alcohols it decreases the
reaction rate of benzyl alcohol oxidation. Benzyl alcohol did not adsorb strongly onto the
Reactant
Solvent

100
catalyst hence decreasing the rate of reactant adsorption will not increase the reaction
rate.
4.5 Internal Mass Transfer
For an efficient use of a catalyst particle, the reactant would diffuse throughout
the particle since the fraction of active sites on the external surface is negligible
(Kapteijn, Marin et al. 1999). In order to determine whether the reaction is limited by
internal mass transfer the Wagner-Weisz-Wheeler modulus WM was calculated since it
depends on experimental observables and was assumed to be first order since Weisz and
Prater (1954) confirmed that deviation from first order kinetics will have negligible
effects on the criterion.
eff
AV
WD
CrLM
exp2)/(−
= (Levenspiel 1999) Eq. 4.5.1
Where L is the characteristic size of a catalyst particle equal to 3
R for spheres.
Vr is the
observed reaction rate per unit of volume of catalyst particles, AC is the initial
concentration of reactants and effD is the effective diffusivity defined as:
P
ABP
eff
DD
τ
ε= where
KmAB DDD
111+=

101
and Pε is the porosity of the catalyst, Pτ is the tortuosity, mD is the molecular diffusivity
and KD is the Knudsen diffusivity. The Knudsen diffusivity is only applicable to gases
(Satterfield 1991) and here it assumed that the reacting oxygen is in soluble form
therefore ABD = mD . The effective diffusivity is calculated with the average values of
porosity and tortuosity of 0.4 and 4 respectively (Winterbottom and King 1999) and gave
a value of 81061.1 −× m2/s for oxygen and 91033.1 −× m
2/s for 2-octanol at 343K. This
gives a WM value of 31063.8 −× and 41077.2 −× for oxygen and 2-octanol respectively.
Both these values are much lower than 0.15 which is the Weisz-Prater (Levenspiel 1999)
criterion for a diffusion free regime. Hence it can be deduced that the reaction happens
throughout the catalyst particle. A sample calculation can be found in Appendix B.
4.6 Temperature effects and Arrhenius plot
Increasing temperature usually increases the activity of the catalyst at the expense
of selectivity while carrying out the reaction at room temperature may cause catalyst
poisoning by substrate adsorption (Mallat and Baiker 1994). Therefore it is not the best
way to optimise conversion. In the case of oxidation of a secondary alcohol such as 2-
octanol, the formation of another by-product is unlikely since further oxidation would
require breaking C-C bonds. Nonetheless the investigation of the activation energy was
performed over the temperature range from 323K to 353K at atmospheric pressure and

102
0.248M initial alcohol concentration. Initially the reaction rate proceeds according to a
pseudo-first order which allows the determination of the activation energy through the
Arrhenius plot.
1/T (K-1
)
0.00280 0.00285 0.00290 0.00295 0.00300 0.00305 0.00310 0.00315
ln R
i (M
/s)
-11.0
-10.8
-10.6
-10.4
-10.2
-10.0
-9.8
-9.6
-9.4
-9.2
-9.0
Figure 4.8) Arrhenius Plot for the determination of the activation energy. Reaction
conditions: AirP =1 Bar;
iC =0.248M; rps=22.5 1−s ; 3g cat
The apparent activation energy is deduced from the slope of Figure 4.8) where the
best fit straight line representsR
Ea−. Hence the activation energy
aE is equal to -
49.8 1. −molkJ . Since in the previous section the internal mass transfer was calculated to
be negligible then the observed activation energy is the true activation energy (Fogler
2001; Nijhuis, Dautzenberg et al. 2003). A low activation energy value means the

103
system is under mass transfer limitation and a high one means the reaction is performed
in the kinetic regime and is very sensitive to the temperature.
4.7 Effect of pressure
The effects of oxygen pressure on the catalyst deactivation and the reaction have
been extensively studied in the literature (Mallat and Baiker 1994; Kluytmans, Markusse
et al. 2000; Keresszegi, Bürgi et al. 2002; Gangwal, Schaaf et al. 2004). Chemisorbed
oxygen can further react on the surface of the catalyst to form an oxide that corrodes the
metal and hence deactivates it. The alcohol, being a weak reducing agent, cannot remove
the oxide from the metal which decreases the activity of the catalyst. The efficiency of
the catalyst can be regained with a stream of hydrogen for example. Since in this work
the deactivation of the catalyst is being investigated due to product adsorption, the
experiments were completed at low oxygen pressure to eliminate any over-oxidation
possibility that would mask the product adsorption effects.

104
Time (hours)
0 2 4 6 8 10
% c
on
vers
ion
0
20
40
60
80
100
1 bar of air
1 bar Interrupted flow
2 bars of air
3 bars of air
4 bars of air
Figure 4.9) Pressure Effect. Reaction mixture conditions: T=343.15 K; iC =0.248M;
rps=22.5 1−s ; 3g cat
From Figure 4.9) it is apparent that an increase in air pressure reduces the
conversion from the maximum value obtained at atmospheric pressure. These
observations have been witnessed by many researchers including Gallezot (1997) and
Gangwa et al. (2004). At higher oxygen pressure the catalyst tends to become over-
oxidised meaning that the oxygen occupies active sites preventing the adsorption of
liquid reactant. The rate of oxygen coverage of the metal surface will be faster than the
rate of oxygen consumption. One way to demonstrate the over-oxidation effect is to plot
the conversion with the amount of product adsorbed on the catalyst.
Figure 4.10) shows the production of ketone under 4 bar of air pressure, where the
final concentration of ketone after 5 hours is 0.035M. Comparing with Figure 4.5b),

105
under the same conditions except 1 bar of air pressure, after 5 hours the ketone
concentration is 0.085M. Clearly increasing the pressure leads to a decrease of
conversion of ketone.
Time (hours)
0 1 2 3 4 5 6
Co
nce
ntr
atio
n (
M)
0.00
0.01
0.02
0.03
0.04
Su
bstr
ate
Adso
rbed
(m
ole
s)
0.00
0.01
0.02
0.03
0.04
Ketone concentration in solution
Substrate adsorbed
Figure 4.10) Conversion at 4 bars air pressure. Reaction mixture conditions: T=343.15
K; AirP =4 Bar; iC =0.248M; rps=22.5 1−s ; 3g cat.
A possible explanation is that the increase in oxygen pressure may have increased the
oxygen concentration in the solution, therefore blocking active sites which explains the
low concentration of adsorbed ketone. On the other hand when the air flow is interrupted
the conversion also decreases given that not enough oxygen is present on the catalyst
surface to oxidise the reactant as was observed also by Gallezot (1997). These results

106
suggest that there is an optimum range of oxygen concentration at which to carry out the
reaction, ensuring sufficient oxygen needed by the reaction whilst preventing over-
oxidation from occurring. All further experiments were carried out at atmospheric
conditions as this gave the best conversion.
4.8 Measurement of Mass Transfer Coefficients
Because two reactants, oxygen and 2-octanol, are involved in the production of 2-
octanone, either of these reagents could limit the rate of diffusion to the active sites.
While the concentration of alcohol is much higher than oxygen, it is still essential to
calculate the solid-liquid mass transfer coefficient SLk for both reactants to determine
which resistance is limiting the reaction. The measurements of the different resistances
cr rr , andbr which correspond to the internal reaction, solid-liquid and gas-liquid
respectively can be determined experimentally by plotting the inverse of the reaction rate
versus the inverse of the catalyst loading.

107
1/w (dm3/g)
0.04 0.06 0.08 0.10 0.12 0.14 0.16 0.18 0.20 0.22
Ci/R
i (s
)
0
100
200
300
400
y = 951.94x + 160.76
R2 = 0.9951
Figure 4.11) Solid-Liquid and Gas-Liquid mass transfer resistances for Oxygen.
Reaction mixture conditions: T=343.15 K; AirP =1 Bar; rps=22.5 1−s
Based on the theory presented in section 2.6) the following resistances were deduced
from the intercept and slope of Figure 4.11):
76.1601
===bGL
bak
rIntercept s
386.95111
dmgskak
rrSlopePSL
rc =+=+=η
It can be seen from Figure 4.11) that the intercept has a relatively large value, which
indicates significant gas-liquid mass transfer limitation.

108
4.8.1) Solid-Liquid Mass Transfer
The solid-liquid mass transfer coefficient SLk for dissolved oxygen and 2-octanol
was calculated using the following correlations in Table 4.3):
Correlation Author
SLk for
dissolved2O
(m/s)
3/15.0Re60.02 ScSh += (Fogler 2001) 31065.1 −×
3/152.0Re52.02 ScSh += (Armenante and Kirwan 1989) 31056.1 −×
3/14/1Re4.02 ScSh += (Kluytmans, Markusse et al.
2000)
31057.1 −×
( ) 47.0
15.1
31019.1−−
×= Sc
N
Nk
sg
SL
(Kushalkar and Pangarkar
1994)
41022.7 −×
Table 4.3) Estimated liquid solid mass transfer coefficients over the Pt-Bi catalyst at
343K using different correlations.
The semi-empirical equation proposed by Kushalkar and Pangarkar (1994) was used in
the rest of the chapter since it takes into effect the presence of gas bubbling and therefore,
offers a more realistic value to the experimental setup used in this work. Consequently
rr can be determined as well from the slope of Figure 4.10) and the limiting resistance
for the oxidation reaction can be established. A sample calculation can be found in
Appendix A.

109
SLk for
dissolved2O
(m/s)
SLk for 2-
octanol
(m/s)
Pa
( kgm /2 )
PSL
cak
r1
=
dissolved 2O
( 3/. mskgcat )
krr
η
1=
dissolved 2O
( 3/. mskgcat )
bGL
bak
r1
=
(s)
41022.7 −× 41035.1 −× 28.98 26.18 86.937 76.160
Table 4.4) Estimated mass transfer resistances over the Pt-Bi catalyst at 343K and
atmospheric pressure from Figure 4.10) and Table 4.3).
From Table 4.4) it is observed that oxygen and octanol have similar values for the solid-
liquid transport coefficient. However the bulk concentration of those two components in
the solution is very different. While the initial concentration of alcohol is 0.248M the
calculated oxygen concentration is much less as calculated below.
4.8.2) Determination of Mass Transfer Coefficients
It is very difficult to estimate the oxygen solubility in a mixed organic solvent.
Even commercial oxygen probes are usually only suitable for water at low temperature.
Consequently the maximum oxygen solubility was determined by assuming that the two
solvents do not affect each other. Therefore based on the mole fraction of each solvent
an average oxygen concentration equal to 3108.2 −× M was be calculated using the
correlations by Battino et al. (1983) for each solvent. Thus it can be understood that the
transport of oxygen limits the reaction rate since its concentration is much lower than the
concentration of alcohol.

110
Oxygen has to diffuse through the gas film and into the bulk liquid where it has to be
transported to the catalyst walls and then diffuse internally and react on the catalyst.
These steps are described in Fogler (2001) in 5 points:
I. Oxygen dissolves from the gas phase into the liquid phase.
II. Transport from the gas-liquid surface into the bulk of solution.
III. Diffusion from the liquid bulk towards the catalyst surface.
IV. Diffusion internally in the pores of the catalyst.
V. Reaction on the catalyst.
From Figure 4.11) it is observed that the resistance from gas to liquid is
considerable and is decreasing the oxygen concentration in the liquid bulk. bGLak has a
value of 131022.6 −−× s determined experimentally from the intercept of Figure 4.10).
However Kawase et al. (1997) developed a semi-empirical correlation to evaluate bGLak
in three phase stirred tanks taking into effect the presence of solid particles.
( )
25.02/1
5/3)1(2/1
)1(10/)49(5/3
/
−
+
++
′=
w
a
t
g
n
l
nn
l
ABbGLU
U
KDCak
µ
µ
σρ
ερ Eq. 4.8.1
Using this correlation the resistance to gas absorption was found to be 131013.8 −−× s
which is of similar order of magnitude to the experimentally derived value.

111
The difference between the experimental value and the semi-empirical calculation may
be due to the approximate estimations used in the calculation of bubble size ba , bubble
free rise velocity tU and the dissipation energyε .
The gas absorbance can be increased by increasing the stirring rate or by
installing a gas sparger that would decrease the bubble size and hence increase the bubble
surface area. On the other hand in order to eliminate the possibilities of having over-
oxidation that would mask the solvent effects, the system was kept under gas-liquid mass
transfer limited regime. Hardacre et al. (2005) also worked in the mass transfer limited
regimes in order to improve the selectivity by preventing the cinnamyl alcohol from
being re-oxidised again. Therefore, reaching a kinetic regime in a reaction is not always
an advantage. For that reason, assuming that the gas-liquid interface at the bubble
surface is saturated with oxygen ( iC ), the concentration in the liquid phase ( BC )
following the mass transfer limitation would be equal to:
BB
A
iBak
RCC −=
AR being the initial reaction rate of an experiment. Assuming that the equilibrium
oxygen concentration iC is 3108.2 −× M for a reaction at 343K and 0.248M of alcohol the
oxygen concentration in the liquid bulk BC will be 31003.1 −× M, which is considerably
lower than the concentration at the gas-liquid interface.
In steps II) and III) the transport from the exterior bubble surface to the catalyst
surface PSLak depends on the concentration of the reactant, the particle surface area and

112
the stirring rate. In order to determine whether the liquid-solid mass transfer is limiting
the reaction the concentration of oxygen on the catalyst surface has to be compared to the
one in the bulk solution.
mak
RCC
PSL
A
BS −=
Assuming the oxygen concentration in the liquid bulk BC at 343K and 0.248M alcohol
concentration is 31003.1 −× M the calculated concentration on the catalyst surface SC is
31000.1 −× M. This means that the liquid-solid mass transfer is negligible and that the
concentration of oxygen on the catalyst surface is almost equal to the value in the bulk
solution.
Referring to steps IV) and V), the internal diffusion has already been determined
to be negligible from the Weisz-Prater criterion. Therefore the reaction happens
throughout the catalyst particle. Although from Table 4.3) it seems that rr is very large
hence, step V) which is the resistance to reaction is a limiting step and it can be overcome
by increasing the temperature (as can be seen from Figure 4.8), the amount of catalyst (as
can be seen from Figure 4.11) and reactant concentration (as can be seen from Figure
4.12).
In conclusion, it appears that gas-liquid resistance is significant; however, a
further increase in oxygen concentration decreases the reaction rate since oxygen binds
strongly to the metal occupying active sites as is shown in Figure 4.9). It is therefore
advantageous to work in such a regime as proposed also by Keresszegi et al. (2004b).

113
4.9 Langmuir-Hinshelwood Kinetic Model
The Langmuir-Hinshelwood (L-H) mechanism is one of the most commonly used
models to describe heterogeneous catalysis since it takes into accounts the phenomenon
of substrate/product adsorption and desorption. This is strongly exhibited in this study by
witnessing how the ketone adsorption limits the reaction and how by decreasing the
adsorption coefficient of ketone over the catalyst the reaction rate increases. Hence the
L-H approach is followed here in order to model the reaction.
For the oxidation of alcohol over noble metals the details of the mechanism are still
debated (Mallat and Baiker 1994; Gallezot 1997) but a general agreement exists on the
following oxidative dehydrogenation mechanism assuming the oxygen dissociates on the
metal (Schuurman, Kuster et al. 1992; Keresszegi, Ferri et al. 2005):
I) A + * →← 1K A*
II) O2 + 2* →← 2K 2O*
III) O* + A* → 3k P* + * + H2O
IV) P* →← 4/1 K P + *
Where A is the alcohol substrate, P is the ketone product and * denotes an active site on
the catalyst. 111 / −= kkK , 222 / −= kkK , 444 / −= kkK , are the equilibrium constants for the
forward and reverse reactions of step I), II) and IV) respectively. Step III) is irreversible
with 3k as the rate constant.

114
While it was calculated that there was a significant transport limitation of oxygen to the
catalyst, the reaction rate can be increased by changing the initial concentration of 2-
octanol. Shuurman (1992) found that for the oxidation of glucoside on Pt/C, the reaction
rate increases with an increase of glucoside concentration until a certain saturation value
where the rate is not affected by further alcohol addition. By increasing the concentration
of the alcohol reactant the active sites will be replenished more readily with this reactant
hence a faster reaction rate. This allows the dependence of the reaction rate on the initial
alcohol concentration to be determined.
Six likely mechanisms were considered and studied in Table 4.5). Models A) and
B) are based on the model proposed by Shuurman (1992) and assume that the reaction is
surface controlled and the oxygen dissociates on the metal surface, although in A) ketone
is still assumed to adsorb noticeably on the metal while in B) there is no significant
ketone adsorption. Models C) and D) presume that it is respectively the alcohol and the
oxygen adsorption that controls the reaction while the surface reaction is fast. While
model E) supposes that the reaction is surface controlled but that the oxygen adsorbs as a
diatom on a single site without dissociation. Model F) considers that ketone desorption
limits the reaction rate since this is what happens when the solvent is heptane. Finally
model G) is based on Van den Tillaart et al. (1994), where they assume that the alcohol
adsorbs dissociatively and oxygen chemisorbs irreversibly.
In order to determine which of the plausible Langmuir-Hinshelwood mechanisms
describes best the catalysis, the “solver” function in Excel was used to estimate the
kinetic parameters such as K1, K2 and k3. After introducing the different model equations

115
found in Table 4.5), alcohol concentrations ranging from 0.078M to 0.276M and initial
reaction rates where mass transfer limitations can be neglected, the “solver” function
determines the best fit kinetic parameters. Then the Matlab software was used to
incorporate the calculated mass transfer effects on the oxygen concentration and to plot
different mechanistic models versus the experimental values as can be seen in Figure
4.12). The detailed Matlab script which takes the mass transfer coefficients in
consideration can be found in Appendix C.

116
Model
L-H Equation 1K
2K
3k
4K *
( M ) Assumptions
A) 2
4
5.0
221
5.0
2213
)][
])[(][1(
])[]([
K
POKAK
OKAKkR
+++
= 0.005
(1−
M )
42.26
(1−
M )
0.1
(11.. −− sgM )
0.36
� Surface Reaction controls
� Product adsorbs
� Atomic oxygen adsorption
B) 25.0
221
5.0
2213
)])[(][1(
])[]([
OKAK
OKAKkR
++=
0.005
(1−
M )
42.26
(1−M )
0.1
(11.. −− sgM )
__
� Surface Reaction controls
� No product adsorption
� Atomic oxygen adsorption
C)
5.0
22
4
1
])[(][
1
][
OKK
P
AkR
++
= 0.000473
(11. −− sg )
42.26
(1−M )
__ 0.36
� Alcohol adsorption controls
� Very fast reaction
� Atomic oxygen adsorption
D)
][][
1
])[(
1
4
5.0
22
AKK
P
OkR
++
= 2.09724
(1−
M )
-0.3
(11. −− sg )
__ 0.36
� Oxygen adsorption controls
� Very fast reaction
� Atomic oxygen adsorption
E)
3
4
221
22
2
13
)][
][][1(2
][])[(
K
POKAK
OKAKkR
+++
= 1.825039
(1−
M )
42.26
(1−
M )
0.09
(11.. −− sgM )
0.36
� Surface Reaction controls
� Product adsorbs
� Diatomic oxygen adsorption
F)
2
4
5.0
221
5.0
22143
)][
])[(][1(
])[]([
K
POKAK
OKAKKkR
+++
= 0.005
(1−M )
42.26
(1−M )
0.1
(11. −− sg )
0.36
� Product desorption controls
� Fast reaction
� Atomic oxygen adsorption
G)
2
1
13
22
22
)][2][
][21(
][2
AKAKk
Ok
OkR
++
= 0.092
(1−
M )
42.26
(11. −− sg )
0.09
__
� Alcohol adsorbs
dissociatively
� Oxygen adsorbs irreversibly
� Surface reaction controls
Table 4.5) Proposed models with estimated kinetic parameters and assumptions. * Determined experimentally. Reaction mixture
conditions: T=343.15 K; AirP =1 Bar; rps=22.5 1−s

117
Time (s)
0 5000 10000 15000 20000 25000
Alc
oh
ol C
on
ce
ntr
atio
n (
M)
0.00
0.05
0.10
0.15
0.20
0.25Model A
Model B
Model C
Model E
Model F
Model G
Experiment
Figure 4.12) Models versus experimental data. Reaction mixture conditions: T=343.15
K; AirP =1 Bar;
iC =0.248M; rps=22.5 1−s ; 3g cat
Considering Model E), oxygen adsorbs diatomically occupying only one catalyst
site per molecule which generates more available free sites for alcohol adsorption.
Hence, the reaction rate becomes much faster as can be seen in Figure 4.12). Since the
experimental reaction rate is much slower, model E can be discarded. This has also been
suggested by Lewis and Gomer (1968) who proposed that oxygen occupies two active
sites when chemisorbed on platinum.
Model D) gives a negative 2K which is mathematically incorrect and this
disqualifies the model. From the experimental point of view, an increase in oxygen

118
pressure does not increase the reaction rate as can be seen from Figure 4.8) where it
actually decreases with a pressure increase. Therefore, oxygen adsorption is not the rate
limiting step in this case.
An attempt was made to experimentally measure the adsorption coefficient of 2-
octanol on the catalyst but it was unsuccessful. There was always some conversion to
ketone that has a different adsorption coefficient compared with alcohol. This effect
therefore masks the true value of1K , given that ketone will be adsorbed as well on the
catalyst. The same problem occurs even after reducing the catalyst to eliminate any
adsorbed oxygen on it and after running the experiment under a nitrogen atmosphere.
Keresszegi et al. (2002) found that cinnamyl alcohol will still be oxidized even under
argon atmosphere with a palladium catalyst. However if the reaction was controlled by
the alcohol adsorption than an increase in temperature should decrease the reaction rate
by preventing even more the alcohol from adsorbing on the surface (Atkins 2002). Yet
with an increase in temperature the reaction rate is clearly increasing as can be seen on
Figure 4.7). From the modelling point of view, model C) does not fit the experimental
data as well. Hence the reaction is not controlled by alcohol adsorption and this model
can be discarded.
Model F) assumes that the reaction is controlled by the ketone desorption. Thus
when the ketone is produced it has to desorb from the surface to generate free sites. As
can be seen from Figure 4.3) when an initial amount of ketone is added to the catalyst
with only heptane as solvent before an experiment, the reaction rate becomes constant

119
and equal to the ketone desorption rate since the surface reaction is very fast compared to
it. The reaction rate is then controlled by the rate of ketone desorption. However with
the solvent mixture of dioxane-heptane an initial addition of ketone on the catalyst does
not render the reaction rate constant as can be seen on Figure 4.13) although the
conversion is definitely lower than without the initial presence of ketone. So if it was the
ketone desorption that controls the reaction then the reaction rate should be a straight line
like in Figure 4.3) when ketone is added. Moreover, model F) gives a much slower
conversion compared to the experimental values which further devalues it.
Model G) proposed by Van den et al. (1994), considers that the alcohol adsorbs
by forming an alkoxide and hydrogen on the catalyst surface using two similar active
sites. However, the model shows a very fast reaction rate since oxygen is adsorbed
irreversibly, contrary to the experimental data, hence disproving it.
Model A) assumes that the reaction is surface controlled and that the ketone still
adsorbs on the catalyst while Model B) assumes that the reaction is surface controlled
without any ketone adsorption on active sites. It can be established that model A) is more
likely since the addition of ketone initially does decrease the reaction rate as can be seen
from Figure 4.13). The F-value and T-value statistical parameters for Model A are less
than the critical values in Table 4.6) which give a 95% confidence in the data presented.
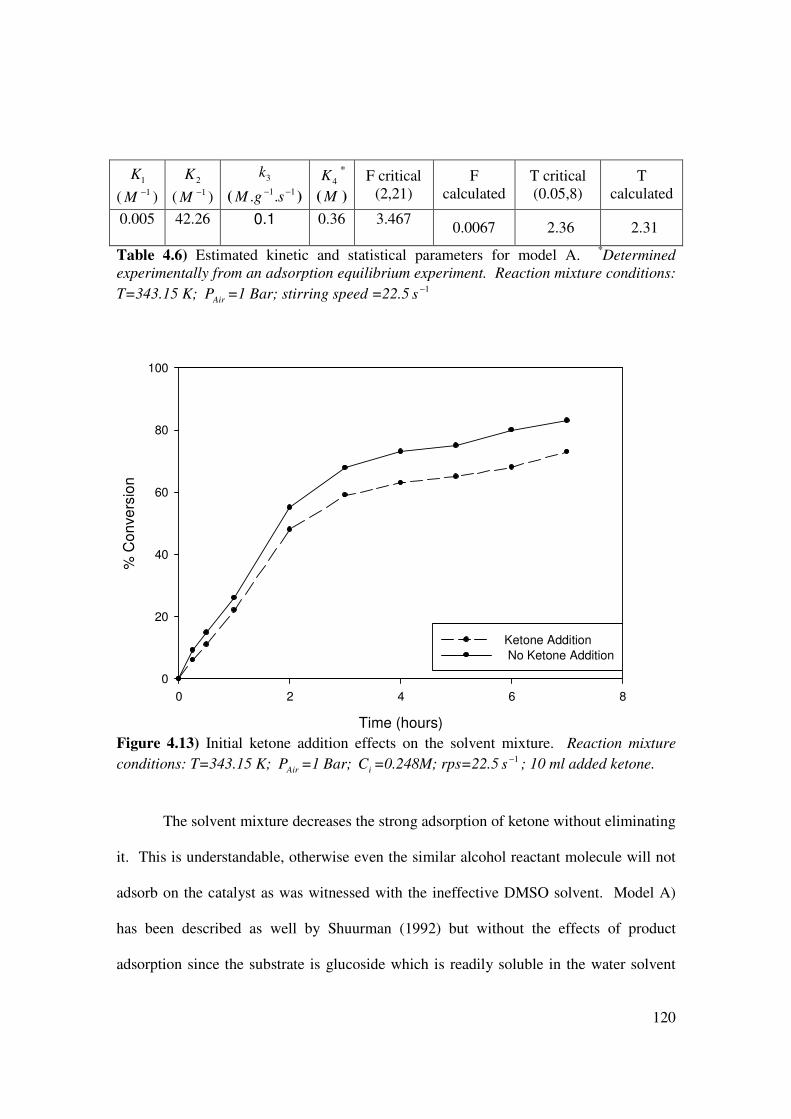
120
1K
( 1−M )
2K
( 1−M )
3k
( 11.. −− sgM ) 4K
*
( M )
F critical
(2,21)
F
calculated
T critical
(0.05,8)
T
calculated
0.005 42.26 0.1 0.36 3.467 0.0067 2.36 2.31
Table 4.6) Estimated kinetic and statistical parameters for model A. *Determined
experimentally from an adsorption equilibrium experiment. Reaction mixture conditions:
T=343.15 K; AirP =1 Bar; stirring speed =22.5 1−s
Time (hours)
0 2 4 6 8
% C
on
ve
rsio
n
0
20
40
60
80
100
Ketone Addition
No Ketone Addition
Figure 4.13) Initial ketone addition effects on the solvent mixture. Reaction mixture
conditions: T=343.15 K; AirP =1 Bar; iC =0.248M; rps=22.5 1−s ; 10 ml added ketone.
The solvent mixture decreases the strong adsorption of ketone without eliminating
it. This is understandable, otherwise even the similar alcohol reactant molecule will not
adsorb on the catalyst as was witnessed with the ineffective DMSO solvent. Model A)
has been described as well by Shuurman (1992) but without the effects of product
adsorption since the substrate is glucoside which is readily soluble in the water solvent

121
used. Figure 4.14) compares the experimental data with Model A) for a different initial
alcohol concentration which further validates Model A).
Time (s)
0 5000 10000 15000 20000 25000
Alc
oh
ol C
on
cen
tratio
n (
M)
0.00
0.02
0.04
0.06
0.08
0.10
0.12
0.14
0.16
0.18
Model A
Experimental
Figure 4.14) Model A at a different concentration. Reaction mixture conditions:
T=343.15 K; AirP =1 Bar;
iC =0.164M; rps=22.5 1−s
4.10 Catalyst pre-treatment and recycling.
A desired characteristic in any commercial catalyst is the ability to re-use it
without any activity loss. When the catalyst was washed with acetone and water after a
reaction and then dried at 333 K overnight it showed a lower activity then the fresh

122
catalyst. Besson and Gallezot (2003) suggested cleaning the catalyst in basic medium to
remove adsorbed by-products, while Gangwal et al. (2002) suggested that strongly
chemisorbed oxygen can be removed by introducing a strong reducing agent to the
catalyst medium. This might be explained by the fact that acetone/water is able to
remove only some of the adsorbed organic products but is not able to eliminate strongly
chemisorbed oxygen and organic by-products which occupy active sites from the metal
surface. In the first procedure, in order to remove any remaining adsorbed organics the
catalyst was immersed in a 2M NaOH heated aqueous solution and was stirred for 2
hours.
The best way to eliminate the oxygen is to reduce the catalyst. On the other hand
extra care should be given for the reduction of this catalyst since it has a carbon support
that can be flammable in the presence of hydrogen and even explosive if it is immersed in
an organic solvent. Therefore the used catalyst was reduced in water after the initial
washing at 333 K for 2 hours at 3 bar of hydrogen since the latter has a low solubility in
water. The subsequent procedure restored the initial activity of the catalyst. Furthermore
the pre-treatment of the catalyst before a reaction was investigated as well. Two cases
were studied: inert treatment (used as received) and reduced catalyst before reaction. For
this catalyst, an initial reduction step before reaction did not change the conversion
outcome which means that the catalyst was not in an oxidised form and that the catalyst
batch was a fresh one as can be seen in Table 4.6).

123
Initial Reaction Rate
1st Cleaning step
(Acetone/water wash and
drying)
2nd
Cleaning step
(Alkali solution wash and
reduction by hydrogen)
First Run 0.23M/hr 0.23M/hr
2nd
Run 0.085M/hr 0.22M/hr
3rd run _ 0.23M/hr
Table 4.7) Initial reaction rates after cleaning the catalyst. Reaction conditions:
T=343.15 K; AirP =1 Bar; iC =0.248M; 3g cat; rps=22.5 1−s Flow=0.680L/min.
4.11 Catalyst characterisation using CO Pulse Chemisorption
5%Pt-1%Bi/Carbon can be characterised using CO chemisorption which consists
of introducing a pattern of known amount of carbon monoxide onto the catalyst after
purging it with argon or helium to remove any adsorbed species. The CO will strongly
adsorb on the platinum surface occupying a single active site per molecule. The
remaining CO amount can be quantified with a TCD detector after passing through the
catalyst bed. Usually the first pulse will be completely adsorbed by the catalyst
depending on the metal loading and the TCD will detect the second CO pulse pattern.
When CO is no longer adsorbed by the catalyst (saturation level) the chemisorption stops
and the adsorbed amount can be quantified to give the metal surface area, metal
dispersion and the active particle diameter. The relatively small dispersion of platinum

124
shown in Table 4.8) means that a small portion of the metal was available as an active
oxidation surface. However, small dispersion limits the over-oxidation of products and
hence maintains the selectivity.
Metal
Dispersion:
Metallic
Surface Area
Active Particle
Diameter
6.0% 0.75 m²/g 18nm
Table 4.8) Catalyst characterisation using CO chemisorption
Summary
The oxidation of 2-octanol has been reported to be difficult to oxidise by the
literature (Anderson, Griffin et al. 2003; Keresszegi, Grunwaldt et al. 2004). Here it has
been shown that the activity can be enhanced by decreasing the adsorption coefficient of
the product on the catalyst using a 16-18% v/v dioxane in heptane mixture. This novel
way of tackling chemical poisoning will maintain the desired reaction rate while in
common solvents such as heptane, the product will adsorb strongly on the catalyst
preventing the regeneration of active sites. In order to prevent over-oxidation
consequences the catalysis was performed at low pressure and under some gas-liquid
mass transfer effects. Mass transfer coefficients have been determined experimentally
and empirically using the appropriate correlations for the system used. A Langmuir-
Hinshelwood mechanism based on Schuurman et al. (1992) describes adequately the
reaction profile.

125
V) SELECTIVE OXIDATION OF BENZYL ALCOHOL ON
2.5%Au-2.5%Pd/TITANIA
While gold and palladium catalysts have been extensively studied for the
oxidation of alcohols (Schwank 1985; Tsujino, Ohigashi et al. 1992; Kimura, Kimura et
al. 1993; Bronnimann, Bodnar et al. 1994; Bamwenda, Tsubota et al. 1997; Bond 2000;
Hongli, Qinghong et al. 2005; Hughes, Xu et al. 2005; Abad, Corma et al. 2008), the use
of bimetallic gold-palladium is a relatively recent approach towards selective
heterogeneous oxidation (Hutchings and Haruta 2005). It is crucial to investigate the
mechanism and optimise the reaction conditions to maximise production of
benzaldehyde. This would be necessary in order to commercialise this novel catalyst.
Benzyl alcohol (BnOH) is a very reactive alcohol and has many reaction pathways which
make it ideal for the selectivity study with the Au-Pd/titania catalyst (Enache, Edwards et
al. 2006). Whilst the oxidation of BnOH with this bimetallic catalyst has been reported
in the literature, the need to further explore the selectivity and optimal conditions has

126
been raised to better understand the chemical and physical properties of the Au-Pd/titania
catalyst (Enache, Edwards et al. 2006; Enache, Barker et al. 2007).
Initially, preliminary experiments were conducted with a fresh batch of catalyst
for the BnOH oxidation as reference reactions. Then the selectivity and mechanism were
studied by changing engineering parameters such as the reactor design, impeller stirring
speed, system pressure and the catalyst pre-treatment. The activation energy and mass
transfer coefficients are then evaluated before attempting to model simplistically the
kinetics of the reaction. Finally, the catalyst is characterised using SEM-EDX and XRD.
5.1) Initial oxidation of BnOH with Au-Pd/Titania
The Au-Pd/Titania catalyst was first tested “as received” to evaluate its activity
and selectivity in the BnOH oxidation and the results are shown in Figure 5.1).

127
Time (hours)
0 1 2 3 4 5 6
% C
onvers
ion
0
20
40
60
80
100
% S
ele
ctivity
70
75
80
85
90
95
100
Conversion
Selectivity
Figure 5.1) BnOH oxidation with untreated catalyst. Reaction conditions: T=363.15 K;
Flow= 550ml/min; AirP =6 Bar; 300ml BnOH solvent-free; rps=15.0 1−s
It can be seen from Figure 5.1) that using fresh catalyst gives a low benzaldehyde
production. The only other by-product that reduced the selectivity was toluene where the
possible reaction mechanisms are discussed in section 2.2.1.1). This result might suggest
that the catalyst was in an oxidised state or that it was covered with impurities such as
water or oxides, hence some of the active sites were unavailable for the adsorption of
BnOH. In order to validate this supposition, a Temperature Programmed Reduction
(TPR) was performed on the fresh catalyst.

128
Temperature (K)
250 300 350 400 450 500 550 600 650
TC
D (
arb
itra
ry u
nits)
-0.52
-0.51
-0.50
-0.49
-0.48
-0.47
-0.46
-0.45
-0.44
Figure 5.2) TPR of Au-Pd/Titania catalyst. 10%H2/Argon flow=50ml/min; 5K/min up to
620K.
Figure 5.2) shows a strong desorption peak at 380K which demonstrates the reduction of
the catalyst. The catalyst also changed colour from dark red to grey which further
suggests that the catalyst was in an oxidised state prior to carrying out the experiment.
5.2) Selectivity and Mechanism Investigation
In order to avoid the problem of using an oxidised catalyst, a fresh batch was
reduced in the stirred tank using isopropanol as solvent under 2 bar of hydrogen at room

129
temperature while stirring at 20.0s-1
. The catalyst was then dried and tested for the
BnOH oxidation. Figure 5.3) shows the conversion of BnOH and product selectivity
with reduced catalyst.
Time (hours)
0 1 2 3 4 5 6
% C
onvers
ion
0
20
40
60
80
100
% S
ele
ctivity
0
20
40
60
80
100
Conversion
Selectivity
Figure 5.3) BnOH oxidation with reduced catalyst. Reproduced 3 times. Reaction
conditions: T=363.15 K; Flow= 550ml/min; AirP =4 Bar; 300ml BnOH solvent-free;
rps=15.0 1−s
Comparing Figure 5.3) with Figure 5.1), it can be seen that reducing the catalyst
considerably increases the conversion and therefore the production of benzaldehyde
(BnO) and toluene. An initial reduction step has been reported to remove sub-surface
oxygen from the catalyst surface freeing the active sites especially when catalysts have
been stored for a long period prior to use (Gangwal, van der Schaaf et al. 2005).
However, while the reaction rate increases considerably compared to the use of the

130
catalyst with inert treatment, the selectivity towards BnO decreased to 70% with the
reduced catalyst. Enache et al. (2006) reported that a higher oxygen pressure increases
the selectivity towards BnO. However, their work was done in 40ml of solution without
gas sparging, where the inlet of the oxygen stream was open but not the outlet retaining
the total pressure constant. Therefore, in order to further understand the effects of scale
up with this catalyst for commercial purposes, a series of engineering factors were
investigated. Parameters such as air pressure, stirring speed, and reactor design were
studied to try to improve and investigate the mass transfer of oxygen to the catalyst
surface.
5.2.1) Pressure Effects
The effect of pressure on selectivity has been studied in the range of 1-6 bar of
air.

131
Time (hours)
0 2 4 6 8
% C
onvers
ion
0
20
40
60
80
100
% S
ele
ctivity
0
20
40
60
80
100
Conversion at 6 Bar
Conversion at 4 Bar
Conversion at 1 Bar
Selectivity at 6 Bar
Selectivity at 4 Bar
Selectivity at 1 Bar
Figure 5.4) BnOH oxidation with reduced catalyst at different air pressures. Reaction
conditions: T=363.15 K; Flow= 550ml/min; AirP =1-6 Bar; 300ml BnOH solvent-free;
rps=15.0 1−s .
As can be seen from Figure 5.4), conversion is virtually unaffected by changes in air
pressure, while the selectivity increases until a certain level. The conversion is similar at
1 and 6 bar of air. This result suggests that the reaction is zero order in oxygen but the
reaction path, or selectivity, is affected by the oxygen concentration. These results
support theories from the literature, where Enache et al. (2006) and Prati et al. (2007b)
suggested that the selectivity is dependant on the oxygen concentration but not the
reaction rate. However, Enache et al. (2006) used pure oxygen and the pressure was
varied from 1 to 10 bar while in the current work, air (five times less oxygen) was used

132
from 1 to 6 bar. This might explain why they witnessed different by-products, such as
esters and carboxylic acids, since their production requires another stochiometric mole of
oxygen (Figure 2.2). Figure 5.4) also demonstrates that the selectivity reaches a
maximum of 78% at 6 bar of air after 4 hours of reaction. This might imply that the mass
transfer from gas to liquid might be inefficient, preventing a fast transfer of oxygen to the
catalyst which enhances the production of BnO. One way of enhancing the oxygen
transport is to increase the stirring speed of the impeller which should increase the gas
bubbles surface area (Nienow 1998; Kresta, Edward PL et al. 2004).
5.2.2) Stirring Effects
The stirring speed effect on the selectivity was investigated by increasing it from
9 to 20 rps with the PBT-U.

133
% Conversion
0 10 20 30 40 50 60 70
% S
ele
ctivity
40
50
60
70
80
90
100
20.0 rps
15.0 rps
9 .0 rps
Figure 5.5) BnOH oxidation with reduced catalyst at different stirring speeds. Reaction
conditions: T=363.15 K; Flow= 550ml/min; AirP =6 bar air; 300ml BnOH solvent-free
Figure 5.5) is a plot of the selectivity versus the conversion. This plot illustrates
how the product distribution evolves with the course of the reaction, noting that in this
case conversion is not significantly influenced by the stirring speed. Selectivity clearly
increases with stirring speed, up to a maximum of 83%, since a higher impeller rotation
increases the number of bubbles and the bubble surface area, ba (Kresta, Edward PL et al.
2004). Given that the yield of BnO is dependant on the transport of oxygen to the
catalyst, the reactor configuration had to be optimised to improve the mass transfer
coefficients.

134
5.2.3) Reactor Optimisation
All previous experiments were performed with a PBT-U having the gas sparged
underneath the impeller with a single orifice pipe. One way to increase the gas/liquid
interface is to place a disc shower sparger which produces smaller bubbles at the same
gas flow. Since the gas-liquid mass transfer coefficient is proportional to the energy
dissipated into the vessel (Kawase, K; et al. 1997), a Rushton turbine which has a higher
power number should be used (Zhou and Kresta 1996). The energy dissipated can be
calculated via Eq. 2.5.1.2.3. using the same impeller dimensions and stirring speed, the
energy dissipated with the PBT-U is 32 /47.3 sm while the energy dissipated from the
Rushton turbine is 32 /02.12 sm . The disc sparger diameter designed to improve gas
bubbles dispersion was selected to be 0.8 times the impeller diameter, having a sparger
diameter of 3.2 cm in this work with 21 holes equally spaced as can be seen in Figure
3.2). Figure 5.6) shows the differences between the previous reactor and the optimised
reactor.

135
Figure 5.6) A) Before optimisation. B) After optimisation. Tank diameter T=8cm;
Impeller Diameter D=4cm; Baffle width =1cm; Clearage C=3cm; Height H=13cm.
Using configuration B) from Figure 5.6), the oxidation of BnOH was carried out and the
results are shown in Figure 5.7).

136
Time (hours)
0 2 4 6 8
% C
on
ve
rsio
n
0
20
40
60
80
100
% S
ele
ctivity
0
20
40
60
80
100
Conversion with Configuration A
Conversion with Configuration B
Selectivity with Configuration A
Selectivity with Configuration B
Figure 5.7) Oxidation with the different reactor configuration Reaction conditions:
T=363.15 K; Flow= 550ml/min; AirP =6 bar air; 300ml BnOH solvent-free;
rps=20.0 1−s .
From Figure 5.7), it can be deduced that while the conversion is unaffected, the
selectivity increases by ~5% up to 88%. Although this increment is relatively low, the
means of obtaining it are straightforward and on a high scale production could make a
significant economical difference.
5.2.4) Mechanism Investigation
Investigation of the reaction mechanism of BnOH oxidation to gain an
understanding of how the products and by-products are formed may allow for

137
optimisation of reaction conditions to further increase selectivity. Keresszegi et al.
(2005), Enache et al. (2006) and Enache et al. (2007) have suggested that toluene might
be produced during the BnOH oxidation with Au-Pd/titania due to either a hydrogenation
from adsorbed hydrogen or an oxygen loss process from the reactant as can be seen in
Figure 2.2). In order to determine the precise mechanism a series of experiments was
carried out. The hydrogenation of BnOH with the Au-Pd/titania catalyst was carried out
to investigate the origins of toluene production. Indeed, the hydrogenation of BnOH to
toluene showed that the reaction rate is significant as can be seen from Figure 5.8)
Time (hours)
0 2 4 6 8
% C
on
vers
ion
0
10
20
30
40
50
60
1 bar hydrogen
5 bars hydrogen
Figure 5.8) Hydrogenation of BnOH. Reaction conditions: T=363.15 K; Flow=
550ml/min; 300ml BnOH solvent-free; rps=20.0 1−s .

138
Figure 5.8) shows that toluene can be formed by hydrogenation of BnOH using the Au-
Pd/titania catalyst. Therefore, if hydrogen is causing the formation of toluene then it
must come from the dehydrogenation of BnOH. In order to verify this proposition,
BnOH was oxidised anaerobically in the presence of Au-Pd/titania. Pure nitrogen was
bubbled into the benzyl alcohol prior to using it as a reactant in order to remove any
dissolved oxygen before it was added to the reactor, along with the catalyst, under a
nitrogen atmosphere.
Time (hours)
0 1 2 3 4 5 6
Co
ncen
tratio
n (
M)
0.00
0.05
0.10
0.15
0.20
0.25
Benzaldehyde
Toluene
Figure 5.9) Anaerobic oxidation of BnOH. Reaction conditions: T=363.15 K; 300ml
BnOH solvent-free; rps=20.0 1−s ; 1 bar N2.

139
Figure 5.9) clearly demonstrates that under an inert atmosphere, benzaldehyde
and toluene are produced in equal amounts. It can be deduced from Figures 5.8) and 5.9)
that the oxidation of BnOH may occur via the formation of two metal hydrides M-H
which can either be oxidised by supplied oxygen or used to hydrogenate a BnOH
molecule, producing toluene and water. Since the anaerobic reaction is very slow, the
adsorbed hydrogen is readily removed by oxygen to form water, rather than undergoing a
hydrogenation reaction with BnOH in aerobic conditions. These results explain why the
selectivity is sensitive to oxygen concentration and mass transfer coefficients, as was
previously established. Moreover, the hydrogenation of BnO was carried out to
investigate if the reaction is reversible.
Time (hours)
0 2 4 6 8
% C
onvers
ion
0
5
10
15
20
25
30
35
Figure 5.10) BnO hydrogenation. Reaction conditions: T=363.15 K; Flow= 550ml/min;
300ml BnOH; 12
=HP bar; rps=20.0

140
Figure 5.10) shows the hydrogenation of BnO under 1 bar of hydrogen. It can be noted
that the reaction is slower than the hydrogenation of BnOH under similar conditions.
Therefore the oxidation of BnOH is reversible using the bimetallic catalyst. From the
previous data and conclusions the following mechanism can be established:
*2*2)
**)
2
1
2
22
OOII
OHCHOHCHI
K
K
→←+
−→←+− ϕϕ
*3*2*)
*3*2*)
232
2
5
4
++−→+−
+→+
OHCHHOHCHV
OHHOIV
k
k
ϕϕ
The presence of water in the solution has no effects since an initial addition of
15ml of water to the reaction does not affect the reaction rate or the selectivity. The
observation that the BnOH conversion rate is independent of the oxygen concentration
yet the reaction can yield toluene or BnO means that both their production rates must be
similar. The need to reduce the catalyst before its use seems contradictory to obtaining a
high selectivity since palladium can adsorb a large amount of hydrogen which can react
with the BnOH to form toluene at the very start of the reaction. Therefore, a pre-
treatment step may be needed to remove as much hydrogen as possible from the catalyst
surface before using it, without oxidising the noble metals. Heating the catalyst to
remove hydrogen requires high temperatures which may not be suitable since sintering of
the metal particles occurs.

141
5.2.5) Catalyst pre-treatment
An efficient way to remove adsorbed hydrogen without oxidising the catalysts
consists of carrying out a hydrogenation reaction. Therefore, 1-pentyne was chosen as a
hydrogen acceptor since it is easily hydrogenated (Jackson, Hamilton et al. 2001;
Hamilton, Jackson et al. 2002; Teschner, Vass et al. 2006; Jackson and Monaghan 2007).
The pre-treatment step consists of a reaction between the reduced catalyst with a
concentrated solution of pentyne anaerobically. Subsequently, reduced catalyst batches
of 10g were immersed in a 3M solution of 1-pentyne in heptane at room temperature and
a stirring speed of 16 s-1
for 6 hours under a nitrogen atmosphere. Regrettably, the
amount of hydrogen adsorbed on the catalyst could not be determined since the catalyst
has only 5% metal loading and it is mostly the palladium that absorbs hydrogen.
Therefore, the amount of pentene and pentane formed could not be analysed
quantitatively using GC since the amount of hydrogen adsorbed per gram of catalyst is
very low. The catalyst is then washed with acetone and dried overnight at 313K.

142
Time (hours)
0 2 4 6 8 10
% C
onvers
ion
0
20
40
60
80
100
% S
ele
ctivity
0
20
40
60
80
100
Conversion at 6 Bar
Conversion at 7 Bar ENR-Air
Selectivity at 6 Bar
Selectivity at 7 Bar ENR-Air
Figure 5.11) BnOH oxidation with treated catalyst. Reaction conditions: T=363.15 K;
Flow= 550ml/min; ENR-Air=40% O2 Enriched Air; 300ml BnOH solvent-free;
rps=20.0 1−s .
Figure 5.11) shows the oxidation of BnOH with catalyst pre-used for the
hydrogenation of pentyne. The selectivity increases considerably, from 84% to 93%
compared to Figure 5.7), without a change in the conversion after 7 hours of reaction.
Enache et al. (2007) obtained a similar selectivity, however their system required the use
of 2 bar of pure oxygen. When using a similar oxygen partial pressure as used in this
work, 1.2 bar, their selectivity was around 80%. This aspect is especially important in
industry for safety purposes and to avoid any hazard associated with the use of pure
oxygen. Therefore, by treating the catalyst to a pentyne hydrogenation, it becomes

143
possible to attain the same selectivity without the use of a high oxygen partial pressure.
A likely explanation for the increase in selectivity is the deposition of carbon from the
pentyne onto the catalyst as can be seen in Figure 5.17) which reduced the amounts of
active sites responsible for the toluene production and hence increased considerably the
selectivity.
An additional increase in oxygen pressure, by using enriched air for instance, did
not further increase the selectivity. It can be deduced that with this reactor configuration
and at 6 bar of air, the selectivity becomes independent of the oxygen concentration.
Therefore, the initial production of toluene seems to be an inevitable primary by-product
as suggested by Enache et al. (2007). Since the oxidation is being carried in solvent free
conditions where the catalyst is immersed in the BnOH reactant, the hydrogenation of the
latter seems unavoidable by the stripped hydrogen from BnOH oxidation. Moreover, the
initial pentyne hydrogenation to strip as much hydrogen from the reduced catalyst as
possible does not necessarily remove all of the adsorbed hydrogen from the catalyst
surface. However, the production of toluene is negligible and suggestions on ways to
further eliminate it are presented in the Future Recommendation section in Chapter 8.
Hence, by applying an optimum reactor configuration and by pre-treating the catalyst it
becomes possible to considerably increase the selectivity and activity of the Au-Pd/titania
catalyst for the oxidation of alcohols.
5.3) Temperature effects
It was demonstrated previously that the selectivity of the BnOH reaction is
dependant on the oxygen concentration. Therefore, an increase in temperature should

144
decrease the oxygen solubility and, hence, the selectivity as well. Also, the rate constant
5k in step V) from Section 5.2.4) of the mechanism will increase with temperature,
significantly increasing the formation of side products.
% Conversion
0 20 40 60 80 100
% S
ele
ctivity
50
60
70
80
90
100
363K
383K
393K
Figure 5.12) Selectivity towards BnO versus conversion at different temperatures.
Reaction conditions: Flow= 550ml/min; AirP =6 Bar; 300ml BnOH solvent-free;
rps=20.0 1−s .
Figure 5.12) shows how the selectivity decreases with temperature, but increases with
conversion at constant conversion. Even though the conversion is faster at higher
temperatures, the toluene production also increases at higher temperatures. Therefore,
the optimum temperature for a high selectivity and conversion seems to be 363K. The

145
investigation of the activation energy was performed over the temperature range from
343K to 393K at 6 bar pressure. Initially, the reaction rate proceeds linearly which
allows the determination of the activation energy through an Arrhenius plot.
1/T (K-1
)
0.0025 0.0026 0.0027 0.0028 0.0029 0.0030
lnR
i(M
/s)
-12
-10
-8
-6
-4
Figure 5.13) Arrhenius Plot for the determination of the activation energy. Reaction
conditions: AirP =6 Bar; rps=20.0 1−s .
The apparent activation energy is deduced from the slope of Figure 5.13) where
the line of best fit representsR
Ea−. The activation energy
aE is equal to -44.6 1. −molkJ .
This experimental value seems very similar to the reported activation energy by Enache
et al. (2006) of 45.8 1. −molkJ .

146
5.4) Measurement of Mass Transfer Coefficients
The mass transfer coefficients can be determined by plotting w
vsR
C
i
i 1. in a similar
way to Figure 2.10) using a calculated saturation oxygen concentration at the gas-liquid
film of 31010.7 −× M (Golovanov and Zhenodarova 2005).
1/w (l/g)
0.0 0.1 0.2 0.3 0.4 0.5 0.6 0.7
Ci/R
i (s)
0
20
40
60
80
100
y = 128.65x + 0.7308
R2 = 0.9952
Figure 5.14) Solid-Liquid and Gas Liquid mass transfer resistances for Oxygen.
Reaction mixture conditions: T=363.15 K; AirP =6 Bar; rps=20.0 1−s
From Figure 5.14) the gas-liquid and liquid-solid mass transfer internal resistances can be
determined by the following equations:

147
7308.01
===bGL
bak
rIntercept s: Resistance to gas absorption
365.12811
dmgskak
rrSlopePSL
rc =+=+=η
: Resistance to liquid-solid mass transfer
and internal diffusion with surface reaction respectively.
It seems from Figure 5.14) that the resistance to gas absorption is negligible. This
is further validated when the pressure is varied without any effect on the reaction rate as
Figure 5.5) shows. Enache et al. (2006) and Prati et al. (2007a) also suggested that the
pressure of oxygen does not influence the reaction rate. Therefore, it can be deduced that
the rate of oxygen transport, both external and internal, does not limit the reaction rate.
Moreover, the catalyst is immersed in the solvent-free BnOH reactant and hence the
reaction cannot be limited by the transport of BnOH. The reaction is occurring in the
kinetic regime and is not limited by mass transfer. Hence, the resistance represented by
the slope only represents the surface reaction;
3/.65.128
111dmsgcat
kkakSlope
PSL
==+=η
. Hence the value of k is
1133 ..107.7 −−−× gcatsdm

148
5.5) Kinetic Evaluation
The air pressure variation and the optimisation of gas-liquid mass transfer
affected the selectivity but not the reaction rate, which means that the oxidation of BnOH
is zero order in oxygen, as was previously demonstrated. Also from Figure 5.11), it is
apparent that the reaction rate starts to decrease after 50% conversion. This might be due
to either the reversible reaction of the BnOH oxidation or the decreasing alcohol
concentration. From Figure 5.8) and 5.10), under the same conditions, it appears that the
BnOH hydrogenation is more thermodynamically favourable than the BnO
hydrogenation. Therefore, it can be assumed from Figure 5.15) that the reverse reaction
or BnO hydrogenation will produce less BnOH than the amount of toluene produced
during the oxidation of BnOH.

149
Time (hours)
0 2 4 6 8 10
Con
cen
tra
tio
n(M
)
0
1
2
3
4
5
6
7
Aldehyde
Toluene
Figure 5.15) BnOH oxidation with treated catalyst. Reaction conditions: T=363.15 K;
Flow= 550ml/min; AirP =6 Bar; 300ml BnOH solvent-free; rps=20.0 1−s .
Hence, the reverse of step III) can be neglected in the modelling of the BnOH
oxidation kinetics. The remaining explanation for the decrease in activity after ~50%
conversion might be a change in the reaction order. The reaction starts in zero order
oxygen and BnOH since in solvent-free conditions the active sites are saturated with
reactants, but after the conversion and dilution of the alcohol the reaction rate becomes
dependant on the concentration of the latter. One way to determine the kinetic
dependency on the BnOH concentration is to plot the initial reaction rate with different
starting concentrations of alcohol, as shown in Figure 5.16).

150
ln Ci (M)
-1 0 1 2 3
ln R
i (M
/h)
-3
-2
-1
0
First order in BnOH
Zero order in BnOH
Reaction rate when in first order in alcohol
Order transition in BnOH
y = 1.17x - 1.83
R2 = 0.9787
Figure 5.16) Initial reaction rate at different BnOH starting concentrations. Reaction
conditions: T=363.15 K; Flow= 550ml/min; 1.5gcat; AirP =6 Bar.
Figure 5.16) shows that the oxidation of BnOH is first order with respect to alcohol when
its concentration is below ~32% of the solution. At concentrations higher than ~63% the
reaction is zero order in BnOH and oxygen. A zero reaction order at high concentration
has also been reported by Schuurman et al. (1992) for the oxidation of glucoside.
Between 30% and 60%, the reaction order in BnOH seems to be decreasing as the
reaction rate becomes increasingly independent of the alcohol concentration. Opre et al.
(2005) reported as well a first order in BnOH at low concentration and zero order at
higher concentrations for the reaction rate with a ruthenium based catalyst. Also, from

151
Figures 5.16), 1
3 16.0 −= hk and at high concentrations when the reaction is zero order,
the reaction rate is 1
3 .22.1 −= hMK ,
BnOH
BnOHBnOH
XKR
XCkR
<=
<<=
6.0~;
3.0~0;
3
3
Finally, the catalyst was characterized after being reduced and deprived of hydrogen by a
pentyne hydrogenation.
5.6) Catalyst Characterisation
The catalyst was analysed using SEM-EDX to visualise the particles and
determine the composition as shown in Figure 5.17). The bright spots represent the
presence of noble metals on the Titania.

152
Figure 5.17) SEM-EDX of the Au-Pt/Titania catalyst.

153
The results from SEM-EDX and XRD do confirm the presence of gold and
palladium. However, palladium is much more strongly exhibited than gold in agreement
with the proposed gold core palladium shell structure. The presence of carbon may be
due to some impurities left from the initial hydrogenation of pentyne. The metal particle
is estimated to be around 17nm and the titania is in the anatase phase from the XRD.
Summary
The oxidation of benzyl alcohol with this novel Au-Pd/titania was studied over a range of
conditions in order to optimise the selectivity and rate and to further understand the
mechanism of the reaction. While the reaction was performed in the kinetic regime the
reactor design, engineering parameters and the pre-treatment of the catalyst significantly
improved the benzaldehyde selectivity up to 93% without the use of high oxygen
pressure, which causes a hazard in industrial applications.

154
VI) SELECTIVE OXIDATION OF ALCOHOLS ON
METAL OXIDES
The investigation of heterogeneous catalysts consisting of transition metals other
than the noble metals is well documented in the literature since they provide a much
cheaper alternative than expensive platinum group metals (PGM). Therefore, the purpose
of this chapter is to investigate different metal oxides for the liquid phase oxidation of
different alcohol categories such as primary octanol, secondary 2-pentanol and aromatic
benzyl alcohol. The mechanism of metal oxide catalysis is explained before discussing
the investigation of a variety of catalysts. The catalysts contained 5% active metal
loading and were provided by Johnson Matthey. The trial catalysts
included 2/ SiOAgO , 232 / SiOOFe , 2/ SiOCuO , 32/ OAlCuO and were tested in this
work at different pressures and temperatures. The catalysts have also been characterised
with TPR and XRD.

155
6.1) Introduction and Mechanism
The hydrocarbon oxidation with metal oxides (MO) catalysts proceeds by a
different mechanism than for PGM catalysts. Usually, the noble metals oxidise the
alcohol by a Langmuir-Hinshelwood type mechanism. First the hydrogen of the
hydroxyl function chemisorbs onto the metal surface where the substrate will detach to
yield a ketone. The supplied oxygen is activated by the noble metal to react with the
adsorbed hydrogen to yield water and thus cleans the active surface (Gallezot 1997).
In the 1950’s, the SOHIO company (now BP) found that a lattice oxygen in MO
is more selective to oxidize hydrocarbons than gaseous oxygen but preferred not to
publish information about this new mechanism for commercial purposes. However in
1954, Mars and van Krevelen (1954) were able to oxidise benzene and naphthalene with
a vanadia based oxide catalyst without the knowledge of the SOHIO work (Grasselli
2001). Hence, the reaction path elucidated was called the Mars and van Krevelen (MK)
mechanism. This oxidation process can be summarized by the following 7 steps as
described by Grasselli (2002):
1. The lattice oxygen of the metal oxide reacts with two chemisorbed hydrogen
atoms coming from the substrate to yield water and hence oxidises the alcohol.
2. The metal-oxygen bond must be of intermediate strength. A strong bond will
render the catalyst inert. A weak bond will result in total oxidation of the
substrate or loss of oxygen in the solution.

156
3. The host structure of the metal oxide should withstand the formation of anion
vacancies without collapsing and allow the migration of lattice −2O and electron
transfer rapidly through it.
4. The catalyst should be able to perform redox cycles to oxidise the substrate and to
replenish its anion vacancies by supplied oxygen.
5. The sites must be multifunctional in order to carry out hydrogen chemisorption,
oxygen inclusion and substrate desorption.
6. The neighbouring lattice oxygen should be spaced enough in order not to over-
oxidise the same substrate.
7. Different phases in the solid structure of the catalyst can co-operate (one does the
catalysis while the other replenishes the anion vacancies created).
The following scheme summarises the different steps undertaken in a MK mechanism.
Figure 6.1) Mars and van Krevelen oxidation mechanism illustration.

157
In order to establish if the MK mechanism is occurring during an oxidation, the
use of oxygen isotopes can prove the reaction pathway (Weng and Delmon 1992). By
providing an 18O atmosphere during the reaction, the initial product and water created can
be analysed to determine which oxygen isotope they include. If they contain 16O only,
then the oxygen from the lattice metal was used. If they do incorporate 18O , then the
oxygen was inserted from the atmosphere through a Langmuir-Hinshelwood mechanism
(Grootendorst, Verbeek et al. 1995).
Some researchers have used hydrogenation of carboxylic acids with MO catalysts
to yield carbonyl compounds through the MK mechanism. For example, the
hydrogenation of benzoic acid with ZnO produced benzaldehyde at temperature above
575K (de Lange, van Ommen et al. 2001). The supplied hydrogen reduces the MO and
produces water. Consequently, the vacancy created is replenished by absorbing oxygen
from the carboxylic group of the substrate. Therefore, the carboxylic acid is transformed
into a carbonyl compound and the MO is regenerated before it undergoes another redox
cycle (Grootendorst, Verbeek et al. 1995; Sakata, van Tol-Koutstaal et al. 1997).
MO catalysts have been successfully used for gas phase oxidation reactions at
high temperatures (Doornkamp, Clement et al. 1999; Doornkamp and Ponec 2000;
Grasselli 2002). However, the literature on liquid phase oxidation of hydrocarbons with
MO undergoing a MK mechanism is very scarce (Chuang, Cheng et al. 1992). Actually,
Makwana et al. (2002) reported only a few existing works involving a MK mechanism
with transition metal oxide for the liquid phase reaction. Some are based on a
homogeneous reaction of various hydrocarbons such as anthracene to anthraquinone and

158
diphenylmethane to benzophenone with 99% selectivity with a phosphovanadomolybdate
catalyst (Khenkin and Neumann 2000). However, a noble metal oxide such as Ru–Co-
hydroxyapatite, has been reported to undergo a MK mechanism for the oxidation of
benzyl alcohol at 333K (Opre, Grunwaldt et al. 2005). Some have reported a radical
mechanism with MO, however such a reaction path usually involves unselective
oxidation or even total oxidation of the reactant to carbon dioxide and water (Pintar and
Levec 1992; Pintar and Levec 1992). The major reason for the use of MO in the gas
phase reaction is the temperature dependency of the M-O bond (Doornkamp, Clement et
al. 1999). The energy of the bond has to be appropriately balanced to allow the MO to be
reduced by the substrate and oxidised by supplied oxygen. Evidently, M-O bonds
become flexible at high temperature which is unsuitable for general liquid phase
oxidation. Conversely, manganese oxide on an octahedral molecular sieve was able to
efficiently oxidise benzyl alcohol at 383K up to 90% and 100% selectivity (Makwana,
Son et al. 2002) which demonstrate the potential of MO catalysts in liquid phase
oxidation.
6.2) Alcohol Oxidation and TPR Characterisation
Before starting the alcohol oxidation, the catalysts were characterised by XRD to
classify their nature. The XRD was performed at the School of Chemistry, University of
Birmingham and the identification of the different catalysts is in Table 6.1).

159
2/ SiOAgO 232 / SiOOFe 32/ OAlCuO
2/ SiOCuO
(uncalcined)
2/ SiOCuO
(Calcined)
Undefined Hematite Undefined Undefined Tenorite
Table 6.1) XRD identification of various catalysts
Experimental Setup
The 500ml Baskerville reactor was used for the testing of the different metal oxide
catalysts. The PBT-U was in place with the single orifice sparging pipe set under the
impeller. Pictures of the different catalysts and XRD data can be found in Appendix E.
6.2.1) 2/ SiOAgO
The literature on silver oxide oxidation of alcohols in the liquid phase is very
scarce. Initially silver oxide on silica has a mild yellow colour at room temperature.
However, it was observed that the catalyst changed colour to dark brown immediately
upon submersion into a hot solution at 373K. This observation suggested a change of
catalyst oxidation state. The most likely cause is loss of oxygen from silver. In order to
verify the cause of irreversible colour change, a TPR was performed on the catalyst.

160
Temperature (K)
200 300 400 500 600 700 800 900 1000
Sig
na
l (a
.u.)
0.39
0.40
0.41
0.42
0.43
0.44
0.45
Figure 6.2) TPR of silver oxide. 10%H2/Argon flow=50ml/min; 5K/min up to 890K.
Figure 6.2) shows the TPR of fresh silver oxide catalyst. There seems to be a
considerable desorption at temperatures below 370K. This is possibly due to the loss of
impurities from the surface as the catalyst is subjected to heat and a reductive gas flow.
However, a sharp peak is localised at 380K which exhibits the reduction of the catalyst
phase. Another peak occurs at 670K. The phase transformation from AgO to Ag2O or
Ag2O3 happens just above 373K while the phase transformation from Ag2O to Ag and O
occurs at 673K (Waterhouse, Bowmaker et al. 2001). Hence, comparing the
experimental observation of the catalyst colour change upon submersion into a solution at
373K with the literature, it seems that the catalyst abruptly lost oxygen upon immersion

161
into a hot solution since the temperature corresponded to 370K causing a phase change.
The lattice oxygen did not oxidise the substrate due to the swift release of oxygen. The
catalyst could not be re-oxidised through the bubbling of air since the oxygen partial
pressure was too low and the temperature too high. In order to prevent the abrupt oxygen
loss from the catalyst, the reaction was carried out at various temperatures and 6 bar of
air pressure.
Temperature (K)
303 333 343 373
% C
onvers
ion
0
2
4
6
8
2-pentanol
1-octanol
benzyl alcohol
Figure 6.3) Various alcohol oxidations at different temperatures with silver oxide.
Reaction conditions: Flow= 550ml/min; AirP =6 Bars; C=0.248M in 300ml Heptane;
rps=22.5 1−s ; 6g cat.

162
Figure 6.3) shows the oxidation of different alcohols at various temperatures after
6 hours of reaction. While the production of 2-pentanone, 1-octanone and benzaldehyde
is negligible, it can be seen that the conversion passes through a maximum with an initial
temperature increase before it starts to decrease after 340K. Indeed, it was previously
shown with the help of the TPR that AgO loses oxygen swiftly when the temperature is
raised beyond 370K. Therefore, the catalyst was releasing oxygen even faster as the
temperature was increased after 340K. Since it is the lattice oxygen that reacts with the
alcohol, the fast oxygen loss from the catalyst would eventually decrease the reaction
rate. At temperature lower than 340K, the lattice oxygen would react with the alcohol to
produce the carbonyl compounds. A temperature increase would enhance the reaction
rate as long as it does not go beyond ~360K which then starts causing the abrupt oxygen
release into the solution.
Upon collection of the used catalyst, its colour was dark brown confirming that it
did lose oxygen to become Ag2O and was not re-oxidised to AgO. The silver-oxygen
bond of 213kJ/mole is weak and it can be easily broken but cannot be regenerated under
the liquid phase reaction conditions (Dean 1999). Hence, this catalyst is ineffective for
mild liquid phase oxidation. This can be further established when the concentration is
studied with time.
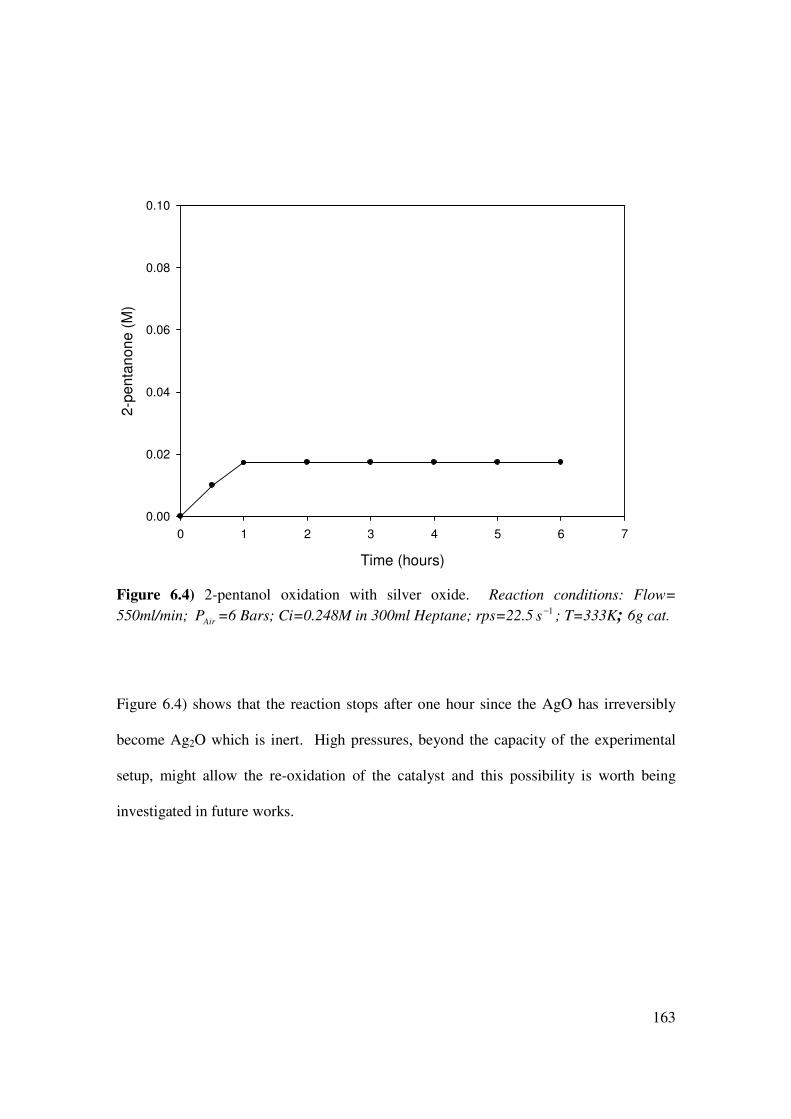
163
Time (hours)
0 1 2 3 4 5 6 7
2-p
en
tan
on
e (
M)
0.00
0.02
0.04
0.06
0.08
0.10
Figure 6.4) 2-pentanol oxidation with silver oxide. Reaction conditions: Flow=
550ml/min; AirP =6 Bars; Ci=0.248M in 300ml Heptane; rps=22.5 1−s ; T=333K; 6g cat.
Figure 6.4) shows that the reaction stops after one hour since the AgO has irreversibly
become Ag2O which is inert. High pressures, beyond the capacity of the experimental
setup, might allow the re-oxidation of the catalyst and this possibility is worth being
investigated in future works.

164
6.2.2) 232 / SiOOFe
In order to determine the optimum temperature where iron oxide will be able to
exchange lattice oxygen, a TPR was performed on fresh catalyst and the results are
shown in Figure 6.5).
Temperature (K)
200 300 400 500 600 700 800 900 1000
Sig
na
l (a
.u.)
0.38
0.39
0.40
0.41
0.42
0.43
0.44
Figure 6.5) TPR of iron oxide. 10%H2/Argon flow=50ml/min; 5K/min up to 980K.
From Figure 6.5) iron oxide reduces at 590K with a broad peak at 400K. The latter peak
may be caused due to water desorption since iron oxide is hydrophilic (Zeng, Quaye et al.
2004). Hematite is the form of iron oxide that reduces at 590K (Iwamoto, Yoda et al.
1978; Lemaitre, Delannay et al. 1982). These results clearly confirm the XRD results in

165
Table 6.1) that the catalyst is hematite. The catalyst is therefore very stable and the Fe-O
bond has an energy value of 409kJ/mole (Dean 1999). Hence, it might be expected to
require a very high temperature for the alcohol oxidation to allow the lattice oxygen to be
flexible within the catalyst. Figure 6.6) shows the attempted oxidation of different
alcohols at various temperatures.
Temperature (K)
343 373 403 443
% C
onvers
ion
0
1
2
3
4
5
6
2-pentanol
1-octanol
Benzyl alcohol
Figure 6.6) Various alcohol oxidations at different temperatures with iron oxide.
Reaction conditions: Flow= 550ml/min; AirP =5 Bars; C=0.248M in 300ml Decane;
rps=22.5 1−s ; 6g cat.
As predicted, the reaction rate for all the alcohols increased due to an enhanced flexibility
of the Fe-O bond as the temperature was increased. In all the experiments with the iron

166
oxide catalyst the original red colour remained unaltered at the end of the experiment,
suggesting that the catalyst did not change phase after 8 hours of reaction. It can be
concluded that this catalyst is unsuitable for liquid phase oxidations, however it might be
active for gas phase oxidations at high temperatures (Weng and Delmon 1992).
6.2.3) 2/ SiOCuO and 32/ OAlCuO
Different copper samples were tried for the alcohol oxidation evaluation. The
32/ OAlCuO was supplied uncalcined and two samples of, one calcined and one
uncalcined on silica. An initial TPR was performed on the copper on alumina sample.

167
Temperature (K)
200 300 400 500 600 700 800 900
Sig
na
l (a
.u.)
0.40
0.41
0.42
0.43
0.44
0.45
0.46
Figure 6.7) TPR of copper oxide on alumina. 10%H2/Argon flow=50ml/min; 5K/min up
to 880K.
Figure 6.7) shows the different peaks exhibited during the Temperature Programmed
Reduction of32/ OAlCuO . It is obvious that the structure of this uncalcined sample
contained different oxide phases which reduce at different temperatures. The seventh
principle as explained by Grasselli (2002) clarifies that different structural phases may
perform different roles in a reaction scheme. Unfortunately, the catalyst showed no
activity at all, even after trying the following matrix of experiments with addition of
hydrogen peroxide (Miyahara, Kanzaki et al. 2001) in Table 6.2).

168
Pressure (Bars) Temperature (K) 50% w/w22OH Solvent Alcohol
1, 4, 8 303, 373, 430 0 or 15ml Octane & Decane benzyl alcohol
1, 4, 8 303, 373 0 or 15ml Heptane & Octane 2-pentanol
1, 4, 8 303, 373, 430 0 or 15ml Octane & Decane
1-octanol
Table 6.2) Different reaction conditions for copper oxide on alumina
Consequently, both uncalcined and calcined silica supported catalysts were then tried.
The TPR of both copper on silica catalysts is shown in Figure 6.8).
Temperature (K)
300 400 500 600 700 800 900
Sig
nal (a
.u)
0.38
0.40
0.42
0.44
0.46
0.48
0.50
A)
Temperature (K)
300 400 500 600 700 800 900
Sig
na
l (a
.u.)
0.2
0.4
0.6
0.8
1.0
1.2
1.4
B)
Figure 6.8) TPR of copper oxide on silica. 10%H2/Argon flow=50ml/min; 5K/min up to
800K. A) Uncalcined and B) Calcined
The figures above show clearly that the calcined catalyst has one distinctive oxide phase
while the uncalcined sample has different oxide phases whose reduction temperatures

169
overlap. Nonetheless, the activity of both samples was tested in the oxidation of the three
alcohols and the results are shown in Figure 6.9).
Temperature (K)
303 333 343 373
% C
onvers
ion
0
1
2
3
4
5
6
2-pentanol
1-octanol
benzyl alcohol
A)
Temperature (K)
303 333 343 373
% C
onvers
ion
0
2
4
6
8
10
12
14
2-pentanol
1-octanol
benzyl alcohol
B)
Figure 6.9) Various alcohol oxidations at different pressures with copper oxide.
Reaction conditions: Flow= 550ml/min; AirP =5 Bars; C=0.248M in 300ml Decane;
time=7 hours; rps=20.0 1−s ; 6g cat. A) Uncalcined and B) Calcined.
Figure 6.9) shows the superior activity of the calcined sample over the uncalcined
catalyst. It is interesting to note that of all the metal oxide catalysts tested, the calcined
2/ SiOCuO showed the most promising results in terms of conversion at 333K. Although
the reduction temperature from Figure 6.8) is 530K, the catalyst starts to lose activity as
the oxidation reaction temperature increases. This highlights the possibility that it is
becoming increasingly more difficult to re-oxidise both catalysts when the temperature is
augmented. Therefore, the air pressure effect was studied on the reaction at 333K in
order to determine whether higher pressure could more effectively regenerate the catalyst
surface.

170
Pressure (Bar)
1 3 5 7
% C
onvers
ion
0
2
4
6
8
10
12
14
16
2-pentanol
1-octanol
benzyl alcohol
Figure 6.10) Various alcohol oxidations at different temperatures with calcined copper
oxide. Reaction conditions: Flow= 550ml/min; T=333K; C=0.248M in 300ml Heptane;
rps=20.0 1−s ; time=7 hours; 6g cat.
Figure 6.10) shows a constant increase in reaction rate for all three alcohols as the
pressure increases. The Cu-O bond energy is 343kJ/mole which seems to be the
appropriate intermediate metal-oxygen bond strength. Although the conversion increases
slightly, the pressure effect underlines and confirms the importance of the catalyst re-
oxidation. The addition of 50%w/w 22OH did not improve the oxidation, since it was
followed by oxygen evolution from the solution. This observation was explained in the
literature as well (Miyahara, Kanzaki et al. 2001). Unfortunately, the equipment does not
allow any further increase in air pressure to push the conversion any higher. Although

171
the conversion was low, it is interesting to note that the reaction rate was constant at
0.005M/hr, contrary to silver oxide which lost its activity after one hour since it changed
into Ag2O. Figure 11) shows that the calcined 2/ SiOCuO catalyst is the most promising
Metal Oxide based catalyst since its activity is continuous.
Time (hours)
0 2 4 6 8
2-O
cta
no
ne
(M
)
0.00
0.01
0.02
0.03
0.04
0.05
Figure 6.11) 2-octanol with calcined copper oxide on silica. Reaction conditions: Flow=
550ml/min; T=333K; C=0.248M in 300ml octane; rps=20.0 1−s ; time=7 hours; P=7Bar;
6g cat.
Summarising the results from the copper oxide catalyst, it seems that calcination
or having a single oxide phase considerably increases the activity of the catalyst. The
alumina supported catalyst had various oxide phases, which made the catalyst ineffective

172
in the oxidation of alcohols. The uncalcined silica supported catalyst showed only low
activity since it also had different oxide phases. However, the calcined silica supported
copper catalyst showed promising results and an appropriate metal-oxygen bond energy.
It seems however, that the oxygen partial pressure limits the activity of the catalyst.
Summary
In this chapter, the testing of tested three different metal oxide catalysts for the
oxidation of primary, secondary and aromatic alcohols is reported. The silica supported
silver oxide had a very weak Ag-O bond and it easily lost oxygen without being able to
re-oxidise. Iron oxide had the opposite problem of silver oxide: the Fe-O bond is too
strong. This catalyst was not active because under these reaction conditions and
temperature, the metal oxide bond is not flexible enough. Uncalcined copper oxide on
alumina with different oxide phases was inert, probably due to an incompatible bulk
structure of the catalyst (Grasselli 2002). The calcined copper oxide catalyst on silica
showed the most potential since the strength of the Cu-O bond seemed to have an
appropriate intermediate energy. Increasing the oxygen partial pressure increases the
conversion since it speeds up the re-oxidation of the copper catalyst.
173
VII) CONCLUSIONS AND RECOMMENDATIONS
7.1) Conclusions
7.1.1) 2-Octanol Oxidation with 5%Pt-1%Bi/carbon
The oxidation of 2-octanol was investigated with 5%wtPt-1%wtBi/carbon to
understand the reasons of the low activity reported in literature and to establish a
solution. The sudden loss of the high reaction rate after 15 minutes during the oxidation
of 2-octanol with 5%Pt-1%Bi/carbon in heptane was investigated. There were three
likely causes including overoxidation, leaching and poisoning. It was found that the
latter cause was occurring due to the strong adsorption of 2-octanone on the catalyst
surface. The amount of adsorbed ketone was found to be 0.006moles/gram of catalyst.
Therefore, the solvent choice was investigated to try to remove the adsorbed ketone from
the active surface. P-xylene and dioxane each proved to be inadequate to dissolve the
adsorbed ketone from the catalyst and DMSO bound even more strongly than 2-octanone

174
on the active surface. Finally, a mixture of 16-18% v/v dioxane in heptane was able to
effectively regenerate active sites and allow a constant reaction rate of 0.07M/hr.
The Arrhenius plot was studied with temperatures ranging from 323K to 353K
and the activation energy was calculated to be -49.8 kJ/mol from a straight line fitted to
the data. The 30 microns diameter particulate powder catalyst did not show any internal
mass transfer limitations but considerable external mass transfer limitations were found.
The gas-liquid mass transfer bGLak was found to be 31022.6 −× s-1
experimentally and
31013.8 −× s-1
semi-empirically using Kawase et al. (1997) formula. The liquid-solid
mass transfer coefficient SLk was found to be 41022.7 −× m s-1
using the semi-empirical
formula developed by Kushalkar and Pangarkar (1994) and the experimental data.
However, since the objective of this work was to study the catalyst deactivation due to
chemical poisoning, the system was kept under oxygen mass transfer limitations to avoid
the creation of overoxidation which would mask the poisoning effect. This was
evidenced by increasing the pressure of the reactor where a decrease in reaction rate was
manifested.
Different rate laws representing six likely mechanisms were investigated as well
to be able to model the conversion with time. The model based on Shuurman (1992) with
an additional effect of strong product adsorption described effectively the experimental
data and had the following expression:
2
4
5.0
221
5.0
2213
)][
])[(][1(
])[]([
K
POKAK
OKAKkR
+++
=

175
Finally, the catalyst was characterised with CO chemisorption and was determined to
have a 6% metal dispersion, 0.75 m²/g metallic surface area and 18 nm active particle
diameter.
7.1.2) Benzyl Alcohol Oxidation with 2.5%Au-2.5%Pd
The recently developed 2.5wt %Au-2.5wt %Pd Johnson Matthey catalyst was
investigated for the oxidation of benzyl alcohol. Studies of this novel catalyst have been
recently reported in the literature, where the need to further understand the reaction
mechanism and engineering parameters have been raised. The catalyst showed a
negligible conversion when used as received which prompted the investigation into a
reduction step with hydrogen. Indeed, this reductive pre-treatment dramatically
improved the conversion at the expense of the selectivity for the oxidation of benzyl
alcohol. The reduction might have cleaned the catalyst surface from impurities such as
water and oxides, clearing the active sites. The conversion increased by ~50% after the
reduction but the selectivity decreased by ~25% to 70%.
The oxygen effects on the reaction rate and selectivity were then investigated by
increasing the pressure and stirring speed to enhance gas-liquid mass transfer. While the
reaction rate was zero order in oxygen, the selectivity increased to 83% when the
pressure was 6 bar and the stirring speed 20.0 s-1
. Those findings suggest that the
selectivity is enhanced with an increase in oxygen concentration. Therefore, the reactor
configuration was redesigned to improve gas-liquid mass transfer. The PBT-U was
replaced with a Rushton Turbine to increase the power input. The energy dissipated with
the PBT-U was 3.47 m2/s3 while the energy dissipated from the Rushton turbine was

176
12.02 m2/s
3. The single orifice sparger was replaced with a disc shower head with 21
holes to maximise the number of bubbles. As a consequence, the selectivity was
increased by ~5% up to 88%.
Moreover, the mechanism of the reaction was investigated to determine the
origins of the toluene production. Toluene and benzaldehyde were produced in equal
amounts in anaerobic conditions and benzyl alcohol is easily hydrogenated to toluene.
Hence, it was deduced that toluene is produced by hydrogenation of benzyl alcohol
originating from the dehydrogenation of the latter. This explained why the selectivity
was sensitive to the oxygen concentration since the gaseous reactant removes effectively
surface hydrogen before it reacts with benzyl alcohol to produce toluene. Since the
catalyst was being reduced before use to free active sites, it would then be covered in
hydrogen. Therefore, the catalyst was used in an anaerobic hydrogenation reaction of
pentyne to remove any remaining traces of hydrogen on the catalyst. This second
treatment step of the catalyst boosted the selectivity to 93%. The EDX showed carbon
deposition on the catalyst after the pentyne hydrogenation which suggests that some
active sites were blocked during the alcohol oxidation. This is a likely explanation for
the selectivity increase since the reaction rate of the toluene production decreased.
Since the reaction was performed in solvent free conditions to minimise chemical
wastes and was zero order in oxygen, no mass transfer of reactant affected the reaction
rate. The Arrhenius plot was studied for temperatures between 343K and 393K, where
the activation energy was determined to be -44.6 1. −molkJ . Therefore, the reaction could
be easily and simplistically described with a power law model with the following
equations:

177
BnOH
BnOHBnOH
XKR
XCkR
<=
<<=
6.0~;
3.0~0;
3
3
At 363K, it was found that 16.03 =k h-1
at low concentrations. At high concentrations,
the reaction is zero order and the reaction rate is 22.13 =K M.h-1
. Between 30% and
60%, the reaction order in BnOH decreases as the reaction rate becomes increasingly
independent of the alcohol concentration.
Finally, the catalyst was characterised with EDX and XRD to verify the presence
of gold and palladium where a stronger presence of palladium was exhibited in
agreement with the proposed gold core palladium shell structure. The metal particle is
estimated to be around 17nm and the Titania is in the anatase phase as deduced from the
XRD.
7.1.4) Alcohol Oxidation with Transition Metal Oxides
The2/ SiOAgO ,
232 / SiOOFe , 2/ SiOCuO and
32/ OAlCuO Transition Metal
Oxides were studied as an alternative to the more expensive and rare PGM based
catalysts. While the catalysts studied did not show good potential as an effective
heterogeneous oxidation catalyst, the following conclusions were deduced:
1. Ag-O bond is too weak with a bond energy of 213kJ/mole as deduced from the
XRD characterisation. Therefore it easily lost oxygen without being able to be re-
oxidised.
2. The hematite form of iron oxide has a strong iron-oxygen bond equivalent to
409kJ/mole, rendering the catalyst inert since the lattice oxygen is inflexible.

178
3. Uncalcined CuO catalyst containing different structural phases was not active.
However, the calcined sample showed an increasing conversion with a pressure
increase up to 15% for the 1-octanol oxidation at 7 bar.
7.2) Recommendations for Future Works
The following are suggestions which would further extend the work presented in
this thesis.
• Structured Catalyst
The work done in this thesis was performed in the Stirred Tank Reactor. Other efficient
reactors such as the trickle bed, coated capillary and bubble column could affect mass
transfer coefficients. Indeed, the selectivity studied with the 2.5%Au-2.5%Pd was shown
to be dependent on the oxygen transport. Also, a coated capillary column would help
study the effects of hydrodynamics on the reaction rate and selectivity.
• Metal Oxides
While the metal oxide catalysts studied in this chapter gave a negligible conversion, they
might show a more promising activity under the right conditions. As proposed by
Grasselli (2002), only some structural phases for the same catalyst composition may be
active. Hence, the almost inert hematite iron oxide may be more active under a different
phase such as maghemite for example. Moreover, the calcined CuO catalyst gave an

179
increasing conversion with oxygen partial pressure. Working in a coated CuO capillary
as suggested above, may improve the re-oxidation of the copper catalyst which would
enhance the reaction rate.
• Catalyst Characterisation
While TPR, Chemisorption and XRD were used to describe the catalysts phase and
structure, other methods would complete the characterisation. Techniques such as
EXAFS (Extended X-Ray Absorption Fine Structure) and Cyclic Voltammetery would
help understand the bonding between the gold and palladium in the 2.5%Au-2.5%Pd
catalyst. Indeed, the core/shell structure synergy between Au and Pd is still not entirely
comprehended.
• Oxygen probe
The use of an oxygen probe suitable with an organic solvent would allow a qualitative
and quantitative insight into the effects of pressure, mass transfer and modelling on the
reaction. Common oxygen probes are usually incompatible with organic solutions and
are imprecise at high temperatures. Nonetheless, sophisticated and expensive probe
instrument do exist that provide specific data with conditions such as the ones used in this
work.

180
Appendix A:
External Mass Transfer Sample Calculation for Chapter IV)
A1) Mass transfer coefficient for O2
The solid-liquid mass transfer coefficient SLk can be determined experimentally
by plotting the inverse of the initial reaction rate versus the inverse of the catalyst loading
assuming the reaction behaves with a first order in reactants initially as was explained in
section 2.6) (Fogler 2001).
Plotting ii RC / versus w/1 the resulting line will have the following relationships:
bGL
bak
rIntercept1
==
kakrrSlope
PSL
rcη
11+=+=
Where cr rr , and
br are the internal and reaction, solid-liquid and gas-liquid resistances
respectively.

181
1/w (dm3/g)
0.04 0.06 0.08 0.10 0.12 0.14 0.16 0.18 0.20 0.22
Ci/R
i (s
)
0
100
200
300
400
y = 951.94x + 160.76
R2 = 0.9951
Figure A1) Solid-Liquid and Gas-Liquid mass transfer resistances for Oxygen. Reaction
mixture conditions: T=343.15 K; AirP =1 Bar; rps=22.5 1−
s
From Figure A1) it can be deduced that the sum of liquid-solid transport resistance and
internal diffusion is equal to 951.94 3/. dmsgcat . SLk can be calculated using the
following semi-empirical equation (Kushalkar and Pangarkar 1994).
( ) 47.0
15.1
31019.1−−
×= Sc
N
Nk
sg
SL

182
A2) Calculation of Nsg and Ns
Bujalski et al. (1998) observed that for upward pumping in three phase stirred
tanks:
( ) 11.01 VGSsg QNN +=
Where VGQ is the vessel volume per minute flow and is equal to 0.73 vvm.
Zwietering (1958) found that:
85.0
13.045.02.01.0 )/(
D
XgdSN
Lp
S
ρρυ ∆=
The following data was used to calculate Ns:
S=
33.1
2
D
T= 03.5
0.4
0.82
33.1
=
Nienow, 1975
rpsd
XgdSN
i
Lp
S 28.804.0
289.1)72.181.9()1030()1064.4(03.5)/(
85.0
13.045.02.061.07
85.0
13.045.02.01.0
=×××××
=∆
=−−ρρυ
( ) rpsQNN VGSsg 79.8)73.01(28.81 11.011.0=+=+=
82.281061.1
1064.48
7
=×
×==
−
−
ABDSc
υ
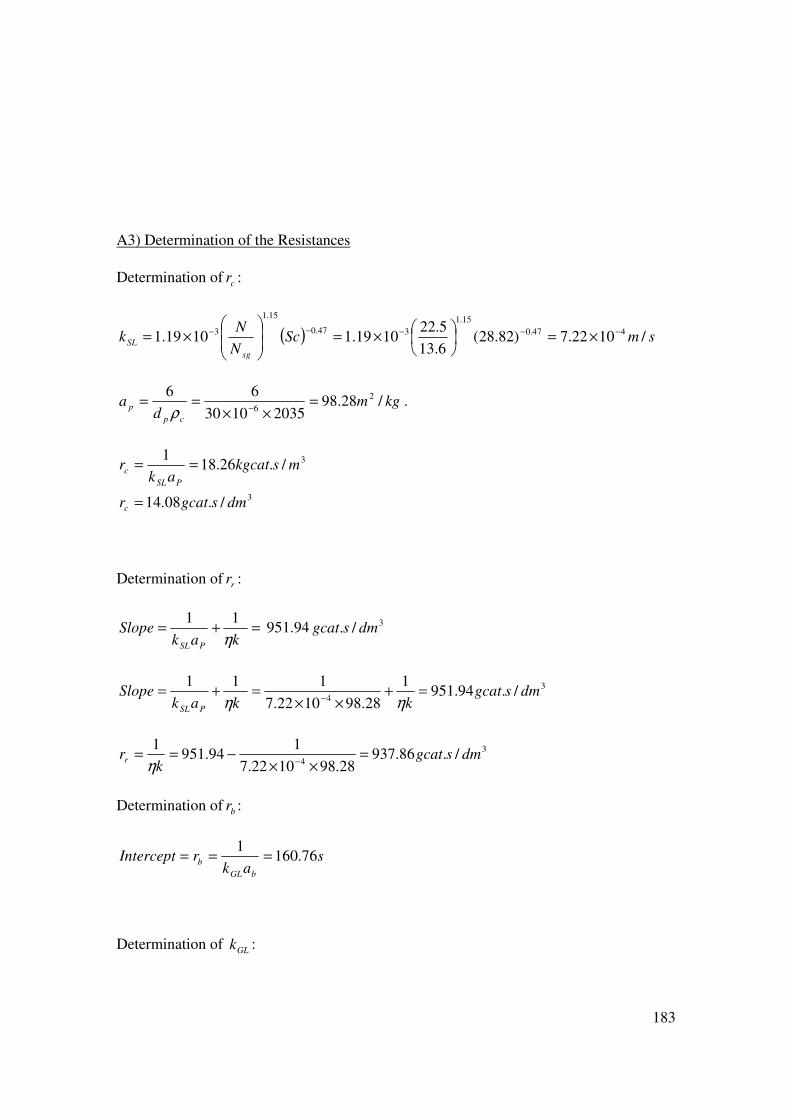
183
A3) Determination of the Resistances
Determination of cr :
( ) smScN
Nk
sg
SL /1022.7)82.28(6.13
5.221019.11019.1 447.0
15.1
347.0
15.1
3 −−−−− ×=
×=
×=
kgmd
acp
p /28.9820351030
66 2
6=
××==
−ρ.
3
3
/.08.14
/.26.181
dmsgcatr
mskgcatak
r
c
PSL
c
=
==
Determination of rr :
=+=kak
SlopePSL η
11 951.94 3/. dmsgcat
3
4/.94.951
1
28.981022.7
111dmsgcat
kkakSlope
PSL
=+××
=+=− ηη
3
4/.86.937
28.981022.7
194.951
1dmsgcat
krr =
××−==
−η
Determination of br :
sak
rInterceptbGL
b 76.1601
===
Determination of GLk :

184
Kawase et al. (1997) developed a semi-empirical correlation to evaluate bGLak in three
phase stirred tanks.
( )
25.02/1
5/3)1(2/1
)1(10/)49(5/3
/
−
+
++
′=
w
a
t
g
n
l
nn
l
bGLU
U
KDCak
µ
µ
σρ
ερ
Calculation of the speed of free bubble rise Ut:
Bubble diameter and surface area estimation
An approximate estimation about the bubble diameter can be determined using the
correlation found in Hu et al (2005)
58.074.0/
−= Wedd ib
Therefore,
132701686.0/039.05.225.745/ 3232 =××== σρ iL dNWe
0114.0132774.074.0/ 58.058.0 =×== −−Wedd ib; mdb
41057.40114.004.0 −×=×=
271056.6 mab
−×=
The speed of bubble free rise is determined by:
µρρ 18/)(2 gdU LGbt −=
smgdU LGbt /23.0)10347.018/(81.9)5.745168.1()1057.4(18/)( 3242 =×××−××=−= −−µρρ
Calculation of the dissipation energy ε

185
V
dNP i
53
0 ××=ε
kgWV
dN i /0418.010312
039.05.2227.127.14
5353
=×
××=
××=
−ε
Therefore assuming the solution is Newtonian for simplicity and that the density of the
solution is the same as the slurry since the solid concentration is negligible:
( )
25.02/1
5/3)1(2/1
)1(10/)49(5/3
/
−
+
++
′=
w
a
t
g
n
l
nn
l
bGLU
U
KDCak
µ
µ
σρ
ερ
( )
25.0
4
32/1
5/334/13
5/39
10012.4
10347.0
23.0
002.0
)1086.16(5.745/10347.0
0418.05.745101.16675.0
−
−
−
−−
−
×
×
××
××=bGLak
3
3
5 1013.803.109.01025.2
21.21056.8 −
−
− ×=×××
×=bGL ak s-1

186
Appendix B:
Internal Mass Transfer Sample Calculation for Chapter IV)
B1) Wagner-Weisz-Wheeler modulus WM
In order to determine whether the reaction is limited by internal mass transfer the
Wagner-Weisz-Wheeler modulus WM was calculated since it depends on experimental
observables.
eff
AV
WD
CrLM
exp2)/(−
= (Levenspiel 1999)
Where L is the characteristic size of a catalyst particle equal to 3
R for spheres. Vr is the
observed reaction rate per unit of volume of catalyst particles, AC is the initial
concentration of reactants and effD is the effective diffusivity defined as:
P
P
eff
DD
τ
ε= where
Km DDD
111+=
Pε is the porosity of the catalyst, Pτ is the tortuosity, mD is the molecular diffusivity
and KD is the Knudsen diffusivity. The Knudsen diffusivity is only applicable to gases
(Satterfield 1991) and it is assumed that the reacting oxygen is in soluble form therefore
D= mD . The effective diffusivity was calculated with the average values of porosity and

187
tortuosity of 0.4 and 4 respectively (Winterbottom and King 1999) and gives a value
of 81061.1 −× 12 . −sm for oxygen and 91033.1 −× 12 . −
sm for 2-octanol at 343K.
The initial concentration of oxygen and 2-octanol are 11058.6 −× 3. −mmoles and
248 3. −mmoles respectively and mL
6105 −×= . The initial reaction rate based on the
volume of catalyst in the reactor is Vr =3.66 13 .. −− smmoles cat .
3
8
126exp2 1063.8
1061.1
)1058.6/66.3()105(
)/(−
−
−− ×=
×
××=
−=
eff
AV
WD
CrLM For oxygen
4
9
26exp2 1077.21033.1
)248/66.3()105(
)/(−
−
− ×=×
×=−
=eff
AV
WD
CrLM For 2-octanol.
Both these values are much lower than 0.15 which is the Weisz-Prater (Levenspiel 1999)
criterion for a diffusion free regime. Hence it can be deduced that the reaction happens on
the outer surface of the catalyst.

188
Appendix C:
Matlab Program Sample for Chapter IV)
C1) Derivation of Model A)
Each proposed rate law in Table 4.5) was integrated into an equation in which it is
a function of time. For example:
Model A: 2
4
5.0
221
5.0
2213
)][
])[(][1(
])[]([][)(
K
POKAK
OKAKk
dt
Adtf
+++
=−
=
For simplification, let
4
1
4
05.0
22
5.0
2213
0
1
][])[(1
])[(
])[]([][
KKc
K
AOKb
OKKka
AAP
−=
++=
=
−=
Model A can then be integrated into the following

189
A
A
A
A
i
i
a
AcA
a
bcA
a
bt
a
Ac
a
bc
Aa
bdt
Aa
Acb
Ad
dt
Acb
Aa
dt
Ad
++=−
++=−
+=
−
+=
−
∫∫
2
][][
2]ln[
][2
][
][
])[(
][
])[(
][][
222
][
][
22
2
2
ta
AcA
a
bcA
a
b
a
AcA
a
bcA
a
btf i
ii +−−−++==2
][][
2]ln[
2
][][
2]ln[0)(
222222
The final equation will hence be used in Excel to determine the kinetic parameters and in
Matlab to include the mass transfer effects. Eventually, the Matlab plot should describe
the experimental data.
C2) Kinetic Parameters
Initial reaction rates with different starting alcohol concentrations were performed
in the Laboratory setup to exclude mass transfer limitations and to determine the effects
of initial alcohol concentration on the reaction rate. The air flow and stirring were
increased until any further increase does not change the rate, where it can then be
assumed that there are no masking mass transfer effects and the reactions happening are
in the kinetic regime. The reaction rate initially increases linearly initially since no
significant amount of product is being formed to slow the catalysis. The kinetic
parameters 1K , 2K and 3k were determined with the help of Excel by using the “solver”

190
function. The initial experimental reaction rates were plotted against different initial
alcohol concentration in Figure C1). After introducing the derived equation f(t), the
solver function determines statistically the kinetic parameters with minimum error.
The following graph represents the experimental data and the modelled data using the
“solver” function to find and minimise the errors as much as possible in the kinetic
parameters.
Initial 2-octanone Concentration Cai
0.05 0.10 0.15 0.20 0.25 0.30
Initia
l R
eaction
Ra
te (
M/s
)
0.00000
0.00002
0.00004
0.00006
0.00008
0.00010
Excel "solver"
Experimental
Figure C1) Plot of the experimental reaction rate and of the Excel rate law with
calculated kinetic parameters using function f(t). Reaction mixture conditions: T=343.15
K; AirP =1 Bar; rps=22.5 1−s ; 0.3g cat.
The kinetic parameters1K ,
2K and 3k determined by Excel and used in Figure C1) are the
following:

191
C3) Matlab
After developing the integrated form of the rate law and determining the values of
the kinetic parameters, the Matlab script could be written. The values in Table C1) were
used.
][ 2O (M) 1K (
1−M )
2K (1−
M ) 3 x
3k
(11.. −− sgM )
4K ( M ) CAi (M)
0.001 0.005 42.26 0.3 0.36 0.248
Table C1) Parameters used in the modelling of the experimental data in Figure 4.12)
From Table C1), the oxygen concentration was calculated from section 4.8 and Appendix
A. CAi is the initial concentration of 2-octanol used. 4K was determined experimentally
from Figure 4.6). The following Matlab script was used and Figure C2) shows the
resulting plot.
1. function [CA,Time,Redexp,Texp]= Model A
K1= 0.005
K2= 42.26
k3= 0.3

192
2. ][ 2O =0.001;
3. k1=0.005;
4. k2=42.26
5. k3=0.3
6. k4=0.36
7. CAi=0.248;
8. a=k3*k1*(k2* ][ 2O )^0.5;
9. b=1+(k2* ][ 2O )^0.5+CAi/k4;
10. c=(k1-1/k4);
11. Redexp=[0.248, 0.191231219, 0.1580577956, 0.1205995312,
0.07569495,0.06209932,0.048,0.04];
12. Texp=[0, 1800, 3600, 5400, 9000, 10800, 14400, 18000 ];
13. Time=[0:100:1.5*Texp(1,max(length(Texp)))]
14. CA=[];
15. for i=1:max(length(Time))
16. CA(i)=fsolve(@(x)((b^2/a*log((x))+2*b*c/a*x+c^2/(a*2)*x^2)-
((b^2/a*log((CAi))+2*b*c/a*CAi+c^2/(a*2)*CAi^2))+Time(i)),CAi); i=i+1;
17. end
18. plot(Texp,Redexp,'o',Time,CA);

193
0 0.5 1 1.5 2 2.5 3
x 104
0
0.05
0.1
0.15
0.2
0.25
Time (seconds)
Alc
ohol C
oncentr
ation (
M)
Figure C2) Plot of the Matlab Scrip for Model A).

194
Appendix D:
Supplementary Information used for calculations
D1) Additional Data
Name of Reagent Form Purity
Molecular
Weight
b.p
°C
Sp. gr
Heptane Liquid 99 %
100.21 g/mol 371.6 K 0.684
DMSO Liquid 99 %
78.13 g/mol 462 K 1.1004
p-Xylene Liquid 99 %
106.16 g/mol 412 K, 0.861
1-4, Dioxane Liquid 99 %
88.11 g/mol 374K 1.033
2-Octanol Liquid 99 % 130.23 g/mol 451K 0.819
Benzyl Alcohol Liquid 99 % 108.14 g/mol 478K 1.044
2-Pentanol Liquid 99 % 72.15 g/mol 391K 0.809
1-Octanol Liquid 99 % 130.23 g/mol 468K 0.824
Water Liquid >99.5 % 18 373K 0.990
Hydrogen Gas >99.99 % 2 - 0.08
Nitrogen Gas >99.99 % 28 - 1
Air Gas - 29 - 1
Table D1) Physical properties of reagents, solvents and gases

195
Platinum-Bismuth
Support type Carbon
Support size ~30 microns
Catalyst metal loading 5 %
Catalyst dispersion 6.0%
Particle density 2.35 g/cm³
Active Particle Diameter 18nm
Metallic Surface Area 0.75 m²/g -
Water content 55%
Surface Area ~1000 m²/g Table D2) Properties of catalysts
Name Equation Relation
Reynolds Number µ
ρ 2
ReNDL=
forceviscous
forceinertial
Sherwood number m
PSL
D
dkSh =
ydiffusivitmolecular
ydiffusivitmass
Schmidt number mD
Scρ
µ=
ydiffusivitmolecular
ityviskinematic cos
Table D3) Dimensionless groups
D2) Diffusivity of Oxygen and 2-Octanol in various solvents for Chapter 4
The diffusivity of a substance in a mixed solvent is affected by the viscosity and mole
fraction of the different solvent constituents.
8.08.0
iAiimm DxD µµ ∑= (Poling, Prausnitz et al. 2001))
Gold-Palladium
Support type Titania
Support size ~30 microns
Au Catalyst loading 2.5 %
Pd Catalyst loading 2.5 %
Particle density 4.80 g/cm³
Support phase Anatase
Active Particle Diameter 17nm
Water content __
Surface Area ~100 m²/g

196
The diffusivity of a substance in a pure solvent can be estimated using the following
semi-empirical equation (Chang and Wilke 1955).
6.0
21
8 )(104.7
AB
B
BAV
TMD
η
φ−×=
Where φ =association factor of solvent B, dimensionless
BM = Molecular weight of solvent B, g/mol
AV =molar volume of solute A at its normal boiling temperature, cm3/mol
Bη = viscosity of solvent B, cP
T=temperature, K
The association factors for the solvents used are equal to 1. AV is 14 and 189 13. −
molcm for
oxygen and 2-octanol respectively using Schroeder’s additive method properties (Poling,
Prausnitz et al. 2001). Table C1) summarises the results calculated.
Diffusivity
coefficient in
heptane(129 .10 −−
sm )
Diffusivity
coefficient in
dioxane(129 .10 −−
sm )
Diffusivity
coefficient in
octanol(129 .10 −−
sm )
Diffusivity
coefficient in
mixture(129 .10 −−
sm )
Oxygen 15.0 14.1 17.9 16.1
Octanol 4.05 1.74 0.72 1.33
Table D4) Diffusivity of oxygen and 2-octanol in the solvent mixture at 343K

197
D3) Solvent Viscosity and Density for Chapter 4
The viscosity of heptane, dioxane and 2-octanol at 343 K were calculated as following.
The viscosity is a function of temperature with the general form:
2ln DTCTT
BA +++=µ where A, B, C and D are constant parameters characteristics of
each substance (Yaws 2003).
A B C D µ (cP)
Dioxane -7.5724 1.3813E3 0.0136 -1.1464E-5 0.590
Heptane -5.7782 8.0587E2 0.0134 -1.4794E-5 0.267
2-Octanol -17.262 3.2080E3 -2.258E-5 -2.2582E-5 1.732
Table D5) Viscosity of solvents at 343K
But since the reaction is performed in a mixture of dioxane, heptane and 2-octanol as a
reactant, the viscosity of the whole mixture must be taken into account. Liquid viscosity
is very sensitive to the structure of the constituent molecules (Poling, Prausnitz et al.
2001). Therefore the resulting viscosity of the mixture can be determined by:
∑∑≠
+=ji
ijji
i
iim Gxxx µµ lnln (Grunberg and Nissan 1949)
Where x is the liquid mole fraction and G is a group interaction parameter that can be
found in literature (Isdale 1979).

198
x(heptane) x(dioxane) x(octanol) 12G (heptane-
dioxane) 13G (octanol-
dioxane)
23G (heptane-
octanol)
0.722 0.245 0.032 0.076 -0.343 -0.239
Table D6) parameters for the determination of the solvent mixture viscosity
The viscosity of the mixture hence becomes 0.347 cP or 113..10347.0
−−−× mskg
The density of the mixture was determined experimentally at 343K to
be 33 .105.745 −−× cmg .
D4) Surface Tension Determination for Chapter 4
The surface tension of pure liquids as a function of temperature can be calculated using
the following equations and have a general form:
n
cTTA )/1( −=σ Where A and n are listed empirical values that can be found in (Yaws
2003).
Pure Liquid at the experimental
temperature
n
cTTA )/1( −=σ
N/m
n-Heptane (343K) 0.015
1-4 Dioxane (343K) 0.026
Benzyl Alcohol (343K) 0.029

199
Table D7) Surface tension values
For a mixture of heptane and dioxane the resulting surface tension can be calculated from
the following equation (Poling, Prausnitz et al. 2001)
Li
n
i
iiLm
m
x
ρ
σρ
σ∑
== 1
4/1
4/1
Where mσ is the surface tension of the mixture, Liρ and Lmρ are the molar density of the
pure liquid and mixture respectively, and ix is the mole fraction.
ix Liρ (mol/L)
iσ (N/m)
Heptane 0.745 82.6 0.015
Dioxane 0.255 11.7 0.026
Table D8) Parameters used to evaluate the surface tension of the mixture
At 343K, Lmρ is 7.67 mol/l. Therefore,
026.21
4/1
4/1 ==∑
=
Li
n
i
iiLm
m
x
ρ
σρ
σ mN/m
As a result mσ =16.86 mN/m

200
Appendix E:
Transition Metal Oxide
E1) XRD data of the Metal Oxides
The following data was provided by the University of Birmingham, School of
Chemistry upon the XRD analysis of the Transition Metal Oxide which allowed the
identification of the catalyst phases.
Catalyst 1) d-Spacing (
°
A )
/Relative intensity
2) d-Spacing (°
A )
/Relative intensity
3) d-Spacing (°
A )
/Relative intensity
Phase
2/ SiOAgO 2.08/100% 8.53/94% 2.37/82.5% Undefined
232 / SiOOFe
2.7/80% 1.69/43% 2.52/50% Hematite
2/ SiOCuO
calcined
2.53/100% 2.99/97.3% __ Tenorite
32/ OAlCuO
1.39/100% 1.99/65% 2.53/58% Undefined
Table E1) XRD data provided for the identification of the different phases

201
E2) Metal Oxides Pictures
A) B)
C)
D) E)
Figure E1) TMO catalyst Pictures. A) Iron oxide on Silica; B) Copper oxide on Alumina;
C) Calcined Copper Oxide on Silica; D) Silver oxide on Silica; E) Used Silver Oxide on
Silica

202
Abad, Corma, et al. (2008). "Catalyst Parameters Determining Activity and Selectivity of
Supported Gold Nanoparticles for the Aerobic Oxidation of Alcohols: The Molecular
Reaction Mechanism." Chemistry - A European Journal 14(1): 212-222.
Abad, A., P. Concepción;, et al. (2005). "A Collaborative Effect between Gold and a
Support Induces the Selective Oxidation of Alcohols13." Angewandte Chemie
International Edition 44(26): 4066-4069.
Alvarez, A. and J. Ancheyta (2008). "Modeling residue hydroprocessing in a multi-fixed-
bed reactor system." Applied Catalysis A: General 351(2): 148-158.
Anderson, R., K. Griffin, et al. (2003). "Selective Oxidation of Alcohols to Carbonyl
Compounds and Carboxylic Acids with Platinum Group Metal Catalysts." Advanced
Synthesis & Catalysis 345(4): 517-523.
Armenante, P. M. and D. J. Kirwan (1989). "Mass transfer to microparticles in agitated
systems." Chemical Engineering Science 44(12): 2781-2796.
Atkins, P. (2002). Physical Chemistry, Oxford University Press.
Aubin, J., N. Le Sauze, et al. (2004). "PIV measurements of flow in an aerated tank
stirred by a down- and an up-pumping axial flow impeller." Experimental Thermal and
Fluid Science
5th international conference on Gas-Liquid and Gas-Liquid-Solid Reactor Engineering
28(5): 447-456.
Auer, E., A. Freund, et al. (1998). "Carbons as supports for industrial precious metal
catalysts." Applied Catalysis A: General 173(2): 259-271.
Bae, I. T., X. Xing, et al. (1990). "In situ Fourier transform infrared reflection absorption
spectroscopic studies of glucose oxidation on platinum in acid." Journal of
Electroanalytical Chemistry 284(2): 335-349.

203
Bamwenda, G. R., S. Tsubota, et al. (1997). "The influence of the preparation methods on
the catalytic activity of platinum and gold supported on TiO2 for CO oxidation."
Catalysis Letters 44(1): 83-87.
Battino, R., T. Rettich, et al. (1983). "The solubility of oxygen and ozone in liquids."
Journal of Physical Chemistry Reference Data 12(2): 163.
Besson, M. and P. Gallezot (2003). "Deactivation of metal catalysts in liquid phase
organic reactions." Catalysis Today
Catalyst Lifecycle Meeting 81(4): 547-559.
Blaser, H.-U., A. Indolese, et al. (2001). "Supported palladium catalysts for fine
chemicals synthesis." Journal of Molecular Catalysis A: Chemical 173(1-2): 3-18.
Bond, G. C. (1962). An Introduction to Catalysis by Metals.
Bond, G. C. (2000). "Diagnostic use of compensation phenomena in heterogeneous
catalysis-: Reactions of alkanes on platinum and palladium catalysts." Applied Catalysis
A: General 191(1-2): 23-34.
Bond, G. C. and D. T. Thompson (1999). "Catalysis by gold." Catalysis Reviews-Science
and Engineering 41(3-4): 319-388.
Boudart, M. (1972). "Two-step catalytic reactions." AIChE Journal 18(3): 465-478.
Bronnimann, C., Z. Bodnar, et al. (1994). "Direct Oxidation of L-Sorbose to 2-Keto-L-
gulonic Acid with Molecular Oxygen on Platinum- and Palladium-Based Catalysts."
Journal of Catalysis 150(1): 199-211.
Bujalski, W., M. Konno, et al. (1998). Suspension at high solid concentrations in agitated
vessels. IChemE Research Event, A Two-Day Symposium, Newcastle upon Tyne,
institution of Chemical Engineers,.
Bujalski, W., A. W. Nienow, et al. (1990). "The use of upward pumping 45° pitched
blade turbine impellers in three-phase reactors." Chemical Engineering Science 45(2):
415-421.
Butt, J. B. (1980). Catalyst Deactivation. Amsterdam.
Butt, J. B. (1982). Progress in Catalyst Deactivation. Boston.
Cainelli, G. and G. Cardillo (1984). Chromium Oxidation in Organic Chemistry. Berlin,
Springer-Verlag.

204
Calderbank, P. H. and M. B. Moo-Young (1961). "The continuous phase heat and mass-
transfer properties of dispersions." Chemical Engineering Science 16(1-2): 39-54.
Carey, F. A. and R. J. Sundberg (2007). Advanced Organic Chemistry - Part A: Structure
and Mechanisms, Springer - Verlag.
Carrettin, S., P. McMorn, et al. (2003). "Oxidation of glycerol using supported Pt, Pd and
Au catalysts." Physical Chemistry Chemical Physics 5(6): 1329-1336.
Chang, P. and C. R. Wilke (1955). "Some Measurements of Diffusion in Liquids.
doi:10.1021/j150529a005." The Journal of Physical Chemistry 59(7): 592-596.
Chapman, C. M., A. W. Nienow, et al. (1983). "Particle-Gas-Liquid Mixing in stirred
vessels Part 1." Chemical Engineering Research & Design 61a: 71.
Chapman, C. M., A. W. Nienow, et al. (1983). "Particle-Gas-Liquid Mixing in stirred
vessels Part 2." Chemical Engineering Research & Design 61a: 82.
Chaudhari, R. V., R. V. Gholap, et al. (1987). "Gas-Liquid Mass Transfer in "Dead-End"
Autoclave Reactors." The Canadian Journal of Chemical Engineering 65: 744-751.
Chaudhari, R. V. and P. A. Ramachandran (1980). "Three phase slurry reactors." AIChE
Journal 26(2): 177-201.
Cheremisinoff, N., P. Rosenfeld, et al. (2008). Responsible Care - A New Strategy for
Pollution Prevention and Waste Reduction through Environmental Management., Gulf
Publishing Company.
Christensen, C., J. Betina, et al. (2006). "Formation of Acetic Acid by Aqueous-Phase
Oxidation of Ethanol with Air in the Presence of a Heterogeneous Gold Catalyst13."
Angewandte Chemie International Edition 45(28): 4648-4651.
Chuang, K. T., S. Cheng, et al. (1992). "Removal and destruction of benzene, toluene,
and xylene from wastewater by air stripping and catalytic oxidation." Ind. Eng. Chem.
Res. 31(11): 2466-2472.
Clark, J. H. and C. N. Rhodes (2000). Clean Synthesis using Porous Inorganic Solid
Catalysts and Supported Reagents.
Colmati, F., E. Antolini, et al. (2006). "Effect of temperature on the mechanism of
ethanol oxidation on carbon supported Pt, PtRu and Pt3Sn electrocatalysts." Journal of
Power Sources 157(1): 98-103.
Davis, B. H. and W. P. Hettinger (1983). "ACS Symposium Series." ACS No 222.

205
de Lange, M. W., J. G. van Ommen, et al. (2001). "Deoxygenation of benzoic acid on
metal oxides: 1. The selective pathway to benzaldehyde." Applied Catalysis A: General
220(1-2): 41-49.
Dean, J. A. (1999). Lange's Handbook of Chemistry.
Demirel, S., P. Kern, et al. (2007). "Oxidation of mono- and polyalcohols with gold:
Comparison of carbon and ceria supported catalysts." Catalysis Today 122(3-4): 292-300.
DiCosimo, R. and G. M. Whitesides (1989). "Oxidation of 2-propanol to acetone by
dioxygen on a platinized electrode under open-circuit conditions." J. Phys. Chem. 93(2):
768-775.
Dijkgraaf, P. J. M., M. J. M. Rijk, et al. (1988). "Deactivation of platinum catalysts by
oxygen : 1. Kinetics of the catalyst deactivation." Journal of Catalysis 112(2): 329-336.
Dimitratos, N., J. A. Lopez-Sanchez, et al. (2007). "Solvent free liquid phase oxidation of
benzyl alcohol using Au supported catalysts prepared using a sol immobilization
technique." Catalysis Today 122(3-4): 317-324.
Dimitratos, N., F. Porta, et al. (2005). "Synergetic effect of platinum or palladium on gold
catalyst in the selective oxidation of D-sorbitol." Catalysis Letters 99(3): 181-185.
Dimitratos, N., A. Villa, et al. (2006). "Pd and Pt catalysts modified by alloying with Au
in the selective oxidation of alcohols." Journal of Catalysis 244(1): 113-121.
Dirkx, J. M. H. and H. S. van der Baan (1981). "The oxidation of glucose with platinum
on carbon as catalyst." Journal of Catalysis 67(1): 1-13.
Donze, C., P. Korovchenko, et al. (2007). "Aerobic selective oxidation of
(hetero)aromatic primary alcohols to aldehydes or carboxylic acids over carbon supported
platinum." Applied Catalysis B: Environmental 70(1-4): 621-629.
Doornkamp, C., M. Clement, et al. (1999). "Activity and selectivity patterns in the
oxidation of allyl iodide on the period IV metal oxides: The participation of lattice
oxygen in selective and total oxidation reactions." Applied Catalysis A: General 188(1-
2): 325-336.
Doornkamp, C. and V. Ponec (2000). "The universal character of the Mars and Van
Krevelen mechanism." Journal of Molecular Catalysis A: Chemical 162(1-2): 19-32.
Ebitani, K., H.-B. Ji, et al. (2004). "Highly active trimetallic Ru/CeO2/CoO(OH) catalyst
for oxidation of alcohols in the presence of molecular oxygen." Journal of Molecular
Catalysis A: Chemical 212(1-2): 161-170.

206
Edwards, J., P. Landon, et al. (2007). "Outstanding Meeting Paper/Review:
Nanocrystalline gold and gold–palladium as effective catalysts for selective oxidation."
Journal of materials research 22: 831.
Enache, D. I., D. Barker, et al. (2007). "Solvent-free oxidation of benzyl alcohol using
titania-supported gold-palladium catalysts: Effect of Au-Pd ratio on catalytic
performance." Catalysis Today 122(3-4): 407-411.
Enache, D. I., J. K. Edwards, et al. (2006). "Solvent-Free Oxidation of Primary Alcohols
to Aldehydes Using Au-Pd/TiO2 Catalysts
10.1126/science.1120560." Science 311(5759): 362-365.
Enache, D. I., D. W. Knight, et al. (2005). "Solvent-free Oxidation of Primary Alcohols
to Aldehydes using Supported Gold Catalysts." Catalysis Letters 103(1): 43-52.
Farrauto, R. J. and C. H. Bartholemew (1988). Fundamentals of Industrial Catalytic
Processes. London.
Fishwick, R. P., J. M. Winterbottom, et al. (2005). "Hydrodynamic Measurements of Up-
and Down-Pumping Pitched-Blade Turbines in Gassed, Agitated Vessels, Using Positron
Emission Particle Tracking." Ind. Eng. Chem. Res. 44(16): 6371-6380.
Fogler, H. S. (2001). Elements of Chemical Reaction Engineering.
Froment, G. F. (1980). A Quantitative Approach of Catalyst Deactivation by Coke
Formation. Amsterdam.
Fuentes, G. A. (1985). "Catalyst deactivation and steady-state activity: A generalized
power-law equation model." Applied Catalysis 15(1): 33-40.
Gabriele, A., A. W. Nienow, et al. "Use of angle resolved PIV to estimate local specific
energy dissipation rates for up- and down-pumping pitched blade agitators in a stirred
tank." Chemical Engineering Science In Press, Corrected Proof.
Gallezot, P. (1997). "Selective oxidation with air on metal catalysts." Catalysis Today
Heterogenous Catalysis in Organic Reactions 37(4): 405-418.
Gangwal, V. R., J. v. d. Schaaf, et al. (2004). "Catalyst performance for noble metal
catalysed alcohol oxidation: reaction-engineering modelling and experiments." Catalysis
Today 96(4): 223-234.
Gangwal, V. R., J. van der Schaaf, et al. (2005). "Influence of pH on noble metal
catalysed alcohol oxidation: reaction kinetics and modelling." Journal of Catalysis
229(2): 389-403.

207
Gangwal, V. R., J. van der Schaaf, et al. (2005). "Noble-metal-catalysed aqueous alcohol
oxidation: reaction start-up and catalyst deactivation and reactivation." Journal of
Catalysis 232(2): 432-443.
Gangwal, V. R., B. G. M. van Wachem, et al. (2002). "Platinum catalysed aqueous
alcohol oxidation: model-based investigation of reaction conditions and catalyst design."
Chemical Engineering Science 57(24): 5051-5063.
Golovanov, I. and S. Zhenodarova (2005). "Quantitative Structure-Property Relationship:
XXIII. Solubility of Oxygen in Organic Solvents." Russian Journal of General Chemistry
75(11): 1795-1797.
Grasselli, R. K. (2001). "Genesis of site isolation and phase cooperation in selective
oxidation catalysis." Topics in Catalysis 15(2): 93-101.
Grasselli, R. K. (2002). "Fundamental Principles of Selective Heterogeneous Oxidation
Catalysis." Topics in Catalysis 21(1): 79-88.
Grootendorst, E. J., Y. Verbeek, et al. (1995). "The Role of the Mars and Van Krevelen
Mechanism in the Selective Oxidation of Nitrosobenzene and the Deoxygenation of
Nitrobenzene on Oxidic Catalysts." Journal of Catalysis 157(2): 706-712.
Grunberg, L. and A. H. Nissan (1949). "Mixture law for viscosity." Nature 164: 799.
Hackett, S. F. J., Brydson R.M, et al. (2007). "High-Activity, Single-Site Mesoporous Pd
Catalysts for Selective Aerobic Oxidation of Allylic Alcohols13." Angewandte Chemie
International Edition 46(45): 8593-8596.
Hamilton, C. A., S. D. Jackson, et al. (2002). "Competitive reactions in alkyne
hydrogenation." Applied Catalysis A: General 237(1-2): 201-209.
Hardacre, C., E. A. Mullan, et al. (2005). "Use of a rotating disc reactor to investigate the
heterogeneously catalysed oxidation of cinnamyl alcohol in toluene and ionic liquids."
Journal of Catalysis 232(2): 355-365.
Hayden, B. E. (1997). "The promotion of CO electro-oxidation on platinum-bismuth as a
model for surface mediated oxygen transfer." Catalysis Today
Fuel Cells and Catalysis 38(4): 473-481.
Heineman, H. (1981). Catalysis, Science and Technology, Springer.
Hills, C. W., M. S. Nashner, et al. (1999). "Carbon Support Effects on Bimetallic Pt-Ru
Nanoparticles Formed from Molecular Precursors." Langmuir 15(3): 690-700.
208
Hongli, W., Z. Qinghong, et al. (2005). "Solvent-Free Aerobic Oxidation of Alcohols
Catalyzed by an Efficient and Recyclable Palladium Heterogeneous Catalyst." Advanced
Synthesis & Catalysis 347(10): 1356-1360.
Hughes, M. D., Y.-J. Xu, et al. (2005). "Tunable gold catalysts for selective hydrocarbon
oxidation under mild conditions." 437(7062): 1132-1135.
Hutchings, G. J. (1985). "Vapor phase hydrochlorination of acetylene: Correlation of
catalytic activity of supported metal chloride catalysts." Journal of Catalysis 96(1): 292-
295.
Hutchings, G. J. (2008). "Nanocrystalline gold and gold palladium alloy catalysts for
chemical synthesis." Chemical Communications(10): 1148-1164.
Hutchings, G. J. and M. Haruta (2005). "A golden age of catalysis: A perspective."
Applied Catalysis A: General
Catalysis by Gold 291(1-2): 2-5.
Isdale, J. D. (1979). Proceedings of Symposium on Transp. Prop. Fluids and Fluid
Mixtures. National Engineering Lab, East Kilbride, Glasgow, Scotland,.
Iwamoto, M., Y. Yoda, et al. (1978). "Study of metal oxide catalysts by temperature
programmed desorption. 4. Oxygen adsorption on various metal oxides." J. Phys. Chem.
82(24): 2564-2570.
Jackson, S. D., C. A. Hamilton, et al. (2001). "The Hydrogenation of c-5 Alkynes over
Palladium Catalysts." Reaction Kinetics and Catalysis Letters 73(1): 77-82.
Jackson, S. D. and A. Monaghan (2007). "Hydrogenation of unsaturated hydrocarbons--
40 years on: Hydrogenation of 1,3-pentadiene over Pd/alumina." Catalysis Today
Special Issue Dedicated to Mike Winterbottom 128(1-2): 47-51.
Jia, C.-G., F.-Y. Jing, et al. (1994). "Liquid-phase oxidation of alcohols by dioxygen
using oxide-supported platinum catalysts." Journal of Molecular Catalysis 91(1): 139-
147.
Kapteijn, F., G. B. Marin, et al. (1999). "Catalytic reaction engineering." Studies in
Surface Science and Catalysis. 123: 375.
Kawabata, T., Y. Shinozuka, et al. (2005). "Nickel containing Mg-Al hydrotalcite-type
anionic clay catalyst for the oxidation of alcohols with molecular oxygen." Journal of
Molecular Catalysis A: Chemical 236(1-2): 206-215.

209
Kawase, Y., S. K;, et al. (1997). "Gas-Liquid Mass Transfer in Three-Phase Stirred Tank
Reactors: Newtonian and Non-Newtonian Fluids." The Canadian Journal of Chemical
Engineering 75: 1159.
Kazakis, N. A., A. A. Mouza, et al. (2008). "Experimental study of bubble formation at
metal porous spargers: Effect of liquid properties and sparger characteristics on the initial
bubble size distribution." Chemical Engineering Journal 137(2): 265-281.
Kent, j. A. (2007). Kent and Riegel's Handbook of Industrial Chemistry and
Biotechnology.
Keresszegi, C., T. Bürgi, et al. (2002). "On the Role of Oxygen in the Liquid-Phase
Aerobic Oxidation of Alcohols on Palladium." Journal of Catalysis 211(1): 244-251.
Keresszegi, C., D. Ferri, et al. (2005). "On the role of CO formation during the aerobic
oxidation of alcohols on Pd/Al2O3: an in situ attenuated total reflection infrared study."
Journal of Catalysis 234(1): 64-75.
Keresszegi, C., J.-D. Grunwaldt, et al. (2004). "In situ EXAFS study on the oxidation
state of Pd/Al2O3 and Bi-Pd/Al2O3 during the liquid-phase oxidation of 1-
phenylethanol." Journal of Catalysis 222(1): 268-280.
Keresszegi, C., T. Mallat, et al. (2004). "A simple discrimination of the promoter effect in
alcohol oxidation and dehydrogenation over platinum and palladium." Journal of
Catalysis 225(1): 138-146.
Khenkin, A. M. and R. Neumann (2000). "Low-Temperature Activation of Dioxygen and
Hydrocarbon Oxidation Catalyzed by a Phosphovanadomolybdate: Evidence for a Mars-
van Krevelen Type Mechanism in a Homogeneous Liquid Phase13." Angewandte
Chemie 39(22): 4088-4090.
Kimura, H., A. Kimura, et al. (1993). "Palladium based multi-component catalytic
systems for the alcohol to carboxylate oxidation reaction." Applied Catalysis A: General
95(2): 143-169.
Kimura, H., K. Tsuto, et al. (1993). "Selective oxidation of glycerol on a platinum-
bismuth catalyst." Applied Catalysis A: General 96(2): 217-228.
Kluytmans, J. H. J., A. P. Markusse, et al. (2000). "Engineering aspects of the aqueous
noble metal catalysed alcohol oxidation." Catalysis Today 57(1-2): 143-155.
Korovchenko, P., C. Donze, et al. (2007). "Oxidation of primary alcohols with air on
carbon-supported platinum catalysts for the synthesis of aldehydes or acids." Catalysis
Today

210
The Catalytic Approach for the Synthesis of Fine Chemicals: Selected Papers of the 7th
CAFC 121(1-2): 13-21.
Kresta, S. M., Edward PL, et al. (2004). Handbook of Industrial Mixing - Science and
Practice, John Wiley & Sons.
Kreutzer, M. T., F. Kapteijn, et al. (2005). "Multiphase monolith reactors: Chemical
reaction engineering of segmented flow in microchannels." Chemical Engineering
Science
7th International Conference on Gas-Liquid and Gas-Liquid-Solid Reactor Engineering
60(22): 5895-5916.
Kushalkar, K. B. and V. G. Pangarkar (1994). "Particle-Liquid Mass Transfer in Three-
Phase Mechanically Agitated Contactors." Ind. Eng. Chem. Res. 33(7): 1817-1820.
Landon, P., P. J. Collier, et al. (2002). "Direct formation of hydrogen peroxide from
H2/O2 using a gold catalyst." Chemical Communications(18): 2058-2059.
Lee A, F., G. J.J, et al. (2000). "Aspects of allylic alcohol oxidation—a bimetallic
heterogeneous selective oxidation catalyst." Green chemistry 2: 279.
Lemaitre, J., F. Delannay, et al. (1982). "The influence of preparation and doping on the
reducibility of hematite by hydrogen." Journal of Materials Science 17(2): 607-615.
Leung, L. W. H. and M. J. Weaver (1990). "Influence of adsorbed carbon monoxide on
electrocatalytic oxidation of simple organic molecules at platinum and palladium
electrodes in acidic solution: a survey using real-time FTIR spectroscopy." Langmuir
6(2): 323-333.
Levenspiel, O. (1972). Chemical Reaction Engineering. New York, Wiley.
Levenspiel, O. (1999). Chemical Reaction Engineering. USA, John Wiley & Sons.
Levins, D. M. and J. R. Glastonbury (1972). "Application of Kolmogorofff's theory to
particle--liquid mass transfer in agitated vessels." Chemical Engineering Science 27(3):
537-543.
Lewis, R. and R. Gomer (1968). "Adsorption of oxygen on platinum." Surface Science
12(2): 157-176.
Litmans, B. A., I. S. Kukurechenko, et al. (1972). "Investigation of the Liquid Phase
Mass Transfer Coefficient in Baffled Apparatus With Mechanical Agitation." Theoretical
Foundations of Chemical Engineering 6: 689-690.

211
Lu, W.-M., H.-Z. Wu, et al. (1997). "Effects of baffle design on the liquid mixing in an
aerated stirred tank with standard Rushton turbine impellers." Chemical Engineering
Science
Gas-Liquid-Solid Reactor Engineering 52(21-22): 3843-3851.
Makwana, V. D., Y.-C. Son, et al. (2002). "The Role of Lattice Oxygen in Selective
Benzyl Alcohol Oxidation Using OMS-2 Catalyst: A Kinetic and Isotope-Labeling
Study." Journal of Catalysis 210(1): 46-52.
Mallat, T. and A. Baiker (1994). "Oxidation of alcohols with molecular oxygen on
platinum metal catalysts in aqueous solutions." Catalysis Today 19(2): 247-283.
Mallat, T., Z. Bodnar, et al. (1993). "Preparation of Promoted Platinum Catalysts of
Designed Geometry and the Role of Promoters in the Liquid-Phase Oxidation of 1-
Methoxy-2-propanol." Journal of Catalysis 142(1): 237-253.
Mallat, T., Z. Bodnar, et al. (1995). "Selective Oxidation of Cinnamyl Alcohol to
Cinnamaldehyde with Air over Bi-Pt/Alumina Catalysts." Journal of Catalysis 153(1):
131-143.
Markusse, A. P., B. F. M. Kuster, et al. (2001). "Platinum catalysed aqueous methyl
[alpha]--glucopyranoside oxidation in a multiphase redox-cycle reactor." Catalysis Today
66(2-4): 191-197.
Miller, C. and G. Kaibel (2004). "Packings for fixed bed reactors and reactive
distillation." Chemical Engineering Science
ISCRE18 59(22-23): 5373-5379.
Miller, D. N. (1974). "Scale-up of agitated vessels gas-liquid mass transfer." AIChE
Journal 20(3): 445-453.
Miyahara, T., H. Kanzaki, et al. (2001). "Liquid-phase oxidation of benzene to phenol by
CuO-Al2O3 catalysts prepared by co-precipitation method." Journal of Molecular
Catalysis A: Chemical 176(1-2): 141-150.
Mondelli, C., D. Ferri, et al. (2007). "Combined liquid-phase ATR-IR and XAS study of
the Bi-promotion in the aerobic oxidation of benzyl alcohol over Pd/Al2O3." Journal of
Catalysis 252(1): 77-87.
Monteiro, A. C. A. (2005). Hydrotreating: Hydrogenation Studies on Ni-Mo and Ni-
Ru/Alumina Catalysts for the Hydrogenation of Naphtalene. Catalysis and Reaction
Engineering. Birmingham, University of Birmingham.
Muzart, J. (2003). "Palladium-catalysed oxidation of primary and secondary alcohols."
Tetrahedron 59(31): 5789-5816.

212
Nicoletti, J. W. and G. M. Whitesides (1989). "Liquid-phase oxidation of 2-propanol to
acetone by dioxygen using supported platinum catalysts." J. Phys. Chem. 93(2): 759-767.
Nienow, A. W. (1998). "Hydrodynamics of stirred bioreactors." American Society of
Mechanical Engineers 51(1): 4.
Nienow, A. W. (1998). "Hydrodynamics of stirred bioreactors." Applied Mechanics
Review 51(1): 3.
Nienow, A. W. and W. Bujalski (2002). "Recent Studies on Agitated Three-Phase (Gas-
Solid-Liquid) Systems in the Turbulent Regime." Chemical Engineering Research and
Design
Fluid Mixing VII 80(8): 832-838.
Nijhuis, T. A., F. M. Dautzenberg, et al. (2003). "Modeling of monolithic and trickle-bed
reactors for the hydrogenation of styrene." Chemical Engineering Science 58(7): 1113-
1124.
Opre, Z., J.-D. Grunwaldt, et al. (2005). "Selective oxidation of alcohols with oxygen on
Ru-Co-hydroxyapatite: A mechanistic study." Journal of Molecular Catalysis A:
Chemical 242(1-2): 224-232.
Parsons, R. and T. VanderNoot (1988). "The oxidation of small organic molecules : A
survey of recent fuel cell related research." Journal of Electroanalytical Chemistry 257(1-
2): 9-45.
Pastor, E., S. Wasmus, et al. (1993). "Spectroscopic investigations of C3 primary
alcohols on platinum electrodes in acid solutions. : Part I. n-propanol." Journal of
Electroanalytical Chemistry 350(1-2): 97-116.
Perry, R. H. (1997). Perry's Chemical Engineers' Handbook.
Petersen, E. E. (1965). "A general criterion for diffusion influenced chemical reactions in
porous solids." Chemical Engineering Science 20(6): 587-591.
Pintar, A. and J. Levec (1992). "Catalytic liquid-phase oxidation of refractory organics in
waste water." Chemical Engineering Science 47(9-11): 2395-2400.
Pintar, A. and J. Levec (1992). "Catalytic oxidation of organics in aqueous solutions : I.
Kinetics of phenol oxidation." Journal of Catalysis 135(2): 345-357.
Pinxt, H. H. C. M., B. F. M. Kuster, et al. (2000). "Promoter effects in the Pt-catalysed
oxidation of propylene glycol." Applied Catalysis A: General 191(1-2): 45-54.

213
Poling, B. E., J. M. Prausnitz, et al. (2001). Properties of Gases and Liquids, McGraw-
Hill.
Popovic, K. D., N. M. Markovic, et al. (1991). "Structural effects in electrocatalysis :
Oxidation of D-glucose on single crystal platinum electrodes in alkaline solution."
Journal of Electroanalytical Chemistry 313(1-2): 181-199.
Popovic, K. D., A. V. Tripkovic, et al. (1992). "Oxidation of -glucose on single-crystal
platinum electrodes: A mechanistic study." Journal of Electroanalytical Chemistry 339(1-
2): 227-245.
Porta, F. and L. Prati (2004). "Selective oxidation of glycerol to sodium glycerate with
gold-on-carbon catalyst: an insight into reaction selectivity." Journal of Catalysis 224(2):
397-403.
Prati, L. and M. Rossi (1998). "Gold on Carbon as a New Catalyst for Selective Liquid
Phase Oxidation of Diols." Journal of Catalysis 176(2): 552-560.
Prati, L., A. Villa, et al. (2007). "Effect of gold addition on Pt and Pd catalysts in liquid
phase oxidations." Topics in Catalysis 44(1): 319-324.
Prati, L., A. Villa, et al. (2007). "Single-phase gold/palladium catalyst: The nature of
synergistic effect." Catalysis Today 122(3-4): 386-390.
Qu, Z., W. Huang, et al. (2005). "Enhancement of the catalytic performance of
supported-metal catalysts by pretreatment of the support." Journal of Catalysis 234(1):
33-36.
Rajadhyaksha, R. A. and S. L. Karwa (1986). "Solvent effects in catalytic
hydrogenation." Chemical Engineering Science 41(7): 1765-1770.
Ramachandran, P. A. and R. V. Chaudhari (1983). Three-Phase Catalytic Reactors.
Sakata, Y., C. A. van Tol-Koutstaal, et al. (1997). "Selectivity Problems in the Catalytic
Deoxygenation of Benzoic Acid." Journal of Catalysis 169(1): 13-21.
Satterfield, C. N. (1991). Heterogeneous Catalysis in Industrial Practice. Florida.
Schuurman, Y., B. F. M. Kuster, et al. (1992). "Selective oxidation of methyl [alpha]-D-
glucoside on carbon supported platinum: II. Assessment of the Arrhenius and Langmuir
parameters." Applied Catalysis A: General 89(1): 31-46.
Schwank, J. (1985). "Gold in Bimetallic Catalysts." Gold Bulletin 18(1): 2.

214
Sheng, J., H. Meng, et al. (2000). "A large eddy PIV method for turbulence dissipation
rate estimation." Chemical Engineering Science 55(20): 4423-4434.
Smith, T. R., S. J. Xia, et al. "Effect of Hydrogen Sulfide on the Direct Internal
Reforming of Methane in Solid Oxide Fuel Cells." Applied Catalysis A: General In
Press, Accepted Manuscript.
Souto, R. M., J. L. Rodríguez, et al. (2000). "Electrochemical reactions of benzoic acid
on platinum and palladium studied by DEMS. Comparison with benzyl alcohol." Journal
of Electroanalytical Chemistry 494(2): 127-135.
Srinivas, N., V. Radha Rani, et al. (2001). "Liquid phase selective oxidation of alcohols
over modified molecular sieves." Journal of Molecular Catalysis A: Chemical 172(1-2):
187-191.
Teschner, D., E. Vass, et al. (2006). "Alkyne hydrogenation over Pd catalysts: A new
paradigm." Journal of Catalysis 242(1): 26-37.
Tokarev, A. V., E. V. Murzina, et al. (2006). "Kinetic behaviour of electrochemical
potential in three-phase heterogeneous catalytic oxidation reactions." Journal of
Molecular Catalysis A: Chemical 255(1-2): 199-208.
Tsujino, T., S. Ohigashi, et al. (1992). "Oxidation of propylene glycol and lactic acid to
pyruvic acid in aqueous phase catalyzed by lead-modified palladium-on-carbon and
related systems." Journal of Molecular Catalysis 71(1): 25-35.
Twigg, M. V. and Richardson (2002). "Theory and applications of ceramic foam
catalysts." Trans IChemE 80(A).
Van den Tillaart, J. A. A., B. F. M. Kuster, et al. (1994). "Oxidative dehydrogenation of
aqueous ethanol on a carbon supported platinum catalyst." Applied Catalysis A: General
120(1): 127-145.
Van't Riet, K. (1979). "Review of Measuring Methods and Results in Nonviscous Gas-
Liquid Mass Transfer in Stirred Vessels." Ind. Eng. Chem. Proc. Des. Dev. 18(3): 357-
364.
Vayenas, C. G., S. Bebelis, et al. (2001). Electrochemical Activation of Catalysis -
Promotion, Electrochemical Promotion, and Metal-Support Interactions., Springer -
Verlag.
Vleeming, J. H., B. F. M. Kuster, et al. (1997). "Graphite-Supported Platinum Catalysts:
Effects of Gas and Aqueous Phase Treatments." Journal of Catalysis 166(2): 148-159.
215
Wang, D., A. Villa, et al. (2008). "Bimetallic Gold/Palladium Catalysts: Correlation
between Nanostructure and Synergistic Effects
doi:10.1021/jp800805e." The Journal of Physical Chemistry C 112(23): 8617-8622.
Waterhouse, G. I. N., G. A. Bowmaker, et al. (2001). "The thermal decomposition of
silver (I, III) oxide: A combined XRD, FT-IR and Raman spectroscopic study." Physical
Chemistry Chemical Physics 3(17): 3838-3845.
Weisz, P. B. and C. D. Prater (1954). Interpretation of Measurements in Experimental
Catalysis
Advances in Catalysis. V. I. K. a. E. K. R. W.G. Frankenburg, Academic Press: 143-196.
Weller, S. (1956). "Analysis of kinetic data for heterogeneous reactions." AIChE Journal
2(1): 59-62.
Weng, L.-T. and B. Delmon (1992). "Phase cooperation and remote control effects in
selective oxidation catalysts." Applied Catalysis A: General 81(2): 141-213.
Wenkin, M., P. Ruiz, et al. (2002). "The role of bismuth as promoter in Pd-Bi catalysts
for the selective oxidation of glucose to gluconate." Journal of Molecular Catalysis A:
Chemical 180(1-2): 141-159.
Wieland, H. (1921). "Mechanism of oxidation processes. IV." Berichte der Deutschen
Chemischen Gesellschaft [Abteilung] B: Abhandlungen 54: 2353.
Winterbottom, J. M. and King (1999). Reactor Design for Chemical Engineers.
Wu, H. and G. K. Patterson (1989). "Laser-Doppler measurements of turbulent-flow
parameters in a stirred mixer." Chemical Engineering Science 44(10): 2207-2221.
Yagi, H. and F. Yoshida (1975). "Gas Absorption by Newtonian and Non-Newtonian
Fluids in Sparged Agitated Vessels." Ind. Eng. Chem. Proc. Des. Dev. 14(4): 488-493.
Yaws, C. L. (2003). Yaws' Handbook of Thermodynamic and Physical Properties of
Chemical Compounds., Knovel.
Yei, L. H. E., B. Beden, et al. (1988). "Electrocatalytic oxidation of glucose at platinum
in alkaline medium: on the role of temperature." Journal of Electroanalytical Chemistry
246(2): 349-362.
Zelenay, P. and J. Sobkowski (1984). "The inhibitory effect of some surface active
organic compounds on the electrooxidation of strongly adsorbed species derived from
HCOOH on polycrystalline platinum." Journal of Electroanalytical Chemistry 176(1-2):
209-224.

216
Zeng, X., J. Quaye, et al. (2004). "Partition of hematite in the Triton X-100/Dextran
aqueous biphase system." Colloids and Surfaces A: Physicochemical and Engineering
Aspects 246(1-3): 135-145.
Zhou and Kresta (1996). "Impact of tank geometry on the maximum turbulence energy
dissipation rate for impellers." AIChE Journal 42(9): 2476-2490.
Zwietering, T. N. (1958). "Suspending of solid particles in liquid by agitators." Chemical
Engineering Science 8(3-4): 244-253.