Embed Size (px)
Citation preview

Hertz Vehicle Financing II LPSeries 2016-3
Monthly Reporting
Calculations as of: 1/31/2017Lease Determination Date: 2/17/2017Reporting Month February-17Related Month January-17
Hertz Asset Backed Securitization Reporting Portal: A copy of this Monthly Noteholder’s Statement is available for your reference in electronic form at the following password protected website: https://abs.hertz.com
1

HVF II Group I Monthly Noteholder ReportingCalculations as of: 1/31/2017Lease Determination Date 2/17/2017Reporting Month February-17Related Month January-17
HVF I Series 2013-G1 & HVF II Group I Aggregate Asset Amount Classification and Detail
HVF I Series 2013-G1 & HVF II Group I Aggregate Asset Amount HVF I Series 2013-G1 & HVF II Group I Aggregate Asset Amount($s) (% HVF I Series 13-G1 & HVF II Group I Aggregate Asset Amount)
Group I ManufacturerGroup I NBV of Group I
Eligible VehiclesGroup I Manufacturer
ReceivablesGroup I Due and Unpaid Lease Payment Amounts
TotalGroup I NBV of Group I
Eligible VehiclesGroup I Manufacturer
ReceivablesGroup I Due and Unpaid Lease Payment Amounts
Total
Acura - - - - 0.00% 0.00% 0.00% 0.00%Aston Martin - - - - 0.00% 0.00% 0.00% 0.00%Audi 10,073,959.63 - - 10,073,959.63 0.17% 0.00% 0.00% 0.17%Bentley - - - - 0.00% 0.00% 0.00% 0.00%BMW 96,581.71 - - 96,581.71 0.00% 0.00% 0.00% 0.00%Chrysler 459,717,324.14 60,520,834.15 2,784,493.18 523,022,651.47 7.55% 0.99% 0.05% 8.59%Citroen - - - - 0.00% 0.00% 0.00% 0.00%DAF - - - - 0.00% 0.00% 0.00% 0.00%Daihatsu - - - - 0.00% 0.00% 0.00% 0.00%Ferrari - - - - 0.00% 0.00% 0.00% 0.00%Fiat 23,999.83 34,528.41 557.71 59,085.95 0.00% 0.00% 0.00% 0.00%Ford 388,575,205.82 254,869.89 1,813,384.59 390,643,460.30 6.38% 0.00% 0.03% 6.42%GM 1,564,498,975.11 2,835,633.31 5,290,594.37 1,572,625,202.79 25.70% 0.05% 0.09% 25.84%Hino - - - - 0.00% 0.00% 0.00% 0.00%Honda 2,531,826.47 - 14,092.06 2,545,918.53 0.04% 0.00% 0.00% 0.04%Hyundai 685,263,685.11 1,583,835.64 2,914,979.58 689,762,500.33 11.26% 0.03% 0.05% 11.33%Isuzu - - - - 0.00% 0.00% 0.00% 0.00%IVECO - - - - 0.00% 0.00% 0.00% 0.00%Jaguar 1,467,983.25 - 1,414.59 1,469,397.84 0.02% 0.00% 0.00% 0.02%Kia 431,517,133.72 6,822,830.67 1,391,878.21 439,731,842.60 7.09% 0.11% 0.02% 7.22%Lamborghini - - - - 0.00% 0.00% 0.00% 0.00%LandRover 12,486,877.35 - 16,903.37 12,503,780.72 0.21% 0.00% 0.00% 0.21%Lexus 116,678.28 - - 116,678.28 0.00% 0.00% 0.00% 0.00%Lotus - - - - 0.00% 0.00% 0.00% 0.00%Maserati - - - - 0.00% 0.00% 0.00% 0.00%Mazda 137,272,588.81 - 560,141.68 137,832,730.49 2.26% 0.00% 0.01% 2.26%Mercedes 51,756,042.24 - 437,068.80 52,193,111.04 0.85% 0.00% 0.01% 0.86%Mini - - - - 0.00% 0.00% 0.00% 0.00%Mitsubishi 1,478,568.51 - 40,899.44 1,519,467.95 0.02% 0.00% 0.00% 0.02%Nissan 1,543,899,793.38 - 6,486,965.19 1,550,386,758.57 25.36% 0.00% 0.11% 25.47%Peugeot - - - - 0.00% 0.00% 0.00% 0.00%Porsche 10,300,599.56 - 59,978.48 10,360,578.04 0.17% 0.00% 0.00% 0.17%Renault - - - - 0.00% 0.00% 0.00% 0.00%Rolls-Royce - - - - 0.00% 0.00% 0.00% 0.00%Seat - - - - 0.00% 0.00% 0.00% 0.00%Skoda - - - - 0.00% 0.00% 0.00% 0.00%SMART - - - - 0.00% 0.00% 0.00% 0.00%Subaru 23,706,084.72 2,885.89 - 23,708,970.61 0.39% 0.00% 0.00% 0.39%Suzuki - - - - 0.00% 0.00% 0.00% 0.00%Tesla 3,695,662.07 - - 3,695,662.07 0.06% 0.00% 0.00% 0.06%Toyota 479,183,397.75 31,448,054.09 3,032,844.00 513,664,295.84 7.87% 0.52% 0.05% 8.44%Volkswagen 123,094,452.30 - 677,000.83 123,771,453.13 2.02% 0.00% 0.01% 2.03%Volvo 17,489,940.28 9,499,044.20 91,700.19 27,080,684.67 0.29% 0.16% 0.00% 0.44%NON_SPECIFIED 71,602.40 - - 71,602.40 0.00% 0.00% 0.00% 0.00%Totals 5,948,318,962.44 113,002,516.25 25,614,896.27 6,086,936,374.96 97.72% 1.86% 0.42% 100.00%Series 2013-G1 Cash Amount 10.03 0.00%Series 2013-G1 Aggregate Asset Amount 6,086,936,384.99 100.00% 2

HVF II Group I Monthly Noteholder ReportingCalculations as of: 1/31/2017Lease Determination Date 2/17/2017Reporting Month February-17Related Month January-17
HVF II Group I OEM Rating Classification
OEM Classification
Group I ManufacturerDBRS Long Term Issuer
Rating
DBRS Senior Unsecured
Rating
Moody's Long Term
Corporate Family Rating
Moodys Long Term Rating
Moodys Senior Unsecured
Rating
Fitch Long Term Issuer
Default Rating
Fitch Senior Unsecured
Rating
S&P Long Term Local Issuer
Rating
DBRS Equivalent
Rating
Series DBRS Investment Grade /
Non-Investment Grade
Series DBRS Credit Classification
Series Moody's Investment Grade /
Non-Investment Grade
Series Moody's Credit Classification
Acura AH Not Rated Not Rated A1 Not Rated Not Rated Not Rated A+ AH IG HIG IG HIG Aston Martin Not Rated Not Rated Not Rated Not Rated Not Rated Not Rated Not Rated Not Rated Not Rated NR NR NR NR Audi BBBH Not Rated Not Rated A3 (P)A3 BBB+ BBB+ BBB+ BBBH IG LIG IG HIG Bentley BBBH Not Rated Not Rated A3 (P)A3 BBB+ BBB+ BBB+ BBBH IG LIG IG HIG BMW A Not Rated Not Rated A2 A2 Not Rated Not Rated A+ A IG HIG IG HIG Chrysler BBL BBL Ba3 Ba3 B1 BB- Not Rated BB BBL NIG HNIG NIG HNIGCitroen BB BB Ba2 Ba2 Ba2 BB+ BB+ NR BB NIG HNIG NIG HNIGDAF AAL Not Rated Not Rated (P)A1 A1 Not Rated Not Rated A+ AAL IG HIG IG HIG Daihatsu Not Rated Not Rated Not Rated Not Rated Not Rated Not Rated Not Rated Not Rated Not Rated NR NR NR NR Ferrari BBL BBL Ba3 Ba3 B1 BB- Not Rated BB BBL NIG HNIG NIG HNIGFiat BBL BBL Ba3 Ba3 B1 BB- Not Rated BB BBL NIG HNIG NIG HNIGFord BBB BBB WR Baa2 Baa2 BBB BBB BBB BBB IG LIG IG LIGGM BBB Not Rated WR Ba1 Ba1 BBB- BBB- BBB BBB IG LIG IG LIGHino Not Rated Not Rated Not Rated Not Rated WR Not Rated Not Rated Not Rated Not Rated NR NR NR NR Honda AH Not Rated Not Rated A1 Not Rated Not Rated Not Rated A+ AH IG HIG IG HIG Hyundai Not Rated Not Rated Not Rated Baa1 NR Not Rated BBB+ A- BBBH IG LIG IG LIGIsuzu Not Rated Not Rated Not Rated Not Rated Not Rated Not Rated Not Rated Not Rated Not Rated NR NR NR NR IVECO BBH Not Rated Ba1 Ba1 Not Rated Not Rated Not Rated BB+ BBH NIG HNIG NIG HNIGJaguar Not Rated Not Rated Ba1 Ba1 Ba1 Not Rated Not Rated BB+ BBH NIG HNIG NIG HNIGKia Not Rated Not Rated WR Baa1 Baa1 Not Rated BBB+ A- BBBH IG LIG IG LIGLamborghini BBBH Not Rated Not Rated A3 (P)A3 BBB+ BBB+ BBB+ BBBH IG LIG IG HIG LandRover Not Rated Not Rated Ba1 Ba1 Ba1 Not Rated Not Rated BB+ BBH NIG HNIG NIG HNIGLexus AAL Not Rated Not Rated Aa3 Aa3 Not Rated A AA- AAL IG HIG IG HIG Lotus Not Rated Not Rated Not Rated Not Rated Not Rated Not Rated Not Rated Not Rated Not Rated NR NR NR NR Maserati BBL BBL Ba3 Ba3 B1 BB- Not Rated BB BBL NIG HNIG NIG HNIGMazda Not Rated Not Rated Not Rated Not Rated WR Not Rated Not Rated NR Not Rated NR NR NR NR Mercedes AL AL Not Rated A3 A3 A- A- A AL IG HIG IG HIG Mini A Not Rated Not Rated A2 A2 Not Rated Not Rated A+ A IG HIG IG HIG Mitsubishi Not Rated Not Rated Not Rated Not Rated WR Not Rated Not Rated BB- BBL NIG HNIG NR NR Nissan AL AL Not Rated A3 WR Not Rated BBB+ A- AL IG HIG IG HIG Peugeot BB BB Ba2 Ba2 Ba2 BB+ BB+ NR BB NIG HNIG NIG HNIGPorsche BBBH Not Rated Not Rated A3 (P)A3 BBB+ BBB+ BBB+ BBBH IG LIG IG HIG Renault BBBL BBBL WR Baa3 Baa3 BBB- BBB- BBB- BBBL IG LIG IG LIGRolls-Royce A Not Rated Not Rated A2 A2 Not Rated Not Rated A+ A IG HIG IG HIG Seat BBBH Not Rated Not Rated A3 (P)A3 BBB+ BBB+ BBB+ BBBH IG LIG IG HIG Skoda BBBH Not Rated Not Rated A3 (P)A3 BBB+ BBB+ BBB+ BBBH IG LIG IG HIG SMART AL AL Not Rated A3 A3 A- A- A AL IG HIG IG HIG Subaru Not Rated Not Rated Not Rated Not Rated Not Rated Not Rated Not Rated NR Not Rated NR NR NR NR Suzuki Not Rated Not Rated Not Rated Not Rated Not Rated Not Rated Not Rated NR Not Rated NR NR NR NR Tesla Not Rated Not Rated Not Rated Not Rated Not Rated Not Rated Not Rated B-u Not Rated NR NR NR NR Toyota AAL Not Rated Not Rated Aa3 Aa3 Not Rated A AA- AAL IG HIG IG HIG Volkswagen BBBH Not Rated Not Rated A3 (P)A3 BBB+ BBB+ BBB+ BBBH IG LIG IG HIG Volvo Not Rated Not Rated Not Rated Not Rated Not Rated Not Rated Not Rated Not Rated Not Rated NR NR NR NR NON_SPECIFIED NOT Rated NOT Rated NOT Rated NOT Rated NOT Rated NOT Rated NOT Rated NOT Rated Not Rated NR NR NR NRAdditional OEM 2 NR NR NR NR Additional OEM 3 NR NR NR NR Additional OEM 4 NR NR NR NR
* Note that any series-specific defined terms have omitted the series numbering so report can be used generically among series with identical requirements.
3

HVF II Group I Monthly Noteholder ReportingCalculations as of: 1/31/2017Lease Determination Date 2/17/2017Reporting Month February-17Related Month January-17
HVF II Group I Standard DBRS Aggregate Asset Amount Classification and DetailOEM Classification NBV OEM Receivables Group I Due & Unpaid Lease Amounts Ineligibles
Group I Manufacturer
Series DBRS Investment Grade /
Non-Investment Grade
Series DBRS Credit Classification
Group I NBV of Group I Eligible Non-Program Vehicles (DBRS)
Group I NBV of Group I Eligible Program Vehicles
(DBRS)
Series DBRS Eligible Manufacturer Receivables
Redesignation to Risk & Program Payments (Accrued & Unpaid)
Casualty Payment Amount (Accrued &
Unpaid)
Excess Damage & Mileage Charges
(Accrued & Unpaid)
Early Program Return Charges (Accrued &
Unpaid)
Final Base Rent (Accrued & Unpaid)
Monthly Base Rent (Accrued & Unpaid)
Series DBRS Remainder AAA Amount
AAA Contribution
Acura IG HIG - - - - - - - - - - - Aston Martin NR NR - - - - - - - - - - - Audi IG LIG 10,073,959.63 - - - - - - - - - 10,073,959.63 Bentley IG LIG - - - - - - - - - - - BMW IG HIG 96,581.71 - - - - - - - - - 96,581.71 Chrysler NIG HNIG 364,349,886.94 95,367,437.20 58,812,878.47 - 1,420,073.77 204,839.60 246,868.08 912,711.73 - 1,707,955.68 523,022,651.47 Citroen NIG HNIG - - - - - - - - - - - DAF IG HIG - - - - - - - - - - - Daihatsu NR NR - - - - - - - - - - - Ferrari NIG HNIG - - - - - - - - - - - Fiat NIG HNIG 23,999.83 - - - - - - 557.71 - 34,528.41 59,085.95 Ford IG LIG 388,447,115.35 128,090.47 253,557.96 - 1,463,150.64 1,500.03 - 348,733.92 - 1,311.93 390,643,460.30 GM IG LIG 988,345,053.07 576,153,922.04 2,832,198.17 - 4,435,542.73 56,047.60 1,770.68 797,233.36 - 3,435.14 1,572,625,202.79 Hino NR NR - - - - - - - - - - - Honda IG HIG 2,531,826.47 - - - 10,764.93 - - 3,327.13 - - 2,545,918.53 Hyundai IG LIG 683,753,934.74 1,509,750.37 1,556,529.91 - 2,549,548.22 14,479.81 484.10 350,467.45 - 27,305.73 689,762,500.33 Isuzu NR NR - - - - - - - - - - - IVECO NIG HNIG - - - - - - - - - - - Jaguar NIG HNIG 1,467,983.25 - - - - - - 1,414.59 - - 1,469,397.84 Kia IG LIG 325,917,078.84 105,600,054.88 6,792,635.31 - 1,086,043.90 23,026.72 772.26 282,035.33 - 30,195.36 439,731,842.60 Lamborghini IG LIG - - - - - - - - - - - LandRover NIG HNIG 12,486,877.35 - - - - - - 16,903.37 - - 12,503,780.72 Lexus IG HIG 116,678.28 - - - - - - - - - 116,678.28 Lotus NR NR - - - - - - - - - - - Maserati NIG HNIG - - - - - - - - - - - Mazda NR NR 137,235,968.40 36,620.41 - - 501,736.53 - - 58,405.15 - - 137,832,730.49 Mercedes IG HIG 51,756,042.24 - - - 371,140.53 - - 65,928.27 - - 52,193,111.04 Mini IG HIG - - - - - - - - - - - Mitsubishi NIG HNIG 1,478,568.51 - - - 17,517.55 - - 23,381.89 - - 1,519,467.95 Nissan IG HIG 1,543,899,793.38 - - - 5,636,032.47 - - 850,932.72 - - 1,550,386,758.57 Peugeot NIG HNIG - - - - - - - - - - - Porsche IG LIG 10,300,599.56 - - - 54,311.26 - - 5,667.22 - - 10,360,578.04 Renault IG LIG - - - - - - - - - - - Rolls-Royce IG HIG - - - - - - - - - - - Seat IG LIG - - - - - - - - - - - Skoda IG LIG - - - - - - - - - - - SMART IG HIG - - - - - - - - - - - Subaru NR NR 1,908,162.77 21,797,921.95 - - - - - - - 2,885.89 23,708,970.61 Suzuki NR NR - - - - - - - - - - - Tesla NR NR 3,695,662.07 - - - - - - - - - 3,695,662.07 Toyota IG HIG 469,534,543.80 9,648,853.95 31,385,615.71 - 2,194,104.06 237,189.03 43,739.10 557,811.81 - 62,438.38 513,664,295.84 Volkswagen IG LIG 123,094,452.30 - - - 541,496.71 - - 135,504.12 - - 123,771,453.13 Volvo NR NR 13,022,978.06 4,466,962.22 9,479,692.74 - 20,594.13 15,254.29 10,786.84 45,064.93 - 19,351.46 27,080,684.67 NON_SPECIFIED NR NR - 71,602.40 - - - - - - - - 71,602.40 Totals 5,133,537,746.55 814,781,215.89 111,113,108.27 - 20,302,057.43 552,337.08 304,421.06 4,456,080.70 - 1,889,407.98 6,086,936,374.96
Group I Cash Amount 10.11 * Note that any series-specific defined terms have omitted the series numbering so report can be used generically among series with identical requirements. Series-Level DBRS AAA Amount 6,086,936,385.07
4

HVF II Group I Monthly Noteholder ReportingCalculations as of: 1/31/2017Lease Determination Date 2/17/2017Reporting Month February-17Related Month January-17
HVF II Group I Standard DBRS Aggregate Asset Amount Classification and DetailOEM Classification NBV OEM Receivables Group I Due & Unpaid Lease Amounts Ineligibles
Group I Manufacturer
Series DBRS Investment Grade /
Non-Investment Grade
Series DBRS Credit Classification
Group I NBV of Group I Eligible Non-Program
Vehicles (DBRS)
Group I NBV of Group I Eligible Program Vehicles
(DBRS)
Series DBRS Eligible Manufacturer Receivables
Redesignation to Risk & Program Payments (Accrued & Unpaid)
Casualty Payment Amount (Accrued &
Unpaid)
Excess Damage & Mileage Charges
(Accrued & Unpaid)
Early Program Return Charges (Accrued &
Unpaid)
Final Base Rent (Accrued & Unpaid)
Monthly Base Rent (Accrued & Unpaid)
Series DBRS Remainder AAA
AmountAAA Contribution
Acura IG HIG 0.00% 0.00% 0.00% 0.00% 0.00% 0.00% 0.00% 0.00% 0.00% 0.00% 0.00%Aston Martin NR NR 0.00% 0.00% 0.00% 0.00% 0.00% 0.00% 0.00% 0.00% 0.00% 0.00% 0.00%Audi IG LIG 0.17% 0.00% 0.00% 0.00% 0.00% 0.00% 0.00% 0.00% 0.00% 0.00% 0.17%Bentley IG LIG 0.00% 0.00% 0.00% 0.00% 0.00% 0.00% 0.00% 0.00% 0.00% 0.00% 0.00%BMW IG HIG 0.00% 0.00% 0.00% 0.00% 0.00% 0.00% 0.00% 0.00% 0.00% 0.00% 0.00%Chrysler NIG HNIG 5.99% 1.57% 0.97% 0.00% 0.02% 0.00% 0.00% 0.01% 0.00% 0.03% 8.59%Citroen NIG HNIG 0.00% 0.00% 0.00% 0.00% 0.00% 0.00% 0.00% 0.00% 0.00% 0.00% 0.00%DAF IG HIG 0.00% 0.00% 0.00% 0.00% 0.00% 0.00% 0.00% 0.00% 0.00% 0.00% 0.00%Daihatsu NR NR 0.00% 0.00% 0.00% 0.00% 0.00% 0.00% 0.00% 0.00% 0.00% 0.00% 0.00%Ferrari NIG HNIG 0.00% 0.00% 0.00% 0.00% 0.00% 0.00% 0.00% 0.00% 0.00% 0.00% 0.00%Fiat NIG HNIG 0.00% 0.00% 0.00% 0.00% 0.00% 0.00% 0.00% 0.00% 0.00% 0.00% 0.00%Ford IG LIG 6.38% 0.00% 0.00% 0.00% 0.02% 0.00% 0.00% 0.01% 0.00% 0.00% 6.42%GM IG LIG 16.24% 9.47% 0.05% 0.00% 0.07% 0.00% 0.00% 0.01% 0.00% 0.00% 25.84%Hino NR NR 0.00% 0.00% 0.00% 0.00% 0.00% 0.00% 0.00% 0.00% 0.00% 0.00% 0.00%Honda IG HIG 0.04% 0.00% 0.00% 0.00% 0.00% 0.00% 0.00% 0.00% 0.00% 0.00% 0.04%Hyundai IG LIG 11.23% 0.02% 0.03% 0.00% 0.04% 0.00% 0.00% 0.01% 0.00% 0.00% 11.33%Isuzu NR NR 0.00% 0.00% 0.00% 0.00% 0.00% 0.00% 0.00% 0.00% 0.00% 0.00% 0.00%IVECO NIG HNIG 0.00% 0.00% 0.00% 0.00% 0.00% 0.00% 0.00% 0.00% 0.00% 0.00% 0.00%Jaguar NIG HNIG 0.02% 0.00% 0.00% 0.00% 0.00% 0.00% 0.00% 0.00% 0.00% 0.00% 0.02%Kia IG LIG 5.35% 1.73% 0.11% 0.00% 0.02% 0.00% 0.00% 0.00% 0.00% 0.00% 7.22%Lamborghini IG LIG 0.00% 0.00% 0.00% 0.00% 0.00% 0.00% 0.00% 0.00% 0.00% 0.00% 0.00%LandRover NIG HNIG 0.21% 0.00% 0.00% 0.00% 0.00% 0.00% 0.00% 0.00% 0.00% 0.00% 0.21%Lexus IG HIG 0.00% 0.00% 0.00% 0.00% 0.00% 0.00% 0.00% 0.00% 0.00% 0.00% 0.00%Lotus NR NR 0.00% 0.00% 0.00% 0.00% 0.00% 0.00% 0.00% 0.00% 0.00% 0.00% 0.00%Maserati NIG HNIG 0.00% 0.00% 0.00% 0.00% 0.00% 0.00% 0.00% 0.00% 0.00% 0.00% 0.00%Mazda NR NR 2.25% 0.00% 0.00% 0.00% 0.01% 0.00% 0.00% 0.00% 0.00% 0.00% 2.26%Mercedes IG HIG 0.85% 0.00% 0.00% 0.00% 0.01% 0.00% 0.00% 0.00% 0.00% 0.00% 0.86%Mini IG HIG 0.00% 0.00% 0.00% 0.00% 0.00% 0.00% 0.00% 0.00% 0.00% 0.00% 0.00%Mitsubishi NIG HNIG 0.02% 0.00% 0.00% 0.00% 0.00% 0.00% 0.00% 0.00% 0.00% 0.00% 0.02%Nissan IG HIG 25.36% 0.00% 0.00% 0.00% 0.09% 0.00% 0.00% 0.01% 0.00% 0.00% 25.47%Peugeot NIG HNIG 0.00% 0.00% 0.00% 0.00% 0.00% 0.00% 0.00% 0.00% 0.00% 0.00% 0.00%Porsche IG LIG 0.17% 0.00% 0.00% 0.00% 0.00% 0.00% 0.00% 0.00% 0.00% 0.00% 0.17%Renault IG LIG 0.00% 0.00% 0.00% 0.00% 0.00% 0.00% 0.00% 0.00% 0.00% 0.00% 0.00%Rolls-Royce IG HIG 0.00% 0.00% 0.00% 0.00% 0.00% 0.00% 0.00% 0.00% 0.00% 0.00% 0.00%Seat IG LIG 0.00% 0.00% 0.00% 0.00% 0.00% 0.00% 0.00% 0.00% 0.00% 0.00% 0.00%Skoda IG LIG 0.00% 0.00% 0.00% 0.00% 0.00% 0.00% 0.00% 0.00% 0.00% 0.00% 0.00%SMART IG HIG 0.00% 0.00% 0.00% 0.00% 0.00% 0.00% 0.00% 0.00% 0.00% 0.00% 0.00%Subaru NR NR 0.03% 0.36% 0.00% 0.00% 0.00% 0.00% 0.00% 0.00% 0.00% 0.00% 0.39%Suzuki NR NR 0.00% 0.00% 0.00% 0.00% 0.00% 0.00% 0.00% 0.00% 0.00% 0.00% 0.00%Tesla NR NR 0.06% 0.00% 0.00% 0.00% 0.00% 0.00% 0.00% 0.00% 0.00% 0.00% 0.06%Toyota IG HIG 7.71% 0.16% 0.52% 0.00% 0.04% 0.00% 0.00% 0.01% 0.00% 0.00% 8.44%Volkswagen IG LIG 2.02% 0.00% 0.00% 0.00% 0.01% 0.00% 0.00% 0.00% 0.00% 0.00% 2.03%Volvo NR NR 0.21% 0.07% 0.16% 0.00% 0.00% 0.00% 0.00% 0.00% 0.00% 0.00% 0.44%NON_SPECIFIED NR NR 0.00% 0.00% 0.00% 0.00% 0.00% 0.00% 0.00% 0.00% 0.00% 0.00% 0.00%Totals 84.34% 13.39% 1.83% 0.00% 0.33% 0.01% 0.01% 0.07% 0.00% 0.03% 100.00%
Group I Cash Amount 0.00%* Note that any series-specific defined terms have omitted the series numbering so report can be used generically among series with identical requirements. Series-Level DBRS AAA Amount 100.00%
5

HVF II Group I Monthly Noteholder ReportingCalculations as of: 1/31/2017Lease Determination Date 2/17/2017Reporting Month February-17Related Month January-17
HVF II Group I Standard Moodys Aggregate Asset Amount Classification and DetailOEM Classification NBV OEM Receivables Group I Due & Unpaid Lease Amounts Ineligibles
Group I Manufacturer
Series Mdys Investment Grade /
Non-Investment Grade
Series Mdys Credit Classification
Group I NBV of Group I Eligible Non-Program Vehicles (Mdys)
Group I NBV of Group I Eligible Program Vehicles
(Mdys)
Series Mdys Eligible Manufacturer Receivables
Redesignation to Risk & Program Payments (Accrued & Unpaid)
Casualty Payment Amount (Accrued &
Unpaid)
Excess Damage & Mileage Charges
(Accrued & Unpaid)
Early Program Return Charges (Accrued &
Unpaid)
Final Base Rent (Accrued & Unpaid)
Monthly Base Rent (Accrued & Unpaid)
Series Mdys Remainder AAA Amount
AAA Contribution
Acura IG HIG - - - - - - - - - - - Aston Martin NR NR - - - - - - - - - - - Audi IG HIG 10,073,959.63 - - - - - - - - - 10,073,959.63 Bentley IG HIG - - - - - - - - - - - BMW IG HIG 96,581.71 - - - - - - - - - 96,581.71 Chrysler NIG HNIG 364,349,886.94 95,367,437.20 58,812,878.47 - 1,420,073.77 204,839.60 246,868.08 912,711.73 - 1,707,955.68 523,022,651.47 Citroen NIG HNIG - - - - - - - - - - - DAF IG HIG - - - - - - - - - - - Daihatsu NR NR - - - - - - - - - - - Ferrari NIG HNIG - - - - - - - - - - - Fiat NIG HNIG 23,999.83 - - - - - - 557.71 - 34,528.41 59,085.95 Ford IG LIG 388,447,115.35 128,090.47 253,557.96 - 1,463,150.64 1,500.03 - 348,733.92 - 1,311.93 390,643,460.30 GM IG LIG 988,345,053.07 576,153,922.04 2,832,198.17 - 4,435,542.73 56,047.60 1,770.68 797,233.36 - 3,435.14 1,572,625,202.79 Hino NR NR - - - - - - - - - - - Honda IG HIG 2,531,826.47 - - - 10,764.93 - - 3,327.13 - - 2,545,918.53 Hyundai IG LIG 683,753,934.74 1,509,750.37 1,556,529.91 - 2,549,548.22 14,479.81 484.10 350,467.45 - 27,305.73 689,762,500.33 Isuzu NR NR - - - - - - - - - - - IVECO NIG HNIG - - - - - - - - - - - Jaguar NIG HNIG 1,467,983.25 - - - - - - 1,414.59 - - 1,469,397.84 Kia IG LIG 325,917,078.84 105,600,054.88 6,792,635.31 - 1,086,043.90 23,026.72 772.26 282,035.33 - 30,195.36 439,731,842.60 Lamborghini IG HIG - - - - - - - - - - - LandRover NIG HNIG 12,486,877.35 - - - - - - 16,903.37 - - 12,503,780.72 Lexus IG HIG 116,678.28 - - - - - - - - - 116,678.28 Lotus NR NR - - - - - - - - - - - Maserati NIG HNIG - - - - - - - - - - - Mazda NR NR 137,235,968.40 36,620.41 - - 501,736.53 - - 58,405.15 - - 137,832,730.49 Mercedes IG HIG 51,756,042.24 - - - 371,140.53 - - 65,928.27 - - 52,193,111.04 Mini IG HIG - - - - - - - - - - - Mitsubishi NR NR 1,478,568.51 - - - 17,517.55 - - 23,381.89 - - 1,519,467.95 Nissan IG HIG 1,543,899,793.38 - - - 5,636,032.47 - - 850,932.72 - - 1,550,386,758.57 Peugeot NIG HNIG - - - - - - - - - - - Porsche IG HIG 10,300,599.56 - - - 54,311.26 - - 5,667.22 - - 10,360,578.04 Renault IG LIG - - - - - - - - - - - Rolls-Royce IG HIG - - - - - - - - - - - Seat IG HIG - - - - - - - - - - - Skoda IG HIG - - - - - - - - - - - SMART IG HIG - - - - - - - - - - - Subaru NR NR 1,908,162.77 21,797,921.95 - - - - - - - 2,885.89 23,708,970.61 Suzuki NR NR - - - - - - - - - - - Tesla NR NR 3,695,662.07 - - - - - - - - - 3,695,662.07 Toyota IG HIG 469,534,543.80 9,648,853.95 31,385,615.71 - 2,194,104.06 237,189.03 43,739.10 557,811.81 - 62,438.38 513,664,295.84 Volkswagen IG HIG 123,094,452.30 - - - 541,496.71 - - 135,504.12 - - 123,771,453.13 Volvo NR NR 13,022,978.06 4,466,962.22 9,479,692.74 - 20,594.13 15,254.29 10,786.84 45,064.93 - 19,351.46 27,080,684.67 NON_SPECIFIED NR NR - 71,602.40 - - - - - - - - 71,602.40 Totals 5,133,537,746.55 814,781,215.89 111,113,108.27 - 20,302,057.43 552,337.08 304,421.06 4,456,080.70 - 1,889,407.98 6,086,936,374.96
Group I Cash Amount 10.11 * Note that any series-specific defined terms have omitted the series numbering so report can be used generically among series with identical requirements. Series Mdys AAA Amount 6,086,936,385.07
6

HVF II Group I Monthly Noteholder ReportingCalculations as of: 1/31/2017Lease Determination Date 2/17/2017Reporting Month February-17Related Month January-17
HVF II Group I Standard Moodys Aggregate Asset Amount Classification and DetailOEM Classification NBV OEM Receivables Group I Due & Unpaid Lease Amounts Ineligibles
Group I Manufacturer
Series Mdys Investment Grade /
Non-Investment Grade
Series Mdys Credit Classification
Group I NBV of Group I Eligible Non-Program
Vehicles (Mdys)
Group I NBV of Group I Eligible Program Vehicles (Mdys)
Series Mdys Eligible Manufacturer Receivables
Redesignation to Risk & Program Payments (Accrued & Unpaid)
Casualty Payment Amount (Accrued &
Unpaid)
Excess Damage & Mileage Charges
(Accrued & Unpaid)
Early Program Return Charges (Accrued &
Unpaid)
Final Base Rent (Accrued & Unpaid)
Monthly Base Rent (Accrued & Unpaid)
Series Mdys Remainder AAA
AmountAAA Contribution
Acura IG HIG 0.00% 0.00% 0.00% 0.00% 0.00% 0.00% 0.00% 0.00% 0.00% 0.00% 0.00%Aston Martin NR NR 0.00% 0.00% 0.00% 0.00% 0.00% 0.00% 0.00% 0.00% 0.00% 0.00% 0.00%Audi IG HIG 0.17% 0.00% 0.00% 0.00% 0.00% 0.00% 0.00% 0.00% 0.00% 0.00% 0.17%Bentley IG HIG 0.00% 0.00% 0.00% 0.00% 0.00% 0.00% 0.00% 0.00% 0.00% 0.00% 0.00%BMW IG HIG 0.00% 0.00% 0.00% 0.00% 0.00% 0.00% 0.00% 0.00% 0.00% 0.00% 0.00%Chrysler NIG HNIG 5.99% 1.57% 0.97% 0.00% 0.02% 0.00% 0.00% 0.01% 0.00% 0.03% 8.59%Citroen NIG HNIG 0.00% 0.00% 0.00% 0.00% 0.00% 0.00% 0.00% 0.00% 0.00% 0.00% 0.00%DAF IG HIG 0.00% 0.00% 0.00% 0.00% 0.00% 0.00% 0.00% 0.00% 0.00% 0.00% 0.00%Daihatsu NR NR 0.00% 0.00% 0.00% 0.00% 0.00% 0.00% 0.00% 0.00% 0.00% 0.00% 0.00%Ferrari NIG HNIG 0.00% 0.00% 0.00% 0.00% 0.00% 0.00% 0.00% 0.00% 0.00% 0.00% 0.00%Fiat NIG HNIG 0.00% 0.00% 0.00% 0.00% 0.00% 0.00% 0.00% 0.00% 0.00% 0.00% 0.00%Ford IG LIG 6.38% 0.00% 0.00% 0.00% 0.02% 0.00% 0.00% 0.01% 0.00% 0.00% 6.42%GM IG LIG 16.24% 9.47% 0.05% 0.00% 0.07% 0.00% 0.00% 0.01% 0.00% 0.00% 25.84%Hino NR NR 0.00% 0.00% 0.00% 0.00% 0.00% 0.00% 0.00% 0.00% 0.00% 0.00% 0.00%Honda IG HIG 0.04% 0.00% 0.00% 0.00% 0.00% 0.00% 0.00% 0.00% 0.00% 0.00% 0.04%Hyundai IG LIG 11.23% 0.02% 0.03% 0.00% 0.04% 0.00% 0.00% 0.01% 0.00% 0.00% 11.33%Isuzu NR NR 0.00% 0.00% 0.00% 0.00% 0.00% 0.00% 0.00% 0.00% 0.00% 0.00% 0.00%IVECO NIG HNIG 0.00% 0.00% 0.00% 0.00% 0.00% 0.00% 0.00% 0.00% 0.00% 0.00% 0.00%Jaguar NIG HNIG 0.02% 0.00% 0.00% 0.00% 0.00% 0.00% 0.00% 0.00% 0.00% 0.00% 0.02%Kia IG LIG 5.35% 1.73% 0.11% 0.00% 0.02% 0.00% 0.00% 0.00% 0.00% 0.00% 7.22%Lamborghini IG HIG 0.00% 0.00% 0.00% 0.00% 0.00% 0.00% 0.00% 0.00% 0.00% 0.00% 0.00%LandRover NIG HNIG 0.21% 0.00% 0.00% 0.00% 0.00% 0.00% 0.00% 0.00% 0.00% 0.00% 0.21%Lexus IG HIG 0.00% 0.00% 0.00% 0.00% 0.00% 0.00% 0.00% 0.00% 0.00% 0.00% 0.00%Lotus NR NR 0.00% 0.00% 0.00% 0.00% 0.00% 0.00% 0.00% 0.00% 0.00% 0.00% 0.00%Maserati NIG HNIG 0.00% 0.00% 0.00% 0.00% 0.00% 0.00% 0.00% 0.00% 0.00% 0.00% 0.00%Mazda NR NR 2.25% 0.00% 0.00% 0.00% 0.01% 0.00% 0.00% 0.00% 0.00% 0.00% 2.26%Mercedes IG HIG 0.85% 0.00% 0.00% 0.00% 0.01% 0.00% 0.00% 0.00% 0.00% 0.00% 0.86%Mini IG HIG 0.00% 0.00% 0.00% 0.00% 0.00% 0.00% 0.00% 0.00% 0.00% 0.00% 0.00%Mitsubishi NR NR 0.02% 0.00% 0.00% 0.00% 0.00% 0.00% 0.00% 0.00% 0.00% 0.00% 0.02%Nissan IG HIG 25.36% 0.00% 0.00% 0.00% 0.09% 0.00% 0.00% 0.01% 0.00% 0.00% 25.47%Peugeot NIG HNIG 0.00% 0.00% 0.00% 0.00% 0.00% 0.00% 0.00% 0.00% 0.00% 0.00% 0.00%Porsche IG HIG 0.17% 0.00% 0.00% 0.00% 0.00% 0.00% 0.00% 0.00% 0.00% 0.00% 0.17%Renault IG LIG 0.00% 0.00% 0.00% 0.00% 0.00% 0.00% 0.00% 0.00% 0.00% 0.00% 0.00%Rolls-Royce IG HIG 0.00% 0.00% 0.00% 0.00% 0.00% 0.00% 0.00% 0.00% 0.00% 0.00% 0.00%Seat IG HIG 0.00% 0.00% 0.00% 0.00% 0.00% 0.00% 0.00% 0.00% 0.00% 0.00% 0.00%Skoda IG HIG 0.00% 0.00% 0.00% 0.00% 0.00% 0.00% 0.00% 0.00% 0.00% 0.00% 0.00%SMART IG HIG 0.00% 0.00% 0.00% 0.00% 0.00% 0.00% 0.00% 0.00% 0.00% 0.00% 0.00%Subaru NR NR 0.03% 0.36% 0.00% 0.00% 0.00% 0.00% 0.00% 0.00% 0.00% 0.00% 0.39%Suzuki NR NR 0.00% 0.00% 0.00% 0.00% 0.00% 0.00% 0.00% 0.00% 0.00% 0.00% 0.00%Tesla NR NR 0.06% 0.00% 0.00% 0.00% 0.00% 0.00% 0.00% 0.00% 0.00% 0.00% 0.06%Toyota IG HIG 7.71% 0.16% 0.52% 0.00% 0.04% 0.00% 0.00% 0.01% 0.00% 0.00% 8.44%Volkswagen IG HIG 2.02% 0.00% 0.00% 0.00% 0.01% 0.00% 0.00% 0.00% 0.00% 0.00% 2.03%Volvo NR NR 0.21% 0.07% 0.16% 0.00% 0.00% 0.00% 0.00% 0.00% 0.00% 0.00% 0.44%NON_SPECIFIED NR NR 0.00% 0.00% 0.00% 0.00% 0.00% 0.00% 0.00% 0.00% 0.00% 0.00% 0.00%Totals 84.34% 13.39% 1.83% 0.00% 0.33% 0.01% 0.01% 0.07% 0.00% 0.03% 100.00%
Group I Cash Amount 0.00%* Note that any series-specific defined terms have omitted the series numbering so report can be used generically among series with identical requirements. Series Mdys AAA Amount 100.00%
7

HVF II Group I Monthly Noteholder ReportingCalculations as of: 1/31/2017Lease Determination Date 2/17/2017Reporting Month February-17Related Month January-17
HVF II Group I Standard DBRS Summary Concentration Excess AllocationsOEM Classification Category-Specific Excesses Total Concentration Excess Allocations
Group I ManufacturerSeries DBRS Credit
ClassificationDBRS Non-Liened Vehicle
Concentration Excess Amount
DBRS Non-Investment Grade (High) Program Receivable Concentration
Excess Amount
DBRS Manufacturer Concentration Excess Amount
Aggregate Group I NBV of Group I Eligible Non-Program Vehicles
allocated to Series DBRS Concentration Excess Amount
Aggregate Group I NBV of Group I Eligible Program Vehicles allocated
to Series DBRS Concentration Excess Amount
Eligible Manufacturer Receivables allocated to Series DBRS
Concentration Excess Amount
Series DBRS Concentration Excess Amount
Acura HIG - - - - - - - Aston Martin NR - - - - - - - Audi LIG - - - - - - - Bentley LIG - - - - - - - BMW HIG - - - - - - - Chrysler HNIG - - - - - - - Citroen HNIG - - - - - - - DAF HIG - - - - - - - Daihatsu NR - - - - - - - Ferrari HNIG - - - - - - - Fiat HNIG - - - - - - - Ford LIG - - - - - - - GM LIG - - - - - - - Hino NR - - - - - - - Honda HIG - - - - - - - Hyundai LIG - - - - - - - Isuzu NR - - - - - - - IVECO HNIG - - - - - - - Jaguar HNIG - - - - - - - Kia LIG - - - - - - - Lamborghini LIG - - - - - - - LandRover HNIG - - - - - - - Lexus HIG - - - - - - - Lotus NR - - - - - - - Maserati HNIG - - - - - - - Mazda NR - - - - - - - Mercedes HIG - - - - - - - Mini HIG - - - - - - - Mitsubishi HNIG - - - - - - - Nissan HIG - - - - - - - Peugeot HNIG - - - - - - - Porsche LIG - - - - - - - Renault LIG - - - - - - - Rolls-Royce HIG - - - - - - - Seat LIG - - - - - - - Skoda LIG - - - - - - - SMART HIG - - - - - - - Subaru NR - - - - - - - Suzuki NR - - - - - - - Tesla NR - - - - - - - Toyota HIG - - - - - - - Volkswagen LIG - - - - - - - Volvo NR - - - - - - - NON_SPECIFIED NR - - - - - - - Total - - - - * Note that any series-specific defined terms have omitted the series numbering so report can be used generically among series with identical requirements. Memo: Series Non-Liened Vehicle Amount $2,537,559.75
8

HVF II Group I Monthly Noteholder ReportingCalculations as of: 1/31/2017Lease Determination Date 2/17/2017Reporting Month February-17Related Month January-17
HVF II Group I Standard Moody's Summary Concentration Excess AllocationsOEM Classification Category Specific Limits Total Concentration Excess Allocations
Group I ManufacturerSeries Mdys Credit
ClassificationMdys Non-Liened Vehicle
Concentration Excess Amount
Mdys Non-Investment Grade (High) Program Receivable Concentration
Excess Amount
Mdys Manufacturer Concentration Excess Amount
Aggregate Group I NBV of Group I Eligible Non-Program Vehicles
allocated to Series Mdys Concentration Excess Amount
Aggregate Group I NBV of Group I Eligible Program Vehicles allocated
to Series Mdys Concentration Excess Amount
Eligible Manufacturer Receivables allocated to Series Mdys
Concentration Excess Amount
Series Mdys Concentration Excess Amount
Acura HIG - - - - - - - Aston Martin NR - - - - - - - Audi HIG - - - - - - - Bentley HIG - - - - - - - BMW HIG - - - - - - - Chrysler HNIG - - - - - - - Citroen HNIG - - - - - - - DAF HIG - - - - - - - Daihatsu NR - - - - - - - Ferrari HNIG - - - - - - - Fiat HNIG - - - - - - - Ford LIG - - - - - - - GM LIG - - - - - - - Hino NR - - - - - - - Honda HIG - - - - - - - Hyundai LIG - - - - - - - Isuzu NR - - - - - - - IVECO HNIG - - - - - - - Jaguar HNIG - - - - - - - Kia LIG - - - - - - - Lamborghini HIG - - - - - - - LandRover HNIG - - - - - - - Lexus HIG - - - - - - - Lotus NR - - - - - - - Maserati HNIG - - - - - - - Mazda NR - - - - - - - Mercedes HIG - - - - - - - Mini HIG - - - - - - - Mitsubishi NR - - - - - - - Nissan HIG - - - - - - - Peugeot HNIG - - - - - - - Porsche HIG - - - - - - - Renault LIG - - - - - - - Rolls-Royce HIG - - - - - - - Seat HIG - - - - - - - Skoda HIG - - - - - - - SMART HIG - - - - - - - Subaru NR - - - - - - - Suzuki NR - - - - - - - Tesla NR - - - - - - - Toyota HIG - - - - - - - Volkswagen HIG - - - - - - - Volvo NR - - - - - - - NON_SPECIFIED NR - - - - - - - Total - - - - * Note that any series-specific defined terms have omitted the series numbering so report can be used generically among series with identical requirements. Memo: Series Non-Liened Vehicle Amount $2,537,559.75
9

HVF II Group I Monthly Noteholder ReportingCalculations as of: 1/31/2017Lease Determination Date 2/17/2017Reporting Month February-17Related Month January-17
HVF II Group I & Group II Combined Third-Party Market Value Test ResultsHVF II Group I & II Combined Third-Party Market Value Test Results
Lease Determination Date In Month Report
Calculated
First Day of Calendar Month
Report Calculated
Number of Group I / II Non-Program Vehicles
Aggregate Group I / II Non-Program Fleet Market
Value**
Aggregate Group I / II Net Book Value of Non-Program Vehicles
Group I / II Market Value One-Month Average
Group I / II Market Value Three-Month
Average***
Minimum Group I / II Market Value Average
in Trailing Twelve Calendar Months
Minimum Group I / II Disposition Proceeds
Percentage Average in Trailing Twelve Calendar
Months
Applicable Group I Failure Percentage****
Percentage VINs with Monthly NADA
Mark
Percentage VINs with Monthly
Blackbook Mark
12/18/13 12/1/2013 177,126 3,048,689,093 2,914,185,303 104.62% 98.19% 1.42%1/17/14 1/1/2014 179,078 3,136,735,227 2,858,739,622 109.72% 96.12% 1.54%2/18/14 2/1/2014 173,060 3,071,124,696 2,735,585,512 112.27% 108.79% 108.79% 100.00% 0.00% 96.10% 2.32%3/18/14 3/1/2014 163,707 2,943,514,884 2,571,572,394 114.46% 112.07% 108.79% 100.00% 0.00% 97.16% 1.45%4/18/14 4/1/2014 166,463 2,994,801,586 2,622,035,523 114.22% 113.62% 108.79% 102.76% 0.00% 92.43% 4.13%5/19/14 5/1/2014 163,585 2,928,275,638 2,574,708,866 113.73% 114.14% 108.79% 102.76% 0.00% 93.42% 4.42%6/18/14 6/1/2014 172,015 3,069,142,960 2,733,586,438 112.28% 113.39% 108.79% 102.76% 0.00% 90.42% 5.63%7/18/14 7/1/2014 180,454 3,175,281,693 2,883,810,528 110.11% 111.97% 108.79% 102.76% 0.00% 90.49% 5.68%8/18/14 8/1/2014 171,344 2,937,525,121 2,751,082,738 106.78% 109.72% 108.79% 102.76% 0.00% 91.43% 6.39%9/18/14 9/1/2014 173,673 2,842,543,923 2,766,682,838 102.74% 106.59% 106.59% 102.76% 0.00% 88.73% 8.15%
10/20/14 10/1/2014 166,010 2,641,403,200 2,610,569,540 101.18% 103.61% 103.61% 102.76% 0.00% 91.91% 4.96%11/18/14 11/1/2014 160,302 2,472,057,500 2,494,203,964 99.11% 101.07% 101.07% 100.71% 0.00% 92.37% 4.10%12/18/14 12/1/2014 158,038 2,357,362,907 2,344,172,976 100.56% 100.29% 100.29% 99.62% 0.38% 89.49% 5.03%
1/16/15 1/1/2015 176,074 2,681,741,455 2,609,447,235 102.77% 100.85% 100.29% 99.62% 0.38% 81.81% 8.18%2/18/15 2/1/2015 191,754 3,035,492,988 2,912,759,797 104.21% 102.65% 100.29% 99.62% 0.38% 75.80% 13.22%3/18/15 3/1/2015 238,477 3,737,045,578 3,569,558,115 104.69% 103.99% 100.29% 99.62% 0.38% 79.99% 14.58%4/20/15 4/1/2015 249,231 3,910,876,304 3,750,945,178 104.26% 104.40% 100.29% 99.62% 0.38% 79.51% 17.10%5/18/15 5/1/2015 243,193 3,782,123,584 3,662,537,335 103.27% 104.07% 100.29% 99.62% 0.38% 80.66% 16.05%6/18/15 6/1/2015 246,274 3,860,058,275 3,802,623,008 101.51% 103.00% 100.29% 99.62% 0.38% 80.82% 12.32%7/20/15 7/1/2015 241,384 3,736,100,907 3,759,932,196 99.37% 101.36% 100.29% 99.62% 0.38% 81.91% 14.11%8/18/15 8/1/2015 236,056 3,578,377,149 3,578,017,504 100.01% 100.30% 100.29% 99.62% 0.38% 86.35% 11.12%9/18/15 9/1/2015 232,602 3,458,155,882 3,332,348,643 103.78% 100.96% 100.29% 99.62% 0.38% 87.02% 11.01%
10/19/15 10/1/2015 233,543 3,460,193,023 3,357,858,494 103.05% 102.23% 100.29% 99.62% 0.38% 86.83% 9.69%11/18/15 11/1/2015 247,197 3,698,549,151 3,666,774,250 100.87% 102.51% 100.29% 99.62% 0.38% 80.13% 14.53%12/18/15 12/1/2015 254,850 3,789,456,604 3,821,830,366 99.15% 100.94% 100.30% 100.92% 0.00% 75.45% 18.72%
1/15/16 1/1/2016 277,903 4,222,088,502 4,097,953,062 103.03% 101.07% 100.30% 105.04% 0.00% 72.48% 22.48%2/18/16 2/1/2016 295,213 4,717,853,858 4,562,724,457 103.40% 101.98% 100.30% 109.65% 0.00% 69.31% 22.00%3/18/16 3/1/2016 315,149 5,210,996,904 5,106,376,803 102.05% 102.79% 100.30% 112.53% 0.00% 65.08% 23.77%4/18/16 4/1/2016 334,489 5,516,842,646 5,561,779,457 99.19% 101.41% 100.30% 112.53% 0.00% 63.69% 27.37%5/18/16 5/1/2016 342,887 5,598,879,315 5,597,534,219 100.02% 100.38% 100.30% 112.53% 0.00% 64.72% 25.43%6/20/16 6/1/2016 360,987 6,000,691,759 5,928,808,970 101.21% 100.17% 100.17% 112.53% 0.00% 71.35% 21.72%7/18/16 7/1/2016 368,987 5,988,326,934 5,998,075,869 99.84% 100.36% 100.17% 112.53% 0.00% 84.63% 11.36%8/18/16 8/1/2016 366,873 5,800,391,471 5,840,519,235 99.31% 100.12% 100.12% 112.53% 0.00% 86.30% 10.24%9/19/16 9/1/2016 354,904 5,529,465,596 5,337,770,286 103.59% 100.83% 100.12% 112.89% 0.00% 89.48% 7.86%
10/18/16 10/1/2016 349,668 5,455,511,307 5,392,663,268 101.17% 101.29% 100.12% 112.89% 0.00% 86.68% 8.46%11/17/16 11/1/2016 348,946 5,472,496,648 5,489,887,348 99.68% 101.46% 100.12% 114.09% 0.00% 87.43% 7.32%12/19/16 12/1/2016 352,033 5,623,145,630 5,648,748,943 99.55% 100.12% 100.12% 114.09% 0.00% 85.30% 10.44%
1/18/17 1/1/2017 356,440 5,717,801,897 5,665,839,492 100.92% 100.05% 100.05% 117.66% 0.00% 84.25% 10.31%2/17/17 2/1/2017 - - - 0.00% 0.00%3/20/17 3/1/2017 - - - 0.00% 0.00%4/18/17 4/1/2017 - - - 0.00% 0.00%5/18/17 5/1/2017 - - - 0.00% 0.00%6/19/17 6/1/2017 - - - 0.00% 0.00%7/18/17 7/1/2017 - - - 0.00% 0.00%8/18/17 8/1/2017 - - - 0.00% 0.00%9/18/17 9/1/2017 - - - 0.00% 0.00%
10/18/17 10/1/2017 - - - 0.00% 0.00%11/17/17 11/1/2017 - - - 0.00% 0.00%12/18/17 12/1/2017 - - - 0.00% 0.00%
* Note that any series-specific defined terms have omitted the series numbering so report can be used generically among series with identical requirements.** Defined as the "Series [__] Non-Program Market Value" at the series level.*** Defined as the "Series [__] Market Value Average" at the series level. Requirement to not exceed 100% ignored for illustrative purposes.**** Defined as the "Series [___] Failure Percentage" at the series level.
10

HVF II Group I Monthly Noteholder ReportingCalculations as of: 1/31/2017Lease Determination Date 2/17/2017Reporting Month February-17Related Month January-17
HVF II Group I & Group II Combined Disposition Proceeds Test ResultsHVF II Group I & Group II Combined Disposition Proceeds Test Results
Lease Determination Date in Month
Report Calculated
Last Day of Related
Calendar Month
Group I / II Eligible NBV as of Last Day of
Calendar Month
Aggregate Disposition Proceeds
In Related Month
Cumulative Disposition Proceeds Since Most Recent Measurement
Month Ended
Disposition Proceeds In
Measurement Month if
Measurement Month Ended
Aggregate Group I NBV of Group 1 / II Eligible Non-Program Vehicles
with Disposition Date in Related Month
Aggregate Group I NBV of Group 1 / II
Eligible Non-Program Vehicles with Disposition Date Since Most
Recent Measurement Month Ended
Aggregate Group I NBV of Group 1 / II
Eligible Non-Program Vehicles with Disposition
Date in Measurement
Month (if Measurement Month Ended)
Series Disposed Vehicle
Threshold Number
Count of Group I / II Non-Program Vehicles
Disposed In Related Month
Cumulative Dispositions by Vehicle Count
Since Most Recent
Measurement Month Ended
Measurement Month Ended
Indicator
Group I / II Non-Program Vehicle
Disposition Proceeds
Percentage Average for One
Month
Group I / II Non-Program Vehicle
Disposition Proceeds
Percentage Average
Minimum Group I / II Non-Program
Vehicle Disposition
Proceeds Percentage Average in
Trailing Twelve Calendar Months
Minimum Group I / II
Market Value
Average in Trailing Twelve
Calendar Months
Applicable Group I Failure
Percentage
112/18/13 11/30/2013 3,331,544,639 10,139,420 10,139,420 10,221,862 10,221,862 6,500 677 677 No 99.19%
1/17/14 12/31/2013 3,365,386,218 76,417,228 86,556,648 83,750,364 93,972,226 6,500 5,537 6,214 No 92.11%2/18/14 1/31/2014 3,492,436,598 139,332,917 225,889,564 225,889,564 134,386,921 228,359,147 228,359,147 6,500 10,382 16,596 Yes 98.92% 100.00% 108.79% 0.00%3/18/14 2/28/2014 3,308,190,912 177,170,414 177,170,414 177,170,414 170,445,794 170,445,794 170,445,794 6,500 13,567 13,567 Yes 103.95% 100.00% 108.79% 0.00%4/18/14 3/31/2014 3,367,410,368 181,207,861 181,207,861 181,207,861 169,793,860 169,793,860 169,793,860 6,500 13,216 13,216 Yes 106.72% 102.76% 102.76% 108.79% 0.00%5/19/14 4/30/2014 3,339,051,441 202,129,193 202,129,193 202,129,193 183,684,887 183,684,887 183,684,887 6,500 14,382 14,382 Yes 110.04% 106.98% 102.76% 108.79% 0.00%6/18/14 5/31/2014 3,499,199,994 147,056,694 147,056,694 147,056,694 133,084,224 133,084,224 133,084,224 6,500 10,613 10,613 Yes 110.50% 109.01% 102.76% 108.79% 0.00%7/18/14 6/30/2014 3,414,580,238 127,985,719 127,985,719 127,985,719 116,600,760 116,600,760 116,600,760 6,500 9,520 9,520 Yes 109.76% 110.11% 102.76% 108.79% 0.00%8/18/14 7/31/2014 3,647,248,336 98,621,967 98,621,967 98,621,967 91,849,886 91,849,886 91,849,886 6,500 7,383 7,383 Yes 107.37% 109.41% 102.76% 108.79% 0.00%9/18/14 8/31/2014 3,676,758,378 106,887,786 106,970,641 106,970,641 102,031,804 102,103,596 102,103,596 6,500 8,360 8,360 Yes 104.77% 107.41% 102.76% 106.59% 0.00%
10/20/14 9/30/2014 3,787,995,191 138,539,071 138,539,071 138,539,071 136,011,660 136,011,660 136,011,660 6,500 11,232 11,232 Yes 101.86% 104.29% 102.76% 103.61% 0.00%11/18/14 10/31/2014 3,645,185,002 264,174,840 264,174,840 264,174,840 267,990,925 267,990,925 267,990,925 6,500 21,886 21,886 Yes 98.58% 100.71% 100.71% 101.07% 0.00%12/18/14 11/30/2014 3,610,518,409 198,914,946 198,914,946 198,914,946 199,909,600 199,909,600 199,909,600 6,500 16,154 16,154 Yes 99.50% 99.62% 99.62% 100.29% 0.38%
1/16/15 12/31/2014 4,216,605,334 203,538,439 203,538,439 203,538,439 192,641,317 192,641,317 192,641,317 6,500 16,242 16,242 Yes 105.66% 100.92% 99.62% 100.29% 0.38%2/18/15 1/31/2015 4,486,964,483 182,460,000 182,460,000 182,460,000 164,313,631 164,313,631 164,313,631 6,500 14,103 14,103 Yes 111.04% 105.04% 99.62% 100.29% 0.38%3/18/15 2/28/2015 5,459,270,662 175,011,807 175,011,807 175,011,807 154,698,028 154,698,028 154,698,028 10,000 13,692 13,692 Yes 113.13% 109.65% 99.62% 100.29% 0.38%4/20/15 3/31/2015 6,404,785,792 223,036,926 223,036,926 223,036,926 195,424,552 195,424,552 195,424,552 13,500 16,524 16,524 Yes 114.13% 112.84% 99.62% 100.29% 0.38%5/18/15 4/30/2015 6,477,232,786 309,784,887 309,784,887 309,784,887 268,544,592 268,544,592 268,544,592 13,500 22,264 22,264 Yes 115.36% 114.41% 99.62% 100.29% 0.38%6/18/15 5/31/2015 6,671,663,153 277,788,984 277,788,984 277,788,984 244,980,404 244,980,404 244,980,404 13,500 21,409 21,409 Yes 113.39% 114.34% 99.62% 100.29% 0.38%7/20/15 6/30/2015 7,084,593,768 282,275,863 282,275,863 282,275,863 253,160,556 253,160,556 253,160,556 13,500 22,551 22,551 Yes 111.50% 113.46% 99.62% 100.29% 0.38%8/18/15 7/31/2015 6,954,048,770 243,812,773 243,812,773 243,812,773 216,231,997 216,231,997 216,231,997 13,500 20,122 20,122 Yes 112.76% 112.53% 99.62% 100.29% 0.38%9/18/15 8/31/2015 6,646,830,443 137,852,991 137,852,991 120,727,885 120,727,885 13,500 11,611 11,611 No 112.53% 99.62% 100.29% 0.38%
10/19/15 9/30/2015 6,087,617,474 121,074,605 258,927,595 258,927,595 105,245,874 225,973,758 225,973,758 13,500 10,143 21,754 Yes 114.58% 112.89% 99.62% 100.29% 0.38%11/18/15 10/31/2015 6,101,105,850 96,580,442 96,580,442 83,325,548 83,325,548 13,500 8,062 8,062 No 112.89% 99.62% 100.29% 0.38%12/18/15 11/30/2015 6,163,947,077 93,838,316 190,418,758 190,418,758 82,024,616 165,350,163 165,350,163 13,500 7,954 16,016 Yes 115.16% 114.09% 100.92% 100.30% 0.00%
1/15/16 12/31/2015 5,859,675,609 71,135,074 71,135,074 60,307,876 60,307,876 10,000 5,979 5,979 No 114.09% 105.04% 100.30% 0.00%2/18/16 1/31/2016 5,589,269,718 101,776,565 172,911,639 172,911,639 77,245,454 137,553,330 137,553,330 10,000 9,491 15,470 Yes 125.71% 117.66% 109.65% 100.30% 0.00%3/18/16 2/29/2016 6,075,337,538 126,592,480 126,592,480 97,137,854 97,137,854 13,500 10,993 10,993 No 117.66% 112.53% 100.30% 0.00%4/18/16 3/31/2016 6,832,210,677 195,817,070 322,409,550 322,409,550 153,727,241 250,865,095 250,865,095 13,500 16,896 27,889 Yes 128.52% 123.83% 112.53% 100.30% 0.00%5/18/16 4/30/2016 7,256,423,601 208,376,407 208,376,407 208,376,407 160,987,990 160,987,990 160,987,990 13,500 17,805 17,805 Yes 129.44% 128.08% 112.53% 100.30% 0.00%6/20/16 5/31/2016 7,154,056,915 197,527,749 197,527,749 197,527,749 151,197,450 151,197,450 151,197,450 13,500 15,358 15,358 Yes 130.64% 129.35% 112.53% 100.17% 0.00%7/18/16 6/30/2016 7,362,273,469 120,360,741 120,360,741 95,072,721 95,072,721 13,500 8,522 8,522 No 129.35% 112.53% 100.17% 0.00%8/18/16 7/31/2016 7,289,039,418 69,453,752 189,814,493 189,814,493 53,630,239 148,702,960 148,702,960 13,500 5,157 13,679 Yes 127.65% 129.25% 112.53% 100.12% 0.00%9/19/16 8/31/2016 6,925,794,775 89,707,374 89,707,374 73,436,100 73,436,100 13,500 7,198 7,198 No 129.25% 112.89% 100.12% 0.00%
10/18/16 9/30/2016 6,332,273,609 123,582,518 213,289,891 213,289,891 100,878,201 174,314,301 174,314,301 13,500 9,788 16,986 Yes 122.36% 126.66% 112.89% 100.12% 0.00%11/17/16 10/31/2016 6,236,360,106 122,177,597 122,177,597 105,821,057 105,821,057 13,500 9,931 9,931 No 126.66% 114.09% 100.12% 0.00%12/19/16 11/30/2016 6,241,994,215 119,292,004 241,469,601 241,469,601 105,073,221 210,894,277 210,894,277 13,500 9,532 19,463 Yes 114.50% 120.73% 114.09% 100.12% 0.00%
1/18/17 12/31/2016 6,589,648,990 85,138,119 85,138,119 71,852,625 71,852,625 13,500 6,940 6,940 No 120.73% 117.66% 100.05% 0.00%2/17/17 1/31/2017 - - - - 3/20/17 2/28/2017 - - - - 4/18/17 3/31/2017 - - - - 5/18/17 4/30/2017 - - - - 6/19/17 5/31/2017 - - - - 7/18/17 6/30/2017 - - - - 8/18/17 7/31/2017 - - - - 9/18/17 8/31/2017 - - - -
10/18/17 9/30/2017 - - - - 11/17/17 10/31/2017 - - - - 12/18/17 11/30/2017 - - - -
1/18/18 12/31/2017 - - - - 0.00%* Note that any series-specific defined terms have omitted the series numbering so report can be used generically among series with identical requirements.
11

HVF II Series 2016-3 Monthly Noteholder ReportingCalculations as of: 1/31/2017Lease Determination Date 2/17/2017Reporting Month February-17Related Month January-17Series 2016-3(Terms marked with an * indicate terms that are not defined in the documentation)
HVF II Leasing-Company-Level Asset Coverage & Note Balance Reporting
Designation HVF II Series 2013-G1 Series Specific Asset Coverage Calculations Operation
HVF I Series 2013-G1 Adjusted ACTA Calculation
A Series 2013-G1 Principal Amount 5,392,197,560.64 B Series 2013-G1 Advance Rate 95%C Series 2013-G1 Asset Coverage Threshold Amount 5,675,997,432.26 A / BD Series 2013-G1 Aggregate Asset Amount 6,086,936,384.99
Series 2013-G1 Aggregate Asset Amount Excess / (Deficiency)* 410,938,952.73 D - CSeries 2013-G1 Aggregate Asset Amount Deficiency Exists* FALSE
Designation HVF II Group I Leasing Company Note Principal Balance Adequacy Calculations Operation
Group I Leasing Company Note Principal Balance Adequacy Calculations
E Aggregate Group I Leasing Company Note Principal Amount 5,392,197,560.64 F Aggregate Group I Series Adjusted Principal Amount 5,059,728,417.60
Aggregate Group I Leasing Company Note Principal Balance Excess / (Deficiency)* 332,469,143.05 E - FAggregate Group I Leasing Company Note Principal Balance Deficiency Exists* FALSE
12

HVF II Series 2016-3 Monthly Noteholder ReportingCalculations as of: 1/31/2017Lease Determination Date 2/17/2017Reporting Month February-17Related Month January-17Series 2016-3(Terms marked with an * indicate terms that are not defined in the documentation)
HVF II Level Series-Specific Reporting
Designation HVF II Series 2016-3 Series-Specific Values Operation
HVF II Series 2016-3 Outstanding Principal Balances
G Class A Principal Amount 299,979,000.00 H Class B Principal Amount 77,116,000.00 I Class C Principal Amount 22,905,000.00 J Class D Principal Amount 24,177,000.00 K Series 2016-3 Principal Amount 424,177,000.00 G + H + I + J
HVF II Series 2016-3 Account Balances
L Series 2016-3 Principal Collection Account Amount 16,064,470.34 M Series 2016-3 Interest Collection Account (amount) - N Class A/B/C/D Available Reserve Account Amount -
Total Series 2016-3 Non-Letter of Credit Cash Amount* 16,064,470.34 L + M + N
HVF II Series 2016-3 Letter of Credit Values
O Class A/B/C/D Letter of Credit Amount 9,543,983.00
HVF II Series 2016-3 Adjusted Principal Amount
Series 2016-3 Principal Amount 424,177,000.00 KSeries 2016-3 Principal Collection Account Amount 16,064,470.34 L
P Series 2016-3 Adjusted Principal Amount 408,112,529.66 K - L
HVF II Series 2016-3 Credit Enhancement Calculations
HVF II Series 2016-3 DBRS Series-Specific Required Credit Enhancement Calculations
Series 2016-3 DBRS AAA ComponentSeries 2016-3 DBRS AAA
Component Amount*Series 2016-3 DBRS
Baseline Advance Rates
Series 2016-3 DBRS Allocable Concentration Excess
Amount
Series 2016-3 DBRS Concentration Excess
Advance Rate Adjustment
Series 2016-3 DBRS Concentration Adjusted
Advance Rate
MTM / Disposition Testing Advance Rate Adjustment
Series 2016-3 DBRS Adjusted Advance Rate
Series 2016-3 DBRS Eligible Investment Grade Program Vehicles*
693,040,671.71 91.00% - 0.00% 91.00% 91.00%
Series 2016-3 DBRS Eligible Investment Grade Program Receivables*
42,820,537.06 91.00% - 0.00% 91.00% 91.00%
Series 2016-3 DBRS Eligible Non-Investment Grade Program Vehicles*
121,740,544.18 89.00% - 0.00% 89.00% 89.00%
Series 2016-3 DBRS Eligible Non-Investment Grade (High) Program Receivables*
58,812,878.47 89.00% - 0.00% 89.00% 89.00%
Series 2016-3 DBRS Eligible Non-Investment Grade (Low) Program Receivables*
9,479,692.74 0.00% - 0.00% 0.00% 0.00%
Series 2016-3 DBRS Eligible Investment Grade Non-Program Vehicles*
4,597,867,659.37 86.75% - 0.00% 86.75% 0.0000% 86.75%
Series 2016-3 DBRS Eligible Non-Investment Grade Non-Program Vehicles*
535,670,087.18 84.00% - 0.00% 84.00% 0.0000% 84.00%
Group I Cash Amount 10.11 100.00% 100%Series 2016-3 DBRS Remainder AAA Amount 1,889,407.98 0.00% 0.00%Group I Due & Unpaid Lease Payment Amounts 25,614,896.27
Total 6,086,936,385.07 Series 2016-3 DBRS Blended Advance Rate:
86.93%
HVF II Series 2016-3 Moody's Series-Specific Required Credit Enhancement Calculations
Series 2016-3 Mdys AAA ComponentSeries 2016-3 Mdys AAA
Component AmountSeries 2016-3 Mdys
Baseline Advance Rates
Series 2016-3 Mdys Allocable Concentration Excess
Amount
Series 2016-3 Mdys Concentration Excess
Advance Rate Adjustment
Series 2016-3 Mdys Concentration Adjusted
Advance Rate
MTM / Disposition Testing Advance Rate Adjustment
Series 2016-3 Mdys Adjusted Advance Rate
Series 2016-3 Mdys Eligible Investment Grade Program Vehicles*
693,040,671.71 91.00% - 0.00% 91.00% 91.00%
Series 2016-3 Mdys Eligible Investment Grade Program Receivables*
42,820,537.06 91.00% - 0.00% 91.00% 91.00%
Series 2016-3 Mdys Eligible Non-Investment Grade Program Vehicles*
121,740,544.18 89.00% - 0.00% 89.00% 89.00%
Series 2016-3 Mdys Eligible Non-Investment Grade (High) Program Receivables*
58,812,878.47 89.00% - 0.00% 89.00% 89.00%
Series 2016-3 Mdys Eligible Non-Investment Grade (Low) Program Receivables*
9,479,692.74 0.00% - 0.00% 0.00% 0.00%
Series 2016-3 Mdys Eligible Investment Grade Non-Program Vehicles*
4,597,867,659.37 86.75% - 0.00% 86.75% 0.0000% 86.75%
Series 2016-3 Mdys Eligible Non-Investment Grade Non-Program Vehicles*
535,670,087.18 84.00% - 0.00% 84.00% 0.0000% 84.00%
Group I Cash Amount 10.11 100.00% 100.00%Series 2016-3 Mdys Remainder AAA Amount 1,889,407.98 0.00% 0.00%Group I Due & Unpaid Lease Payment Amounts 25,614,896.27
Total 6,086,936,385.07 - Series 2016-3 Mdys Blended Advance Rate:
86.93%
13

HVF II Series 2016-3 Monthly Noteholder ReportingCalculations as of: 1/31/2017Lease Determination Date 2/17/2017Reporting Month February-17Related Month January-17Series 2016-3(Terms marked with an * indicate terms that are not defined in the documentation)
Designation HVF II Series 2016-3 Asset Coverage Threshold Amount ("ACTA") Calculations Operation
Series 2016-3 Adjusted Principal Amount 408,112,529.66 PRating Agency Construct Driving Series 2016-3 Credit Enhancement* EQUAL
Q Series 2016-3 Blended Advance Rate 86.93%R Series 2016-3 Asset Coverage Threshold Amount 469,487,518.03 P / O
Class A/B/C/D Letter of Credit Amount 9,543,983.00 OClass A/B/C/D Available Reserve Account Amount - N
S Class A/B/C/D Letter of Credit Amount + Class A/B/C/D Available Reserve Account Amount* 9,543,983.00 O + NT Series 2016-3 Adjusted Asset Coverage Threshold Amount 459,943,535.03 Max (R - S, P)
Designation HVF II Series 2016-3 Series-Specific Aggregate Asset Amount Adequacy Reporting Operation
NOTE: See HVF II Group I Reporting For Details on Group-Wide Calculations Driving Group-Wide Values Used Here
Series 2016-3 Adjusted Asset Coverage Threshold Amount 459,943,535.03 TU Group I Asset Coverage Threshold Amount 5,915,704,266.19 V Series 2016-3 Floating Allocation Percentage 7.77% T / UW Group I Aggregate Asset Amount 6,086,936,385.07 X Series 2016-3 Asset Amount 473,256,760.73 V * WY Series 2016-3 Asset Amount Excess / (Deficiency)* 13,313,225.70 X - T
Series 2016-3 Asset Amount Deficiency Exists* FALSE
Designation HVF II Series 2016-3 Series-Specific Class-Level Credit Enhancement Adequacy Reporting Operation
HVF II Series 2016-3 Class A Credit Enhancement Calculations$ % ACTA
Class A Principal Amount 299,979,000.00 63.89% GZ Class B Principal Amount + Class C Principal Amount + Class D Principal Amount* 124,198,000.00 26.45% H + I + J
AA Series 2016-3 Required Overcollateralization and Liquid Enhancement Amount 61,374,988.37 13.07% R - PTotal Series 2016-3 Class A Required Capital Structure* 485,551,988.37 103.42%
AB Series 2016-3 Allocated Overcollateralization & Liquid Enhancement Amount 74,688,214.07 15.91% X - P + SAC Series 2016-3 Allocated Overcollateralization & Liquid Enhancement Amount Excess / (Deficiency)* 13,313,225.70 2.84% AB - AA
Series 2016-3 Allocated Overcollateralization & Liquid Enhancement Amount Deficiency Exists* FALSE
HVF II Series 2016-3 Class B Credit Enhancement Calculations$ % ACTA
AD Class A Principal Amount + Class B Principal Amount 377,095,000.00 80.32% G + HAE Class C Principal Amount + Class D Principal Amount 47,082,000.00 10.03% I + J
Series 2016-3 Required Overcollateralization and Liquid Enhancement Amount 61,374,988.37 13.07% AATotal Series 2016-3 Class B Required Capital Structure* 485,551,988.37 103.42%
Series 2016-3 Allocated Overcollateralization & Liquid Enhancement Amount 74,688,214.07 15.91% ABSeries 2016-3 Allocated Overcollateralization & Liquid Enhancement Amount Excess / (Deficiency)* 13,313,225.70 2.84% ACSeries 2016-3 Allocated Overcollateralization & Liquid Enhancement Amount Deficiency Exists* FALSE
HVF II Series 2016-3 Class C Credit Enhancement Calculations$ % ACTA
AF Class A Principal Amount + Class B Principal Amount + Class C Principal Amount* 400,000,000.00 85.20% G + H + IClass D Principal Amount 24,177,000.00 5.15% JSeries 2016-3 Required Overcollateralization and Liquid Enhancement Amount 61,374,988.37 13.07% AA
Total Series 2016-3 Class C Required Capital Structure* 485,551,988.37 103.42%
Series 2016-3 Allocated Overcollateralization & Liquid Enhancement Amount 74,688,214.07 15.91% ABSeries 2016-3 Allocated Overcollateralization & Liquid Enhancement Amount Excess / (Deficiency)* 13,313,225.70 2.84% ACSeries 2016-3 Allocated Overcollateralization & Liquid Enhancement Amount Deficiency Exists* FALSE
HVF II Series 2016-3 Class D Credit Enhancement Calculations$ % ACTA
Series 2016-3 Principal Amount 424,177,000.00 90.35% KSeries 2016-3 Required Overcollateralization and Liquid Enhancement Amount 61,374,988.37 13.07% AA
Total Series 2016-3 Class D Required Capital Structure* 485,551,988.37 103.42%
Series 2016-3 Allocated Overcollateralization & Liquid Enhancement Amount 74,688,214.07 15.91% ABSeries 2016-3 Allocated Overcollateralization & Liquid Enhancement Amount Excess / (Deficiency)* 13,313,225.70 2.84% ACSeries 2016-3 Allocated Overcollateralization & Liquid Enhancement Amount Deficiency Exists* FALSE
14

HVF II Series 2016-3 Monthly Noteholder ReportingCalculations as of: 1/31/2017Lease Determination Date 2/17/2017Reporting Month February-17Related Month January-17Series 2016-3(Terms marked with an * indicate terms that are not defined in the documentation)
HVF II Series 2016-3 Liquid Enhancement Calculations
Designation HVF II Series 2016-3 Series-Specific Liquid Enhancement Adequacy Reporting Operation
AG Class A/B/C/D Required Liquid Enhancement Percentage* 2.25% Hard Wired in DocClass A/B/C/D Adjusted Principal Amount 408,112,529.66 P
AH Class A/B/C/D Required Liquid Enhancement Amount 9,182,531.92 AG * P
AI Class A/B/C/D Letter of Credit Face Amount (less drawn amount)* 9,543,983.00 AJ Class A/B/C/D Available L/C Cash Collateral Account Amount - AK Class A/B/C/D Letter of Credit Liquidity Amount (gross of defaulted letters of credit)* 9,543,983.00 AI + AJ
Class A/B/C/D Letter of Credit Liquidity Amount (gross of defaulted letters of credit)* 9,543,983.00 AKClass A/B/C/D Available Reserve Account Amount - N
AL Class A/B/C/D Liquid Enhancement Amount (gross of defaulted letters of credit)* 9,543,983.00 AK + N
Class A/B/C/D Required Liquid Enhancement Amount 9,182,531.92 AHAM Class A/B/C/D Letter of Credit Liquidity Amount (net of defaulted letters of credit)* 9,543,983.00
Series 2016-3 Adjusted Asset Coverage Threshold Amount 459,943,535.03 TClass A/B/C/D Available Reserve Account Amount - NSeries 2016-3 Asset Amount 473,256,760.73 X
AN Class A/B/C/D Required Reserve Account Amount - MAX(MAX(0, AH - AM),MAX(0, T - N -
X),0)
Class A/B/C/D Reserve Account Excess / (Deficiency)* - N - ANClass A/B/C/D Reserve Account Excess Deficiency Exists* FALSE
Class A/B/C/D Letter of Credit Liquidity Amount (net of defaulted letters of credit) 9,543,983.00 AMClass A/B/C/D Available Reserve Account Amount - N
AO Class A/B/C/D Adjusted Liquid Enhancement Amount 9,543,983.00 AK + N
Class A/B/C/D Liquid Enhancement Excess / (Deficiency)* 361,451.08 AO - AHClass A/B/C/D Liquid Enhancement Deficiency Exists* FALSE
15

Calculations as of: 1/31/2017Lease Determination Date 2/17/2017Reporting Month February-17Related Month January-17
HVF II Group I Group-Wide ReportingHVF II Group I Series
Summary Information 2013-A 2015-1 2015-2 2015-3 2016-1 2016-2 2016-3 2016-4 HVF II Group 1
Debt Type VFN MTN MTN MTN MTN MTN MTN MTNRevolving Period / Amortization Period Revolving Revolving Revolving Revolving Revolving Revolving Revolving RevolvingSeries-Specific Rapid Am Start Date None None None None None None None NoneGroup-Wide Rapid Am Start Date None None None None None None None NoneRapid Amortization Period Occurring No No No No No No No NoPotential Amortization Occurring No No No No No No No No
Series Principal and Adjusted Principal Amounts
Class A Principal Amount 1,878,426,960.06 622,440,000.00 189,475,000.00 265,265,000.00 332,902,000.00 425,000,000.00 299,979,000.00 299,979,000.00 4,313,466,960.06 Class B Principal Amount 35,000,000.00 118,529,000.00 46,209,000.00 64,692,000.00 81,187,000.00 103,648,000.00 77,116,000.00 77,116,000.00 603,497,000.00 Class C Principal Amount - 39,031,000.00 14,316,000.00 20,043,000.00 25,152,000.00 32,111,000.00 22,905,000.00 22,905,000.00 176,463,000.00 Class D Principal Amount - - 15,111,000.00 21,156,000.00 26,549,000.00 33,894,000.00 24,177,000.00 24,177,000.00 145,064,000.00
Total Series Principal Amount 1,913,426,960.06 780,000,000.00 265,111,000.00 371,156,000.00 465,790,000.00 594,653,000.00 424,177,000.00 424,177,000.00 5,238,490,960.06
Total Series Principal Amount 1,913,426,960.06 780,000,000.00 265,111,000.00 371,156,000.00 465,790,000.00 594,653,000.00 424,177,000.00 424,177,000.00 5,238,490,960.06 Series Principal Collection Account Amount 61,634,798.72 26,956,805.22 7,219,058.36 12,189,360.82 15,573,141.99 19,565,116.54 16,064,470.34 19,559,790.48 178,762,542.46
Series Adjusted Principal Amount 1,851,792,161.34 753,043,194.78 257,891,941.64 358,966,639.18 450,216,858.01 575,087,883.46 408,112,529.66 404,617,209.52 5,059,728,417.60
Series Asset Coverage Amount and Adjusted Asset Coverage Amount Calculations
Series Adjusted Principal Amount 1,851,792,161.34 753,043,194.78 257,891,941.64 358,966,639.18 450,216,858.01 575,087,883.46 408,112,529.66 404,617,209.52 5,059,728,417.60 Series Blended Advance Rate 82.58% 82.58% 86.95% 86.95% 86.93% 86.91% 86.93% 86.91% 84.69%
Series Asset Coverage Threshold Amount 2,300,933,536.87 911,935,781.87 296,600,258.96 412,845,773.55 517,923,807.49 661,742,054.74 469,487,518.03 465,584,880.69 6,037,053,612.19
Series Letter of Credit Amount 39,000,000.00 17,550,000.00 5,302,220.00 8,351,010.00 11,644,750.00 16,352,958.00 9,543,983.00 10,604,425.00 118,349,346.00 Series Available Reserve Account Amount - - - - - - - - -
Total Avl L/C Amount + Avl Res Acct Amt 39,000,000.00 17,550,000.00 5,302,220.00 8,351,010.00 11,644,750.00 16,352,958.00 9,543,983.00 10,604,425.00 118,349,346.00
Series Asset Coverage Threshold Amount 2,300,933,536.87 911,935,781.87 296,600,258.96 412,845,773.55 517,923,807.49 661,742,054.74 469,487,518.03 465,584,880.69 6,037,053,612.19 Total Avl L/C Amount + Avl Res Acct Amt 39,000,000.00 17,550,000.00 5,302,220.00 8,351,010.00 11,644,750.00 16,352,958.00 9,543,983.00 10,604,425.00 118,349,346.00
Series Adjusted ACTA 2,261,933,536.87 894,385,781.87 291,298,038.96 404,494,763.55 506,279,057.49 645,389,096.74 459,943,535.03 454,980,455.69 5,918,704,266.19
HVF II Group I Monthly Noteholder Reporting
16

Calculations as of: 1/31/2017Lease Determination Date 2/17/2017Reporting Month February-17Related Month January-17
HVF II Group I Group-Wide Reporting
HVF II Group I Monthly Noteholder Reporting
HVF II Group I SeriesSeries Floating Allocation Percentages and Asset Amount Calculations 2013-A 2015-1 2015-2 2015-3 2016-1 2016-2 2016-3 2016-4 HVF II Group 1
Group I Aggregate Asset Coverage
Threshold Amount Series Adjusted ACTA 2,261,933,536.87 894,385,781.87 291,298,038.96 404,494,763.55 506,279,057.49 645,389,096.74 459,943,535.03 454,980,455.69 5,918,704,266.19
Series Floating Allocation Percentage 38.19% 15.12% 4.92% 6.84% 8.56% 10.91% 7.77% 7.69% 100.00%
Group I Aggregate Asset Amount
Series Asset Amount 2,324,319,154.29 920,274,089.60 299,729,762.08 416,203,005.26 520,933,481.01 664,070,108.76 473,256,760.73 468,150,023.33 6,086,936,385.07 Series Asset Amount Excess / (Deficiency) 65,385,617.42 25,888,307.74 8,431,723.12 11,708,241.71 14,654,423.52 18,681,012.03 13,313,225.70 13,169,567.64 171,232,118.88
Principal-Related Calculations
Relevant Adjusted ACTA Record Date For Series Principal Invested Percentage Calculation
1/31/2017 1/31/2017 1/31/2017 1/31/2017 1/31/2017 1/31/2017 1/31/2017 1/31/2017
Relevant Adjusted ACTA for Series Principal Invested Percentage Calculation
2,258,933,536.87 894,385,781.87 291,298,038.96 404,494,763.55 506,279,057.49 645,389,096.74 506,279,057.49 645,389,096.74 6,152,448,430
Series Principal Invested Percentage 35.89% 14.75% 4.77% 6.66% 8.34% 10.62% 8.34% 10.62% 100%
Series Principal Amount 1,913,426,960.06 780,000,000.00 265,111,000.00 371,156,000.00 465,790,000.00 594,653,000.00 424,177,000.00 424,177,000.00 5,238,490,960Series Percentage 36.53% 14.89% 5.06% 7.09% 8.89% 11.35% 8.10% 8.10% 100.00%
VFN-Related Calculations
VFN Commitment Amount 2,210,000,000.00 - - - - - - - VFN Outstanding Principal Amount 1,913,426,960.06 - - - - - - -
VFN Remaining Capacity 296,573,039.94 - - - - - - -
VFN Drawn Percentage 86.58% - - - - - - - VFN Undrawn Percentage 13.42% - - - - - - -
17

Calculations as of: 1/31/2017Lease Determination Date 2/17/2017Reporting Month February-17Related Month January-17
HVF II Group I Group-Wide Reporting
HVF II Group I Monthly Noteholder Reporting
HVF II Group I SeriesCoupons / Spreads 2013-A 2015-1 2015-2 2015-3 2016-1 2016-2 2016-3 2016-4
Series Class A Coupon / Spread 2.73% 2.02% 2.67% 2.32% 2.95% 2.65% 2.27%Series Class B Coupon / Spread 3.52% 2.96% 3.71% 3.72% 3.94% 3.29% 3.11%Series Class C Coupon / Spread 4.35% 3.95% 4.44% 4.75% 4.99% 5.06% 4.43%Series Class D Coupon / Spread 4.35% 4.93% 5.33% 5.73% 5.97% 6.03% 5.41%
Rating Agency 2013-A 2015-1 2015-2 2015-3 2016-1 2016-2 2016-3 2016-4
Series Class A Rating Agencies D D / M D / M / F D / M / F D / M / F D / M / F D / M / F D / M / FSeries Class B Rating Agencies D D D / F D / F D / F D / F D / F D / FSeries Class C Rating Agencies N/A D D / F D / F D / F D / F D / F D / FSeries Class D Rating Agencies N/A N/A F F D / F D / F D / F D / F
Ratings
Series Class A Ratings A AAA/Aaa AAA/Aaa/AAA AAA/Aaa/AAA AAA/Aaa/AAA AAA/Aaa/AAA AAA/Aaa/AAA AAA/Aaa/AAASeries Class B Ratings BBB A A/A A/A A/A A/A A/A A/ASeries Class C Ratings N/A BBB BBB/BBB BBB/BBB BBB/BBB BBB/BBB BBB/BBB BBB/BBBSeries Class D Ratings N/A N/A BB BB BB/BB BB/BB BB/BB BB/BB
Group PercentagesPrincipal
Group I 5,238,490,960.06 Group II 546,095,238.00
Total 5,784,586,198.06
* Note that any series-specific defined terms have omitted the series numbering so report can be used generically among series with identical requirements.
18

HVF II Group I Monthly Noteholder ReportingCalculations as of: 1/31/2017Lease Determination Date 2/17/2017Reporting Month February-17Related Month January-17
HVF II Group I Group-Wide Cash Activity during Related MonthSeries 2013-G1 Collection Account Activity during Related Month
Series 2013-G1 Collection Account Beginning Balance -$
Series 2013-G1 Principal Collections Deposited 774,280,747$ Series 2013-G1 Interest Collections Deposited 27,189,137$
Total Series 2013-G1 Collections Deposited 801,469,884$
Series 2013-G1 Principal Collections Withdrawn (774,280,747)$ Series 2013-G1 Interest Collections Withdrawn (27,189,137)$
Total Series 2013-G1 Collections Withdrawn (801,469,884)$
Series 2013-G1 Collection Account Ending Balance 10$
Group I Collection Account Activity during Related Month
Group I Collection Account Beginning Balance -$
Group I Principal Collections Deposited 774,280,747$ Group I Interest Collections Deposited 15,013,968$
Total Group I Collections Deposited 789,294,714$
Group I Principal Collections Withdrawn (774,280,747)$ Group I Interest Collections Withdrawn (15,013,968)$
Total Group I Collections Withdrawn (789,294,714)$
Group I Collection Account Ending Balance 0$
Invested Percentages & Group I Series Allocations during Related MonthInvested Percentages 2013-A 2015-1 2015-2 2015-3 2016-1 2016-2 2016-3 2016-4 Total
Series Invested Percentage - Group I Principal Collections 35.89% 14.75% 4.77% 6.66% 8.34% 10.62% 8.34% 10.62% 100.00%Series Invested Percentage - Group I Interest Collections 24.74% 17.32% 4.93% 8.71% 10.20% 15.43% 8.74% 9.93% 100.00%
Group I Collections Series Allocations 2013-A 2015-1 2015-2 2015-3 2016-1 2016-2 2016-3 2016-4 Total
Group I Principal Collections Allocated to Series 277,869,698$ 114,177,996$ 36,947,641$ 51,584,525$ 64,585,365$ 82,265,078$ 64,585,365$ 82,265,078$ 774,280,747$ Group I Interest Collections Allocated to Series 3,714,054$ 2,600,958$ 740,227$ 1,308,252$ 1,531,224$ 2,316,770$ 1,311,843$ 1,490,640$ 15,013,968$
Series Account Activity 2013-A 2015-1 2015-2 2015-3 2016-1 2016-2 2016-3 2016-4 Total
Series Principal Collection AccountSeries Principal Collection Account Beginning Balance -$ -$ -$ -$ -$ -$ -$ -$ -$
Total Deposits during Related Month 983,860,956$ 114,872,176$ 37,145,203$ 51,933,689$ 64,994,040$ 66,883,410$ 48,935,488$ 66,662,921$ 1,435,287,884$ Total Withdrawn during Related Month (937,934,214)$ (95,520,834)$ (32,027,872)$ (42,873,786)$ (53,506,721)$ (52,697,898)$ (37,016,130)$ (52,767,988)$ (1,304,345,442)$
Series Principal Collection Account Ending Balance 61,634,799$ 26,956,805$ 7,219,058$ 12,189,361$ 15,573,142$ 19,565,117$ 16,064,470$ 19,559,790$ 178,762,542$
Series Interest Collection AccountSeries Interest Collection Account Beginning Balance -$ -$ -$ -$ -$ -$ -$ -$ -$
Total Deposits during Related Month 3,714,054$ 2,600,958$ 740,227$ 1,308,252$ 1,531,224$ 2,316,770$ 1,311,843$ 1,490,640$ 15,013,968$ Total Withdrawn during Related Month (3,714,054)$ (2,600,958)$ (740,227)$ (1,308,252)$ (1,531,224)$ (2,316,770)$ (1,311,843)$ (1,490,640)$ (15,013,968)$
Series Interest Collection Account Ending Balance 0$ 0$ -$ -$ -$ -$ -$ -$ 0$
Leasing Company Note Activity during Related MonthLeasing Company Note 2013-G1 Total
Leasing Company Note Beginning Balance 5,507,132,865$ 5,507,132,865$ Leasing Company Note Principal Payments (774,280,747)$ (774,280,747)$ Leasing Company Note Advances 659,345,442$ 659,345,442$
Leasing Company Note Ending Balance 5,392,197,561$ 5,392,197,561$
19

HVF II Group I Monthly Noteholder ReportingCalculations as of: 1/31/2017Lease Determination Date 2/17/2017Reporting Month February-17Related Month January-17
Series 2013-G1 Monthly Lease Invoice for Payment Date
Aggregate Amounts for Series 2013-G1 Lease VehiclesBase Rent $123,495,444.96Monthly Variable Rent 30,943,212.61 Casualty Payment Amount 20,302,057.44 Total Special Default Payment Amount 2,136,833.16 Total Redesignation Amounts 537,387.64 Total Early Termination Payment Amount 304,421.06
Total Series 2013-G1 Monthly Lease Invoice Amount $177,719,356.87
Lessor to Lessee Payment: Aggregate Redesignation to Program Amount 20,941.62$
HVF LLC Series 2013-G1 Monthly Lease Invoice
20
HVF II Group I Monthly Noteholder ReportingCalculations as of: 1/31/2017Lease Determination Date 2/17/2017Reporting Month February-17Related Month January-17
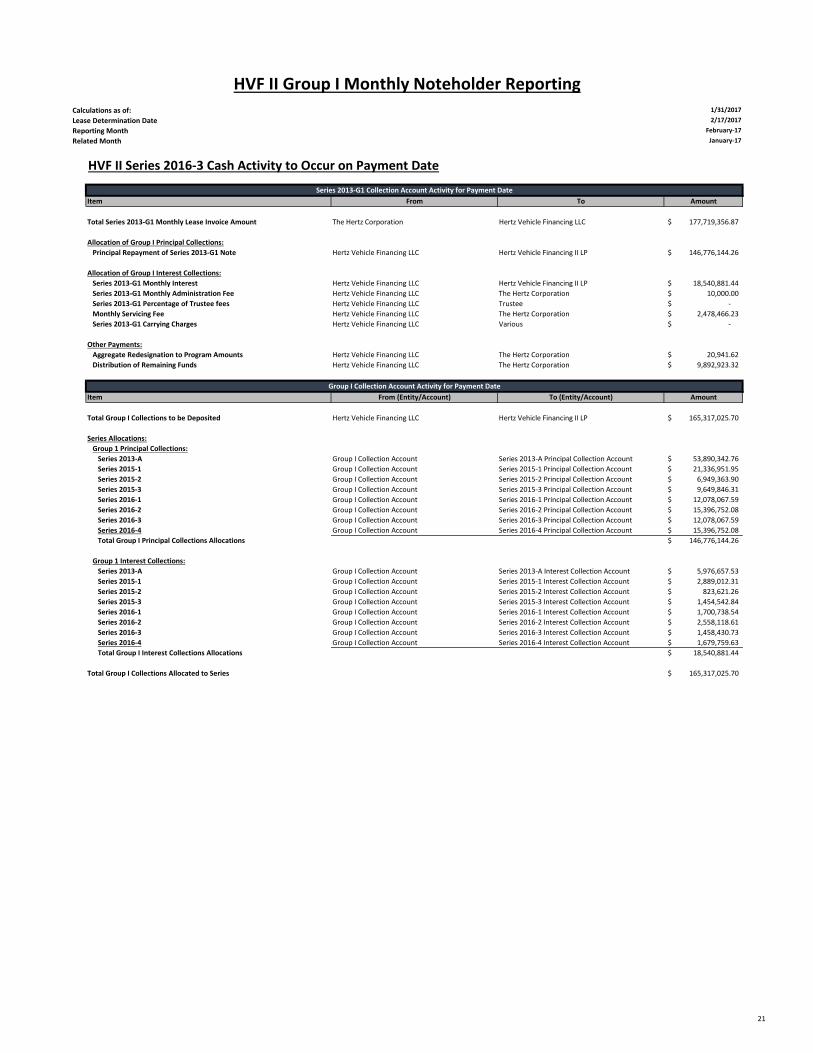
HVF II Series 2016-3 Cash Activity to Occur on Payment Date
Series 2013-G1 Collection Account Activity for Payment DateItem From To Amount
Total Series 2013-G1 Monthly Lease Invoice Amount The Hertz Corporation Hertz Vehicle Financing LLC 177,719,356.87$
Allocation of Group I Principal Collections:Principal Repayment of Series 2013-G1 Note Hertz Vehicle Financing LLC Hertz Vehicle Financing II LP 146,776,144.26$
Allocation of Group I Interest Collections:Series 2013-G1 Monthly Interest Hertz Vehicle Financing LLC Hertz Vehicle Financing II LP 18,540,881.44$ Series 2013-G1 Monthly Administration Fee Hertz Vehicle Financing LLC The Hertz Corporation 10,000.00$ Series 2013-G1 Percentage of Trustee fees Hertz Vehicle Financing LLC Trustee -$ Monthly Servicing Fee Hertz Vehicle Financing LLC The Hertz Corporation 2,478,466.23$ Series 2013-G1 Carrying Charges Hertz Vehicle Financing LLC Various -$
Other Payments:Aggregate Redesignation to Program Amounts Hertz Vehicle Financing LLC The Hertz Corporation 20,941.62$ Distribution of Remaining Funds Hertz Vehicle Financing LLC The Hertz Corporation 9,892,923.32$
Group I Collection Account Activity for Payment DateItem From (Entity/Account) To (Entity/Account) Amount
Total Group I Collections to be Deposited Hertz Vehicle Financing LLC Hertz Vehicle Financing II LP 165,317,025.70$
Series Allocations:Group 1 Principal Collections:
Series 2013-A Group I Collection Account Series 2013-A Principal Collection Account 53,890,342.76$ Series 2015-1 Group I Collection Account Series 2015-1 Principal Collection Account 21,336,951.95$ Series 2015-2 Group I Collection Account Series 2015-2 Principal Collection Account 6,949,363.90$ Series 2015-3 Group I Collection Account Series 2015-3 Principal Collection Account 9,649,846.31$ Series 2016-1 Group I Collection Account Series 2016-1 Principal Collection Account 12,078,067.59$ Series 2016-2 Group I Collection Account Series 2016-2 Principal Collection Account 15,396,752.08$ Series 2016-3 Group I Collection Account Series 2016-3 Principal Collection Account 12,078,067.59$ Series 2016-4 Group I Collection Account Series 2016-4 Principal Collection Account 15,396,752.08$ Total Group I Principal Collections Allocations 146,776,144.26$
Group 1 Interest Collections:Series 2013-A Group I Collection Account Series 2013-A Interest Collection Account 5,976,657.53$ Series 2015-1 Group I Collection Account Series 2015-1 Interest Collection Account 2,889,012.31$ Series 2015-2 Group I Collection Account Series 2015-2 Interest Collection Account 823,621.26$ Series 2015-3 Group I Collection Account Series 2015-3 Interest Collection Account 1,454,542.84$ Series 2016-1 Group I Collection Account Series 2016-1 Interest Collection Account 1,700,738.54$ Series 2016-2 Group I Collection Account Series 2016-2 Interest Collection Account 2,558,118.61$ Series 2016-3 Group I Collection Account Series 2016-3 Interest Collection Account 1,458,430.73$ Series 2016-4 Group I Collection Account Series 2016-4 Interest Collection Account 1,679,759.63$ Total Group I Interest Collections Allocations 18,540,881.44$
Total Group I Collections Allocated to Series 165,317,025.70$
21

HVF II Group I Monthly Noteholder ReportingCalculations as of: 1/31/2017Lease Determination Date 2/17/2017Reporting Month February-17Related Month January-17
HVF II Series 2016-3 Cash Activity to Occur on Payment Date
Series 2016-3 WaterfallsItem From (Account) To (Account) Amount
Series 2016-3 Principal Collection Account
Allocation from Group I Collection Account Group I Collection Account Series 2016-3 Principal Collection Account 12,078,067.59$
Application of Funds (Section 5.4):(a) Senior Interest Waterfall Shortfall Amount Series 2016-3 Principal Collection Account Series 2016-3 Interest Collection Account -$ (b) Class A/B/C/D Reserve Account Deficiency Amount Series 2016-3 Principal Collection Account Class A/B/C/D Reserve Account -$ (c) Early Redemption Date payments Series 2016-3 Principal Collection Account Series 2016-3 Distribution Account -$ (d) Expected Final Payment Date payments Series 2016-3 Principal Collection Account Series 2016-3 Distribution Account -$ (e) Series 2016-3 Rapid Amortization Period payments Series 2016-3 Principal Collection Account Series 2016-3 Distribution Account -$ (f) Principal amount of other Series of Group I Notes Series 2016-3 Principal Collection Account Varies -$ (g) Release to or at the direction of HVF II -$
Series 2016-3 Interest Collection Account
Allocation from Group I Collection Account Group I Collection Account Series 2016-3 Interest Collection Account 1,458,430.73
Application of Funds (Section 5.3):(a) Series 2016-3 Capped Group I Administrator Fee Amount Series 2016-3 Interest Collection Account Series 2016-3 Distribution Account 790.12$ (b) Series 2016-3 Capped Group I Trustee Fee Amount Series 2016-3 Interest Collection Account Series 2016-3 Distribution Account -$ (c) Series 2016-3 Capped Group 1 HVF II Operating Expense Amount Series 2016-3 Interest Collection Account Series 2016-3 Distribution Account 900.94$ (d) Class A Monthly Interest Amount Series 2016-3 Interest Collection Account Series 2016-3 Distribution Account 567,460.28$ (e) Class B Monthly Interest Amount Series 2016-3 Interest Collection Account Series 2016-3 Distribution Account 199,858.97$ (f) Class C Monthly Interest Amount Series 2016-3 Interest Collection Account Series 2016-3 Distribution Account 84,557.63$ (g) Class D Monthly Interest Amount Series 2016-3 Interest Collection Account Series 2016-3 Distribution Account 108,997.98$ (h) Class E Monthly Interest Amount, if issued Series 2016-3 Interest Collection Account Series 2016-3 Distribution Account -$ (i) Class A/B/C/D Reserve Account Deficiency Amount Series 2016-3 Interest Collection Account Class A/B/C/D Reserve Account -$ (j) Series 2016-3 Excess Group I Administrator Fee Amount Series 2016-3 Interest Collection Account Series 2016-3 Distribution Account -$ (k) Series 2016-3 Excess Group I Trustee Fee Amount Series 2016-3 Interest Collection Account Series 2016-3 Distribution Account -$ (l) Series 2016-3 Excess Group 1 HVF II Operating Expense Amount Series 2016-3 Interest Collection Account Series 2016-3 Distribution Account -$ (m) Series 2016-3 Rapid Amortization Period allocation Series 2016-3 Interest Collection Account Series 2016-3 Principal Collection Account -$ (n) Any remaining to Series 2016-3 Principal Collection Account Series 2016-3 Interest Collection Account Series 2016-3 Principal Collection Account 495,864.81$
Reference
Group I Percentage 100.00%Group I Carrying Charges 77,093.07$ Series 2016-3 Accrued Amounts
Series 2016-3 Group I Administrator Fee Amount 790.12$ Series 2016-3 Group I Trustee Fee Amount - Series 2016-3 Group I HVF II Operating Expense Amount 900.94 Class A Monthly Interest Amount 567,460.28 Class B Monthly Interest Amount 199,858.97 Class C Monthly Interest Amount 84,557.63 Class D Monthly Interest Amount 108,997.98 Class A/B/C/D Reserve Account Deficiency Amount -
Total Series 2016-3 Accrued Amounts 962,565.92$
Series 2016-3 Outstanding Principal Amounts:Class A 299,979,000.00$ Class B 77,116,000.00 Class C 22,905,000.00 Class D 24,177,000.00
Total 424,177,000.00$
22
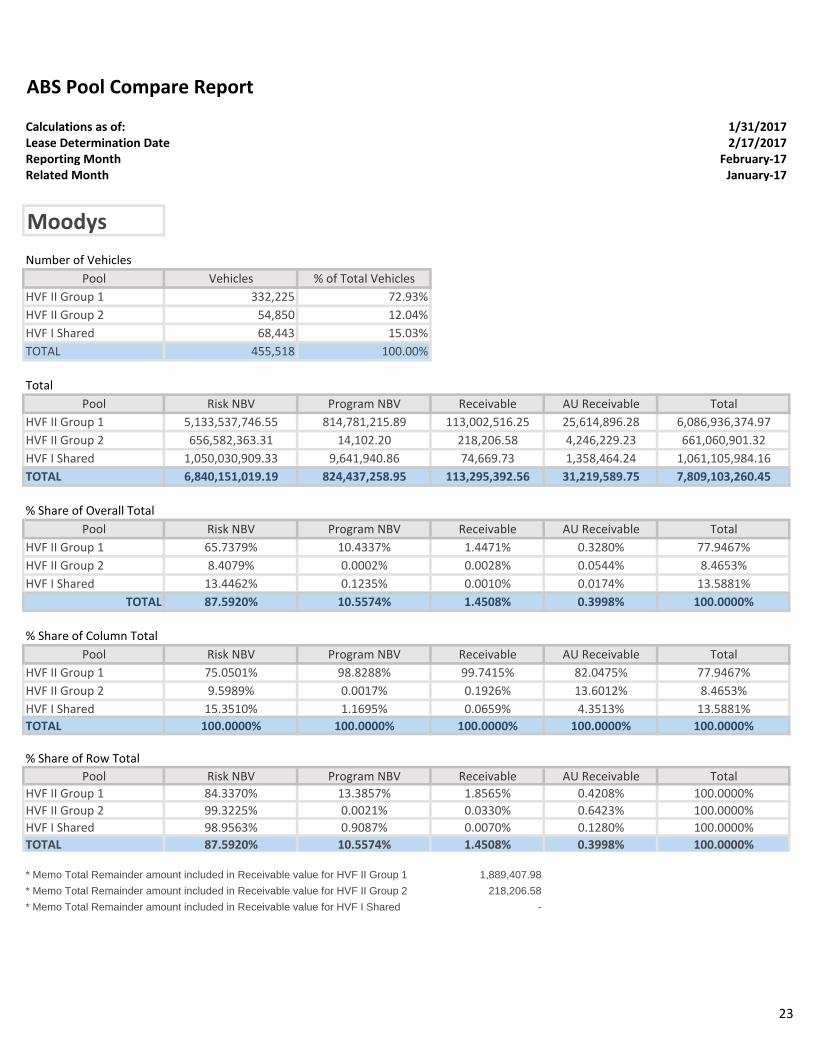
Calculations as of: 1/31/2017Lease Determination Date 2/17/2017Reporting Month February-17Related Month January-17
Moodys
Pool Vehicles % of Total VehiclesHVF II Group 1 332,225 72.93%HVF II Group 2 54,850 12.04%HVF I Shared 68,443 15.03%TOTAL 455,518 100.00%
Pool Risk NBV Program NBV Receivable AU Receivable TotalHVF II Group 1 5,133,537,746.55 814,781,215.89 113,002,516.25 25,614,896.28 6,086,936,374.97HVF II Group 2 656,582,363.31 14,102.20 218,206.58 4,246,229.23 661,060,901.32HVF I Shared 1,050,030,909.33 9,641,940.86 74,669.73 1,358,464.24 1,061,105,984.16TOTAL 6,840,151,019.19 824,437,258.95 113,295,392.56 31,219,589.75 7,809,103,260.45
Pool Risk NBV Program NBV Receivable AU Receivable TotalHVF II Group 1 65.7379% 10.4337% 1.4471% 0.3280% 77.9467%HVF II Group 2 8.4079% 0.0002% 0.0028% 0.0544% 8.4653%HVF I Shared 13.4462% 0.1235% 0.0010% 0.0174% 13.5881%
TOTAL 87.5920% 10.5574% 1.4508% 0.3998% 100.0000%
Pool Risk NBV Program NBV Receivable AU Receivable TotalHVF II Group 1 75.0501% 98.8288% 99.7415% 82.0475% 77.9467%HVF II Group 2 9.5989% 0.0017% 0.1926% 13.6012% 8.4653%HVF I Shared 15.3510% 1.1695% 0.0659% 4.3513% 13.5881%TOTAL 100.0000% 100.0000% 100.0000% 100.0000% 100.0000%
Pool Risk NBV Program NBV Receivable AU Receivable TotalHVF II Group 1 84.3370% 13.3857% 1.8565% 0.4208% 100.0000%HVF II Group 2 99.3225% 0.0021% 0.0330% 0.6423% 100.0000%HVF I Shared 98.9563% 0.9087% 0.0070% 0.1280% 100.0000%TOTAL 87.5920% 10.5574% 1.4508% 0.3998% 100.0000%
* Memo Total Remainder amount included in Receivable value for HVF II Group 1 1,889,407.98
* Memo Total Remainder amount included in Receivable value for HVF II Group 2 218,206.58
* Memo Total Remainder amount included in Receivable value for HVF I Shared -
% Share of Row Total
ABS Pool Compare Report
Number of Vehicles
Total
% Share of Overall Total
% Share of Column Total
23

Calculations as of: 1/31/2017Lease Determination Date 2/17/2017Reporting Month February-17Related Month January-17
DBRS
Pool Vehicles % of Total VehiclesHVF II Group 1 332,225 72.93%HVF II Group 2 54,850 12.04%HVF I Shared 68,443 15.03%TOTAL 455,518 100.00%
Pool Risk NBV Program NBV Receivable AU Receivable TotalHVF II Group 1 5,133,537,746.55 814,781,215.89 113,002,516.25 25,614,896.28 6,086,936,374.97HVF II Group 2 656,582,363.31 14,102.20 218,206.58 4,246,229.23 661,060,901.32HVF I Shared 1,050,030,909.33 9,641,940.86 74,669.73 1,358,464.24 1,061,105,984.16TOTAL 6,840,151,019.19 824,437,258.95 113,295,392.56 31,219,589.75 7,809,103,260.45
Pool Risk NBV Program NBV Receivable AU Receivable TotalHVF II Group 1 65.7379% 10.4337% 1.4471% 0.3280% 77.9467%HVF II Group 2 8.4079% 0.0002% 0.0028% 0.0544% 8.4653%HVF I Shared 13.4462% 0.1235% 0.0010% 0.0174% 13.5881%
TOTAL 87.5920% 10.5574% 1.4508% 0.3998% 100.0000%
Pool Risk NBV Program NBV Receivable AU Receivable TotalHVF II Group 1 75.0501% 98.8288% 99.7415% 82.0475% 77.9467%HVF II Group 2 9.5989% 0.0017% 0.1926% 13.6012% 8.4653%HVF I Shared 15.3510% 1.1695% 0.0659% 4.3513% 13.5881%TOTAL 100.0000% 100.0000% 100.0000% 100.0000% 100.0000%
Pool Risk NBV Program NBV Receivable AU Receivable TotalHVF II Group 1 84.3370% 13.3857% 1.8565% 0.4208% 100.0000%HVF II Group 2 99.3225% 0.0021% 0.0330% 0.6423% 100.0000%HVF I Shared 98.9563% 0.9087% 0.0070% 0.1280% 100.0000%TOTAL 87.5920% 10.5574% 1.4508% 0.3998% 100.0000%
* Memo Total Remainder amount included in Receivable value for HVF II Group 1 1,889,407.98
* Memo Total Remainder amount included in Receivable value for HVF II Group 2 218,206.58
* Memo Total Remainder amount included in Receivable value for HVF I Shared -
% Share of Row Total
ABS Pool Compare Report
Number of Vehicles
Total
% Share of Overall Total
% Share of Column Total
24