Embed Size (px)
Citation preview
1
A Meta-Analysis Investigating Changes in the Prevalence of Dental Fluorosis in the
Midwest Region of the United States of America under Differing Levels of Fluoridated
Drinking Water from the Mid-Twentieth to Early Twenty-first Centuries.
Michael David Herrmann
ABSTRACT
This study executed a meta-analysis to determine if the prevalence of dental fluorosis has changed
over time. Data was extracted from 16 articles derived from eight research groups and researchers
which recorded the prevalence of fluorosis in the Midwestern region of the United States of
America, measured using Dean’s Index of Fluorosis, DFI (Dean 1942), or the Tooth Surface Index
of Fluorosis, TSIF (Horowitz et al. 1984) from 1934 to 2004 under varying Fluoride concentrations
(F-ppm). Raw data was grouped by fluoride concentration and time period, 1934-1969 and 1969-
2004. Specific water fluoride ranges were chosen based on the presence of sufficient data and on the
maximum number of children examined relative to the fluoride groupings, with respect to both
time periods. Among populations examined at optimal and suboptimal water fluoridation ranges,
the prevalence of fluorosis was significantly higher in 1969-2004 as compared to 1934-1969. For
optimal and suboptimal water fluoride concentrations, the prevalence of fluorosis has increased in
recent times potentially due to an increase in the systemic ingestion of fluoride from various and
increasingly available sources, along with changes in diet and dental care.
INTRODUCTION
Fluoride is a naturally occurring element that can be found at different levels everywhere
on the Earth’s surface, primarily in water, plants, and in very small amounts in the air. Fluoride
acts as a catalyst for the diffusion of calcium and phosphate into the tooth (Selwitz et al 2007).
The rebuilt crystalline surfaces, composed of fluoridated hydroxyapatite and fluorapatite, are
2
much more resistant to acid attack which causes tooth decay (Selwitz et al 2007). The systemic
ingestion of fluoride has cariostatic benefits (the beneficial inverse relationship with dental
caries, or cavities) up to a certain point. Once this point is reached, which depends on the timing,
the amount, and the duration of fluoride ingestion, the excess fluoride begins to break down the
crystalline enamel surfaces resulting in mottled enamel or dental fluorosis (Driscoll et al, 1983;
Dean 1942; Black, 1916).
Dental fluorosis is a developmental disorder of the dental enamel caused by excess
systemic ingestion of fluoride during tooth development (Dean 1942). Dental fluorosis results in
a lower mineral content and increased porosity associated with the successive systemic ingestion
of relatively toxic amounts of fluoride, specific to the individual, during the pre-eruptive
development of tooth calcification occurring around five to six years of age for the primary
dentition and up to ten years of age for the third molar (Rozier et al, 1981; Driscoll et al, 1983).
This results in a range of macroscopically observable changes in the enamel, varying from fine
white striations, which are deemed mild and cosmetic or aesthetic, to severely chalky, mottled,
porous, and opaque enamel which deteriorates soon after the teeth erupt, with increasingly severe
cases at higher water fluoride concentrations (Dean 1936).
For nearly a century it has been known that children with severe fluorosis have
significantly more cavities than do children with lesser degrees of fluorosis (Black, 1916;
Driscoll et al, 1986). This is due to the porosity of the teeth increasing with the severity of
fluorosis, which is relatively difficult to fill and irreversible (Black, 1916). However, it has also
been observed throughout this past century that decay in permanent teeth is consistently lower in
children with very mild to mild enamel fluorosis when compared with that in children without
enamel fluorosis (Black 1916; Dean 1942; Iida et al, 2009). Although fluoride opponents claim

3
water fluoridation is just a way to dispose of fluoride waste products resulting from the refining
of uranium, aluminum, metals, and oil (Connett et al, 2010; Freeze 2009), the cariostatic benefits
of fluoride have been proven multiple times (Dean 1942; Iida et al, 2009). When fluoride levels
are optimally adjusted to minimize severe levels of fluorosis and to maximize cariostatic
benefits, the population as a whole benefits (Dean 1942; Iida et al, 2009). In the late 1940’s, H.T.
Dean defined 0.8-1.2 parts per million F- (ppm) as the optimal water fluoride range for cooking
and drinking in order to balance the beneficial cariostatic benefits of water fluoridation with the
detrimental endemic dental fluorosis (Dean 1942).
With respect to the benefits and risks mentioned, water fluoridation became a policy of
the U.S. Public Health Service in 1951 (Dean 1950). The U.S. Centers for Disease Control and
Prevention stated that community water fluoridation is one of the top ten greatest public health
achievements of the 20th century due to its cost-effective prevention of tooth decay. However,
the last national survey conducted from 1999-2004, found the prevalence of dental fluorosis over
the entire United States has increased to an estimated 41% among adolescents 12-15 years of
age, even with only 61.5% of the water supplies being managed (Beltrán-Aguilar et al, 2005).
The increase in the prevalence of fluoride is believed to be due to factors such as increased
consumption of foods and drinks processed in facilities that use fluoridated products, and
ingestion of dentifrices and other oral health products containing fluoride. This resulted in some
US cities removing fluoride from the water supplies, as in Wichita, KS, and even resulted in
Madison, WI changing its water fluoridation policy from a range of 0.7-1.2 to strictly 0.7 F
(Savidge 2014).
To better understand this recent increase in fluorosis and the potential increase in the
systemic ingestion of fluoride from sources other than the water supply, a study to analyze the
4
prevalence of fluorosis in areas with below optimal concentrations of fluoridated water over
particular geographic regions was undertaken. By examining specific well-studied regions and
time periods when fluoride was not widely available in other sources and by comparing that to
the current time period where fluoride is available through an increased number of sources,
evaluating the increased potential systemic ingestion of fluoride from sources other than the
water supply may become possible and could be used to determine necessary adjustments in
water fluoridation programs. The goal of this research was to compile data from the Midwestern
region of the United States of America, an area with relatively robust longitudinal data, and
compare the changes in the prevalence of dental fluorosis under differing optimal and suboptimal
levels of fluoridated drinking water from the 1930’s, when fluorosis was first being examined in
the Midwest, up until the most recent available research.
METHODS
Search engine criteria and data collection
Articles and books were searched online using University of Wisconsin-Madison
libraries, PubMED/Medline and Web of Science, Madison public library, and Google Scholar.
The terms “Fluorosis” and “epidemiology” were searched in PubMed and received 1,049 results
and 15,200 in Google Scholar. The results were filtered by adding each individual Midwestern
state. Abstracts were skimmed to determine if the article contained data pertaining to caries,
dental or enamel fluorosis, or seemed informative of the topic. This resulted in 242 articles,
primarily found in Google Scholar, and downloaded in PubMed/Medline or Web of Science. If
the articles were primary sources, recording individuals exhibiting degrees of dental fluorosis, or
lack thereof, the articles were downloaded and read to ensure that the author used only subjects
5
residing in the area from birth and gave water fluoride concentration as an average of monthly
means, or small ranges, typically with standard deviations.
Several reviewed articles did not include the complete number or percentages of fluorosis
cases found in each Fluorosis category, Dean’s fluorosis Index, DFI or Tooth Surface Index of
Fluorosis (TSIF), or Thylstrup and Fejerskov Index (TF), or grouped them in an incoherent or
inconsistent manner, and so were excluded. In addition to grouping fluorosis cases, which was
common with recent researchers, some authors grouped wide large fluoride ranges and those
studies were excluded as well.
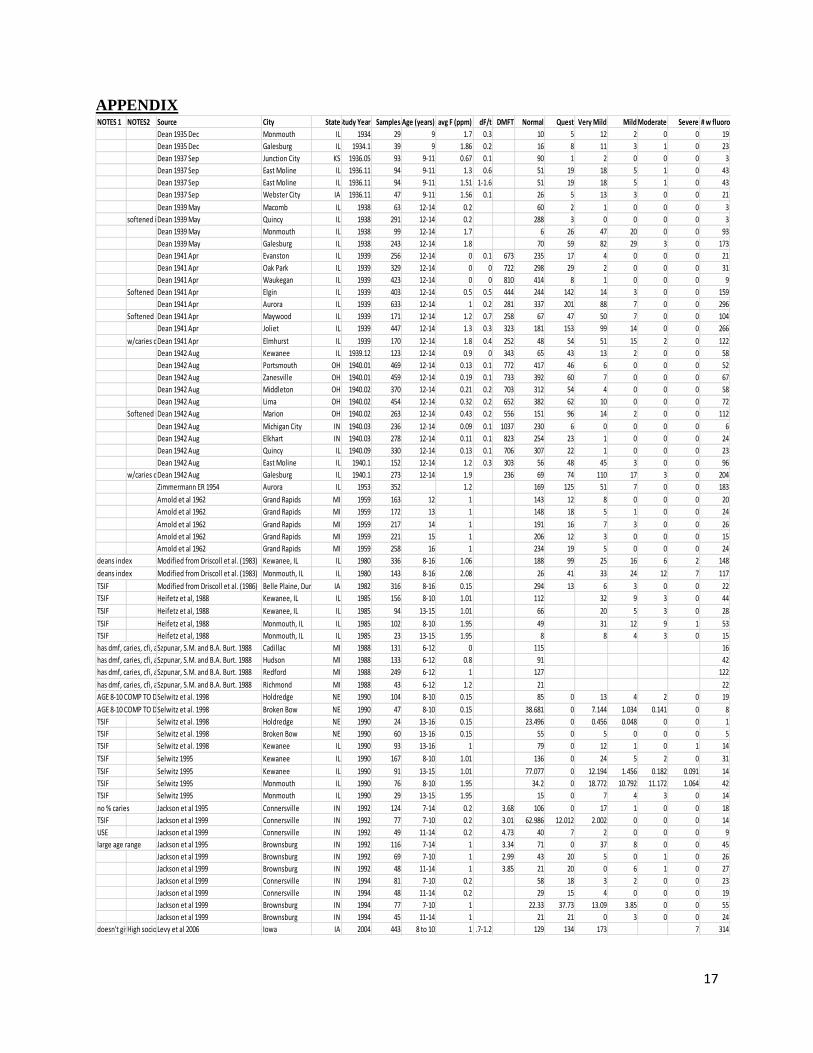
Sixteen highly cited and relevant articles derived from eight research groups remained
(Dean 1935;1937;1934;1941;1942; Zimmermann 1954; Arnold et al, 1962; Driscoll et al, 1983;
Driscoll et al, 1986; Heifetz et al, 1988; Szpunar et al, 1988; Selwitz et al, 1995;1998; Jackson et
al, 1995;1999; Levy et al, 2006). For fluorosis recorded using Dean’s Index, questionable, mild,
moderate, and severe cases were considered as having fluorosis as well as scores >1 with the TF
or TSIF Index. Data such as notes, source, study year, age, city, state, fluoride level, fluoride
level range and standard deviation, number of children examined, number of individuals falling
into various classes of fluorosis using different indexes, normal cases, and cavity information
were all recorded. When study years lasted two years, the final year was used to demarcate the
study year. The data recorded from most research articles included the prevalence of fluorosis, or
the lack thereof, given in percentages. In most cases, the number of children designated as
“normal” was subtracted from the total group examined in order to calculate the prevalence of
fluorosis. The prevalence of fluorosis and sample sizes were used to calculate the number of
individuals experiencing fluorosis, which was summed for each time range.
6
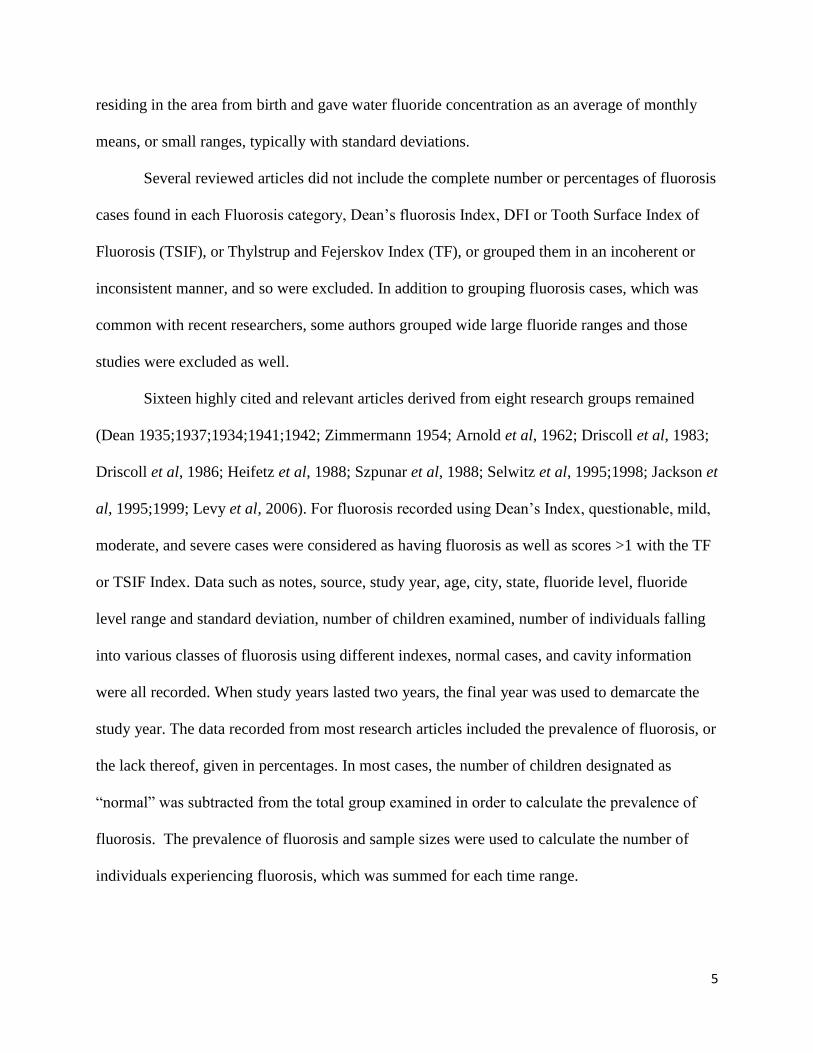
Demographics
Figure 1: This is a map of the Midwest region showing the sum of population samples for each location with a total of 13,244 children examined. (Figure created with Microsoft Excel PowerMap).
Figure 1 shows the sample size for specific locations over the Midwest. From 1934-1969,
8,714 children were examined and the average fluoride concentration was 0.86 ppm with water
fluoride levels ranging from 0 to 1.9 ppm. From 1969-2004, 3,594 children were examined and
the average fluoride concentration was 0.86 ppm, after excluding fluoride concentrations above
2.08 ppm to achieve comparable fluoride averages. Most research articles included the
prevalence of fluorosis, or the lack thereof, given in percentages.
When looking at the population distribution, it was critical to select a fluoride range that
had equal representation in order to derive quality results. The distribution of the percentage of

7
the 8,714 children examined across water fluoride concentrations from 1934-1969 was 45.42%
of the children examined in a fluoride range from 0.0-0.4 ppm; 8.71% for 0.4-0.8 ppm; 20.51%
for 0.8-1.2 ppm; 15.57% for 1.2-1.6 ppm; and 9.79% for 1.6-2.0 ppm. The distribution of the
percentage of the 3,594 children examined across fluoride levels from 1969-2004 was 29.52% of
the children examined in a fluoride range from 0.0-0.4 ppm; 0.00% for 0.4-0.8 ppm; 58.90% for
0.8-1.2 ppm; 1.20% for 1.2-1.6 ppm; 6.40% for 1.6-2.0 ppm; and 3.98% for 2.0-2.4 ppm. Within
these distributions, comparable data regarding the prevalence of fluorosis between the time
periods was greatest within the optimal 0.8-1.2 ppm, and suboptimal 0.0-0.4 ppm water fluoride
concentration ranges.
For time periods 1934-1969 versus 1969-2004, the fluoride range of 0.8-1.2 ppm had
1,787 verses 2,117 children examined with an average water fluoride concentration of 0.986 +/-
0.038 versus 0.933 +/- 0.058, respectively. For time periods 1934-1969 versus 1969-2004, the
fluoride range of 0.0-0.4 ppm had 3,958 and 1,061 children examined with an average water
fluoride concentration of 0.13 +/-0.10 versus 0.16 +/- 0.06, and the prevalence of fluorosis was
8.4% with a standard error of 5.2% versus 16.8% with a standard error of 10.4%, respectively.
Statistical Analysis
The statistical analyses of the data were performed in Microsoft Excel 2013, using the
Analysis Tool-pack to run t-Tests using Two-Sample Assuming Unequal Variances, in which the
two-tailed p and t values were recorded. The averages, standard deviations, and standard errors
were calculated using PivotTables. Charts were made and Pearson Correlation Coefficients were
calculated using Microsoft Excel.
8
RESULTS
All Water Fluoride Concentrations:
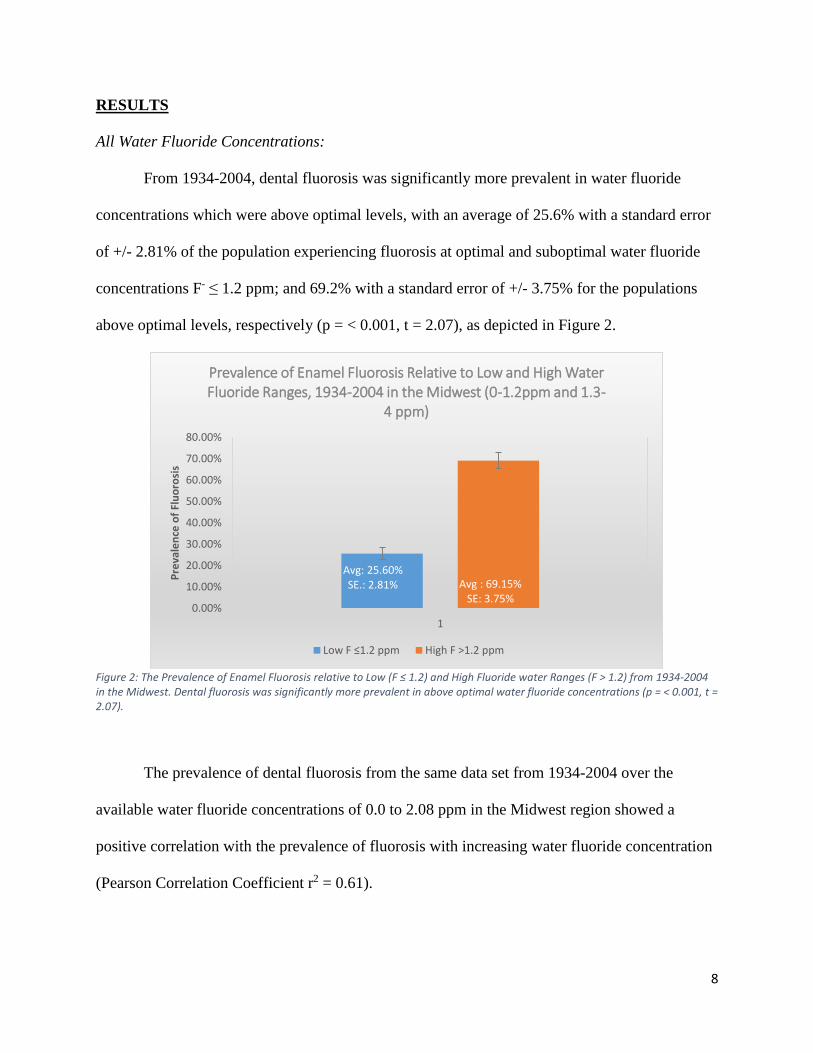
From 1934-2004, dental fluorosis was significantly more prevalent in water fluoride
concentrations which were above optimal levels, with an average of 25.6% with a standard error
of +/- 2.81% of the population experiencing fluorosis at optimal and suboptimal water fluoride
concentrations F- ≤ 1.2 ppm; and 69.2% with a standard error of +/- 3.75% for the populations
above optimal levels, respectively (p = < 0.001, t = 2.07), as depicted in Figure 2.
Figure 2: The Prevalence of Enamel Fluorosis relative to Low (F ≤ 1.2) and High Fluoride water Ranges (F > 1.2) from 1934-2004 in the Midwest. Dental fluorosis was significantly more prevalent in above optimal water fluoride concentrations (p = < 0.001, t = 2.07).
The prevalence of dental fluorosis from the same data set from 1934-2004 over the
available water fluoride concentrations of 0.0 to 2.08 ppm in the Midwest region showed a
positive correlation with the prevalence of fluorosis with increasing water fluoride concentration
(Pearson Correlation Coefficient r2 = 0.61).
Avg: 25.60%SE.: 2.81% Avg : 69.15%
SE: 3.75%0.00%
10.00%
20.00%
30.00%
40.00%
50.00%
60.00%
70.00%
80.00%
1
Pre
vale
nce
of
Flu
oro
sis
Prevalence of Enamel Fluorosis Relative to Low and High Water Fluoride Ranges, 1934-2004 in the Midwest (0-1.2ppm and 1.3-
4 ppm)
Low F ≤1.2 ppm High F >1.2 ppm
9
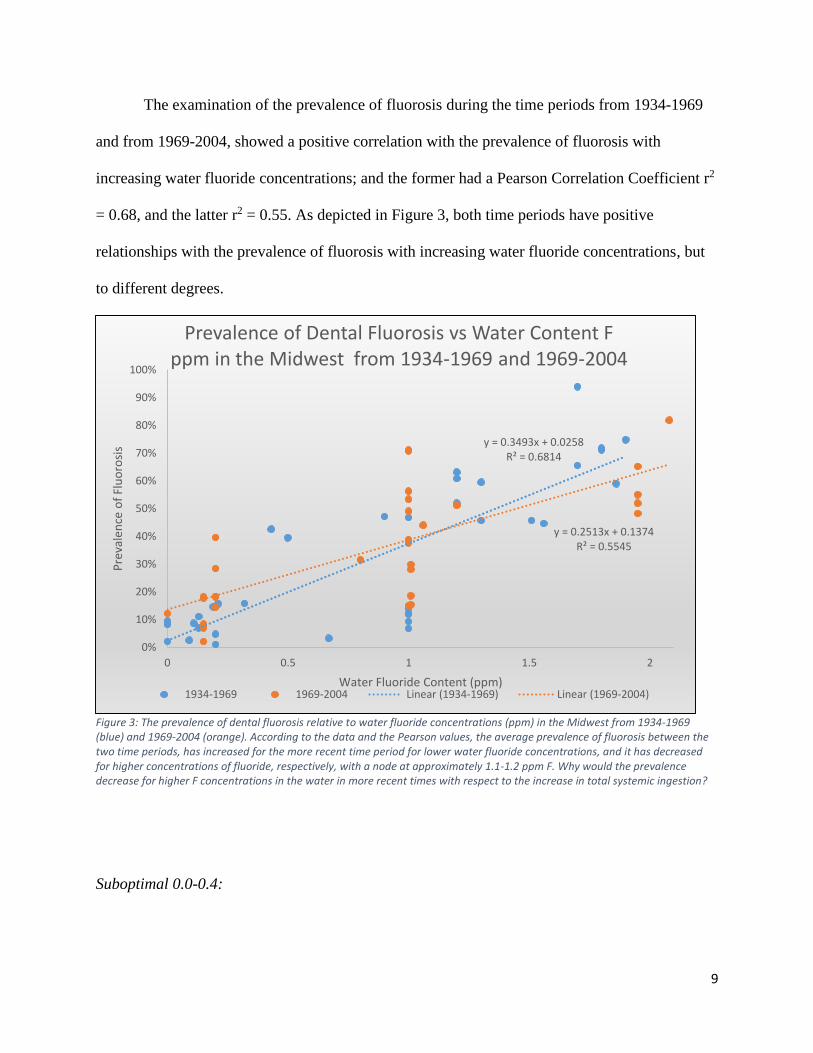
The examination of the prevalence of fluorosis during the time periods from 1934-1969
and from 1969-2004, showed a positive correlation with the prevalence of fluorosis with
increasing water fluoride concentrations; and the former had a Pearson Correlation Coefficient r2
= 0.68, and the latter r2 = 0.55. As depicted in Figure 3, both time periods have positive
relationships with the prevalence of fluorosis with increasing water fluoride concentrations, but
to different degrees.
Figure 3: The prevalence of dental fluorosis relative to water fluoride concentrations (ppm) in the Midwest from 1934-1969 (blue) and 1969-2004 (orange). According to the data and the Pearson values, the average prevalence of fluorosis between the two time periods, has increased for the more recent time period for lower water fluoride concentrations, and it has decreased for higher concentrations of fluoride, respectively, with a node at approximately 1.1-1.2 ppm F. Why would the prevalence decrease for higher F concentrations in the water in more recent times with respect to the increase in total systemic ingestion?
Suboptimal 0.0-0.4:
y = 0.3493x + 0.0258R² = 0.6814
y = 0.2513x + 0.1374R² = 0.5545
0%
10%
20%
30%
40%
50%
60%
70%
80%
90%
100%
0 0.5 1 1.5 2
Pre
vale
nce
of
Flu
oro
sis
Water Fluoride Content (ppm)
Prevalence of Dental Fluorosis vs Water Content F ppm in the Midwest from 1934-1969 and 1969-2004
1934-1969 1969-2004 Linear (1934-1969) Linear (1969-2004)
10
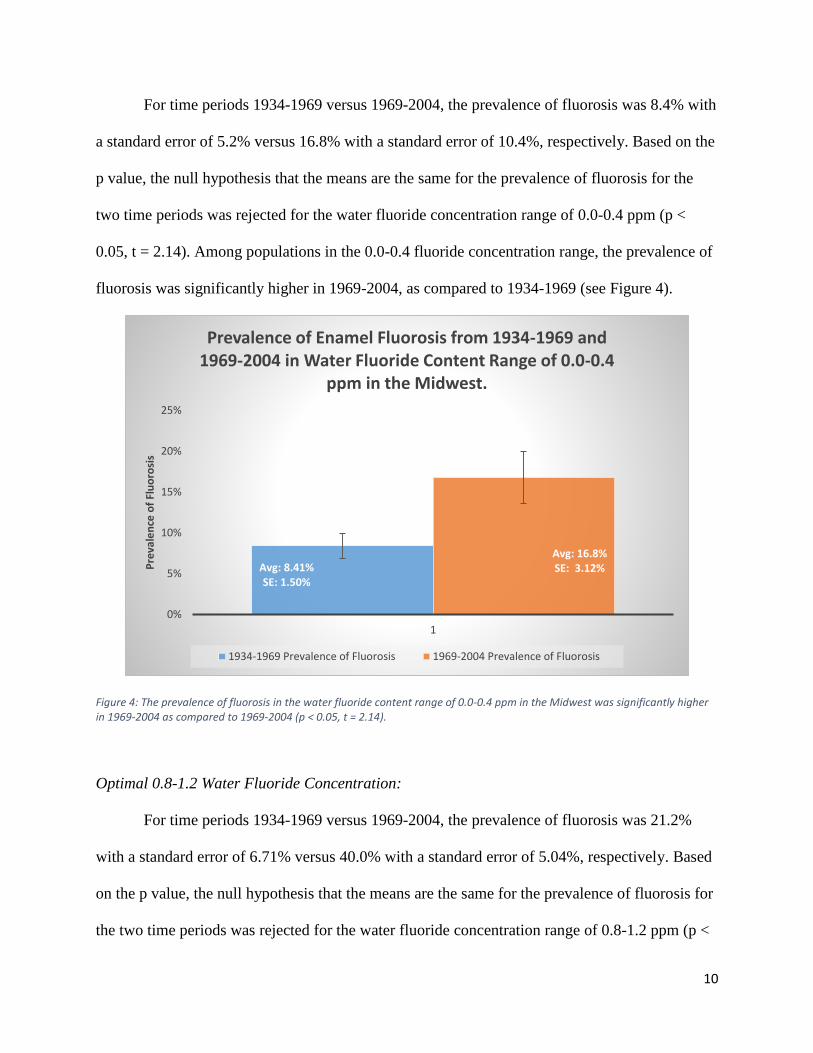
For time periods 1934-1969 versus 1969-2004, the prevalence of fluorosis was 8.4% with
a standard error of 5.2% versus 16.8% with a standard error of 10.4%, respectively. Based on the
p value, the null hypothesis that the means are the same for the prevalence of fluorosis for the
two time periods was rejected for the water fluoride concentration range of 0.0-0.4 ppm (p <
0.05, t = 2.14). Among populations in the 0.0-0.4 fluoride concentration range, the prevalence of
fluorosis was significantly higher in 1969-2004, as compared to 1934-1969 (see Figure 4).
Figure 4: The prevalence of fluorosis in the water fluoride content range of 0.0-0.4 ppm in the Midwest was significantly higher in 1969-2004 as compared to 1969-2004 (p < 0.05, t = 2.14).
Optimal 0.8-1.2 Water Fluoride Concentration:
For time periods 1934-1969 versus 1969-2004, the prevalence of fluorosis was 21.2%
with a standard error of 6.71% versus 40.0% with a standard error of 5.04%, respectively. Based
on the p value, the null hypothesis that the means are the same for the prevalence of fluorosis for
the two time periods was rejected for the water fluoride concentration range of 0.8-1.2 ppm (p <
Avg: 8.41%SE: 1.50%
Avg: 16.8%SE: 3.12%
0%
5%
10%
15%
20%
25%
1
Pre
vale
nce
of
Flu
oro
sis
Prevalence of Enamel Fluorosis from 1934-1969 and 1969-2004 in Water Fluoride Content Range of 0.0-0.4
ppm in the Midwest.
1934-1969 Prevalence of Fluorosis 1969-2004 Prevalence of Fluorosis

11
0.05, t = 2.16). Among populations in the 0.8-1.2 fluoride concentration range, the prevalence of
fluorosis was significantly higher in 1969-2004, as compared to 1934-1969 (see Figure 5).
Figure 5: The prevalence of fluorosis in the water fluoride content range of 0.8-1.2 ppm in the Midwest was significantly higher in 1969-2004 as compared to 1969-2004 (p < 0.05, t = 2.16).
DISCUSSION:
From the data examined in this article, a statistically significant picture emerged of the
increase in the prevalence of fluorosis at both optimal and suboptimal fluoride concentrations in
water over time, as presented (see Figures 3-5). This was expected and may be more evidence
that there has been an increase in systemically ingested fluoride from multiple other sources,
including but not limited to dentifrices (oral care products), soft drinks, processed foods,
vegetables, fluoride tablets, and other sources. These products could potentially be labeled with
Avg: 21.2%SE: 6.71%
Avg: 40.0%SE: 5.04%
0%
10%
20%
30%
40%
50%
60%
1
Pre
vale
nce
of
Flu
oro
sis
Prevalence of Enamel Fluorosis from 1934-1969 and 1969-2004 in Water Fluoride Content Range of 0.8-1.2
ppm in the Midwest.
1934-1969 Prevalence of Fluorosis 1969-2004 Prevalence of Fluorosis
12
their respective fluoride contents in order to give consumers the ability to manage their total
consumption.
Many recent authors agree that there is significant evidence for an increase in the
prevalence of mild fluorosis nationwide, which has been observed to coincide with a decreased
incidence of dental decay, but there is no evidence of an increase in severe fluorosis (Jackson et
al, 2002; Newbrun 2010). This can be further supported by the data represented in Figure 3. The
question that remains to be answered, is why would the prevalence of fluorosis decrease for
above optimal water fluoride concentrations in recent times, with respect to the increase in total
systemic ingestion? This may be due to other unexamined variables, diet, abiotic changes, or
from using different methods, population distributions, calibrations, or indexes to measure
fluorosis. In addition, it may also be due to the consumption of bottled water from outside
sources with different fluoride concentrations which would create additional anomalies in the
data relative to water fluoride concentrations in tap water. Whatever the case is, further
investigation is necessary.
Obtaining the evidence to develop a solid picture of the cariostatic effects of fluoride, or
the severity of fluorosis, is nearly impossible with the data available due to the differences in
research design, methods, and reporting, which is critical when setting water fluoridation levels
to maximize benefits and reduce risks. For example, for dental cavity research, which is
frequently recorded concurrently with dental fluorosis studies, if one researcher chooses to
examine children 12-14 years of age (i.e. Dean 1942), and a later author chooses to examine
children ranging 8-16 years of age (i.e. Driscoll et al, 1983), although the fluorosis data is
comparable due to its pre-eruptive development occurring around five to six years of age for the
primary dentition (Rozier et al, 1981; Driscoll et al, 1983), the cavity data will be incomparable

13
due to the continuous nature of cavity development over time. When examining data, one cannot
simply average and analyze entire groups because there are stark differences in factors such as
their fluoride range, age range, dietary differences, and climate differences affecting fluoride
absorption, which can each drastically alter the final results. With respect to data, especially with
important information related to public health decisions that impact the public, there needs to be
a method implemented for scoring dental fluorosis and cavities and reporting fluoride and age
ranges, in a manner consistent with the past. In addition, studies should provide meticulous
reports of the methods used, data collected, excluded, and analyzed, for any policy that affects
the public. As long as scientists such as Yiamouyiannis, 1990 or Connett et al, 2010, use national
data sets to contradict, question, or show missing information from national reports that are used
to inform the public and policy makers, skeptics will remain and the purpose of water
fluoridation, the nature of fluorosis, and changes over time will remain controversial.
Water fluoridation was an excellent public health policy in the absence of alternate
fluoride sources, however, knowing that additional sources of fluoride are becoming increasingly
available, studying the variation in the total amount of fluoride ingested from all products over
time in specific populations is necessary to appropriately inform public health policy decisions
such as water fluoridation practices.
REFERENCES
F. Arnold, R. Likins, A. Russell and D. Scott Fifteenth year of the Grand Rapids fluoridation
study The Journal of the American Dental Association 65 (1962) 780-785.
E. D. Beltrán-Aguilar, L. K. Barker, M. T. Canto, B. A. Dye, B. F. Gooch, S. O. Griffin, J.
Hyman, F. Jaramillo, A. Kingman and R. Nowjack-Raymer Surveillance for dental caries,
dental sealants, tooth retention, edentulism, and enamel fluorosis—United States, 1988-1994
and 1999-2002 MMWR Surveill Summ 54 (2005) 1-43.
14
G. V. Black Mottled teeth: an endemic developmental imperfection of the enamel of the teeth
heretofore unknown in the literature of dentistry, 1916.
P. H. Connett, J. S. Beck and H. Micklem The case against fluoride: how hazardous waste
ended up in our drinking water and the bad science and powerful politics that keep it there,
Chelsea Green Publishing, 2010.
H. T. Dean CHRONIC ENDEMIC DENTALN FLUOROSIS: (MOTTLED ENAMEL)
Journal of the American Medical Association 107 (1936) 1269-1273.
H. T. Dean The investigation of physiological effects by the epidemiological method Fluorine
and dental health. American Association for the Advancement of Science, Publication
(1942) 23-31.
H. T. Dean, F. A. Arnold Jr, P. Jay and J. W. Knutson Studies on mass control of dental caries
through fluoridation of the public water supply Public Health Reports (1896-1970) (1950)
1403-1408.
H. T. Dean and E. Elvove Further studies on the minimal threshold of chronic endemic dental
fluorosis Public Health Reports (1896-1970) (1937) 1249-1264.
H. T. Dean, P. Jay, F. Arnold Jr and E. Elvove A Dental Caries Study, Including L.
Acidophilus Estimations of a Population Severely Affected by Mottled Enamel and Which for
the Past Twelve Years Has Used a Fluoride Free Water Pub. Health Rep. 56 (1941) 365-381.
H. T. Dean and F. S. McKay Production of Mottled Enamel Halted by a Change in Common
Water Supply* American Journal of Public Health and the Nations Health 29 (1939) 590-
596.
W. S. Driscoll, H. S. Horowitz, R. J. Meyers, S. B. Heifetz, A. Kingman and E. R. Zimmerman
Prevalence of dental caries and dental fluorosis in areas with optimal and above-optimal water
fluoride concentrations The Journal of the American Dental Association 107 (1983) 42-47.
W. S. Driscoll, H. S. Horowitz, R. J. Meyers, S. B. Heifetz, A. Kingman and E. R. Zimmerman
Prevalence of dental caries and dental fluorosis in areas with negligible, optimal, and above-
optimal fluoride concentrations in drinking water The Journal of the American Dental
Association 113 (1986) 29-33.
R. A. Freeze and J. H. Lehr The Fluoride Wars: How a Modest Public Health Measure Became
America's Longest Running Political Melodrama, John Wiley & Sons, 2009.
S. B. Heifetz, W. S. Driscoll, H. S. Horowitz and A. Kingman Prevalence of dental caries and
dental fluorosis in areas with optimal and above-optimal water-fluoride concentrations: a 5-
year follow-up survey The Journal of the American Dental Association 116 (1988) 490-495.

15
H. Iida and J. V. Kumar The association between enamel fluorosis and dental caries in US
schoolchildren The Journal of the American Dental Association 140 (2009) 855-862.
R. D. Jackson, E. J. Brizendine, S. A. Kelly, R. Hinesley, G. K. Stookey and A. J. Dunipace
The fluoride content of foods and beverages from negligibly and optimally fluoridated
communities Community dentistry and oral epidemiology 30 (2002) 382-391.
R. D. Jackson, S. Kelly, B. Katz, E. Brizcndine and G. Stookey Dental fluorosis in children
residing in communities with different water fluoride levels: 33-month follow-up Pediatric
dentistry 21 (1999) 248-254.
R. D. Jackson, S. A. Kelly, B. P. Katz, J. R. Hull and G. K. Stookey Dental fluorosis and caries
prevalence in children residing in communities with different levels of fluoride in the water
Journal of public health dentistry 55 (1995) 79-84.
S. M. Levy, L. Hong, J. J. Warren and B. Broffitt Use of the fluorosis risk index in a cohort
study: the Iowa fluoride study Journal of public health dentistry 66 (2006) 92-96.
C. Neurath Tooth decay trends for 12 year olds in non-fluoridated and fluoridated countries
Fluoride 38 (2005) 324.
E. Newbrun What we know and do not know about fluoride Journal of public health
dentistry 70 (2010) 227-233.
R. G. Rozier and G. G. Dudney Dental fluorosis in children exposed to multiple sources of
fluoride: implications for school fluoridation programs Public Health Reports 96 (1981) 542.
N. Savidge Board approves fluoride policy for Madison water Wisconsin State Journal
(2014).
R. H. Selwitz, A. I. Ismail and N. B. Pitts Dental caries The Lancet 369 (2007) 51-59.
R. H. Selwitz, R. E. Nowjack‐Raymer, A. Kingman and W. S. Driscoll Dental caries and dental
fluorosis among schoolchildren who were lifelong residents of communities having either low
or optimal levels of fluoride in drinking water Journal of public health dentistry 58 (1998)
28-35.
R. H. Selwitz, R. Nowjack‐Raymer, W. S. Driscoll and S. H. Li Evaluation after 4 years of the
combined use of fluoride and dental sealants Community dentistry and oral epidemiology 23
(1995) 30-35.
S. M. Szpunar and B. Burt Dental caries, fluorosis, and fluoride exposure in Michigan
schoolchildren Journal of dental research 67 (1988) 802-806.
L. H. Weinstein and A. Davison Fluorides in the environment: effects on plants and animals,
CABI, 2004.
16
J. A. Yiamouyiannis Water fluoridation and tooth decay: Results from the 1986-1987 national
survey of U. S. school children Fluoride 23 (1990) 55-67.
E. R. Zimmermann Fluoride and nonfluoride enamel opacities Public health reports 69 (1954)
1115.
17
APPENDIX
NOTES 1 NOTES2 Source City StateStudy Year Samples Age (years) avg F (ppm) dF/t DMFT Normal Quest Very Mild Mild Moderate Severe # w fluorosis
Dean 1935 Dec Monmouth IL 1934 29 9 1.7 0.3 10 5 12 2 0 0 19
Dean 1935 Dec Galesburg IL 1934.1 39 9 1.86 0.2 16 8 11 3 1 0 23
Dean 1937 Sep Junction City KS 1936.05 93 9-11 0.67 0.1 90 1 2 0 0 0 3
Dean 1937 Sep East Moline IL 1936.11 94 9-11 1.3 0.6 51 19 18 5 1 0 43
Dean 1937 Sep East Moline IL 1936.11 94 9-11 1.51 1-1.6 51 19 18 5 1 0 43
Dean 1937 Sep Webster City IA 1936.11 47 9-11 1.56 0.1 26 5 13 3 0 0 21
Dean 1939 May Macomb IL 1938 63 12-14 0.2 60 2 1 0 0 0 3
softened in 1931Dean 1939 May Quincy IL 1938 291 12-14 0.2 288 3 0 0 0 0 3
Dean 1939 May Monmouth IL 1938 99 12-14 1.7 6 26 47 20 0 0 93
Dean 1939 May Galesburg IL 1938 243 12-14 1.8 70 59 82 29 3 0 173
Dean 1941 Apr Evanston IL 1939 256 12-14 0 0.1 673 235 17 4 0 0 0 21
Dean 1941 Apr Oak Park IL 1939 329 12-14 0 0 722 298 29 2 0 0 0 31
Dean 1941 Apr Waukegan IL 1939 423 12-14 0 0 810 414 8 1 0 0 0 9
Softened 1938Dean 1941 Apr Elgin IL 1939 403 12-14 0.5 0.5 444 244 142 14 3 0 0 159
Dean 1941 Apr Aurora IL 1939 633 12-14 1 0.2 281 337 201 88 7 0 0 296
Softened 1937Dean 1941 Apr Maywood IL 1939 171 12-14 1.2 0.7 258 67 47 50 7 0 0 104
Dean 1941 Apr Joliet IL 1939 447 12-14 1.3 0.3 323 181 153 99 14 0 0 266
w/caries dataDean 1941 Apr Elmhurst IL 1939 170 12-14 1.8 0.4 252 48 54 51 15 2 0 122
Dean 1942 Aug Kewanee IL 1939.12 123 12-14 0.9 0 343 65 43 13 2 0 0 58
Dean 1942 Aug Portsmouth OH 1940.01 469 12-14 0.13 0.1 772 417 46 6 0 0 0 52
Dean 1942 Aug Zanesville OH 1940.01 459 12-14 0.19 0.1 733 392 60 7 0 0 0 67
Dean 1942 Aug Middleton OH 1940.02 370 12-14 0.21 0.2 703 312 54 4 0 0 0 58
Dean 1942 Aug Lima OH 1940.02 454 12-14 0.32 0.2 652 382 62 10 0 0 0 72
Softened in 1928Dean 1942 Aug Marion OH 1940.02 263 12-14 0.43 0.2 556 151 96 14 2 0 0 112
Dean 1942 Aug Michigan City IN 1940.03 236 12-14 0.09 0.1 1037 230 6 0 0 0 0 6
Dean 1942 Aug Elkhart IN 1940.03 278 12-14 0.11 0.1 823 254 23 1 0 0 0 24
Dean 1942 Aug Quincy IL 1940.09 330 12-14 0.13 0.1 706 307 22 1 0 0 0 23
Dean 1942 Aug East Moline IL 1940.1 152 12-14 1.2 0.3 303 56 48 45 3 0 0 96
w/caries dataDean 1942 Aug Galesburg IL 1940.1 273 12-14 1.9 236 69 74 110 17 3 0 204
Zimmermann ER 1954 Aurora IL 1953 352 1.2 169 125 51 7 0 0 183
Arnold et al 1962 Grand Rapids MI 1959 163 12 1 143 12 8 0 0 0 20
Arnold et al 1962 Grand Rapids MI 1959 172 13 1 148 18 5 1 0 0 24
Arnold et al 1962 Grand Rapids MI 1959 217 14 1 191 16 7 3 0 0 26
Arnold et al 1962 Grand Rapids MI 1959 221 15 1 206 12 3 0 0 0 15
Arnold et al 1962 Grand Rapids MI 1959 258 16 1 234 19 5 0 0 0 24
deans index Modified from Driscoll et al. (1983) Kewanee, IL IL 1980 336 8-16 1.06 188 99 25 16 6 2 148
deans index Modified from Driscoll et al. (1983) Monmouth, IL IL 1980 143 8-16 2.08 26 41 33 24 12 7 117
TSIF Modified from Driscoll et al. (1986) Belle Plaine, Durant, Marengo, and Missouri ValleyIA 1982 316 8-16 0.15 294 13 6 3 0 0 22
TSIF Heifetz et al, 1988 Kewanee, IL IL 1985 156 8-10 1.01 112 32 9 3 0 44
TSIF Heifetz et al, 1988 Kewanee, IL IL 1985 94 13-15 1.01 66 20 5 3 0 28
TSIF Heifetz et al, 1988 Monmouth, IL IL 1985 102 8-10 1.95 49 31 12 9 1 53
TSIF Heifetz et al, 1988 Monmouth, IL IL 1985 23 13-15 1.95 8 8 4 3 0 15
has dmf, caries, cfi, and dfsSzpunar, S.M. and B.A. Burt. 1988 Cadillac MI 1988 131 6-12 0 115 16
has dmf, caries, cfi, and dfsSzpunar, S.M. and B.A. Burt. 1988 Hudson MI 1988 133 6-12 0.8 91 42
has dmf, caries, cfi, and dfsSzpunar, S.M. and B.A. Burt. 1988 Redford MI 1988 249 6-12 1 127 122
has dmf, caries, cfi, and dfsSzpunar, S.M. and B.A. Burt. 1988 Richmond MI 1988 43 6-12 1.2 21 22
AGE 8-10 COMP TO DEAN TSIFSelwitz et al. 1998 Holdredge NE 1990 104 8-10 0.15 85 0 13 4 2 0 19
AGE 8-10 COMP TO DEAN TSIFSelwitz et al. 1998 Broken Bow NE 1990 47 8-10 0.15 38.681 0 7.144 1.034 0.141 0 8
TSIF Selwitz et al. 1998 Holdredge NE 1990 24 13-16 0.15 23.496 0 0.456 0.048 0 0 1
TSIF Selwitz et al. 1998 Broken Bow NE 1990 60 13-16 0.15 55 0 5 0 0 0 5
TSIF Selwitz et al. 1998 Kewanee IL 1990 93 13-16 1 79 0 12 1 0 1 14
TSIF Selwitz 1995 Kewanee IL 1990 167 8-10 1.01 136 0 24 5 2 0 31
TSIF Selwitz 1995 Kewanee IL 1990 91 13-15 1.01 77.077 0 12.194 1.456 0.182 0.091 14
TSIF Selwitz 1995 Monmouth IL 1990 76 8-10 1.95 34.2 0 18.772 10.792 11.172 1.064 42
TSIF Selwitz 1995 Monmouth IL 1990 29 13-15 1.95 15 0 7 4 3 0 14
no % caries Jackson et al 1995 Connersville IN 1992 124 7-14 0.2 3.68 106 0 17 1 0 0 18
TSIF Jackson et al 1999 Connersville IN 1992 77 7-10 0.2 3.01 62.986 12.012 2.002 0 0 0 14
USE Jackson et al 1999 Connersville IN 1992 49 11-14 0.2 4.73 40 7 2 0 0 0 9
large age range Jackson et al 1995 Brownsburg IN 1992 116 7-14 1 3.34 71 0 37 8 0 0 45
Jackson et al 1999 Brownsburg IN 1992 69 7-10 1 2.99 43 20 5 0 1 0 26
Jackson et al 1999 Brownsburg IN 1992 48 11-14 1 3.85 21 20 0 6 1 0 27
Jackson et al 1999 Connersville IN 1994 81 7-10 0.2 58 18 3 2 0 0 23
Jackson et al 1999 Connersville IN 1994 48 11-14 0.2 29 15 4 0 0 0 19
Jackson et al 1999 Brownsburg IN 1994 77 7-10 1 22.33 37.73 13.09 3.85 0 0 55
Jackson et al 1999 Brownsburg IN 1994 45 11-14 1 21 21 0 3 0 0 24
doesn't give mod, added 173 to mildHigh socioeconomicLevy et al 2006 Iowa IA 2004 443 8 to 10 1 .7-1.2 129 134 173 7 314