Embed Size (px)
Citation preview

Journal of Strength and Conditioning Research Publish Ahead of PrintDOI: 10.1519/JSC.0000000000001662
Validation of heart rate monitor Polar RS800 for heart rate variability analysis during exercise
Hernando, David; Garatachea, Nuria; Almeida, Rute; Casajús, Jose A.; Bailón, Raquel
Hernando, David; Bailón, Raquel
- Biomedical Signal Interpretation & Computational Simulation (BSICoS) Group, Aragón Institute of Engineering Research (I3A), IIS Aragón, University of Zaragoza, Spain.
- Centro de Investigación Biomédica en Red en Bioingeniería, Biomateriales y Nanomedicina (CIBER-BBN), Zaragoza, Spain.
E-mail: {dhernand,rbailon}@unizar.es
Address (Hernando, David): C/ Mariano Esquillor s/n, 50018 Zaragoza, Spain. 876555462
Garatachea, Nuria; Casajús, Jose A.
- Departamento de Fisiatría y Enfermería. Facultad de Ciencias de la Salud y del Deporte. GENUD (Growth, Exercise, Nutrition and Development) research group. Instituto Agroalimentario de Aragon IA2 (Universidad de Zaragoza-CITA), Zaragoza, Spain.
- Instituto de Investigación Sanitaria Aragón (IIS Aragón).
- Centro de Investigación Biomédica en Red de la Fisiopatología de la Obesidad y Nutricion (CIBERObn).
E-mail: {nugarata,joseant}@unizar.es
Almeida, Rute
- Departamento de Matematica, Faculdade de Ciências, Universidade do Porto (FCUP), Centro de Matematica da Universidade do Porto (CMUP), Porto, Portugal.
- Biomedical Signal Interpretation & Computational Simulation (BSICoS) Group, Aragón Institute of Engineering Research (I3A), IIS Aragón, University of Zaragoza, Spain.
- Centro de Investigación Biomédica en Red en Bioingeniería, Biomateriales y Nanomedicina (CIBER-BBN), Zaragoza, Spain.
E-mail: [email protected]
Copyright ª 2016 National Strength and Conditioning Association
ACCEPTED

Abstract
Heart rate variability (HRV) analysis during exercise is an interesting non-invasive tool to measure the cardiovascular response to the stress of exercise. Wearable heart rate monitors are a comfortable option to measure RR intervals while doing physical activities. It is necessary to evaluate the agreement between HRV parameters derived from the RR series recorded by wearable devices and those derived from an ECG during dynamic exercise of low to high intensity.
23 male volunteers performed an exercise stress test on a cycle ergometer. Subjects wore a Polar RS800 device while ECG was also recorded simultaneously to extract the reference RR intervals. A time-frequency spectral analysis was performed to extract the instantaneous mean heart rate (HRM), and the power of low frequency (PLF) and high frequency (PHF) components, the latter centred on the respiratory frequency. Analysis was done in intervals of different exercise intensity based on oxygen consumption. Linear correlation, reliability and agreement were computed in each interval.
The agreement between the RR series obtained from the Polar device and from the ECG is high throughout the whole test, although the shorter the RR is, the more differences there are. Both methods are interchangeable when analysing HRV at rest. At high exercise intensity, HRM and PLF still presented a high correlation (ρ>0.8) and excellent reliability and agreement indices (above 0.9). However, the PHF measurements from the Polar showed reliability and agreement coefficients around 0.5 or lower when the level of the exercise increases (for levels of O2 above 60%).
Keywords
Exercise Stress Test, Wearable heart rate device, Frequency domain analysis, Reliability, Agreement
Abbreviation list
– A: Agreement
– ANS: Autonomic nervous system
– CCC: Concordance correlation coefficient
– ECG: Electrocardiogram
– HF: High frequency
– HRM, : Mean heart rate
– HRV: Heart rate variability
– IBMD: Information-based measure of disagreement
– ICC: Intraclass correlation coefficient
– LF: Low frequency
Copyright ª 2016 National Strength and Conditioning Association
ACCEPTED

– LOA: Limits of agreement
– PLF, : Low frequency power
– PHF, : High frequency power
– : RR intervals from ECG
– : RR intervals from Polar device
– : Oxygen consumption
– ρ: Pearson’s correlation coefficient
1.INTRODUCTION
Heart rate variability (HRV) remains a powerful source for autonomic nervous system (ANS) assessment by using simple and non-invasive techniques. Spectral analysis of HRV at rest reveals at least two components: one low frequency component (LF) between 0.04 and 0.15 Hz and one high frequency component (HF), usually measured between 0.15 and 0.4 Hz. The HF component is related to the parasympathetic stimulation of the sinoatrial node and mainly due to respiratory sinus arrhythmia. The LF component is affected by both sympathetic and parasympathetic modulation and its interpretation is controversial. The ratio between the power in the LF and HF bands has been proposed to evaluate the sympathovagal balance controlling the heart rate [36]. Analysis of HRV can be useful to diagnose and monitor several pathologies which are related to some ANS dysfunction. However, HRV monitoring is also interesting in subjects which do not present an apparent disease, since it can be used to monitor the sleep or stress level, see Tobaldini et al. [31], Ranganathan et al. [26] and Kumar et al. [17].
In recent years, HRV analysis has gained increasing interest in sports and training sciences. Sports physiologists use HRV as a non-invasive measurement of autonomic changes due to exercise training and the cardiovascular response to the stress of exercise, see Borresen et al. [8]. Hottenrott et al. [15] show that significant differences can be observed in healthy subjects due to regular aerobic training: not only a reduction in mean heart rate both at rest and during submaximal exercise, but also an increase in autonomic efferent activity and a shift in favour of enhanced vagal modulation. Martinmäki et al. [22] also show that low-dose endurance training enhances vagal control during exercise, but does not alter resting vagal HR control. The study of HRV is also valuable for physicians during exercise. Analysis of HRV during stress testing achieved higher accuracy than any other stress ECG indexes to discriminate ischemia, see Bailón et al. [6]. Pradhapan et al. [25] have used HRV analysis during recovery after exercise to predict risk of mortality. However, HRV interpretation during exercise is still a matter of debate. It is necessary to take into account analysis methods, population characteristics, training levels, intensity and duration of exercise. A multidisciplinary approach between cardiologists, exercise and pulmonary physiologists, coaches and
Copyright ª 2016 National Strength and Conditioning Association
ACCEPTED

biomedical engineers would be desirable to interpret HRV during exercise, see Aubert et al. [2].
The analysis of HRV during exercise faces several challenges. First, it is particularly difficult to obtain reliable and robust QRS detections during exercise, mainly due to the significant levels of noise observed in this context (Llamedo et al. [19]) and changes in beat morphology (Drezner et al. [10]). Due to the non-stationary nature of HRV during exercise, time-varying spectral analysis should be used, such as parametric methods like autoregressive models with time-varying parameters, or non-parametric methods like quadratic time-frequency representations, the latter including the Wigner-Ville distribution and its filtered versions (Mainardi [20]). Moreover, respiratory rate increases with exercise intensity and can exceed the upper limit of the classical HF band (0.4 Hz), making it necessary to redefine the HF band, as shown in Bailón et al. [3]. Mean heart rate also increases with exercise intensity and affects HRV parameters. A correction of HRV parameters with mean heart rate should be performed in order to separate changes in ANS stimulation from changes in mean heart rate, see Bailón et al. [4] and Sacha et al. [29, 30]. Finally, a component related to cardiolocomotor coupling has been observed in HRV during exercise. This component is centred at pedalling or running stride frequency, and can mislead the interpretation of HRV as a marker of ANS modulation, see Bailón et al. [5].
Currently, there are several mobile and easy-to-use heart rate monitors which allow keeping a record of the inter-beat intervals (RR intervals) during physical activity. Commercial devices, like Polar heart rate monitors, have been used by scientists for HRV analysis in sport sciences, medicine and other fields of research: see Kaber et al. [16], Kumar et al. [17] and Turner et al. [32]. Recent studies have validated Polar devices against different electrocardiogram (ECG) systems. Works like Rezende et al. [27], Gamelin et al. [12] and Giles et al. [13] show promising results and claim that, at rest, these devices are able to yield RR intervals series for HRV analysis as reliably as those obtained by ECG. Wallén et al. [33] studied the differences in the reliability according to the gender, claiming that the reliability between Polar and ECG measurements was weaker for women. Also, Weippert et al. [35] show that HRV measurements from Polar device are reliable during supine and sitting rest, walking, and moderate to vigorous static exercise of the limbs. To the authors’ knowledge, no study has validated heart rate monitor Polar RS800 during dynamic exercise of high intensity.
The aim of this study is to evaluate the agreement and reliability between HRV analysis derived from RR series recorded by HR monitor Polar RS800 and HRV analysis derived from a simultaneous ECG recording during dynamic exercise of low, medium and high intensity.
2.METHODS
2.1. Experimental Approach to the Problem
This study validates a Polar RS800 device in 23 healthy male volunteers during an exercise test. A high resolution ECG is simultaneously recorded to extract the RR intervals and use them as a reference. A time-frequency spectral analysis is performed
Copyright ª 2016 National Strength and Conditioning Association
ACCEPTED
to extract the mean heart rate (HRM), the power of low frequency (PLF) and the power of high frequency (PHF), the latter centred on the respiratory frequency. A Bland Altman is used with the RR intervals derived from the ECG and the Polar device to graphically see the discrepancy between both measurements across the whole range. Reliability and agreement coefficients are also computed in different intervals related to the level of oxygen consumption for each subject.
2.2. Subjects
A total of 23 volunteers agreed to participate in the study. All of them were apparently healthy subjects and regularly participate in sports activities. Written informed consent was obtained from each subject. The study protocol was approved by the institutional ethics committee and was in accordance with the Declaration of Helsinki for Human Research of 1974 (last modified in 2008). Table 1 shows study population characteristics.
[Table 1 here]
Experimental protocol
All the subjects completed a submaximal test on a cycle ergometer. Prior to the tests, they were asked to adhere to the instructions described in Wasserman et al. [34]: 1) wear comfortable, loose-fitting clothing; 2) drink plenty of fluids over the 24-h period preceding the test; 3) avoid food, tobacco, alcohol, and caffeine for 3 h prior to taking the test; 4) avoid exercise or strenuous physical activity on the day of the test; and 5) get an adequate amount of sleep (6-8 h) the night before the test.
The exercise test was divided into two different phases: resting and exercise phase. During the resting phase, the subjects were continuously monitored while seated at rest for 5 min, without any movement or talking, to measure resting cardiorespiratory variables. The exercise phase started on the cycle ergometer at 75 W work load, increasing at a rate of 25 W·min-1. The cadence frequency was fixed at 80 rpm. This phase lasted until the subject reached his 90% maximum heart rate, which was determined in previous tests by a physician. Then, the work load was kept constant for two more minutes. The recovery phase consisted of 5 min of pedalling at free cadence, but it is not included in this study due to its heterogeneity among the subjects. Figure 1 shows an example of the evolution of the RR series throughout the test.
[Figure 1 here]
The test was divided into 5 different intervals. In addition to the resting interval (), which is associated to the resting phase (5 minutes prior to the exercise), the oxygen
Copyright ª 2016 National Strength and Conditioning Association
ACCEPTED

consumption ( ) signal was used to establish 4 intervals during the exercise phase: 0-40%, 40-60%, 60-80% and 80-100% of the consumption variation during exercise
for each subject (see Figure 2). The basal value of is obtained as the mean value
during the resting phase, while the maximum value is found at the peak of the signal. These intervals are denoted as , , and respectively. Note that each interval has different length among the subjects.
[Figure 2 here]
2.3. Procedures
Data acquisition and pre-processing
The ECG signal, RR intervals, respiratory frequency and were recorded throughout the three phases of the test.
Ventilatory and exchange gases were analysed breath-by-breath by an open-circuit sampling system (Oxycon Pro, Jaeger-Viasys Healthcare, Hoechberg, Germany). The metabolic cart was calibrated with a known gas mixture (16% oxygen, , and 5% carbon dioxide, ) and volume prior to the first test each day as recommended by the
company. Both respiratory frequency and were interpolated at 4 Hz and low-pass filtered with a cut-off frequency of 0.01 Hz.
RR intervals were recorded beat-to-beat using an HR monitor (RS800, Polar Electro Oy, Kempele, Finland) which uses a sampling frequency of 1000 Hz for the ECG signal. Moreover, the ECG was simultaneously recorded using a high resolution Holter (Mortara 48-hour H12+, Mortara Instrument, Milwaukee,Wisconsin) with a sampling frequency of 1000 Hz. For each subject, the QRS detection marks were extracted from the ECG using a multi-lead approach by a wavelet-based detector described in Martínez et al. [23] with optimized parameters for noisy environments described in Hernando et al. [14], and each detection was manually verified by an operator with a dedicated interface. RR intervals from the ECG ( ) were obtained as the difference of each consecutive beat occurrences. RR intervals from Polar ( ) were directly obtained from the device. The delay between and was estimated as that lag which maximizes their cross correlation. Subsequently, the two series were synchronized by correcting this delay.
Heart rate variability indices
The instantaneous heart rate signal, , is derived from both RR intervals series, following a method based on the integral pulse frequency modulation (IPFM) model, which also accounts for the presence of ectopic beats (Mateo et al. [24]), and sampled at 4 Hz. This signal is high-pass filtered to remove the mean heart rate (very low
Copyright ª 2016 National Strength and Conditioning Association
ACCEPTED

frequency components, up to 0.03 Hz) and it is also corrected by it: = ( - ) / , see Bailón et al. [4].
The smoothed pseudo Wigner-Ville distribution (SPWVD) was applied to to estimate the time-varying spectral properties of both HRV signals (Martin et al. [21]). This time-frequency analysis allows to study the evolution of the power of the frequency components through time. To suppress the interference terms, both time and frequency smoothing windows were chosen to be Hamming windows of length 2N-1=203 (about 50 seconds) and 2K-1=513 samples (about 128 seconds), respectively, as described in Bailón et al. [5]. The instantaneous power in the low and high frequency band, and respectively, was extracted throughout the entire exercise test. Low frequency band ranged from 0.04 to 0.15 Hz. The high frequency band was centered on the respiratory frequency with a bandwidth of 0.25 Hz. The lower limit of the HF band was never below 0.15 Hz, and the upper limit was never above the half of mean heart rate (Bailón et al. [5]).
2.4. Statistical Analyses
Reliability and agreement analysis
To study the reliability and agreement between HRV derived from the Polar records and from the ECG signal, 4 steps were proposed:
1. A Bland-Altman plot (Bland et al [7]) was used to visualize both and series. The bias, the limits of agreement (LOA) and the percentage of paired RR measurements that are out of the LOA were computed in each interval.
2. Pearson’s correlation coefficient (Acton [1]), ρ, was used to quantify the linear relationship between the ECG and Polar following signals:
(a) Mean heart rate:
(b) Low frequency power:
(c) High frequency power:
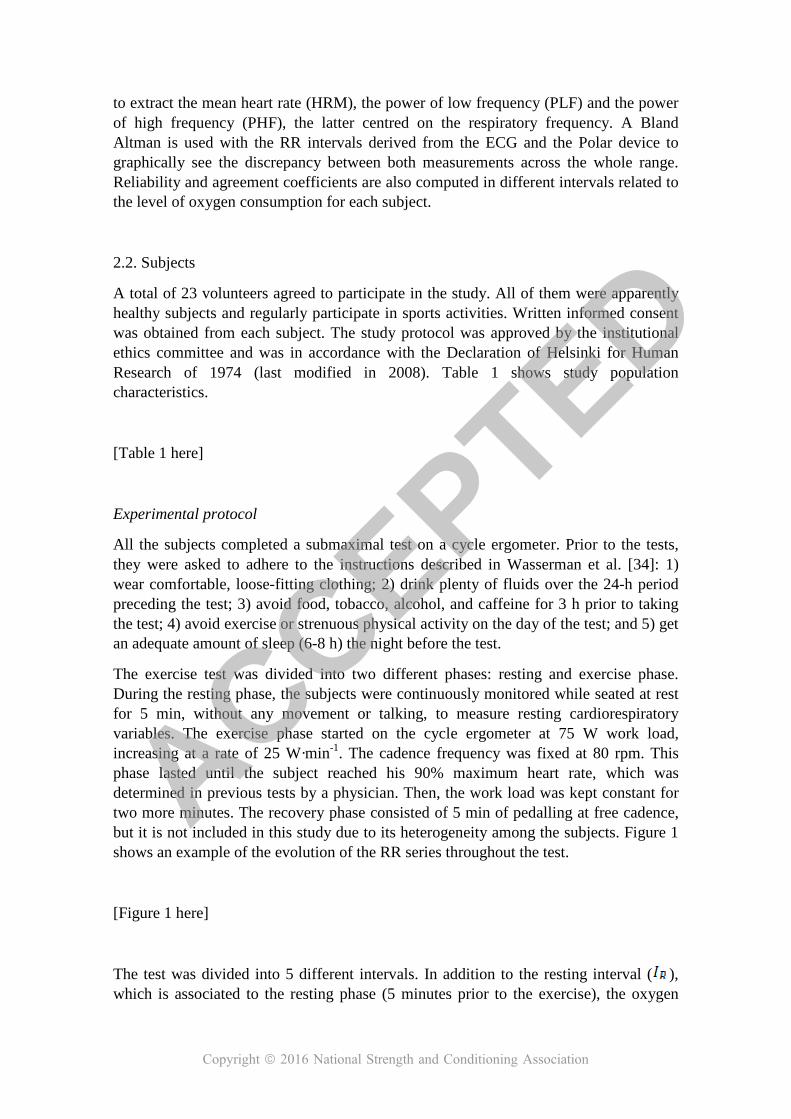
To determine if two signals present a high linear correlation, a threshold for the correlation coefficient ρ was set to 0.8. Figure 3 shows in the upper panel a case of RR series from a subject which presents a ρ value above the threshold ( in blue,
in red), while lower panel shows a case with r value below the threshold.
[Figure 3 here]
For each interval ( , , , and ), a mean value was obtained (HRM, PLF and PHF from , and respectively) and the correlation coefficient was evaluated for every subject. Also, in those intervals with a ρ value above
Copyright ª 2016 National Strength and Conditioning Association
ACCEPTED

the threshold, a relative error was computed as the mean of the difference between the two signals (in absolute value), normalized by the mean value in the ECG signal.
3. To measure the interchangeability between measures, two reliability indexes were used: Lin’s concordance correlation coefficient (CCC) and intraclass correlation coefficient (ICC).
The CCC index measures the reliability between two methods, and it determines how far the observed data deviate from the line of perfect concordance line at 45º on a square axis scatter plot, see Lin [18]. Alternatively, ICC index which also measures reliability, represents the ratio of between-sample variance and the total variance (between- and within-sample) to measure precision under the model of equal marginal distributions, see Fisher [11].
4. The agreement was measured by an information-based measure of disagreement (IBMD) proposed in Costa-Santos [9]. This measurement is based on Shannons entropy and equals 0 when the observers agree (no disagreement: xi =yi), i.e., there is no information in the differences between methods X and Y. This measurement increases towards to 1 if the amount of information in the difference increases. The agreement (A) can be quantified as A=1-IBMD.
3.Results
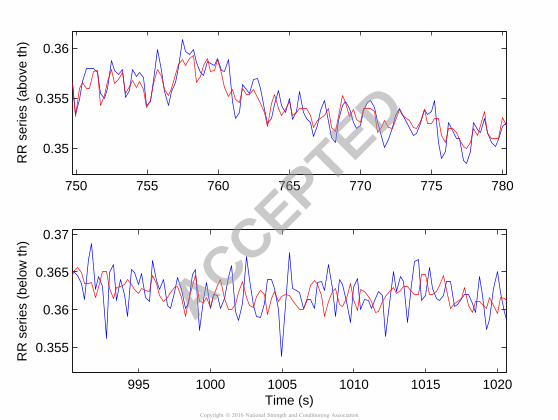
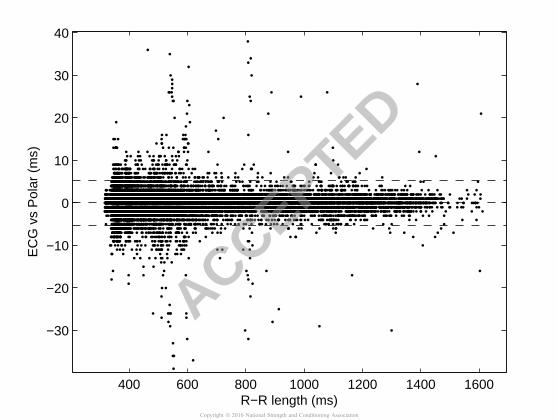
Bland-Altman plot
Figure 4 shows a Bland-Altman plot which evaluates the inter-method discrepancies between ECG and Polar RR measurements and the stability across a wider value range. The central and the upper and lower horizontal lines show the bias (mean) and the LOA (±1.96*std values), respectively, of the differences between both methods. 27552 paired RR measurements were used, from which 96.68% were contained within the range. For shorter RR, i.e. higher heart rates, the discrepancies are larger. Table 2 shows the bias, LOA and the percentage of paired RR measurements out of the LOA for each interval and the whole data combined. The mean RR and standard deviation associated to each interval is also shown.
[Figure 4 here]
[Table 2 here]
Pearson’s correlation coefficient
Figure 5 shows an example of , and for one subject. Due to the differences in the axes, the resting and exercise phase are represented in different plots. Left panels show the evolution of these signals during the 5 minutes prior to the
Copyright ª 2016 National Strength and Conditioning Association
ACCEPTED

exercise (resting interval), with blue representing the signal derived from and red the signal derived from . Right panels show the exercise phase.
[Figure 5 here]
Table 3 shows how many subjects present a Pearson’s coefficient above 0.8 in each interval, for the different signals. Also, the error calculated between the ECG and Polar derived measurements are displayed in brackets.
[Table 3 here]
Reliability and agreement coefficients (CCC, ICC and A)
Table 4 shows the CCC and ICC values in each interval. Coefficients are lower in than in , which was not expected, but still excellent reliability, i.e., above 0.9. These coefficients decrease in the last intervals (near the exercise peak) for PHF. We consider coefficient values lower than 0.7 as markers of poor reliability. Table 4 also shows the agreement between both methods in each interval. It is very similar as the reliability coefficients, with decreasing values for PHF near the peak of exercise.
[Table 4 here]
4.Discussion
In this study, HRV analysis derived from RR series recorded by HR monitor Polar RS800 has been validated against HRV analysis derived from a simultaneous ECG recording during dynamic exercise of low, medium and high intensity. Analysis during the resting phase is in agreement with those from previous studies, which support the validity of HRV analysis from Polar at rest: Rezende et al. [27] reported high correlation coefficients between all spectral HRV parameters (LF, HF and ratio LF/HF). Gamelin et al. [12] presented very similar results during the resting phase, with a correlaction coefficient of ρ > 0.99. In a recent study, Giles et al. [13] validated the HRV parameters from Polar V800 at rest and showed that a strong correlation (ICC>0.999) and a narrower LOA could be achieved, when using an extra correction layer to identify errors in the Polar signal, and using the same software package for both the Polar and ECG signals. We have adopted a similar approach applying the same algorithms to RR series recorded by Polar and those derived from the ECG, but no extra correction layer was used in Polar annotations.
In this database, only 19 out of 23 recordings presented high correlation coefficient in PLF at rest, ρ > 0.8, which is unexpected. The reason may be that in the other 4 recordings, changes in QRS amplitude or morphology may confuse Polar detection
Copyright ª 2016 National Strength and Conditioning Association
ACCEPTED

algorithm, as displayed in Fig. 6. These changes in beat detection point introduce additional variation in the Polar RR-intervals which are not present in the ECG annotations, justifying the lower linear correlation in PLF observed in these subjects during the resting phase. Nevertheless, those were not sufficient to disrupt the excellent reliability and agreement found, as can be seen in Table 4.
[Figure 6 here]
Regarding the exercise phase, the first issue to study is the agreement between the detected R-peaks, which is addressed assessing the agreement between RR series. It can be observed that for higher intensity levels, related to shorter RR values, the more differences there are between the RR series obtained from Polar device and from the ECG. The Bland-Altman plot shows how the discrepancy increases from 1.67% of the RR pairs out of the limits of agreement (at rest) to 4.80% in the last interval (I100).
Regarding HRM at exercise, it shows an excellent correlation, reliability and agreement during the whole test between both measurements. Higher loads of exercise do not decrease the performance of the Polar measurements. PLF also shows excellent correlation, reliability and agreement during the whole exercise test, meaning that Polar device can follow heart rate oscillations up to 0.15 Hz as well as the ECG reference. Interestingly, the beat detection errors which occasionally happened at rest disappear in the exercise phase. These results support the use of these devices in those applications where only changes of slow oscillations (HRM and PLF) in heart rate matter while doing physical activities (sports, 24-hour Holter recordings...).
In this work, the relative error between PHF derived from Polar and that derived from the ECG is higher than for PLF in all the intervals considered, including the resting phase. Moreover, the disagreement in PHF increased with the increase in exercise intensity. Power in the high frequency band is mainly related to respiratory sinus arrhythmia. During exercise, both respiratory frequency and depth change. Besides, in the HF band there could be another components related to the pedal frequency (cardiolocomotor coupling) which are not related to the autonomic control, see Bailón et al. [5]. Since a high level of exercise leads to a higher noise level, errors in beat detection are more likely to occur. A possible reason for this worse agreement is that Polar device uses some kind of filtering or prediction when a beat cannot be accurately detected, leading to an underestimation of HF power by Polar. However, we must say that in some recordings (12 out of 23), PHF measurements obtained from Polar coincided with those from the ECG even at the highest intensity interval (ρ > 0.8), so the correlation between HRV derived from Polar device and from the ECG strongly depends on subject characteristics and exercise performance.
Weippert et al. [35] validated HRV measurements from Polar device during walking and moderate to vigorous static exercise of the limbs with good results in both PLF and PHF. Unlike static exercise, high intensity dynamic exercise may contaminate the ECG signal with such amount of muscular noise and movement interferences that induces errors in the Polar detection algorithm. Although this may also happen in the reference
Copyright ª 2016 National Strength and Conditioning Association
ACCEPTED

ECG, we have used a QRS detection algorithm optimized for exercise conditions and all the detections have been visually checked.
In addition to the LF, HF and cardiolocomotor coupling components (the latter not reported in this work), a new frequency component was found around 1 Hz in HRV signals provided by the Polar device. This component did not appear in the HRV signal derived from the reference ECG, and it was present only in 8 subjects during the exercise phase. It is still unclear neither the origin of this component, nor the reason why it only appears in some recordings, but it should be taken into account when analysing the total power of HRV obtained from Polar.
In conclusion, both methods are interchangeable when measuring HRM and PLF, regardless of the level of exercise (reliability and agreement > 0.9). However, the performance of the PHF measurements from Polar device decreases as the level of the exercise increases, with reliability and agreement coefficients around 0.5 or lower.
One potential limitation of this study is that only men are studied. Works like Wallén et al. [33] state that the reliability between Polar and ECG measurements is weaker for women; hence a further study should validate the Polar device during exercise in women. Moreover, subjects included in the study regularly participate in sports
activities ( max: 57.8 ± 6.1 ml ·kg-1·min-1), therefore, they are not representative of the general population, which may be a potential limitation related to practical application.
5. Practical Applications
This study validates a Polar heart rate monitor during exercise. The use of these wearables devices has recently grown, especially in casual sport. HRV indexes have normally been studied to measure chronic adaptation in athletes, mainly at rest, see Borresen et al. [8], Hottenrott et al. [15]. It would also be interesting to record the RR series during the exercise and the recovery phases, which could provide more information regarding the autonomic balance behaviour.
Using a Polar device, any athlete could have a recording of every training session and, later, use it to adjust the training load or evaluate the overtraining. In the clinic, exercise therapy is used to improve the HRV in patients with chronic heart failure (CHF), myocardial infarction (MI), coronary artery disease and hypertension, among others. HRV parameters measured at frequency components up to 0.15 Hz (LF and lower) have been found to be predictors of mortality in patients with CHF or MI when being analysed after the exercise sessions, see Routledge et al. [28]. Therefore, being able to measure those HRV parameters also during the exercise could add new diagnostic information; as the case of ischemic patients, who show different HRV behaviour during exercise depending on the ischemia etiology.
However, clinicians, coaches and sports physiologists need to be cautious when interpreting the high frequency HRV parameters provided by Polar during training. Results of this study suggest that RR series provided by Polar device are useful to study
Copyright ª 2016 National Strength and Conditioning Association
ACCEPTED

the evolution of slow oscillations in HRV, such as the changes in mean HR or the LF component.
References
[1] Acton F. Analysis of Straight-Line Data. New York: Dover; 1966.
[2] Aubert A, Seps B, Beckers F. Heart rate variability in athletes. Sports Med. 2003; 33(12):889–919.
[3] Bailón R, Laguna P, Mainardi L, Sörnmo L. Analysis of heart rate variability using time-varying frequency bands based on respiratory frequency. 29th Annual International Conference of the IEEE Engineering in Medicine and Biology Society. 2007; 6674–6677.
[4] Bailón R, Laouini G, Grao C, Orini M, Laguna P, Meste O. The integral pulse frequency modulation with time-varying threshold: Application to heart rate variability analysis during exercise stress testing. IEEE Trans Biomed Eng. 2011; 58(3):642–652.
[5] Bailón R, Garatachea N, de la Iglesia I, Casajús J, Laguna P. Influence of running stride frequency in heart rate variability analysis during treadmill exercise testing. IEEE Trans Biomed Eng. 2013; 60(7):1796–1805.
[6] Bailón R, Serrano P, Laguna P. Influence of time-varying mean heart rate in coronary artery disease diagnostic performance of heart rate variability indices from exercise stress testing. Journal of Electrocardiology. 2011; 44: 445–452.
[7] Bland J, Altman D. Statistical methods for assessing agreement between two methods of clinical measurement. Lancet. 1986; 8:307–310.
[8] Borresen J, Lambert M. Autonomic control of heart rate during and after exercise: measurements and implications for monitoring training status. Sports Med. 2008; 38(8):633–646.
[9] Costa-Santos C, Antunes L, Souto A, Bernardes J. Assessment of disagreement: a new information-based approach. Annals of epidemiology. 2010; 20(7):555–561.
[10] Drezner JA, Fischbach P, Froelicher V, Marek J, Pelliccia A, Prutkin JM, Schmied CM, Sharma S, Wilson MG, Ackerman MJ, Anderson J, Ashley E, Asplund CA, Baggish AL, Brjesson M, Cannon BC, Corrado D, DiFiori JP, Harmon KG, Heidbuchel H, Owens DS, Paul S, Salerno JC, Stein R, Vetter VL. Normal electrocardiographic findings: recognising physiological adaptations in athletes. Br J Sports Med. 2013; 47(3):125–136.
[11] Fisher R. Statistical methods for research workers. Edinburgh: Oliver & Boyd; 1925.
Copyright ª 2016 National Strength and Conditioning Association
ACCEPTED

[12] Gamelin F, Baquet G, Berthoin S, Bosquet L. Validity of the polar S810 to measure R-R intervals in children. Int J Sports Med. 2008; 29(2):134–138.
[13] Giles D, Draper N, NeilW. Validity of the polar V800 heart rate monitor to measure RR intervals at rest. Eur J Appl Physiol. 2016; 116:563–571.
[14] Hernando D, Bailón R, Almeida R, Hernández A. QRS detection optimization in stress test recordings using evolutionary algorithms. XLI International Conference on Computing in Cardiology. 2014; 737–740.
[15] Hottenrott K, Hoos O, Esperer H. Heart rate variability and physical exercise. Current status. Herz. 2006; 31(6):544–552.
[16] Kaber D, Perry C, Segall N, Sheik-Nainar M. Workload state classiffcation with automation during simulated air traffic control. Int J Aviat Psychol. 2007; 17:371–390.
[17] Kumar M, Weippert M, Vilbrandt R, Kreuzfeld S, Stoll R. Fuzzy evaluation of heart rate signals for mental stress assessment. IEEE Trans Fuzzy Syst. 2007; 15:791–808.
[18] Lin L. A concordance correlation coefficient to evaluate reproducibility. Biometrics. 1989; 45:255–268.
[19] Llamedo M, Martnez JP. QRS detectors performance comparison in public databases. XLI International Conference on Computing in Cardiology. 2014; 357–360.
[20] Mainardi L. On the quantification of heart rate variability spectral parameters using time–frequency and time-varying methods. Philosophical Transactions of the Royal Society of London A: Mathematical, Physical and Engineering Sciences. 2009; 367(1887):255–275.
[21] Martin W, Flandrin P. WignerVille spectral analysis of nonstationary processes. IEEE Trans Acoust Speech Signal Process. 1985; 33:1461–1470.
[22] Martinmäki K, Häkkinen K, Mikkola J, Rusko H. Effect of low-dose endurance training on heart rate variability at rest and during an incremental maximal exercise test. Eur J Appl Physiol. 2008; 104(3):541–548.
[23] Martínez JP, Almeida R, Olmos S, Rocha AP, Laguna P. A wavelet-based ECG delineator: Evaluation on standard databases. IEEE Trans Biomed Eng. 2004; 51(4):570–581.
[24] Mateo J, Laguna P. Analysis of heart rate variability in the presence of ectopic beats using the heart timing signal. IEEE Trans Biomed Eng. 2003; 50(3):334–343.
[25] Pradhapan P, Tarvainen M, Nieminen T, Lehtinen R, Nikus K, Lehtimäki T, Kähönen M, Viik J. Effect of heart rate correction on pre- and post-exercise heart rate variability to predict risk of mortality-an experimental study on the FINCAVAS cohort. Front Physiol. 2014; doi: 10.3389/fphys.2014.00208.
[26] Ranganathan G, Rangarajan R, Bindhu V. Evaluation of ECG signals for mental stress assessment using fuzzy technique. IJSCE. 2011; 1(4):195–201.
Copyright ª 2016 National Strength and Conditioning Association
ACCEPTED

[27] Rezende Barbosa M, Silva N, Azevedo F, Pastre C, Vanderlei L. Comparison of Polar R RS800G3TM heart rate monitor with Polar R S810iTM and electrocardiogram to obtain the series of RR intervals and analysis of heart rate variability at rest. Clin Physiol Funct Imaging. 2014; doi: 10.1111/cpf.12203.
[28] Routledge FS, Campbell TS, McFetridge-Durdle JA, Bacon SL. Improvements in heart rate variability with exercise therapy. The Canadian Journal of Cardiology. 2010; 26(6):303-312.
[29] Sacha J, Sobon J, Sacha K, Barabach S. Heart rate impact on the reproducibility of heart rate variability analysis. Int J Cardiol. 2013; 19(3):207-216.
[30] Sacha J. Interaction between heart rate and heart rate variability. Ann Noninvasive Electrocardiol. 2014; 168(4):4257-4259.
[31] Tobaldini E, Nobili L, Strada S, Casali K, Braghiroli A, Montano N. Heart rate variability in normal and pathological sleep. Front Physiol. 2013; 4:294.
[32] Turner S, Eastwood P, Cecins N, Hillman D, Jenkins S. Physiologic responses to incremental and self-paced exercise in COPD: a comparison of three tests. Chest. 2004; 126:766–773.
[33] Wallén M, Hasson D, Theorell T, Canlon B, Osika W. Possibilities and limitations of the polar rs800 in measuring heart rate variability at rest. Eur J Appl Physiol. 2012; 112(3):1153–1165.
[34] Wasserman K. Principles of Exercise Testing and Interpretation: Including Pathophysiology and Clinical Applications. Lippincott Williams & Wilkins. 2011 (5th edition).
[35] Weippert M, Kumar M, Kreuzfeld S, Arndt D, Rieger A, Stoll R. Comparison of three mobile devices for measuring R-R intervals and heart rate variability: Polar S810i, Suunto t6 and an ambulatory ECG system. Eur J Appl Physiol. 2010; 109(4):779–786.
[36] Working group of ESC. Heart rate variability. Standards of measurement, physiological interpretation, and clinical use. Eur Heart J. 1996; 17:354–381.
Copyright ª 2016 National Strength and Conditioning Association
ACCEPTED

Acknowledgements
This work is supported by the Diputación General de Aragón (DGA), Spain, through a fellowship with reference B195/12, by the Ministerio de Economía y Competitividad and FEDER (EU), under project TIN2014-53567-R and TEC2013-42140-R, by CIBER in Bioengineering, Biomaterials & Nanomedicine (CIBER-BBN), by Grupo Consolidado BSICoS ref:T96 from DGA, by Aragón Institute of Engineering Research (I3A), IIS Aragón and European Social Fund (EU). Research was partially supported by CMUP (UID/MAT/00144/2013), funded by FCT (Portugal) with national (MEC) and European structural funds through FEDER, under the partnership agreement PT2020. The computation was performed by the ICTS NANBIOSIS, more specifically by the High Performance Computing Unit of the CIBER-BBN at the University of Zaragoza. The authors also want to acknowledge the support from Mortara Instr Inc. The results of the current study do not constitute endorsement of the product by the authors or the journal.
Fig. 1 Example of RR series during the resting (0-300 s), exercise (300-900 s) and recovery (900-end) phases for one subject.
Fig. 2 Example of oxygen consumption ( ) signal and intervals , , , and
(resting phase, 0-40%, 40-60%, 60-80% and 80-100% of , respectively) for one subject.
Fig. 3 Example of an interval of the RR series with a high correlation coefficient ρ = 0.89 (upper panel) and low correlation coefficient ρ = 0.65 (lower panel): in blue, in red.
Fig. 4 Bland-Altman plot: vs . Mean of the difference of the RR measurements ±1.96*std values (limits of agreement, LOA)
Fig. 5 Example of , and : resting phase (left) and exercise phase (right). Blue denotes signals derived from ECG and red denotes signals derived from Polar. Note that the axis have different scales.
Fig. 6 Example of ECG at rest with QRS detections (red marks) and Polar time occurrences (black marks).
Copyright ª 2016 National Strength and Conditioning Association
ACCEPTED

1
2
Table 1 Study population characteristics (23 male volunteers): age, height, mass, body 3
mass index and maximum oxygen consumption ( max). Mean ± standard deviation. 4
Age (years) 34.8 ± 5.0 Height (cm) 178.4 ± 5.7 Mass (kg) 74.8 ± 7.8 Body mass index (kg·m-2) 23.5 ± 2.5
max (ml ·kg-1·min-1) 57.8 ± 6.1
Copyright ª 2016 National Strength and Conditioning Association
ACCEPTED

5
Table 2 Bias, limits of agreement (LOA) and percentage of paired RR measurements 6
out of the LOA. Different intervals are based of the oxygen consumption ( ): , 7
, , and for the resting phase, 0-40%, 40-60%, 60-80% and 80-100% of 8
, respectively. 9
RR (ms) BIAS (ms) LOA (ms) Out LOA (%) : 359.7 ± 42.7 -0.0192 [-5.198, 5.160] 4.80 : 435.9 ± 33.5 -0.0022 [-4.234, 4.229] 3.99 : 507.9 ± 38.4 -0.0737 [-6.075, 5.927] 3.81 : 635.5 ± 89.1 0.1484 [-5.981, 6.277] 3.11
: 1167.3 ± 442.7 0.0616 [-5.174, 5.298] 1.67 Whole range 0.0205 [-5.341, 5.382] 3.32
Copyright ª 2016 National Strength and Conditioning Association
ACCEPTED

10
Table 3 Number of subjects (out of 23) with a significant ρ > 0.8 and the relative error 11
(in brackets). Different intervals are based of the oxygen consumption ( ): , , 12
, and for the resting phase, 0-40%, 40-60%, 60-80% and 80-100% of , 13
respectively. 14
HRM 23 (0.58%) 23 (0.09%) 23 (0.05%) 23 (0.06%) 23 (0.07%) PLF 19 (3.82%) 23 (2.59%) 23 (6.01%) 22 (5.49%) 22 (12.73%) PHF 22 (9.26%) 20 (15.77%) 17 (29.93%) 16 (63.91%) 12 (90.25%)
Copyright ª 2016 National Strength and Conditioning Association
ACCEPTED

15
Table 4 Reliability (CCC, ICC) and agreement (A) coefficients for each interval, with 16
the confidence intervals. Values lower than 0.7 are bold. Different intervals are based of 17
the oxygen consumption ( ): , , , and for the resting phase, 0-40%, 18
40-60%, 60-80% and 80-100% of , respectively. 19
0.9776 1.0000 0.9999 1.0000 1.0000 CCC
(0.9679,0.9898) (0.9999,1.0000) (0.9998,1.0000) (1.0000,1.0000) (1.0000,1.0000)
0.9994 1.0000 0.9999 1.0000 1.0000 ICC (0.9983,0.9998) (0.9999,1.0000) (0.9998,1.0000) (1.0000,1.0000) (1.0000,1.0000)
0.9937 0.9994 0.9989 0.9995 0.9993
RR
A (0.9868,0.9971) (0.9982,0.9998) (0.9959,0.9998) (0.9992,0.9997) (0.9987,0.9997)
0.9989 0.9999 1.0000 1.0000 1.0000 CCC (0.9979,0.9998) (0.9998,1.0000) (1.0000,1.0000) (1.0000,1.0000) (1.0000,1.0000)
0.9995 0.9999 1.0000 1.0000 1.0000 ICC (0.9983,0.9998) (0.9998,1.0000) (1.0000,1.0000) (1.0000,1.0000) (1.0000,1.0000)
0.9938 0.9991 0.9995 0.9995 0.9995
HRM
A (0.9870,0.9970) (0.9968,0.9998) (0.9990,0.9998) (0.9992,0.9997) (0.9990,0.9997)
0.9677 0.9990 0.9951 0.9996 0.9996 CCC (0.9404,0.9951) (0.9982,0.9999) (0.9929,0.9973) (0.9992,0.9999) (0.9995,0.9997)
0.9843 0.9995 0.9976 0.9998 0.9998 ICC (0.9630,0.9933) (0.9989,0.9998) (0.9945,0.9990) (0.9995,0.9999) (0.9995,0.9999)
0.9222 0.9797 0.9562 0.9577 0.9210
PLF
A (0.8685,0.9590) (0.9691,0.9868) (0.8790,0.9780) (0.9372,0.9706) (0.8672,0.9251)
0.9674 0.9854 0.9296 0.8611 0.3342 CCC (0.9528,0.9819) (0.9729,0.9978) (0.8740,0.9851) (0.7582,0.9640) (0.0072,0.6756)
0.9840 0.9929 0.9650 0.9283 0.5121 ICC (0.9583,0.9935) (0.9817,0.9971) (0.9175,0.9852) (0.8319,0.9695) (0.1860,0.7957)
0.9069 0.7859 0.7160 0.5641 0.5633
PHF
A (0.8565,0.9423) (0.6823,0.8564) (0.6390,0.7885) (0.4504,0.6762) (0.4508,0.6687)
20
21
Copyright ª 2016 National Strength and Conditioning Association
ACCEPTED

2 4 6 8 10 12 14 16 18 20
0.4
0.5
0.6
0.7
0.8
0.9
1
1.1
1.2
RR
ser
ies
(s)
Time (min)Copyright ª 2016 National Strength and Conditioning Association
ACCEPTED

0 2 4 6 8 10 12 14 160
500
1000
1500
2000
2500
3000
3500
4000IR
I40
I60
I80
I100
Time (min)
VO
2 (m
l/min
)
Copyright ª 2016 National Strength and Conditioning Association
ACCEPTED
750 755 760 765 770 775 780
0.35
0.355
0.36
RR
ser
ies
(abo
ve th
)
995 1000 1005 1010 1015 1020
0.355
0.36
0.365
0.37
RR
ser
ies
(bel
ow th
)
Time (s)Copyright ª 2016 National Strength and Conditioning Association
ACCEPTED
400 600 800 1000 1200 1400 1600
−30
−20
−10
0
10
20
30
40
R−R length (ms)
EC
G v
s P
olar
(m
s)
Copyright ª 2016 National Strength and Conditioning Association
ACCEPTED

2 3 4 5
1
1.2
Restd H
R(n
) (H
z)
10 11 12 13
2
2.2
2.4
Exercise
2 3 4 5
1
2
3
x 10−3
PLF
(n)
10 11 12 13
2
4x 10
−5
2 3 4 50
5
10x 10
−4
PH
F(n
)
Time (min)10 11 12 13
1
2
3x 10
−5
Time (min)
Copyright ª 2016 National Strength and Conditioning Association
ACCEPTED

270 271 272 273 274 275 276 277 278 279
−3
−2
−1
0
1
2
3
Time (s)
EC
G S
igna
l (m
V)
ECG signalECG detectionsPolar information
ACCEPTED
Copyright ª 2016 National Strength and Conditioning Association