Embed Size (px)
Citation preview

FEBRUARY 2015
Here we go again… Financial policies in volatile environments: Lessons for and from energy firms

Published by Corporate Finance Advisory
For questions or further information, please contact:
Corporate Finance Advisory
Marc Zenner [email protected] (212) 834-4330
Evan Junek [email protected] (212) 834-5110
Ram Chivukula [email protected] (212) 622-5682

FINANCIAL POLICIES IN VOLATILE ENVIRONMENTS: LESSONS FOR AND FROM ENERGY FIRMS | 1
1. Financial policies in volatile environmentsMuch has been said and written about the recent “sudden” and “steep” decline in oil prices. It is not the first time, however, that a commodity sector has experienced a precipitous price decline. Since 1983, the oil sector experienced seven downturns during which oil prices declined by more than 40%.1 Not surprisingly, many energy firms are prudently capitalized to withstand such “shocks.”2 In this report, we explore the nature of previous shocks and review the toolkit energy firms have relied on to withstand downturns of different lengths and magnitudes. Insights from this analysis are useful not only for senior decision makers in the energy sector, but also for all executives given the importance of energy prices in the economy and the potential for price shocks in other sectors.
Given the propensity for “surprises” in oil prices, energy firms typically have conservative capital structures, even relative to firms in other cyclical sectors (Figure 1). To put this in perspective, when oil prices were significantly higher a year ago, the median net debt to EBITDA ratio of BBB-rated energy firms was approximately 1x compared to about 2x for BBB-rated industrials and materials firms, around 3x for BBB-rated companies in consumer staples and healthcare firms and 4x for BBB-rated utilities.3 Similar conservatism is seen in shareholder payouts. For example, the median shareholder payout ratio for energy firms is approximately 30% versus 50%–70% for firms in most other sectors. In line with this approach, rating agencies evaluate firms in the sector with an understanding of the cyclical nature of the business. This “through-cycle” ratings analysis means that for a firm with a specific asset mix, a debt to EBITDA ratio of 1x to 2x may be appropriate for a BBB-rated company at the peak of the cycle, while a 3x ratio may be appropriate at the trough.
Figure 1
Cyclical firms tend to maintain through-cycle financial policies
Financial policies for BBB-rated firms in select sectors
1 In this report, oil price refers to spot prices of West Texas Intermediate (WTI – Cushing)2 Energy or Oil and Gas firms refers collectively to Exploration and Production (“E&P”), Oilfield Services, Integrated, Midstream, and
Refining and Marketing firms3 In this report, unless otherwise specified, we are referring to categories of ratings. For instance, “BBB-rated firms” refers to firms
rated BBB+, BBB or BBB- by Standard & Poor’s
Energy Industrials,Materials
Net debt/EBITDA1
Shareholderpayout ratio1,2
~1x
~30% ~70%
~2x
Consumer staples,Healthcare
~3x
~50%
~4x
~70%
Utilities
More cyclical Less cyclical
Source: J.P. Morgan, Bloomberg1 Median for S&P 500 firms, in their respective sectors, which are rated in the BBB category by S&P2 Payout ratio defined as all dividends and repurchases over the last twelve months as a percentage of net income
before extraordinary items

2 | Corporate Finance Advisory
When price shocks inevitably occur, energy firms have a “well-oiled” set of tools to raise liquidity, both internally and externally. The least disruptive/lowest cost tools include cutting capital expenditures (“capex”), significantly reducing buybacks, making headcount reductions and monetizing hedges. As oil prices have continuously fallen since the summer of 2014, many firms have already used their entire internal toolkit to raise or preserve liquidity. Firms who have investment commitments that they cannot or do not wish to delay are now considering raising external liquidity in the capital markets. This raise could be debt, equity or equity-like depending on ratings, pricing and capital market access.
Underlying virtually all financial policy decisions in a downturn is whether the recovery will be U-shaped or V-shaped. Management teams who believe that the price recovery will be slow (i.e., U-shaped) will likely embrace more conservative financial policy actions. In contrast, management teams who believe that there will be a quick recovery (i.e., V-shaped) will be less likely to raise equity at today’s prices and more likely to view their or others’ share prices as particularly attractive at today’s valuations. Firms that are on the fence may lean toward the more conservative policies since the costs of being wrong about the nature of the recovery are asymmetric versus the benefits.
Figure 2
U-shaped or V-shaped recovery?
Historical U.S. crude oil price ($/barrel)
Regrettably, we cannot provide an answer as to whether a U-shaped recovery is more or less likely than a V-shaped one. While there have been several downcycles, they have all been sufficiently unique to prevent forecasting the next recovery with any degree of certainty. And we are not alone—there are also significant differences of opinion within the analyst community as to the nature and timing of the future recovery (Figure 2). Regardless, laying out the optimal financial policies under various recovery scenarios will help companies make better decisions.
0
20
40
60
80
100
$120
U-shaped or V-shaped recovery?
90th percentile of analysts’ forecasts
10th percentile of analysts’ forecasts
2Q2015 4Q2015 2Q2016 1Q2015 3Q2015 1Q2016 4Q2014 3Q2014
Source: J.P. Morgan, Bloomberg, U.S. Energy Information Administration

FINANCIAL POLICIES IN VOLATILE ENVIRONMENTS: LESSONS FOR AND FROM ENERGY FIRMS | 3
2. Here we go again... When black swans are not black swans
Cyclical sectors, by definition, are marked by cycles of demand growth outpacing supply growth leading to strong prices, subsequent periods of supply growth outpacing demand growth, and ultimately weak prices. As illustrated in Figure 3, oil prices were volatile for approximately twenty years in the mid-19th century. Subsequently, a period of relative calm was experienced from the late 19th century to the early 1970s. Volatility has been an ever-present factor since then.
Figure 3
Seven oil price declines in excess of 40% since 1983
Historical U.S. crude oil price ($/barrel)
0
50
100
150
200
250
$300 U.S. crude oil – Nominal U.S. crude oil – Real
0 20 40 60 80
100 120 140
$160
1866 1873
1880
1887
1894
1901
1908 1915
1922
1929
1936
1943
1950
1957
1964 1971
1978
1985
1992
1999
2006
2013
1859
1985
1987
1989
1991
1993
1995
1997
1999
2001
2003
2005
2007
2009 2011
2013
1983
Source: J.P. Morgan, Bloomberg, U.S. Energy Information AdministrationNote: Real dollar adjustments based on the CPI base year of 1913. Data prior to 1913 utilizes the 10-year average from 1913–1923 as the base year1 Time elapsed from peak to trough of oil prices2 Recovery time defined as the first date on which prices return to the six-month average price preceding the peak3 Returns shown from peak to trough4 Returns as of 1/30/2015
EXECUTIVE TAKEAWAY
Energy firms, like other cyclical firms, are capitalized to sustain downcycles. Once a downturn inevitably hits, they rely on a well-established sequence of tactics to raise or preserve liquidity. The recently announced material reductions to capex, by both independent oil producers and majors, suggest that many believe the current low-price environment will be prolonged. Ironically, as always in cyclical sectors, it is this perspective that leads to capex cuts and the associated production declines, which then plants the seeds for the next rebound.
PeakNovember 1985 July 1987 September 1990December 1996 November 2000 July 2008 June 2014
TroughMarch 1986October 1988March 1991December 1998January 2002December 2008
??
Decline length (yrs)1
0.31.2
0.42.01.20.5??
Recovery time (yrs)2
4.40.40.30.80.92.3??
WTI decline3
(67%)(42%)(51%)(59%)(50%)(78%)(53%)4
S&P 5003
19%(12%)
23%56%
(16%)(31%)
2%4

4 | Corporate Finance Advisory
Figure 3 also shows that there have been seven occurrences since 1983 in which oil prices have fallen in excess of 40%. In all but one of the seven foregoing downcycles, oil prices actually dropped more than 50%. Thus, “here we go again” is definitely an appropriate response by seasoned energy executives experiencing the sixth or seventh oil price slump of their career. This recent price history also means that price declines as drastic as 50% should be expected every four to five years.
Steep downcycles are not unique to oil. Other commodities, such as copper, steel, corn, shipping rates and natural gas, have experienced multiple steep price declines over the last twenty years. These downturns have some common characteristics, including the fact that industry experts do expect them to occur, but market participants do not know exactly when they will take place or how steep they will be. While market participants are aware of the expected price recovery, they do not know how soon the recovery will arrive. No standard definition for a recovery exists, however, per our definition of recovery time, they have recently taken as little as half a year and as long as four years.4
The pattern of up and downcycles in oil prices has salient consequences for the financial policies of firms operating in the energy sector:
(1) Firms expecting downcycles benefit from conservatively capitalizing themselves
(2) Conservative balance sheets become more valuable during the downturn
(3) Firms have an established set of financial tools to proactively withstand slumps
(4) The length of the decline determines how many firms will suffer significant financial stress in the downcycle and also which proactive strategies are optimal
3. The value of a conservative capital structureOil and gas exploration and services firms are generally conservatively capitalized, and rating agencies rate them through the cycle, meaning that credit benchmarks reflect: (1) that the cash flows of oil and gas firms will fluctuate more than the cash flows of firms in other sectors and (2) that expectations of cash flow shocks are built into the credit analysis. That said, if the downside shocks are steeper than expected or if the downcycle is expected to be particularly long, rating actions do transpire.
Financial markets tend to anticipate stress and respond more rapidly than rating agencies. In fact, corporate bond spreads currently reflect these expected balance sheet challenges. Just prior to the reversal of oil prices in July 2014, non-investment grade (i.e., high yield)
EXECUTIVE TAKEAWAY
After almost a century of unprecedented
stability, oil prices have displayed significant
volatility in the last forty years. This pattern
extends to other commodities as well. This
cyclicality in commodity prices has important
implications for corporate financial policies.
4 We define recovery time as the first date on which oil prices return to the six-month average preceding the peak

FINANCIAL POLICIES IN VOLATILE ENVIRONMENTS: LESSONS FOR AND FROM ENERGY FIRMS | 5
energy firms benefited from spreads that were lower than similarly rated firms in other sectors (Figure 4). By the end of 2014 this benefit had reversed, becoming a spread increment of more than 200bps for energy firms. And this figure does not capture the cost of actually accessing the debt markets with a new issue in this market.
Figure 4
Credit spreads have widened for energy firms, especially for high yield firms
Energy versus broader market spreads
As liquidity dries up, credit downgrades tend to rise (Figure 5). For example, in the 2008–2009 downturn, downgrades outnumbered upgrades by a ratio of approximately 3-to-1 in 2009 because of the severity of the cycle. So far, the ratio of downgrades to upgrades in 2014 has been in line with historical levels. As witnessed in 2008–2009, defaults and downgrades by energy firms may spike as the length and depth of the cycle becomes more apparent and whether or not some firms struggle with liquidity and capital markets access.
Figure 5
Credit downgrades rise as liquidity dries up
E&P firms’ historical downgrade rate
Decreased liquidity availability directly impacts borrowing costs, especially for non-investment grade firms. This impact can be directly seen in the cost of capital curve, which estimates a firm’s weighted average cost of capital across various ratings. Figure 6 shows the cost of capital curves for a typical E&P firm at four different points in time: June 2007 (pre-financial crisis), February 2009 (peak of the financial crisis), July 2014 (beginning of the current oil price slide) and January 2015 (oil prices down more than 50%).
1.4x
0.5x0.4x
0.9x
2.8x
0.8x0.6x
0.8x
1.3x
0.8x
2005 2006 2007 2008 2009 2010 2011 2012 2013 2014
Moredowngrades
More upgrades
Ratio of downgrades to upgrades
Source: J.P. Morgan, BloombergNote: Ratios represent the number of downgrades/upgrades throughout the year at the issuer rating level
-100bps
0bps
100bps
200bps
300bps
Apr 2014 Jul 2014 Oct 2014 Jan 2015
Investment grade High yield
Source: J.P. MorganNote: Spread equal to the difference between the J.P. Morgan U.S. Liquid Energy Index and the J.P. Morgan U.S. Liquid Non-Financials Index, and the J.P. Morgan Domestic Energy HY Index and J.P. Morgan Domestic HY Index

6 | Corporate Finance Advisory
Figure 6
The cost of capital for high yield E&P firms has recently spiked
Historical cost of capital curves for a typical E&P firm
The cost of capital curves in Figure 6 lead to the following insights:
(1) Through the cycle, the weighted average cost of capital for E&P firms is minimized when firms maintain ratings in the BBB range. This is consistent with other sectors
(2) The cost of capital today is still significantly lower than it was at the peak of the financial crisis
(3) The pronounced rise in borrowing costs for non-investment grade firms has resulted in a significant steepening of the cost of capital curve for E&P firms over the last several months, thus reinforcing the optimality of conservative capital structures
Equity values have appropriately reflected this more acute cost of capital differential (Figure 7). Since the recent downturn began, the equity values of A- and BBB-rated firms have declined about 20%–30%. In contrast, the equity values of B-rated firms have declined more than 50%. Accordingly, the severe debt market reaction will make financing challenges self-fulfilling for non-investment grade firms, who will find it more expensive or more challenging to execute the downcycle pecking order we will discuss in the next section.
Figure 7
Lower-rated firms do worse in downcycles
Stock price reactions for E&P firms by ratings
6%
7%
8%
9%
10%
11%
12%
13%
14%
BBBB+BBB-BBBBBB+A-A A+
WACC
WACC (6/2007) WACC (2/2009) WACC (7/2014) WACC (1/2015)
Feb 09: MiniumumWACC at A rating
Jul 14: MiniumumWACC at BBB- rating
Jan 15: MiniumumWACC at A rating Jun 07: Miniumum
WACC at BBB- rating
Source: J.P. Morgan, BloombergNote: Market risk premiums of 5.0% (Jun 2007), 8.0% (Feb 2009), 6.5% (Jul 2014) and 7.5% (Jan 2015); E&P WACC estimated using J.P. Morgan U.S. Liquid Energy Index and J.P. Morgan Domestic HY bond indices at each rating; average beta of E&P firms used
(19%)
(31%)
(46%) (52%)
A- or higher BBB- to BBB+ BB- to BB+ B+ or lower
Source: J.P. Morgan, FactSet data as of 1/30/2015Note: Figures illustrate total return since the recent WTI peak on 7/10/2014 of rated North American E&P and Integrated firms with a market capitalization that exceeds $500 million

FINANCIAL POLICIES IN VOLATILE ENVIRONMENTS: LESSONS FOR AND FROM ENERGY FIRMS | 7
4. The “downcycle” financial policy pecking orderDeclining oil prices no doubt place pressure on energy firms to shore up their liquidity. The pecking order for financing observed by firms in such times, however, differs from what firms would do in more benign environments. In downcycles, firms, particularly those with weaker balance sheets, may need to make hard choices including forgoing investment in future growth to preserve current liquidity. The tools used by firms to preserve or enhance liquidity depend on their perceived costs and are usually pursued in the following order:
• Internal financing: Tapping into internal liquidity often serves as the first line of defense in downcycles. Firms will aggressively lower selling, general & administrative (“SG&A”) expenditures, capex, working capital and shareholder distributions, particularly buybacks. Some of the capex cuts are executed because some of the projects are no longer economical in the current environment. Other capex cuts are executed despite good prospects if firms find capital market alternatives to be unattractive from a pricing perspective
• External financing: Before turning to external capital markets, firms may monetize in-the-money hedges and seek covenant relief to enhance their liquidity position. This may be a preferred alternative if the recovery is expected to be quick. When firms access the capital markets, they need to consider two objectives: raising liquidity and preserving balance sheet strength. Debt and debt-like securities provide much needed liquidity but may put undesired pressure on credit metrics. Equity or securities with equity characteristics, such as debt hybrids and mandatory convertibles, can provide liquidity and also help firms maintain the desired ratings and capital structures
• Strategic opportunities: A well-trodden path to incremental liquidity in the energy space is the sale of non-core assets. The effectiveness of this approach is limited in a downcycle because only the most attractive assets achieve reasonable price expectation. Firms may instead explore “game-changing” strategic alternatives. Merging with or acquiring another firm of comparable size may provide an avenue for firms to obtain size, scale and a better credit profile without having to sell equity. Furthermore, in a slump, the largest firms (who coincidentally also tend to have the greatest financial flexibility) can
EXECUTIVE TAKEAWAY
Energy firms are typically conservatively financed and have a battery of strategies and tactics to respond to downcycles. In addition, rating agencies rate these firms through the cycle, expecting fluctuations in EBITDA and cash flow. Nevertheless, debt and equity markets have responded harshly to the recent oil price declines, especially with regard to non-investment grade firms. As a result, some of these firms may find debt market access challenging or extremely expensive. This brutal financial market response alone may be self-fulfilling by reducing access to liquidity and making balance sheet repair more difficult.

8 | Corporate Finance Advisory
take advantage of their debt market access to acquire weaker participants. Even if the seller does not want to accept cash offers at this level, the buyer can offer stock and future upside (while simultaneously buying its own shares to achieve the same capital structure objectives)
Figure 8
The downcycle liquidity pecking order
EXECUTIVE TAKEAWAY
Historically, energy firms have taken both
internal and external actions in response
to challenging market conditions. Raising
liquidity—whether internally via capex
cuts, reductions in shareholder distributions
or headcount reductions, or externally via
debt or equity offerings—is a viable option.
Well-capitalized firms will, however, find
this an opportune time for strategic M&A
opportunities, not only to preserve value,
but also to capitalize on the optionality from
their strong balance sheet.
Raise capital internally
• Lower capital expenditures• Place share buybacks on hold• Cut selling, general & administrative expenditures• Manage working capital
Raise capital externally
• Monetize in-the-money hedges• Seek covenant relief• Issue bonds/hybrids• Issue equity/convertibles
Pursue M&A opportunities
• Explore strategic M&A alternatives• Leverage fortress balance sheet• Merge to obtain size and diversity ratings benefits• Sell assets to provide liquidity
Source: J.P. Morgan

FINANCIAL POLICIES IN VOLATILE ENVIRONMENTS: LESSONS FOR AND FROM ENERGY FIRMS | 9
5. Learning from the 2008–2009 crisis and from today’s responses
As discussed, the last seven months is not the first time energy prices have plummeted (nor will it be the last). We studied firm responses from 2008–2009 to gauge what could happen—and already could be happening—this time around. Estimated capex reductions have been even more pronounced so far. Although we are likely only to be in the early stages of corporate responses, and it is very possible that the ultimate pattern of action may differ, we expect patterns to be broadly similar.
5.1 Firms actively managed their operational policies while oil prices declined from 2008–2009
Tumbling energy prices from 2008–2009 led to a cut in capex of approximately 30%. By early 2014, capex had completely rebounded. Since July 2014, however, announced capex reductions for independent E&P and Integrated firms have already amounted to more than 30% (Figure 9). This swift response suggests that firms likely view the recent slash in prices as something that will last a while. The decline in capex is noteworthy since it is typically accompanied by cuts in related expenditures (often captured in SG&A). The combined effect of all these cuts could have ripple effects throughout the economy. Intriguingly, the severity of the capex cuts and the steep decline curves of shale production are also raising expectations that the pricing environment could rapidly improve. Counting on this recovery, however, introduces the risk of materially high leverage if production remains subdued and we experience a continued low-price environment.
The reaction of shareholder distributions in the previous oil price decline was more nuanced. Share buybacks almost ceased, as expected, while dividends barely budged. Interestingly, a few firms actually raised their dividend to emphasize their financial strength. Share repurchase activity will likely decline this time around as well. The impact on dividends will vary with the expected speed of recovery: the longer the expected time to recovery, the greater, if any, will be the cuts in dividends. As one might expect, firms with healthy dividend distributions also tend to be the larger and higher-rated firms. In contrast, smaller firms with more levered balance sheets also tend to have lower or no dividends.
Figure 9
Learning from financial policy responses in 2008–2009
Capitalexpenditures2 (29%) ($62.2bn) Capital expenditure cuts of more
than 30% already announced
Dividends3 2% $0.4bn Firms expected to evaluate—but maintain—their dividends
Sharerepurchases3 (92%) ($25.7bn) A large decline in share
repurchases is likely
Median1 Aggregate1 Observations for today
Headcount4 (13%) (51,000) In 2015, headcount reductionsare already taking e�ect
Source: J.P. Morgan, FactSet, Bureau of Labor StatisticsNote: Changes measured from 3/31/2008 to 3/31/2010 to capture pre- and post-decline firm statistics1 Sample includes North American E&P and Integrated firms with a market cap that exceeds $500 million2 Capital expenditures based LTM figures from 12/31/2008 to 3/31/20113 Firms who do not have a repurchase program or pay a dividend are excluded from the median and mean4 Headcount reductions based on employment data in the oil and gas sector in the second half of 2008 to the first
half of 2010

10 | Corporate Finance Advisory
5.2 In challenging conditions, the sources of external capital changeAs with other firms, energy firms primarily fund themselves internally with cash flow and externally with debt. In the beginning of a downcycle, spreads in the high yield market widen significantly—as shown in previous figures—making access for some firms appear prohibitively expensive, at least compared to the benign period they had just experienced. In addition, some of the firms have ratings objectives they can no longer maintain if they issue incremental debt. As a result, to bolster capital, firms turn to issuing equity or securities earning equity credit. For example, in 2008, as high yield debt issuance by energy firms fell 50% from the previous year (Figure 10), follow-on offerings more than doubled (Figure 11). We may witness similar actions this time around. Energy high yield issuance dropped 85% in the last two quarters of 2014, while strong equity issuances, including convertibles in January 2015, suggest we may follow a pattern similar to the one observed in 2009.
Figure 10
Non-investment grade issuances decline in the beginning of a downcycle
Energy high yield debt issuances ($bn)
Figure 11
In challenging conditions, the sources of capital change
Energy equity capital raised ($bn)
ConvertsFollow-onsIPOs
0.13.1 0.4
3.84.0
5.5
4.9
2.7
4.7
5.7
9.7
2.9
1.1
8.5
1.8
1.3
5.8
3.4
5.8
9.5
0.5
2.7
15.1
2.8
6.0
10.0
1.0
6.2
16.8
2.3
2.81.60.2
2.9
8.3
1.7
0.71.7
$14.3$13.1 $12.6
$11.3 $10.6
$15.8
$20.6
$17.0
$25.3
$4.5
$13.0
$3.5 $4.2$2.4
2006 2007 2008 2009 2010 2011 2012 2013 2014 Q114 Q214 Q314 Q414 2015
Source: J.P. Morgan, Dealogic. Excludes Master Limited Partnerships, data as of 1/30/2015
0
10
20
30
40
50
60
$70
2006 2007 2008 2009 2010 2011 2012 2013 2014 Q114 Q214 Q314 Q414 2015
Source: J.P. Morgan as of 1/30/2015

FINANCIAL POLICIES IN VOLATILE ENVIRONMENTS: LESSONS FOR AND FROM ENERGY FIRMS | 11
Another alternative available to firms both to improve their balance sheet strength and to enhance their access to debt markets is to expand their size and scale. A larger size and more diverse business can help firms move into higher ratings categories in good times and prevent a downgrade in bad times (Figure 12). As a result, firms may find mergers and acquisitions, in particular those that significantly increase size, attractive in the current environment not only from a strategic point of view, but also to obtain or maintain balance sheet strength and lower their cost of funding.
Figure 12
Size and scale are key determinants of credit quality in the energy space
Credit rating versus asset size for energy firms
EXECUTIVE TAKEAWAY
The corporate response to the current decline in oil prices appears to be stronger than the reaction to the 2008–2009 decline, suggesting that firms view the softening oil prices as here to stay for a while. Announced cuts in capital expenditure, SG&A and share repurchases are already sizeable. To raise liquidity, bolster balance sheets and take advantage of today’s opportunities, firms will likely issue equity and securities that provide equity credit.
Rat
ing
AAA AA+
AA AA- A+
A A-
BBB+ BBB
BBB- BB+
BB BB- B+
B B-
CCC+ CCC
R2 = 59%
21 22 23 24 25 26 27
Size (LN (Total assets)) Larger firms
Source: J.P. Morgan, BloombergNote: Ratings data calculated based on average of S&P and Moody’s ratings. Sample includes firms within GICS sectors as follows: Energy (including E&P, Integrated, Oilfield Services, Midstream and Refining), U.S. and with a market capitalization that exceeds $1 billion
12 | Corporate Finance Advisory
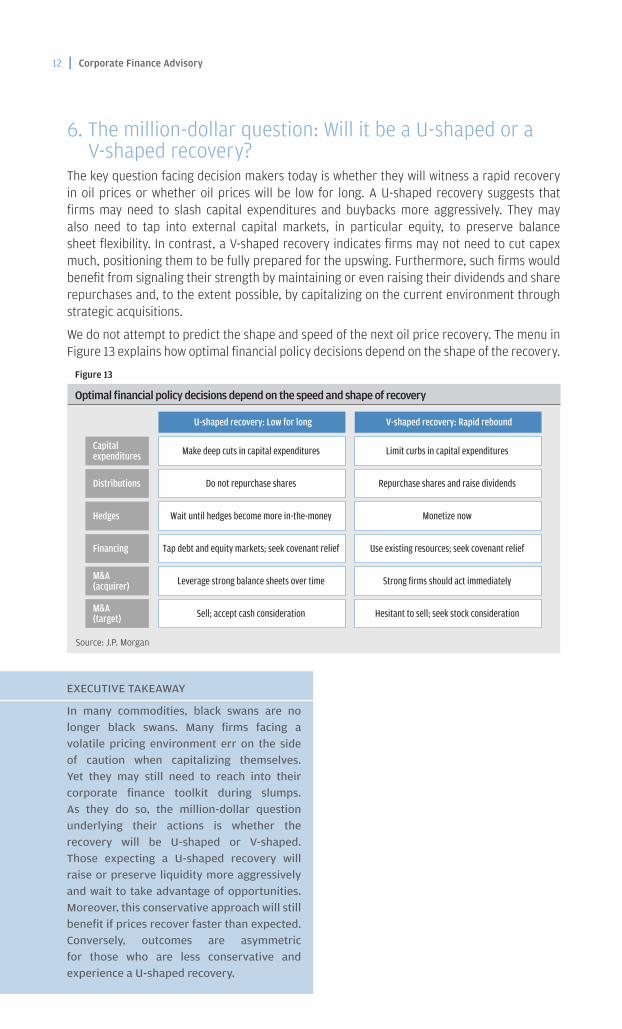
6. The million-dollar question: Will it be a U-shaped or a V-shaped recovery?
The key question facing decision makers today is whether they will witness a rapid recovery in oil prices or whether oil prices will be low for long. A U-shaped recovery suggests that firms may need to slash capital expenditures and buybacks more aggressively. They may also need to tap into external capital markets, in particular equity, to preserve balance sheet flexibility. In contrast, a V-shaped recovery indicates firms may not need to cut capex much, positioning them to be fully prepared for the upswing. Furthermore, such firms would benefit from signaling their strength by maintaining or even raising their dividends and share repurchases and, to the extent possible, by capitalizing on the current environment through strategic acquisitions.
We do not attempt to predict the shape and speed of the next oil price recovery. The menu in Figure 13 explains how optimal financial policy decisions depend on the shape of the recovery.
Figure 13
Optimal financial policy decisions depend on the speed and shape of recovery
V-shaped recovery: Rapid rebound U-shaped recovery: Low for long
Hedges Wait until hedges become more in-the-money Monetize now
Capitalexpenditures Make deep cuts in capital expenditures Limit curbs in capital expenditures
Financing Tap debt and equity markets; seek covenant relief Use existing resources; seek covenant relief
Distributions Do not repurchase shares Repurchase shares and raise dividends
M&A(target)
Sell; accept cash consideration Hesitant to sell; seek stock consideration
M&A(acquirer)
Leverage strong balance sheets over time Strong firms should act immediately
Source: J.P. Morgan
EXECUTIVE TAKEAWAY
In many commodities, black swans are no longer black swans. Many firms facing a volatile pricing environment err on the side of caution when capitalizing themselves. Yet they may still need to reach into their corporate finance toolkit during slumps. As they do so, the million-dollar question underlying their actions is whether the recovery will be U-shaped or V-shaped. Those expecting a U-shaped recovery will raise or preserve liquidity more aggressively and wait to take advantage of opportunities. Moreover, this conservative approach will still benefit if prices recover faster than expected. Conversely, outcomes are asymmetric for those who are less conservative and experience a U-shaped recovery.

FINANCIAL POLICIES IN VOLATILE ENVIRONMENTS: LESSONS FOR AND FROM ENERGY FIRMS | 13
This material is not a product of the Research Departments of J.P. Morgan and is not a research report. Unless otherwise specifically stated, any views or opinions expressed herein are solely those of the authors listed, and may differ from the views and opinions expressed by J.P. Morgan’s Research Departments or other departments or divisions of J.P. Morgan and its affiliates.
RESTRICTED DISTRIBUTION: Distribution of these materials is permitted to investment banking clients of J.P. Morgan. Distribution of these materials to others is not permitted unless specifically approved by J.P. Morgan. These materials are for your personal use only. Any distribution, copy, reprints and/or forward to others is strictly prohibited. Information has been obtained from sources believed to be reliable but J.P. Morgan does not warrant its completeness or accuracy. Information herein constitutes our judgment as of the date of this material and is subject to change without notice.
This material is not intended as an offer or solicitation for the purchase or sale of any financial instrument. In no event shall J.P. Morgan be liable for any use by any party of, for any decision made or action taken by any party in reliance upon, or for any inaccuracies or errors in, or omissions from, the information contained herein and such information may not be relied upon by you in evaluating the merits of participating in any transaction.
J.P. Morgan is the marketing name for the investment banking activities of JPMorgan Chase Bank, N.A., J.P. Morgan Securities LLC (member, NYSE), J.P. Morgan Securities plc (authorized by the FSA and member, LSE) and their investment banking affiliates.
Copyright 2015 JPMorgan Chase & Co. All rights reserved.
We would like to thank Allan Blair, Nathan Craig, Mark De Rocco, Matt Gallino, Sarah Hellman, Nicholas Kordonowy, Alykhan Lalani, Liz Myers and Paschall Tosch for their invaluable comments and suggestions. We also thank Jennifer Chan, Siobhan Dixon, Sarah Farmer and the Creative Services group for their help with the editorial process. We are particularly grateful to Joanne Toporowski for her tireless contributions to the analytics in this report as well as for her invaluable insights.