Embed Size (px)
Citation preview

©Her Majesty the Queen in right of Canada (2020)
All rights reserved
All requests for permission to reproduce this document
or any part thereof shall be addressed to
the Department of Finance Canada.
Cette publication est également disponible en français.
Cat. No.: F1-25E-PDF
ISSN: 1487-0428

Table of Contents
Note to Readers .......................................................................................................................................................... 5
Report Highlights ........................................................................................................................................................ 6
Revenues ..................................................................................................................................................................... 14
Expenses ...................................................................................................................................................................... 17
Federal Debt ............................................................................................................................................................... 21
Financial Source/Requirement ............................................................................................................................... 26
Report of the Auditor General on the Condensed Consolidated
Financial Statements of the Government of Canada .................................................................................... 29
Condensed Consolidated Financial Statements of the Government of Canada ......................................... 31


5
Note to Readers
The financial results in this report are based on the audited consolidated financial statements of the Government
of Canada for the fiscal year ended March 31, 2020, the condensed form of which is included in this report.
For the 22nd consecutive year, the government has received an unmodified audit opinion from the Auditor
General of Canada on the consolidated financial statements. The complete consolidated financial statements are
available on the Public Services and Procurement Canada website.
The Fiscal Reference Tables have been updated to incorporate the results for 2019–20 as well as historical revisions
to the National Economic and Financial Accounts published by Statistics Canada.

6
Report Highlights
The government posted a budgetary deficit of $39.4 billion for the fiscal year ended March 31, 2020, compared to an
estimated deficit of $34.4 billion in the July 2020 Economic and Fiscal Snapshot.
The budgetary deficit before net actuarial losses was $28.8 billion for the fiscal year ended March 31, 2020. The
budgetary balance before net actuarial losses is a new measure that is being introduced to supplement the
traditional budgetary balance and improve the transparency of the government’s financial reporting by isolating
the impact of the amortization of net actuarial losses arising from the government’s pension and other
employee future benefit plans.
Compared to the 2018–19 fiscal year:
- Revenues increased by $1.9 billion, or 0.6 per cent, primarily reflecting increases in income tax revenues
and the introduction of the fuel charge.
- Program expenses excluding net actuarial losses increased by $23.9 billion, or 7.6 per cent, reflecting
increases in all major categories of expenses, including fuel charge proceeds returned. Of this increase,
measures under Canada’s COVID-19 Economic Response Plan accounted for $7.2 billion.
- Net actuarial losses, which reflect changes in the measurement of the government’s obligations for
pensions and other employee future benefits accrued in previous fiscal years, increased by $2.2 billion,
or 26.9 per cent, due in large part to declines in year-end interest rates used in valuing these obligations
and increased costs associated with the utilization of disability and other future benefits provided to
veterans.
- Public debt charges were up $1.2 billion, or 5.1 per cent, largely reflecting higher Consumer Price Index
adjustments on Real Return Bonds, an increase in the stock of Government of Canada treasury bills, and
higher costs associated with marketable bonds.
The federal debt (the difference between total liabilities and total assets) stood at $721.4 billion at March 31, 2020.
The federal debt-to-GDP (gross domestic product) ratio was 31.3 per cent, up from 30.8 per cent in the
previous year.
As reported by the International Monetary Fund (IMF), Canada’s total government net debt-to-GDP ratio, which
includes the net debt of the federal, provincial/territorial and local governments, as well as the net assets held in the
Canada Pension Plan and Québec Pension Plan, stood at 25.9 per cent in 2019. This is the lowest level among Group
of Seven (G7) countries, which the IMF expects will record an average net debt of 88.1 per cent of GDP for the
same year.
For the 22nd consecutive year, the government has received an unmodified audit opinion from the Auditor General
of Canada on the consolidated financial statements.

7
Table 1
Financial Highlights
$ billions
2019–20 2018–19
Budgetary transactions
Revenues 334.1 332.2
Expenses
Program expenses, excluding net actuarial losses1 338.5 314.6
Public debt charges 24.4 23.3
Total expenses, excluding net actuarial losses1 362.9 337.8
Budgetary balance, excluding net actuarial losses1 (28.8) (5.6)
Net actuarial losses1 10.6 8.4
Budgetary balance (39.4) (14.0)
Non-budgetary transactions (7.8) 1.2
Financial source/requirement (47.2) (12.7)
Net change in financing activities 46.8 15.7
Net change in cash balances (0.4) 3.0
Cash balance at end of period 37.2 37.6
Financial position
Total liabilities 1,248.6 1,185.2
Total financial assets 435.7 413.0
Net debt (812.9) (772.1)
Non-financial assets 91.5 86.7
Federal debt (accumulated deficit) (721.4) (685.5)
Financial results (% of GDP)
Revenues 14.5 14.9
Total program expenses 15.2 14.5
Public debt charges 1.1 1.0
Budgetary balance (1.7) (0.6)
Federal debt (accumulated deficit) 31.3 30.8
Note: Numbers may not add due to rounding. 1 Comparative figures have been reclassified to conform to the current year's presentation. Information regarding this reclassification can be found in
Note 3 of the condensed consolidated financial statements.

8
Economic Developments1
The global economy was at a mature stage of the business cycle for most of 2019 and early 2020. Though the
expansion was moderating, the major trade tensions that had dogged the global outlook for the past few years
had eased. Many central banks had begun easing monetary policy gradually to try to maintain the expansion.
Real GDP in 2019 grew 1.7 per cent, after growth of 2.0 per cent in 2018. Throughout 2019, and into the early part
of 2020, the labour market continued to be strong, adding about 25,000 jobs per month over this period.
Commodity prices, responding to slowing global demand, saw modest declines; the price of West Texas
Intermediate crude oil declined to US$57 per barrel from US$65 per barrel in 2018. Short-term interest rates
remained around 1.7 per cent for most of 2019 as the Bank of Canada paused its monetary policy tightening cycle
for the year. However, long-term interest rates continued to decline throughout the year, averaging 1.6 per cent,
down from 2.3 per cent in 2018, as global monetary policy continued to gradually ease.
Canada's nominal GDP, the broadest measure of the tax base, grew 3.6 per cent in 2019, down from 3.9 per cent
in 2018, as real GDP growth moderated towards potential.
The global and Canadian economies, however, soon experienced an historic disruption in the final two weeks of
the fiscal year. The COVID-19 pandemic became an unprecedented threat to our health, and a global economic
challenge. With unprecedented speed and breadth, the COVID-19 pandemic affected nearly all aspects of life.
Public health containment measures led to large segments of the economy coming to an abrupt stop, with activity
in some industries driven to near zero. Workplaces and schools were closed, travel restricted, and public
gatherings banned, resulting in drastic impacts on many aspects of Canadians’ lives. In March 2020 alone, more
than 3 million people lost their jobs or saw their hours significantly scaled back.
The toll on the broader economy in 2020 is expected to be the largest and most sudden economic contraction
since the Great Depression. By just the first quarter of 2020, Canada had already witnessed a large decline in real
GDP, a drop in both short- and long-term interest rates to record lows, and a steep decline in commodity prices,
including for oil. As the recovery has taken hold over the summer of 2020, many of these indicators have since
bounced back; however, activity remains depressed in many sectors.
The Government of Canada’s rapid and substantial economic support measures have helped protect Canadians
from a far worse economic outcome, prevented more layoffs, and have laid a foundation for a faster and
stronger recovery.
Going forward, the threat of a resurgent wave of COVID-19 and uncertainty surrounding the durability of the
economic recovery, and the transition to a post-pandemic world, are the key risks to the global and domestic
economies. The fiscal results for 2019–20 only partially reflect the impact of COVID-19. In 2020–21, the severe
deterioration in the economic outlook plus the temporary measures implemented through the government’s
Economic Response Plan are expected to result in a projected deficit of $343.2 billion in 2020–21.2
1 This section incorporates data available up to and including August 26, 2020. The annual results are on a calendar year basis, unless otherwise specified.
2 Economic and Fiscal Snapshot 2020.

9
Table 2
Average Private Sector Forecasts
per cent
2018 2019 2020 2021
Real GDP growth
Budget 2019 2.0 1.7 1.6 1.7
2020 Economic and Fiscal Snapshot 2.0 1.7 (6.8) 5.5
Actual 2.0 1.7 – –
Nominal GDP growth
Budget 2019 4.1 3.4 3.5 3.7
2020 Economic and Fiscal Snapshot 3.9 3.6 (6.3) 7.9
Actual 3.9 3.6 – –
3-month treasury bill rate
Budget 2019 1.4 1.9 2.2 2.3
2020 Economic and Fiscal Snapshot 1.4 1.7 0.5 0.3
Actual 1.4 1.7 – –
10-year government bond rate
Budget 2019 2.3 2.4 2.7 2.8
2020 Economic and Fiscal Snapshot 2.3 1.6 0.8 1.0
Actual 2.3 1.6 – –
Unemployment rate
Budget 2019 5.8 5.7 5.9 6.0
2020 Economic and Fiscal Snapshot 5.8 5.7 9.8 7.8
Actual 5.8 5.7 – –
Consumer Price Index inflation
Budget 2019 2.3 1.9 2.0 1.9
2020 Economic and Fiscal Snapshot 2.2 2.0 0.5 2.0
Actual 2.2 2.0 – –
Note: Historical figures have been restated to reflect revisions in the Canadian System of National Accounts as of the first quarter of 2020, released on
May 29, 2020.
10
The Budgetary Balance
The government posted a budgetary deficit of $39.4 billion in 2019–20, compared to a deficit of $14.0 billion in
2018–19.
The annual deficit before net actuarial losses represents the difference between the government’s revenues and
expenses excluding net actuarial losses. By excluding the impact of re-measurement gains and losses stemming
from the annual revaluation of the government’s pension and other employee future benefit obligations accrued
in previous fiscal years, this measure is intended to present a clearer picture of the results of government
operations during the current fiscal year. The annual deficit before net actuarial losses stood at $28.8 billion for
2019–20, compared to $5.6 billion in 2018–19.
Canada's COVID-19 Economic Response Plan
Canada entered the COVID-19 pandemic in a strong fiscal position, enabling the government to take decisive
action to protect Canadians and businesses from the impacts of the pandemic. Canada’s COVID-19 Economic
Response Plan (the Plan) includes measures to protect the health and safety of Canadians and provide direct
support to Canadian workers and businesses. It also includes tax and customs duty payment deferrals to meet
liquidity needs of businesses and households and to help stabilize the Canadian economy. Combined, these
measures make Canada’s plan one of the most generous response plans in the world.
The Plan focuses on three broad areas of support:
- Health Care System and Safety of Canadians, such as funding to strengthen critical health care
systems, purchase personal protective equipment and supplies, and support critical medical research
and vaccine developments.
- Support to Individuals, which includes delivering immediate income support to those most affected
by the crisis, creating incentives for safe participation in the labour market, and ensuring vulnerable
Canadians have access to the supports they need.
- Support to Businesses, such as support for market liquidity to ensure that businesses can continue to
access credit, and bridge financing for businesses of all sizes so they can remain solvent and keep
Canadians employed.
The government continues to take the necessary steps to implement this Plan and ensure timely access to the
income support and credit relief that Canadians and businesses need to manage the pressures they are facing
as a result of COVID-19 so that the Canadian economy is well-positioned to recover when the crisis subsides.
The impact of this Plan on the financial results of the government will largely be felt in the 2020–21 fiscal year.
A relatively small share of the Plan is reflected in the 2019–20 results, including $6.5 billion for the Canada
Emergency Response Benefit, $0.5 billion in support for provincial and territorial public health preparedness
and critical health care systems, and $0.2 billion for national public health pandemic operations.
Further information on Canada's COVID-19 Economic Response Plan can be found at
https://www.canada.ca/en/department-finance/economic-response-plan.html.

11
The following graph shows the government’s budgetary balance since 1995–96, as well as the budgetary balance
before net actuarial losses since 2008–09. To enhance the comparability of results over time and across
jurisdictions, the budgetary balance and its components are presented as a percentage of GDP. In 2019–20, the
budgetary deficit was 1.7 per cent of GDP, compared to a deficit of 0.6 per cent of GDP in 2018–19. The budgetary
deficit before net actuarial losses was 1.2 per cent of GDP, compared to a deficit of 0.3 per cent of GDP a
year earlier.
Budgetary Balance
Sources: Public Accounts of Canada and Statistics Canada.
1 In 2017–18, the government implemented, on a retroactive basis, a change in its methodology for the determination of the discount rate for unfunded pension benefits. Fiscal
results for 2008–09 to 2016–17 were restated to reflect this change. Restated data for years prior to 2008–09 is not available.
Revenues were up $1.9 billion, or 0.6 per cent, from the prior year, primarily reflecting increases in income tax
revenues and the introduction of the fuel charge.
Expenses were up $27.3 billion, or 7.9 per cent, from the prior year. Program expenses excluding net actuarial
losses increased by $23.9 billion, or 7.6 per cent, primarily reflecting an increase in transfer payments. Net actuarial
losses increased by $2.2 billion, or 26.9 per cent, from the prior year, due in large part to declines in year-end
interest rates used to value the government’s pension and other employee future benefit obligations and
increased costs associated with the utilization of disability and other future benefits provided to veterans, which
have resulted in increases in the value of these obligations. Public debt charges increased by $1.2 billion, or 5.1
per cent, from the prior year, largely reflecting higher Consumer Price Index adjustments on Real Return Bonds, an
increase in the stock of Government of Canada treasury bills, and higher costs associated with marketable bonds.

12
Annual deficit before net actuarial losses
A new line item, Annual deficit before net actuarial losses, has been added to this year’s Condensed Consolidated
Statement of Operations and Accumulated Deficit to improve the transparency of the government's financial
reporting. This addition follows an introductory discussion of the concept in the Economic and Fiscal Update
2019, released on December 16, 2019, and public consultations undertaken during winter 2019 and spring 2020
on how this new measurement might be used in the government’s financial reporting framework. Given the
feedback received, the government has decided to incorporate this new measurement in its reports on projected
and actual financial results, starting with the 2019–20 consolidated financial statements.
Actuarial losses and gains arise from the annual re-measurement of the government's existing obligations for
public sector pensions and other future benefits owed to veterans and government employees. The
measurement of these obligations involves the extensive use of estimates and assumptions about future events
and circumstances, such as wage increases, inflation and mortality. In particular, the unfunded obligations are
sensitive to changes in short- and long-term interest rates, which are used to estimate the value of expected
future benefit payments in today's dollars. This volatility has increased in recent years, with the introduction of a
new discount rate methodology in the 2018 Public Accounts. Prior to the change in methodology, unfunded
pension obligations were discounted using a 20-year moving average of Government of Canada long-term bond
rates, which resulted in a relatively stable discount rate. Under the new methodology, unfunded benefit
obligations are discounted based on the spot rates of Government of Canada bonds at fiscal year-end (March
31), which can fluctuate significantly from one year to the next, resulting in actuarial gains and losses that flow
through the budgetary balance.
While these adjustments and revaluations are an important part of providing an accurate picture of the
government's statement of financial position at any given time, they can also result in large swings in the
budgetary balance, which may impair the usefulness and understandability of the government's financial
statements and fiscal projections, including as a measurement of the short-term impact of government spending
and taxation choices on the economy.
The new “Annual deficit before net actuarial losses” line item has been introduced as a supplementary measure
to isolate the impact of re-measurements of previously recorded pension and other employee future benefit
obligations and provide a clearer view of the government’s planned and actual operating activities in an
accounting period, enhancing transparency and accountability.
Comparison of Actual Budgetary Outcomes to Projected Results
The $39.4-billion deficit recorded in 2019–20 was $5.0 billion higher than the $34.4-billion deficit projected in the
July 2020 Snapshot.
Overall, revenues were $7.3 billion lower than forecast due to lower-than-expected tax and non-tax revenues.
Program expenses, excluding net actuarial losses, were $2.0 billion lower than expected, while public debt charges
were $0.1 billion lower than forecast. Net actuarial losses were $0.2 billion lower than projected.

13
Table 3
Comparison of Actual Outcomes to July 2020 Snapshot
Difference
Actual
($ billions)
July 2020
Snapshot
($ billions) ($ billions) (%)
Revenues
Income tax
Personal 167.6 170.9 (3.3) (2.0)
Corporate 50.1 49.2 0.8 1.7
Non-resident 9.5 9.4 0.0 0.4
Total 227.1 229.5 (2.4) (1.1)
Other taxes and duties
Goods and Services Tax 37.4 38.8 (1.4) (3.7)
Energy taxes 5.7 5.7 (0.0) (0.7)
Customs import duties 4.9 4.9 (0.1) (1.5)
Other excise taxes and duties 6.0 6.2 (0.2) (4.1)
Total 53.9 55.6 (1.7) (3.2)
Employment Insurance premiums 22.2 22.8 (0.6) (2.6)
Fuel charge proceeds 2.7 2.4 0.2 8.5
Other revenues1 28.3 31.0 (2.8) (9.8)
Total revenues 334.1 341.4 (7.3) (2.2)
Program expenses
Major transfers to persons
Elderly benefits 56.2 56.2 0.1 0.1
Employment Insurance1 21.8 22.4 (0.7) (3.0)
Children's benefits 24.3 24.4 (0.0) (0.1)
Canada Emergency Response Benefit1 4.7 5.1 (0.4) (7.7)
Total 107.1 108.0 (1.0) (0.9)
Major transfers to other levels of government
Support for health and other social programs 55.5 55.5 0.0 0.0
Fiscal arrangements1 20.4 20.4 0.0 0.1
Gas Tax Fund 2.2 2.2 (0.0) (0.0)
Home care and mental health 1.1 1.1 (0.0) (0.0)
Total 79.2 79.2 0.0 0.0
Fuel charge proceeds returned 2.6 2.8 (0.2) (6.1)
Direct program expenses1 149.6 150.5 (0.9) (0.6)
Total program expenses, excluding net actuarial losses 338.5 340.5 (2.0) (0.6)
Public debt charges 24.4 24.5 (0.1) (0.2)
Budgetary outcome/estimate before net actuarial losses (28.8) (23.6) (5.2) 17.9
Net actuarial losses1 10.6 10.8 (0.2) (1.4)
Budgetary outcome/estimate (39.4) (34.4) (5.0) 12.7
Note: Numbers may not add due to rounding. 1 Comparative figures have been reclassified to conform to the current year's presentation in the condensed consolidated financial statements, with no
overall impact on the annual deficit projected in the July 2020 Snapshot.

14
Revenues
Federal revenues can be broken down into five main categories: income tax revenues, other taxes and duties,
Employment Insurance (EI) premium revenues, fuel charge proceeds and other revenues.
Within the income tax category, personal income tax revenues are the largest source of federal revenues, and
accounted for 50.2 per cent of total revenues in 2019–20 (up from 49.3 per cent in 2018–19). Corporate income tax
revenues are the second largest source of revenues, and accounted for 15.0 per cent of total revenues in 2019–20
(down from 15.2 per cent in 2018–19). Non-resident income tax revenues are a comparatively smaller source of
revenues, accounting for only 2.8 per cent of total revenues in 2019–20 (unchanged from 2018–19).
Other taxes and duties consist of revenues from the Goods and Services Tax (GST), energy taxes, customs import
duties and other excise taxes and duties. The largest component of this category—GST revenues—accounted for
11.2 per cent of all federal revenues in 2019–20 (down from 11.5 per cent in 2018–19). The share of the remaining
components of other taxes and duties stood at 4.9 per cent of total federal revenues (down from 5.7 per cent in
2018–19).
EI premium revenues accounted for 6.6 per cent of total federal revenues in 2019–20 (down slightly from 2018–19).
Fuel charge proceeds under the new federal carbon pollution pricing system that came into effect in April 2019
accounted for 0.8 per cent of total federal revenues in 2019–20.
Other revenues are made up of three broad components: net income from enterprise Crown corporations and
other government business enterprises; other program revenues from returns on investments, proceeds from the
sales of goods and services, and other miscellaneous revenues; and foreign exchange revenues. Other revenues
accounted for 8.5 per cent of total federal revenues in 2019–20 (down from 8.8 per cent in 2018–19).
Composition of Revenues for 2019–20
Note: Numbers may not add to 100% due to rounding.
Source: Public Accounts of Canada.

15
Revenues Compared to 2018–19
Total revenues amounted to $334.1 billion in 2019–20, up $1.9 billion, or 0.6 per cent, from 2018–19. The following
table compares revenues for 2019–20 to 2018–19.
Table 4
Revenues
2019–20
($ millions)
2018–19
($ millions)
Net change
($ millions) (%)
Tax revenues
Income tax
Personal 167,576 163,881 3,695 2.3
Corporate 50,060 50,368 (308) (0.6)
Non-resident 9,476 9,370 106 1.1
Total 227,112 223,619 3,493 1.6
Other taxes and duties
Goods and Services Tax 37,386 38,221 (835) (2.2)
Energy taxes 5,683 5,802 (119) (2.1)
Customs import duties 4,853 6,881 (2,028) (29.5)
Other excise taxes and duties 5,958 6,323 (365) (5.8)
Total 53,880 57,227 (3,347) (5.8)
Total tax revenues 280,992 280,846 146 0.1
Employment Insurance premiums 22,219 22,295 (76) (0.3)
Fuel charge proceeds 2,655 – 2,655 n/a
Other revenues 28,265 29,077 (812) (2.8)
Total revenues 334,131 332,218 1,913 0.6
Personal income tax revenues increased by $3.7 billion in 2019–20, or 2.3 per cent, reflecting developments in
the labour market, particularly employment and wage growth until the end of calendar year 2019.
Corporate income tax revenues decreased by $0.3 billion, or 0.6 per cent, reflecting the drop in corporate profits
resulting from the COVID-19 economic weakness at the end of the fiscal year and the effects of the payment
deferral measures. Declines in corporate earnings were in a number of sectors including manufacturing,
transport and hospitality, accommodation and the entertainment sector.
Non-resident income tax revenues are paid by non-residents on Canadian-sourced income. These revenues
increased by $0.1 billion, or 1.1 per cent.
Other taxes and duties decreased by $3.3 billion, or 5.8 per cent. GST revenues declined by $0.8 billion in 2019–
20, or 2.2 per cent, reflecting weakness in retail sales and lower GST on imports, particularly in March as many
retailers shut down operations due to the COVID-19 pandemic. Energy taxes fell by $0.1 billion, or 2.1 per cent,
primarily due to higher aviation fuel consumption in 2018–19. Customs import duties decreased by $2.0 billion,
or 29.5 per cent, largely due to the removal of retaliatory steel and aluminum tariffs. Other excise taxes and
duties were down $0.4 billion, or 5.8 per cent, driven primarily by a decrease in tobacco excise duties.
EI premium revenues decreased by $0.1 billion, or 0.3 per cent, due to a decrease in the premium rate for 2020.
Other revenues decreased by $0.8 billion, or 2.8 per cent, largely reflecting a decrease in enterprise Crown
corporation profits due to COVID-19.

16
Pricing Carbon Pollution and Delivering Climate Action Incentive Payments
The federal carbon pollution pricing system is composed of a regulatory charge on fossil fuels (“fuel charge”) and
an output-based pricing system. The federal fuel charge began applying in Ontario, New Brunswick, Saskatchewan
and Manitoba, effective April 1, 2019; in Nunavut and Yukon, effective July 1, 2019; and in Alberta, effective
January 1, 2020. Of note, the federal fuel charge no longer applies in New Brunswick, effective April 1, 2020, as the
province implemented a tax on carbon emitting products that meets the federal benchmark stringency
requirements. All direct proceeds from the federal fuel charge are returned to the jurisdiction of origin. Fuel
charge proceeds totalled $2.7 billion in 2019–20. During 2019–20, in Ontario, New Brunswick, Manitoba, Alberta
and Saskatchewan, the bulk of proceeds were returned through Climate Action Incentive payments. Eligible
individuals residing in these provinces were able to claim the payments through their personal income tax
returns. In Nunavut and Yukon, the proceeds were returned directly to the governments of those jurisdictions. Fuel
charge proceeds returned totalled $2.6 billion in 2019–20.
The revenue ratio—revenues as a percentage of GDP—compares the total of all federal revenues to the size of the
economy. This ratio is influenced by changes in statutory tax rates and by economic developments. The ratio
stood at 14.5 per cent in 2019–20 (down from 14.9 per cent in 2018–19). This decrease primarily reflects a year-
over-year decline in other taxes and duties, particularly in customs import duty revenues due to the removal of
retaliatory steel and aluminum tariffs, and a year-over-year decline in other revenues driven by lower enterprise
Crown corporation profits due to COVID-19.
Revenue Ratio
Sources: Public Accounts of Canada and Statistics Canada.
17
Expenses
Federal expenses can be broken down into four main categories: transfer payments, which account for roughly
two-thirds of all federal spending, net actuarial losses, other direct program expenses and public debt charges.
Transfer payments are classified under four categories:
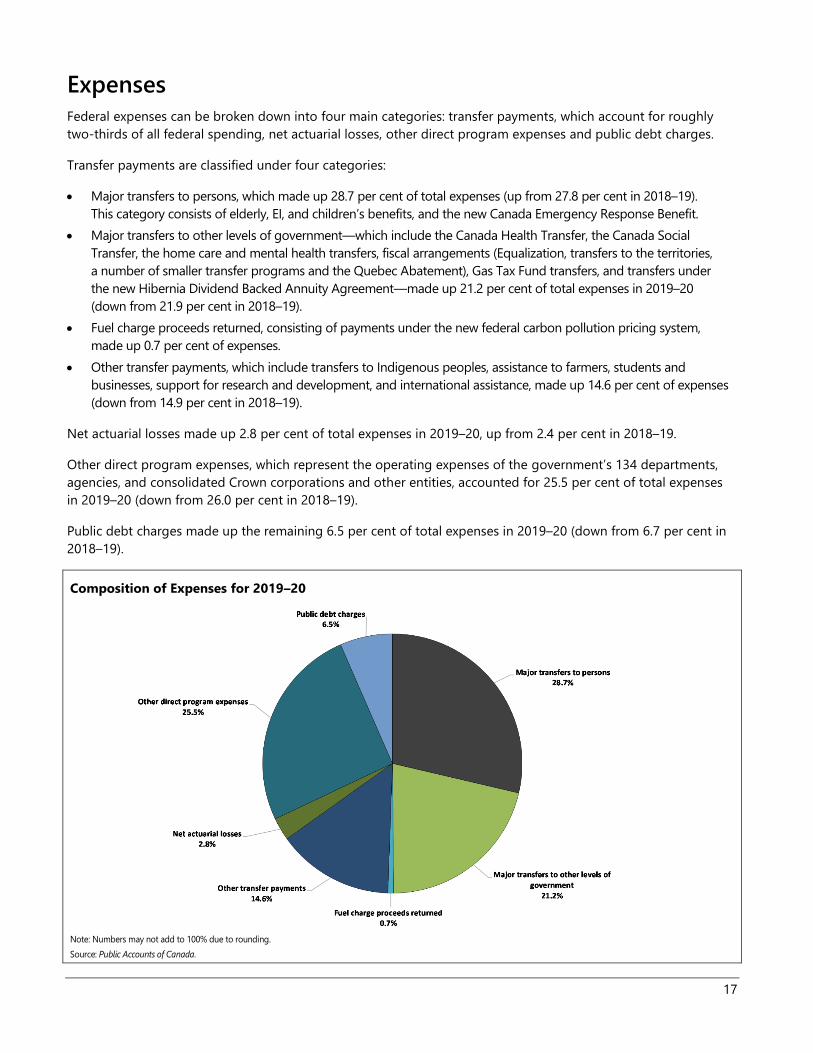
Major transfers to persons, which made up 28.7 per cent of total expenses (up from 27.8 per cent in 2018–19).
This category consists of elderly, EI, and children’s benefits, and the new Canada Emergency Response Benefit.
Major transfers to other levels of government—which include the Canada Health Transfer, the Canada Social
Transfer, the home care and mental health transfers, fiscal arrangements (Equalization, transfers to the territories,
a number of smaller transfer programs and the Quebec Abatement), Gas Tax Fund transfers, and transfers under
the new Hibernia Dividend Backed Annuity Agreement—made up 21.2 per cent of total expenses in 2019–20
(down from 21.9 per cent in 2018–19).
Fuel charge proceeds returned, consisting of payments under the new federal carbon pollution pricing system,
made up 0.7 per cent of expenses.
Other transfer payments, which include transfers to Indigenous peoples, assistance to farmers, students and
businesses, support for research and development, and international assistance, made up 14.6 per cent of expenses
(down from 14.9 per cent in 2018–19).
Net actuarial losses made up 2.8 per cent of total expenses in 2019–20, up from 2.4 per cent in 2018–19.
Other direct program expenses, which represent the operating expenses of the government’s 134 departments,
agencies, and consolidated Crown corporations and other entities, accounted for 25.5 per cent of total expenses
in 2019–20 (down from 26.0 per cent in 2018–19).
Public debt charges made up the remaining 6.5 per cent of total expenses in 2019–20 (down from 6.7 per cent in
2018–19).
Composition of Expenses for 2019–20
Note: Numbers may not add to 100% due to rounding.
Source: Public Accounts of Canada.

18
Expenses Compared to 2018–19
Total expenses amounted to $373.5 billion in 2019–20, up $27.3 billion, or 7.9 per cent, from 2018–19. The
following table compares total expenses for 2019–20 to 2018–19.
Table 5
Expenses
2019–20
($ millions)
2018–19
($ millions)
Net change
($ millions) (%)
Major transfers to persons
Elderly benefits 56,227 53,366 2,861 5.4
Employment Insurance 21,750 18,888 2,862 15.2
Children's benefits 24,344 23,882 462 1.9
Canada Emergency Response Benefit 4,739 – 4,739 n/a
Total 107,060 96,136 10,924 11.4
Major transfers to other levels of government
Federal transfer support for health and other social programs 55,457 52,729 2,728 5.2
Fiscal arrangements and other transfers 23,718 23,196 522 2.3
Total 79,175 75,925 3,250 4.3
Direct program expenses1
Fuel charge proceeds returned 2,636 664 1,972 297.0
Other transfer payments 54,405 51,753 2,652 5.1
Other direct program expenses1 95,191 90,077 5,114 5.7
Total direct program expenses1 152,232 142,494 9.738 6.8
Total program expenses, excluding net actuarial losses1 338,467 314,555 23,912 7.6
Public debt charges 24,447 23,266 1,181 5.1
Total expenses, excluding net actuarial losses1 362,914 337,821 25,093 7.4
Net actuarial losses1 10,609 8,361 2,248 26.9
Total expenses 373,523 346,182 27,341 7.9 1 Comparative figures have been reclassified to conform to the current year's presentation. Information regarding this reclassification can be found in Note 3
of the condensed consolidated financial statements.
Major transfers to persons increased by $10.9 billion in 2019–20, reflecting increases across all major categories,
as well as the new Canada Emergency Response Benefit (CERB), an income support program introduced under
Canada’s COVID-19 Economic Response Plan. Elderly benefits increased by $2.9 billion, or 5.4 per cent, reflecting
growth in the elderly population and changes in consumer prices, to which benefits are fully indexed. EI benefits,
which include $1.8 billion in CERB benefits to individuals eligible for EI in 2019–20, increased by $2.9 billion, or
15.2 per cent, as individuals qualified for increased benefits, and COVID-19 weakened labour market conditions
near year-end. Children’s benefits increased by $0.5 billion, or 1.9 per cent, reflecting the indexation of the
Canada Child Benefit. CERB payments to those individuals not eligible for EI totalled $4.7 billion, bringing total
transfers under the CERB to $6.5 billion.
Major transfers to other levels of government increased by $3.3 billion in 2019–20, primarily reflecting
$3.3 billion in legislated growth in the Canada Health Transfer, the Canada Social Transfer, Equalization transfers
and transfers to the territories; $2.4 billion in transfers under the new Hibernia Dividend Backed Annuity
Agreement reached on April 1, 2019 between Canada and Newfoundland and Labrador; and, $0.5 billion in
transfers to provinces and territories for public health preparedness, critical health care system needs and to
support mitigation efforts associated with COVID-19. These increases were offset in part by a decrease in Gas
Tax fund transfers, reflecting a one-time, $2.2-billion increase to Gas Tax Fund transfers in the prior year, and a
$0.8-billion increase in recoveries under the Quebec Abatement.
Direct program expenses increased by $9.7 billion in 2019–20, or 6.8 per cent:

19
- Fuel charge proceeds returned increased by $2.0 billion, or 297.0 per cent, largely reflecting the accounting
treatment of Climate Action Incentive payments, which requires some of the costs to be borne in the fiscal year
prior to the fuel charge being collected because they are delivered through the personal income tax system
through returns for the previous tax year. A portion of personal income tax returns are filed and assessed before
the end of the fiscal year. As a result, fuel charge proceeds returned in 2019–20 reflect a portion of the Climate
Action Incentive payments that were made in respect of fuel charge proceeds generated in 2019–20 and
returned through 2018 tax returns, and a portion of the payments made in respect of proceeds to be generated
in 2020–21 and returned through 2019 tax returns.
- Other transfer payments increased by $2.7 billion, or 5.1 per cent, in 2019–20, reflecting increases across a
number of departments and agencies, including growth in transfers paid through the tax system, such as the
Canada Workers Benefit, reflecting enhancements announced in Budget 2018; compensation for supply-
managed dairy producers as a result of market access commitments made under recent international trade
agreements; transfers under the new Interim Housing Assistance Program to address extraordinary interim
housing pressures resulting from increased volumes of asylum claimants entering Canada; and, increased
provisions for loan guarantees, reflecting the economic outlook at March 31, 2020.
- Other direct program expenses of departments, agencies, and consolidated Crown corporations and other
entities increased by $5.1 billion, or 5.7 per cent, in large part due to an increase in personnel costs and
increased provisions for bad debts.
Public debt charges increased by $1.2 billion, or 5.1 per cent, reflecting higher Consumer Price Index
adjustments on Real Return Bonds, an increase in the stock of Government of Canada treasury bills, and higher
costs associated with marketable bonds.
Net actuarial losses, which represent changes in the measurement of the government’s obligations for pensions
and other employee future benefits accrued in previous fiscal years, increased by $2.2 billion, or 26.9 per cent,
due in large part to declines in year-end interest rates and increased costs associated with the utilization of
disability and other future benefits provided to veterans.
Hibernia Dividend Backed Annuity Agreement
The government and the province of Newfoundland and Labrador entered into the Hibernia Dividend Backed
Annuity Agreement (HDBA) effective April 1, 2019. Under the HDBA, the Government of Canada is obligated
to make stated annual payments between 2019 and 2056 to Newfoundland and Labrador totalling
$3.3 billion. The total payments of $3.3 billion include the provincial income and capital taxes (provincial taxes)
in respect of those years payable by Canada Hibernia Holding Corporation (CHHC) to Newfoundland and
Labrador. The government indirectly owns all of the issued and outstanding shares of CHHC through the
Canada Development Investment Corporation, a wholly owned federal Crown corporation.
The province of Newfoundland and Labrador is obligated under the HDBA to pay the Government of Canada
eight fixed annual payments of $100 million each, starting in 2045 and ending in 2052.
Scheduled payments to the province of Newfoundland and Labrador are made through a Specified Purpose
Account, established pursuant to subsection 21(1) of the Financial Administration Act.
The government has recorded a transfer payment expense of $2.4 billion and other revenue of $0.4 billion in
2019–20, representing the present value of its liability to and receivable from the province, respectively, under
the agreement.

20
There has been a large shift in the composition of total expenses since the mid-1990s. Public debt charges were
the largest component for most of the 1990s, given the large and increasing stock of interest-bearing debt and
high average effective interest rates on that stock of debt. Since reaching a high of nearly 30 per cent of total
expenses in 1996–97, the share of public debt charges in total expenses has fallen by more than three-quarters.
The interest ratio (public debt charges as a percentage of revenues) shows the proportion of every dollar of
revenue that is needed to pay interest and is therefore not available to pay for program initiatives. The lower the
ratio, the more flexibility the government has to address the key priorities of Canadians. The interest ratio has been
decreasing in recent years, falling from a peak of 37.6 per cent in 1990–91 to 7.3 per cent in 2019–20. This means
that, in 2019–20, the government spent approximately 7 cents of every revenue dollar on interest on public debt.
Interest Ratio
Source: Public Accounts of Canada.
21
Federal Debt
The federal debt (accumulated deficit) is the difference between the government’s total liabilities and its total
assets. With total liabilities of $1.2 trillion, financial assets of $435.7 billion and non-financial assets of $91.5 billion,
the federal debt stood at $721.4 billion at March 31, 2020, up $35.9 billion from March 31, 2019.
The $35.9-billion increase in the federal debt reflects the 2019–20 budgetary deficit of $39.4 billion and
$3.5 billion in other comprehensive income.
Table 6
Federal Debt (Accumulated Deficit)
$ millions
2019–20 2018–19 Net change
Federal debt at beginning of year (685,450) (671,254) (14,196)
Annual deficit (39,392) (13,964) (25,428)
Other comprehensive income (loss) 3,482 (232) 3,714
Federal debt at end of year (721,360) (685,450) (35,910)
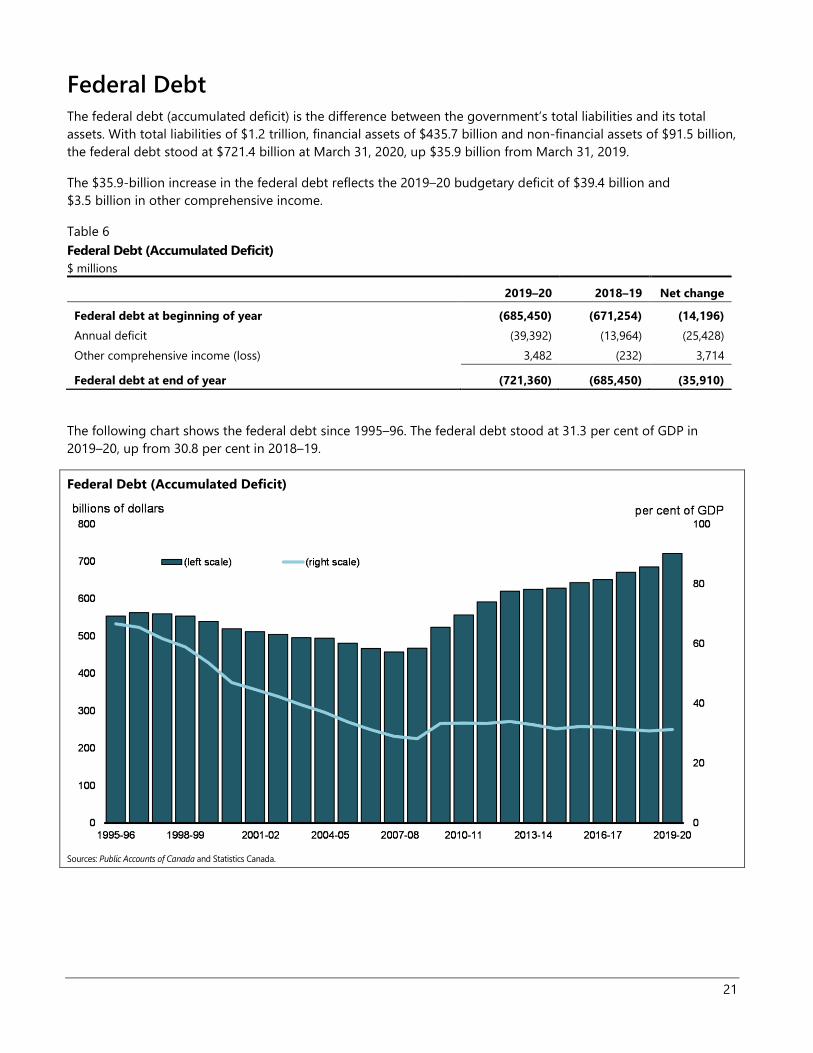
The following chart shows the federal debt since 1995–96. The federal debt stood at 31.3 per cent of GDP in
2019–20, up from 30.8 per cent in 2018–19.
Federal Debt (Accumulated Deficit)
Sources: Public Accounts of Canada and Statistics Canada.
22
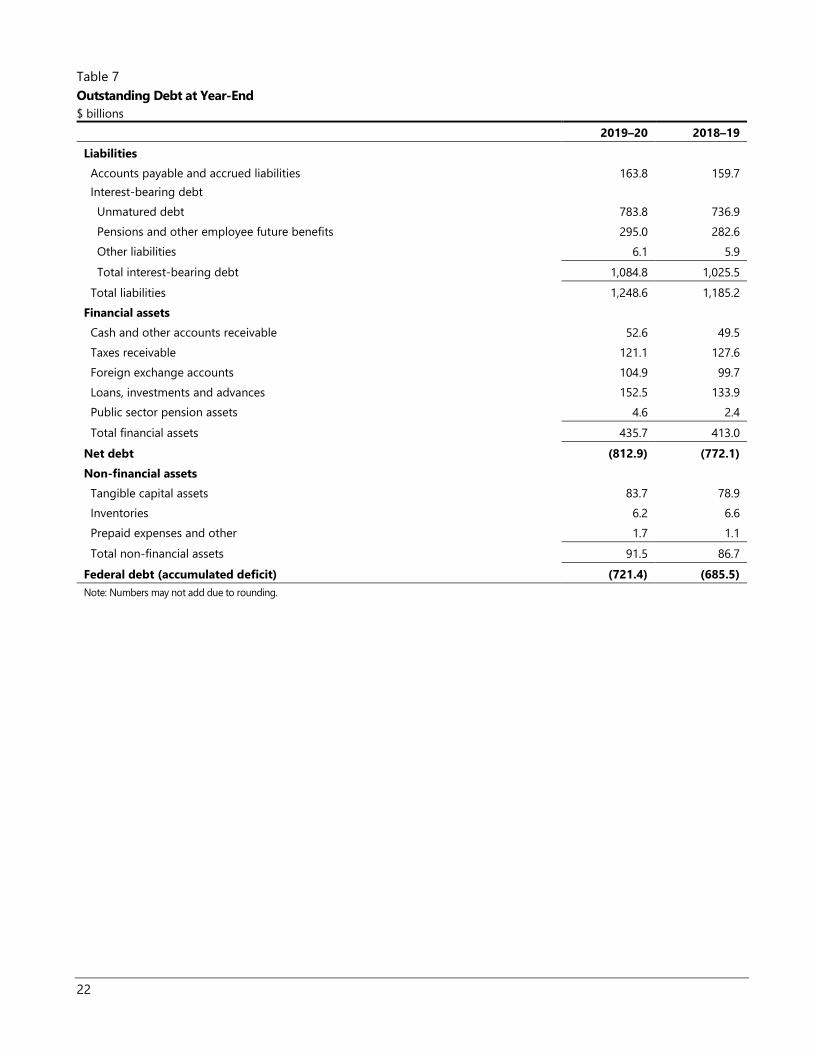
Table 7
Outstanding Debt at Year-End
$ billions
2019–20 2018–19
Liabilities
Accounts payable and accrued liabilities 163.8 159.7
Interest-bearing debt
Unmatured debt 783.8 736.9
Pensions and other employee future benefits 295.0 282.6
Other liabilities 6.1 5.9
Total interest-bearing debt 1,084.8 1,025.5
Total liabilities 1,248.6 1,185.2
Financial assets
Cash and other accounts receivable 52.6 49.5
Taxes receivable 121.1 127.6
Foreign exchange accounts 104.9 99.7
Loans, investments and advances 152.5 133.9
Public sector pension assets 4.6 2.4
Total financial assets 435.7 413.0
Net debt (812.9) (772.1)
Non-financial assets
Tangible capital assets 83.7 78.9
Inventories 6.2 6.6
Prepaid expenses and other 1.7 1.1
Total non-financial assets 91.5 86.7
Federal debt (accumulated deficit) (721.4) (685.5)
Note: Numbers may not add due to rounding.
23
Assets
The government’s assets consist of financial assets (cash and other accounts receivable, taxes receivable, foreign
exchange accounts, loans, investments and advances, and public sector pension assets) and non-financial assets
(tangible capital assets, inventories, and prepaid expenses and other).
At March 31, 2020, financial assets amounted to $435.7 billion, up $22.7 billion from March 31, 2019. The increase
in financial assets reflects increases in cash and other accounts receivable, foreign exchange accounts, loans,
investments and advances, and public sector pension assets, offset in part by a decrease in taxes receivable.
At March 31, 2020, cash and other accounts receivable totalled $52.6 billion, up $3.1 billion from March 31, 2019.
Within this component, cash and cash equivalents decreased by $0.4 billion. The balance of cash and cash
equivalents includes $20 billion that has been designated as a deposit held with respect to prudential liquidity
management. Other accounts receivable increased by $3.5 billion, largely due to a $2.8-billion increase in cash
collateral under International Swaps and Derivatives Association agreements in respect of outstanding cross-
currency swap agreements and a $0.5-billion increase in dividends receivable from the Bank of Canada at
year-end.
Taxes receivable decreased by $6.5 billion during 2019–20 to $121.1 billion, largely stemming from the COVID-19
pandemic and deferrals of tax filing deadlines announced as part of the government’s relief measures.
Foreign exchange accounts increased by $5.2 billion in 2019–20, totalling $104.9 billion at March 31, 2020, due
mainly to foreign exchange gains on the translation of the net assets denominated in foreign currencies to
Canadian dollar equivalents as at March 31, 2020.
Loans, investments and advances increased by $18.6 billion in 2019–20.
- Loans, investments and advances in enterprise Crown corporations and other government business enterprises
increased by $16.9 billion. Capital investments in enterprise Crown corporations and other government business
enterprises increased by $1.8 billion, largely reflecting support for COVID-19 liquidity and capital relief measures
for businesses under the Business Credit Availability Program administered by the Business Development Bank
of Canada, as well as support for additional lending capacity under Farm Credit Canada. Investments in
enterprise Crown corporations and other government business enterprises grew by an additional $3.8 billion,
primarily reflecting $3.6 billion in net profits and $3.5 billion in other comprehensive income recorded by these
entities during 2019–20, offset in part by $3.6 billion in dividends paid to the government. Net loans and
advances were up $11.9 billion, primarily reflecting a $10.5-billion increase in loans to Crown corporations
under the consolidated borrowing framework, and $1.5 billion in financing to the Canada Development
Investment Corporation from the Canada Account to finance construction activities for the Trans Mountain
expansion project.
- Other loans, investments and advances increased by $1.7 billion, from $25.7 billion to $27.4 billion, largely
reflecting an increase in loans and unconditionally repayable contributions to industry and growth in the Canada
Student Loans portfolio, reflecting in part measures announced in Budget 2016, which increased the number of
students participating in the program, as well as the number of students eligible to receive the maximum
loan amounts.
Public sector pension assets increased by $2.2 billion, largely reflecting an increase in the net assets under the
Public Service Pension Fund.
At March 31, 2020, non-financial assets stood at $91.5 billion, up $4.9 billion from a year earlier. Of this growth,
$4.7 billion relates to an increase in tangible capital assets and $0.5 billion relates to an increase in prepaid
expenses, offset in part by a $0.4-billion decrease in inventories.

24
Liabilities
The government’s liabilities consist of accounts payable and accrued liabilities and interest-bearing debt.
At March 31, 2020, accounts payable and accrued liabilities totalled $163.8 billion, up $4.1 billion from March 31,
2019. This increase reflects growth in other accounts payable and accrued liabilities, deferred revenue, and
environmental liabilities and asset retirement obligations, offset in part by decreases in amounts payable related
to tax, provisions for contingent liabilities, and interest and matured debt.
Amounts payable related to tax decreased by $5.0 billion in 2019–20 from $65.2 billion at March 31, 2019, to
$60.2 billion at March 31, 2020. This decrease largely reflects lower assessed refunds owing at the end of the
fiscal year due to extended filing deadlines under the government’s Economic Response Plan, as well as year-
over-year differences in the timing of refunds.
Other accounts payable and accrued liabilities increased by $6.4 billion in 2019–20. Within this component,
accounts payable increased by $9.1 billion, due largely to the accrual of CERB benefits payable to individuals for
the period of March 15 to March 31, 2020, the recording of a $2.3-billion liability to Newfoundland and Labrador
under the new Hibernia Dividend Backed Annuity Agreement, as well as increased accrued liabilities for settled
claims. These increases were offset in part by the payment in 2019–20 of a one-time $2.2-billion top-up to the
Gas Tax Fund and $1.0 billion in funding for the Green Municipal Fund, announced in Budget 2019 and accrued
at the end of 2018–19. Accrued salaries and benefits increased by $2.1 billion. Liabilities under tax collection
agreements decreased by $4.7 billion, largely reflecting timing differences in payments to provinces and
territories, while miscellaneous paylist deductions decreased by $0.1 billion. Notes payable to international
organizations and other accounts payable decreased by $46 million and $30 million, respectively.
Provisions for contingent liabilities decreased by $1.5 billion, largely reflecting the settlement of various claims
and pending and threatened litigation.
Environmental liabilities and asset retirement obligations increased by $1.5 billion in 2019–20, reflecting revisions to
previously estimated provisions, net of remediation activities undertaken.
Deferred revenue increased by $3.0 billion in 2019–20, primarily reflecting proceeds from the auction of
spectrum licences in the 600 MHz Band, which concluded on April 4, 2019.
Liabilities for interest and matured debt decreased by $0.2 billion from the prior year.
Interest-bearing debt includes unmatured debt, or debt issued on the credit markets, pension and other future
benefit liabilities, and other liabilities. At March 31, 2020, interest-bearing debt totalled $1,084.8 billion, up
$59.3 billion from March 31, 2019. Within interest-bearing debt, unmatured debt increased by $46.8 billion,
liabilities for pensions decreased by $0.2 billion, liabilities for other employee and veteran future benefits
increased by $12.5 billion, and other liabilities increased by $0.1 billion.
International Comparisons of Government Debt
Jurisdictional responsibility (between central, state and local governments) for government programs differs among
countries. As a result, international comparisons of government fiscal positions are made on a total government,
National Accounts basis. For Canada, total government net debt includes that of the federal, provincial/territorial
and local governments, as well as the net assets held in the Canada Pension Plan and Québec Pension Plan.
25
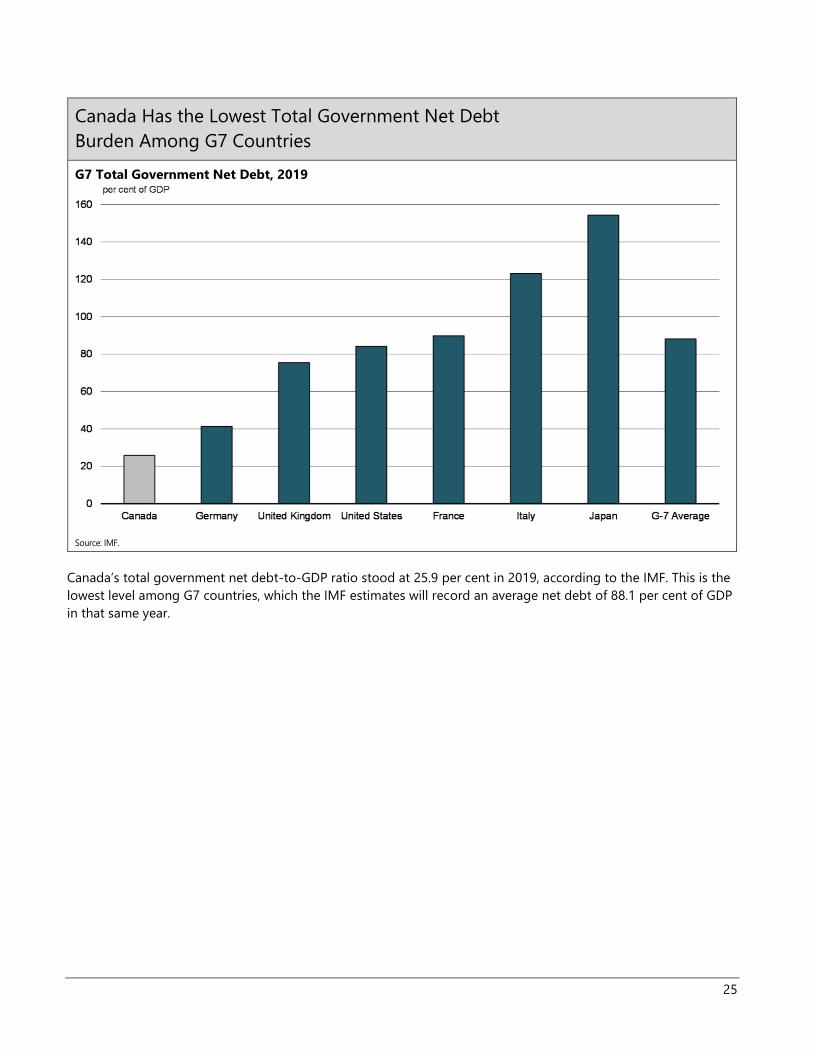
Canada Has the Lowest Total Government Net Debt
Burden Among G7 Countries
G7 Total Government Net Debt, 2019
Source: IMF.
Canada’s total government net debt-to-GDP ratio stood at 25.9 per cent in 2019, according to the IMF. This is the
lowest level among G7 countries, which the IMF estimates will record an average net debt of 88.1 per cent of GDP
in that same year.

26
The following table provides a reconciliation between the Government of Canada’s federal debt-to-GDP ratio and
Canada’s total government net debt-to-GDP ratio used for international debt comparison purposes. Importantly,
Canada’s total government net debt-to-GDP ratio includes the net debt of the federal, provincial, territorial and
local governments as well as the net assets held by the Canada Pension Plan (CPP) and Québec Pension Plan
(QPP), and excludes liabilities for public sector pensions and other employee future benefits.
Table 8
Reconciliation of 2019–20 Federal Debt-to-GDP Ratio to Calendar 2019 Total Government
Net Debt to-GDP-Ratio
(per cent of GDP)
Federal debt 31.3
Add: Non-financial assets 4.0
Net debt (Public Accounts basis) 35.3
Less: Liabilities for public sector pensions (7.3)
Liabilities for other future benefits (5.5)
National Accounts/Public Accounts methodological differences and timing adjustments1 (3.5)
Total federal net debt (National Accounts basis) 18.9
Add: Net debt of provincial/territorial and local governments 20.1
Less: Net assets of the CPP/QPP (13.2)
Total government net debt2 25.8
Note: Numbers may not add due to rounding.
Sources: Statistics Canada and Public Accounts of Canada. 1 Includes timing differences (National Accounts data are as of December 31), differences in the universe covered by each accounting system, and
differences in accounting treatments of various transactions such as capital gains. 2 The net debt figure has been revised by Statistics Canada since the publication of the IMF's April 2020 Fiscal Monitor, which is the source for the chart
“G7 Total Government Net Debt, 2019”. Net debt has been revised from 25.9 per cent to 25.8 per cent.
Financial Source/Requirement
The budgetary balance is the most comprehensive measure of the federal government’s fiscal results.
It is presented on an accrual basis of accounting, recording government expenses when they are incurred,
regardless of when the cash payment is made, and recording tax revenues when earned, regardless of when the
cash is received.
In contrast, the financial source/requirement measures the difference between cash coming in to the government
and cash going out. It differs from the budgetary balance in that it includes cash transactions in loans, investments
and advances, public sector pensions and other employee future benefits, other specified purpose accounts,
foreign exchange activities, and changes in other financial assets, liabilities and non-financial assets. These
activities are included as part of non-budgetary transactions.
Non-budgetary transactions also include adjustments for the effects of non-cash items included in the budgetary
balance and for any accruals of past or future cash receipts or payments. Examples of non-cash items include
amortization of tangible capital assets, pension and other employee future benefit expenses not funded in the
period, and the recognition of previously deferred revenue.
27
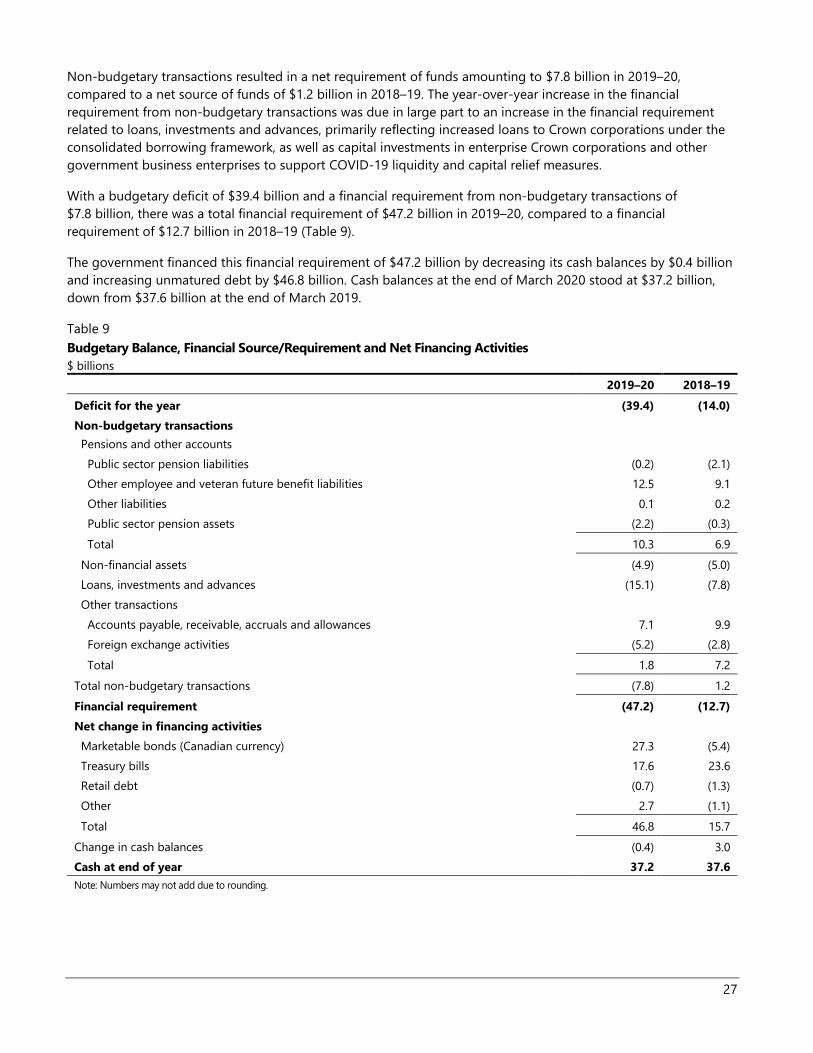
Non-budgetary transactions resulted in a net requirement of funds amounting to $7.8 billion in 2019–20,
compared to a net source of funds of $1.2 billion in 2018–19. The year-over-year increase in the financial
requirement from non-budgetary transactions was due in large part to an increase in the financial requirement
related to loans, investments and advances, primarily reflecting increased loans to Crown corporations under the
consolidated borrowing framework, as well as capital investments in enterprise Crown corporations and other
government business enterprises to support COVID-19 liquidity and capital relief measures.
With a budgetary deficit of $39.4 billion and a financial requirement from non-budgetary transactions of
$7.8 billion, there was a total financial requirement of $47.2 billion in 2019–20, compared to a financial
requirement of $12.7 billion in 2018–19 (Table 9).
The government financed this financial requirement of $47.2 billion by decreasing its cash balances by $0.4 billion
and increasing unmatured debt by $46.8 billion. Cash balances at the end of March 2020 stood at $37.2 billion,
down from $37.6 billion at the end of March 2019.
Table 9
Budgetary Balance, Financial Source/Requirement and Net Financing Activities
$ billions
2019–20 2018–19
Deficit for the year (39.4) (14.0)
Non-budgetary transactions
Pensions and other accounts
Public sector pension liabilities (0.2) (2.1)
Other employee and veteran future benefit liabilities 12.5 9.1
Other liabilities 0.1 0.2
Public sector pension assets (2.2) (0.3)
Total 10.3 6.9
Non-financial assets (4.9) (5.0)
Loans, investments and advances (15.1) (7.8)
Other transactions
Accounts payable, receivable, accruals and allowances 7.1 9.9
Foreign exchange activities (5.2) (2.8)
Total 1.8 7.2
Total non-budgetary transactions (7.8) 1.2
Financial requirement (47.2) (12.7)
Net change in financing activities
Marketable bonds (Canadian currency) 27.3 (5.4)
Treasury bills 17.6 23.6
Retail debt (0.7) (1.3)
Other 2.7 (1.1)
Total 46.8 15.7
Change in cash balances (0.4) 3.0
Cash at end of year 37.2 37.6
Note: Numbers may not add due to rounding.


31
Condensed Consolidated Financial Statements of the
Government of Canada
The fundamental purpose of these condensed consolidated financial statements is to provide an overview of the
financial affairs and resources for which the Government is responsible under authority granted by Parliament.
Responsibility for the integrity and objectivity of these statements rests with the Government.
Government of Canada
Condensed Consolidated Statement of Operations and Accumulated Deficit
for the Year Ended March 31, 2020
$ millions
2020 Budget
(Note 4) 2020 Actual 2019 Actual
Revenues
Income tax revenues 226,526 227,112 223,619
Other taxes and duties 59,280 53,880 57,227
Employment insurance premiums 21,967 22,219 22,295
Fuel charge proceeds 2,335 2,655 -
Other revenues 28,670 28,265 29,077
Total revenues 338,778 334,131 332,218
Expenses
Transfer payments
Old age security benefits and related payments 56,204 56,227 53,366
Major transfer payments to other levels of government 76,886 79,175 75,925
Employment insurance 19,898 21,750 18,888
Children's benefits 24,333 24,344 23,882
Canada emergency response benefit - 4,739 -
Fuel charge proceeds returned 2,640 2,636 664
Other transfer payments 52,798 54,405 51,753
Total transfer payments 232,759 243,276 224,478
Other expenses, excluding net actuarial losses (Note 3) 89,774 95,191 90,077
Total program expenses, excluding net actuarial losses 322,533 338,467 314,555
Public debt charges 26,212 24,447 23,266
Total expenses, excluding net actuarial losses 348,745 362,914 337,821
Annual deficit before net actuarial losses (Note 3) (9,967) (28,783) (5,603)
Net actuarial losses (Note 3) (6,882) (10,609) (8,361)
Annual deficit (16,849) (39,392) (13,964)
Accumulated deficit at beginning of year (685,450) (685,450) (671,254)
Other comprehensive income (loss) - 3,482 (232)
Accumulated deficit at end of year (702,299) (721,360) (685,450)
The accompanying notes are an integral part of these condensed consolidated financial statements.
.

32
Government of Canada
Condensed Consolidated Statement of Financial Position
as at March 31, 2020
$ millions
2020 2019
Liabilities
Accounts payable and accrued liabilities 163,833 159,707
Interest-bearing debt
Unmatured debt 783,751 736,915
Pensions and other future benefits 294,974 282,644
Other liabilities 6,051 5,905
Total interest-bearing debt 1,084,776 1,025,464
Total liabilities 1,248,609 1,185,171
Financial assets
Cash and accounts receivable 173,715 177,041
Foreign exchange accounts 104,903 99,688
Loans, investments and advances 152,502 133,912
Public sector pension assets 4,598 2,406
Total financial assets 435,718 413,047
Net debt (812,891) (772,124)
Non-financial assets
Tangible capital assets 83,682 78,942
Other 7,849 7,732
Total non-financial assets 91,531 86,674
Accumulated deficit (721,360) (685,450)
Contractual obligations and contractual rights (Note 5)
Contingent liabilities (Note 6)
The accompanying notes are an integral part of these condensed consolidated financial statements.
33
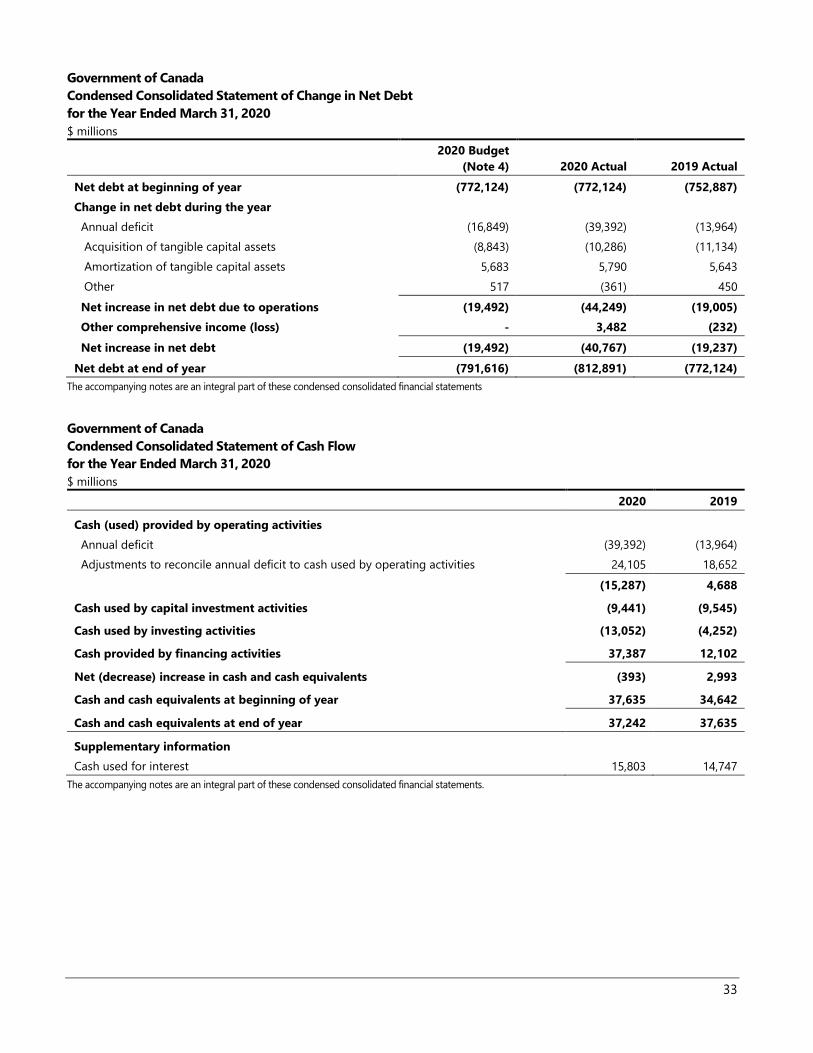
Government of Canada
Condensed Consolidated Statement of Change in Net Debt
for the Year Ended March 31, 2020
$ millions
2020 Budget
(Note 4) 2020 Actual 2019 Actual
Net debt at beginning of year (772,124) (772,124) (752,887)
Change in net debt during the year
Annual deficit (16,849) (39,392) (13,964)
Acquisition of tangible capital assets (8,843) (10,286) (11,134)
Amortization of tangible capital assets 5,683 5,790 5,643
Other 517 (361) 450
Net increase in net debt due to operations (19,492) (44,249) (19,005)
Other comprehensive income (loss) - 3,482 (232)
Net increase in net debt (19,492) (40,767) (19,237)
Net debt at end of year (791,616) (812,891) (772,124)
The accompanying notes are an integral part of these condensed consolidated financial statements
Government of Canada
Condensed Consolidated Statement of Cash Flow
for the Year Ended March 31, 2020
$ millions
2020 2019
Cash (used) provided by operating activities
Annual deficit (39,392) (13,964)
Adjustments to reconcile annual deficit to cash used by operating activities 24,105 18,652
(15,287) 4,688
Cash used by capital investment activities (9,441) (9,545)
Cash used by investing activities (13,052) (4,252)
Cash provided by financing activities 37,387 12,102
Net (decrease) increase in cash and cash equivalents (393) 2,993
Cash and cash equivalents at beginning of year 37,635 34,642
Cash and cash equivalents at end of year 37,242 37,635
Supplementary information
Cash used for interest 15,803 14,747
The accompanying notes are an integral part of these condensed consolidated financial statements.

34
Notes to the Condensed Consolidated Financial Statements of the
Government of Canada
1. Applied Criteria in the Preparation of the Condensed Consolidated
Financial Statements
The criteria applied by the Government in the preparation of these condensed consolidated financial statements
are as follows:
i. These condensed consolidated financial statements are extracted from the audited consolidated financial
statements included in Section 2 of Volume I of the Public Accounts of Canada 2020, which are to be tabled
in Parliament.
ii. The condensed consolidated financial statements are in agreement with the related information in the audited
consolidated financial statements and contain the information necessary to avoid distorting or obscuring
matters disclosed in the related complete audited consolidated financial statements, including the notes
thereto.
iii. As these condensed consolidated financial statements are, by their nature, summarized, they do not include all
disclosures required by Canadian public sector accounting standards.
iv. Readers interested in the disclosure of more detailed data should refer to the audited consolidated financial
statements in the Public Accounts of Canada.
2. Summary of Significant Accounting Policies
The reporting entity of the Government of Canada includes all of the government organizations that comprise the
legal entity of the government as well as other government organizations, including Crown corporations, which are
separate legal entities but are controlled by the government. The financial activities of all of these entities, except for
enterprise Crown corporations and other government business enterprises, are consolidated in these financial
statements on a line-by-line and uniform basis of accounting after eliminating significant inter-governmental
balances and transactions. Enterprise Crown corporations and other government business enterprises, which are
not dependent on the government for financing their activities, are recorded under the modified equity method.
The Canada Pension Plan (CPP), which includes the assets of the CPP under the administration of the Canada
Pension Plan Investment Board, is excluded from the reporting entity because changes to the CPP require the
agreement of two thirds of participating provinces and it is therefore not controlled by the government.
The government accounts for transactions on an accrual basis, using the government’s accounting policies that are
described in Note 1 to its audited consolidated financial statements, which are based on Canadian public sector
accounting standards. The presentation and results using the stated accounting policies do not result in any
significant differences from Canadian public sector accounting standards.
Financial assets presented on the Condensed Consolidated Statement of Financial Position can provide resources
to discharge liabilities or finance future operations and are recorded at the lower of cost or net realizable value.
Non-financial assets cannot normally be converted into cash to finance future operations without disrupting
government operations; they are recorded at cost less accumulated amortization. Liabilities are recorded at the
estimated amount ultimately payable, adjusted for the passage of time, as required. Obligations for pensions and
other future benefits are measured on an actuarial basis. Allowances for valuation are established for loans,
investments and advances, as well as for loan guarantees and other obligations.

35
Some amounts in these condensed consolidated financial statements are based on estimates and assumptions
made by the government. They are based on facts and circumstances, historical experience, general economic
conditions and reflect the government’s best estimate of the related amount at the end of the reporting period.
Estimates and underlying assumptions are reviewed annually at March 31. Revisions to accounting estimates are
recognized in the period in which estimates are revised if revisions affect only that period or in the period of
revision and future periods if revisions affect both current and future periods.
Measurement uncertainty that is material exists when it is reasonably possible that a material variance could occur in
the reported or disclosed amount in the near term. Near term is defined as a period of time not to exceed one year
from March 31. The government has determined that measurement uncertainty exists with respect to the reported
amounts for public sector pensions and other employee and veteran future benefits; the provision for contingent
liabilities; the accrual of tax revenues and the related amounts receivable and payable and the allowance for
doubtful accounts; environmental liabilities and asset retirement obligations; enterprise Crown corporations and
other government business enterprises; other loans, investments and advances; the expected useful life of tangible
capital assets; contractual rights; and the impact of the COVID-19 pandemic (Note 7). It is reasonably possible that
the government’s reassessments of these estimates and assumptions could require a material change in reported
amounts or disclosures in the condensed consolidated financial statements.
3. Comparative Information
The Government of Canada has changed the presentation of the Condensed Consolidated Statement of
Operations and Accumulated Deficit to present separately the recognition of actuarial gains and losses related to
public sector pensions and other employee and veteran future benefits. These amounts were previously presented
within the Other expenses line item but are now presented in a new condensed consolidated financial statement
line item titled Net actuarial losses. A new subtotal line titled Annual deficit before net actuarial losses has also
been added. The purpose of this revised presentation is to enhance financial reporting and decision-making for
users of the condensed consolidated financial statements by isolating the impacts of re-measurements of public
sector pension and other employee and veteran future benefit obligations, which are often significant and can
therefore potentially mask underlying events and trends in current government spending. The related comparative
figures have been reclassified to conform to the current year’s presentation.
In addition, certain amounts in the Condensed Consolidated Statement of Cash Flow have been reclassified to
conform to the current year’s presentation.
4. Source of Budget Amounts
The budget amounts included in the Condensed Consolidated Statement of Operations and Accumulated Deficit
and the Condensed Consolidated Statement of Change in Net Debt are derived from the amounts that were
budgeted for 2020 in the March 2019 Budget Plan (Budget 2019). To enhance comparability with actual 2020
results, Budget 2019 amounts have been reclassified to conform to the current year's presentation in the
condensed consolidated financial statements, with no overall impact on the budgeted 2020 annual deficit.
Since actual opening balances of the accumulated deficit and net debt were not available at the time of
preparation of Budget 2019, the corresponding amounts in the budget column have been adjusted to the actual
closing balances of the previous year.
5. Contractual Obligations and Contractual Rights
The nature of government activities results in large multi-year contracts and agreements, including international
treaties, protocols and agreements of various size and importance. Any financial obligations resulting from these
contracts and agreements are recorded as a liability when the terms for the acquisition of goods and services or
the provision of transfer payments are met.
36
Contractual obligations that will materially affect the level of future expenditures include transfer payment
agreements, agreements for the acquisition of goods and services, operating leases and funding of international
organizations. At March 31, 2020, contractual obligations amount to $179,419 million, of which $51,543 million
pertains to fiscal year 2021.
The activities of government sometimes involve the negotiation of contracts or agreements with outside parties
that result in the government having rights to both assets and revenues in the future. They principally involve
sales of goods and services, leases of property, and royalties and profit-sharing arrangements. The terms of these
contracts and agreements may not allow for a reasonable estimate of future revenues. For contracts and
agreements that do allow for a reasonable estimate, total revenues to be received in the future under major
contractual rights are estimated at $37,218 million at March 31, 2020, of which $2,984 million pertains to fiscal
year 2021.
6. Contingent Liabilities
Contingent liabilities arise in the normal course of operations and their ultimate disposition is unknown.
Contingent liabilities are potential liabilities that may become actual liabilities when one or more future events not
wholly within the government’s control occur or fail to occur. A provision is recorded when the potential liabilities
are assessed as likely to become an actual liability and a reasonable estimate of the loss can be made. The
government’s contingent liabilities include claims comprising pending and threatened litigation, specific claims
and comprehensive land claims; guarantees provided by the government; assessed taxes under appeal; callable
share capital in international organizations; and, insurance programs of agent enterprise Crown corporations.
i. There are thousands of claims, including pending and threatened litigation, specific claims and comprehensive
land claims outstanding against the government. While the total amount claimed in these actions is
significant, their outcomes are not determinable in all cases. The government has recorded an allowance for
claims where it is likely that there will be a future payment and a reasonable estimate of the loss can be made.
Significant exposure to a liability could exist in excess of what has been accrued. Claims and litigation for
which the outcome is not determinable and for which an amount has not been accrued are estimated at
approximately $4,648 million ($8,528 million in 2019).
ii. Guarantees provided by the government include guarantees on the borrowings of enterprise Crown
corporations and other government business enterprises, loan guarantees, insurance programs managed by
the government or agent Crown corporations, and other explicit guarantees. At March 31, 2020, the principal
amount outstanding for guarantees provided by the government amounts to $564,298 million ($551,336
million in 2019) for which an allowance of $761 million ($277 million in 2019) has been recorded. Of the total
amount guaranteed, $309,909 million ($294,734 million in 2019) relates to guarantees on the borrowings of
agent enterprise Crown corporations.
iii. Contingent liabilities include previously assessed federal taxes where amounts are being appealed to the
Tax Court of Canada, the Federal Court of Canada, or the Supreme Court of Canada. As of March 31, 2020,
an amount of $4,373 million ($4,467 million in 2019) was being appealed to the courts. The government has
recorded, in accounts payable and accrued liabilities or in reduction of cash and accounts receivable, as
applicable, the estimated amount of appeals that are considered likely to be lost and that can be
reasonably estimated.
iv. The government has callable share capital in certain international organizations that could require payments to
those agencies. At March 31, 2020, callable share capital amounts to $36,533 million ($34,750 million in 2019).
v. At March 31, 2020, insurance in force relating to self-sustaining insurance programs operated by four agent
enterprise Crown corporations amounts to $1,802,143 million ($1,772,785 million in 2019). The government
expects that all four corporations will cover the cost of both current claims and possible future claims.

37
7. Subsequent Events
In March 2020, the World Health Organization classified the outbreak of COVID-19 disease as a global pandemic.
In response, the government enacted emergency measures to combat the spread of the virus and announced the
COVID-19 Economic Response Plan to help stabilize the economy during the pandemic. The impact of the
measures for which accounting recognition criteria were met prior to March 31, 2020, are recognized in the
government’s 2020 condensed consolidated financial statements. Since most of the measures were implemented
subsequent to year-end, the government’s 2021 condensed consolidated financial statements will be more
significantly impacted.
The COVID-19 pandemic led to additional measurement uncertainty in the preparation of the government’s
condensed consolidated financial statements given the declining economic situation that prevailed at and after
year end. Historical experience related to certain estimates in the condensed consolidated financial statements
may not be relevant, or may not be as reliable as before, in predicting future outcomes. This may lead to a greater
possibility of a material variance between estimates recognized or disclosed in the condensed consolidated
financial statements and the results ultimately realized. Accounting estimates subject to additional measurement
uncertainty due to the pandemic include the provisions for accounts receivable; contingent liabilities; public sector
pensions and other employee and veteran future benefits; and loans, investments and advances, including those
that may result from lending programs of enterprise Crown corporations.
The emergency measures introduced by the government are intended to protect the health and safety of
Canadians and provide direct support to Canadian workers and businesses. Legislation was enacted to provide
the government additional borrowing authority to fund the response to the crisis without the amounts counting
towards the maximum amounts set out in the Borrowing Authority Act. Between April 1 and July 31, 2020, the
government had increased its unmatured debt by $323 billion to meet the government’s projected financial
requirements under the Economic Response Plan up to that date.
Federal revenues are projected to be lower in 2021 as compared to 2020, largely due to the economic impacts of
the COVID-19 crisis on both employment levels and business activity.
Major government announcements, including the Speech from the Throne in September 2020, and legislation
introduced in Parliament authorizing new spending measures from April 1, 2020 onward, will have a significant
impact on the 2021 condensed consolidated financial statements. As this pandemic is ongoing and the
government response is continuing to evolve, the government is unable to reliably estimate at this time the full
impact on the unmatured debt or financial results of future years.