Embed Size (px)
Citation preview
- - 1
Hepatitis C Virus Infection Promotes Hepatic Gluconeogenesis 1
through an NS5A-Mediated, FoxO1-Dependent Pathway 2
3
Running title: HCV promotes hepatic gluconeogenesis 4
5
Lin Deng,1
Ikuo Shoji,1 Wataru Ogawa,
2 Shusaku Kaneda,
1 Tomoyoshi Soga,
3 Da-peng 6
Jiang,1 Yoshi-Hiro Ide,
1 and Hak Hotta
1∗∗∗∗ 7
8
Division of Microbiology, Center for Infectious Diseases1 and Division of Diabetes, Metabolism 9
and Endocrinology2, Kobe University Graduate School of Medicine, 7-5-1 Kusunoki-cho, 10
Chuo-ku, Kobe 650-0017; Institute for Advanced Biosciences, Keio University3, 246-2 11
Mizukami, Kakuganji, Tsuruoka, Yamagata 997-0052, Japan. 12
13
Word count for the abstract: 244 14
Word count for the text: 5152 15
Key words: Hepatitis C virus; NS5A; Gluconeogenesis; FoxO1; Diabetes mellitus 16
17
*Correspondence to Hak Hotta, Division of Microbiology, Center for Infectious Disease, Kobe 18
University Graduate School of Medicine, 7-5-1 Kusunoki-cho, Chuo-ku, Kobe 650-0017, Japan. 19
Phone: +81-78-382-5500. Fax: +81-78-382-5519. E-mail: [email protected] 20
Copyright © 2011, American Society for Microbiology and/or the Listed Authors/Institutions. All Rights Reserved.J. Virol. doi:10.1128/JVI.00146-11 JVI Accepts, published online ahead of print on 22 June 2011
on May 20, 2018 by guest
http://jvi.asm.org/
Dow
nloaded from

- - 2
ABSTRACT 21
22
Chronic hepatitis C virus (HCV) infection is often associated with type 2 diabetes. However, 23
the precise mechanism underlying this association is still unclear. Here, using Huh-7.5 cells 24
either harboring HCV-1b RNA replicons or infected with HCV-2a, we showed that HCV 25
transcriptionally upregulated the genes for phosphoenolpyruvate carboxykinase (PEPCK) and 26
glucose 6-phosphatase (G6Pase), the rate-limiting enzymes for hepatic gluconeogenesis. In this 27
way, HCV enhanced the cellular production of glucose 6-phosphate (G6P) and glucose. PEPCK 28
and G6Pase gene expressions are controlled by the transcription factor forkhead box O1 29
(FoxO1). We observed that, although neither the mRNA levels nor the protein levels of FoxO1 30
expression were affected by HCV, phosphorylation of FoxO1 at Ser319 was markedly 31
diminished in HCV-infected cells compared to the control cells, resulting in increased nuclear 32
accumulation of FoxO1, which is essential for sustaining its transcriptional activity. It was 33
unlikely that the decreased FoxO1 phosphorylation was mediated through Akt inactivation as 34
we observed increased phosphorylation of Akt at Ser473 in HCV-infected cells compared to the 35
control. By using specific inhibitors of c-Jun N-terminal kinase (JNK) and reactive oxygen 36
species (ROS), we demonstrated that HCV infection induced JNK activation via increased 37
mitochondrial ROS production, resulting in the decreased FoxO1 phosphorylation, FoxO1 38
nuclear accumulation and, eventually, increased glucose production. We also found that HCV 39
NS5A mediated increased ROS production and JNK activation, which is directly linked with 40
on May 20, 2018 by guest
http://jvi.asm.org/
Dow
nloaded from

- - 3
the FoxO1-dependent increased gluconeogenesis. Taken together, these observations suggest 41
that HCV promotes hepatic gluconeogenesis through an NS5A-mediated, FoxO1-dependent 42
pathway.43
on May 20, 2018 by guest
http://jvi.asm.org/
Dow
nloaded from
- - 4
INTRODUCTION 44
45
Hepatitis C virus (HCV) is a small, enveloped RNA virus that belongs to the genus Hepacivirus 46
of the family Flaviviridae, and the molecular mechanisms underlying its viral replication are 47
currently being unraveled (40). The HCV genome encodes a single polyprotein of about 3,000 48
amino acids, which is cleaved by host and viral proteases to generate at least 10 viral proteins, 49
such as core, envelope 1 (E1) and E2, p7, NS2, NS3, NS4A, NS4B, NS5A and NS5B. HCV can 50
be classified into seven genotypes, with each genotype further classified into a number of 51
subtypes, such as HCV-1a and HCV-1b (18, 24, 59). 52
53
HCV infects more than 120 million people worldwide (57). Persistent HCV infection causes not 54
only liver diseases (chronic hepatitis, liver cirrhosis, hepatocellular carcinoma) but also 55
extrahepatic manifestations, such as type 2 diabetes (2, 11, 20, 23). While it is known that liver 56
cirrhosis impairs the glucose metabolism of the liver, there are some reports showing that HCV-57
infected patients over 40 years of age have an increased risk of type 2 diabetes compared with 58
individuals without HCV infection (43). In addition, insulin receptor substrate (IRS)-1/PI3-59
kinase signaling was more impaired in HCV-infected patients than in non-HCV-infected 60
controls (3). These studies imply that HCV infection may directly predispose the host toward 61
type 2 diabetes. However, the precise mechanisms are poorly understood. 62
63
on May 20, 2018 by guest
http://jvi.asm.org/
Dow
nloaded from

- - 5
Hepatocytes play an important role in maintaining plasma glucose homeostasis by adjusting the 64
balance between hepatic glucose production and utilization via the gluconeogenic and glycolytic 65
pathways, respectively. It has been proposed that increased hepatic glucose production is a 66
major feature of type 2 diabetes (13). It is also known that hyperglycemia and the subsequent 67
development of type 2 diabetes mellitus result, at least in part, from impaired insulin signaling 68
together with elevated glucagon (5, 19). Hepatic glucose production and utilization, the 69
physiologically opposed cascades, are regulated, at least in part, at the transcriptional level of 70
the glucose 6-phosphatase (G6Pase) and glucokinase (GK) genes, which catalyze the last and 71
the first rate-limiting steps in gluconeogenesis and glycolysis, respectively. A number of studies 72
have shown that fasting/feeding (or hormones) controls the transcription of these two enzymes 73
in the opposite directions. G6Pase transcription is negatively regulated by insulin or feeding and 74
markedly increased in a fasting state (62). On the other hand, GK transcription is positively 75
regulated by insulin or feeding and markedly decreased in a fasting state (33). It has also been 76
reported that the gene expression of gluconeogenic and glycolytic enzymes, such as G6Pase, GK 77
and phosphoenolpyruvate carboxykinase (PEPCK), another rate-limiting enzyme for hepatic 78
gluconeogenesis, is regulated by certain transcription factors, including forkhead box O1 79
(FoxO1) (26, 50, 54), hepatic nuclear factor-4α (HNF-4α) (26), Krüppel-like factor 15 (KLF15) 80
(64) and cyclic AMP (cAMP) response-element binding protein (CREB) (52, 56). Deregulation 81
of the otherwise balanced control of hepatic glucose homeostasis would potentially lead to 82
hyperglycemia and eventually type 2 diabetes. 83
on May 20, 2018 by guest
http://jvi.asm.org/
Dow
nloaded from
- - 6
84
In this study, by using Huh-7.5 cells harboring HCV-1b RNA replicons, i.e., either a 85
subgenomic RNA replicon (SGR) or a full-genomic RNA replicon (FGR) (37), and cells 86
infected with HCV-2a (14, 37, 39), we investigated the possible effects of HCV on glucose 87
metabolism. We report here that HCV promotes hepatic gluconeogenesis, resulting in increased 88
cellular glucose production in hepatocytes via an NS5A-mediated, FoxO1-dependent pathway. 89
90
MATERIALS AND METHODS 91
92
Cells, HCV RNA replicons and virus. The human hepatoma-derived cell line Huh-7.5 (7) was 93
kindly provided by Dr. C. M. Rice (The Rockefeller University, New York, NY). SGR and FGR 94
were prepared using pFK5B/2884Gly (41) (a kind gift from Dr. R. Bartenschlager, University 95
of Heidelberg, Heidelberg, Germany) and pON/C-5B (31) (a kind gift from Dr. N. Kato, 96
Okayama University, Okayama, Japan), respectively. The SGR and FGR cells are of polyclonal 97
origin to avoid clonal variation. The pFL-J6/JFH1 plasmid that encodes the entire viral genome 98
of a chimeric strain of HCV-2a (J6/JFH1) (39) was kindly provided by Dr. Rice. The HCV RNA 99
genome was transcribed in vitro from pFL-J6/JFH1 and transfected into Huh-7.5 cells to yield 100
infectious HCV particles, as described previously (14). A cell culture-adapted P-47 strain (9, 101
14) was used throughout the experiments. Virus infection was performed at a multiplicity of 102
infection (moi) of 2.0. Virus infectivity was measured by indirect immunofluorescence analysis, 103
on May 20, 2018 by guest
http://jvi.asm.org/
Dow
nloaded from
- - 7
as described below, and expressed as cell-infecting units/ml. In some experiments, SGR and 104
FGR cells, as well as HCV-infected cells at 5 days after virus infection, were treated with 1,000 105
IU/ml of interferon-α (IFN) (Sigma Chemical, St. Louis, MO) for 10 days to eliminate HCV 106
replication. 107
108
Plasmid construction. Expression plasmids for core, p7, NS2, NS3, NS3/4A, NS4A, NS4B, 109
NS5A and NS5B were reported elsewhere (15, 32). 110
111
Real-time quantitative RT-PCR. Total cellular RNA was isolated using the RNAiso reagent 112
(Takara, Kyoto, Japan), and cDNA was generated using a QuantiTect Reverse Transcription 113
system (Qiagen, Valencia, CA). Real-time quantitative PCR was performed using SYBR 114
Premix Ex Taq (Takara) with SYBR Green chemistry on an ABI PRISM 7000 system (Applied 115
Biosystems, Foster City, CA), as reported previously (37). β-glucuronidase and GAPDH were 116
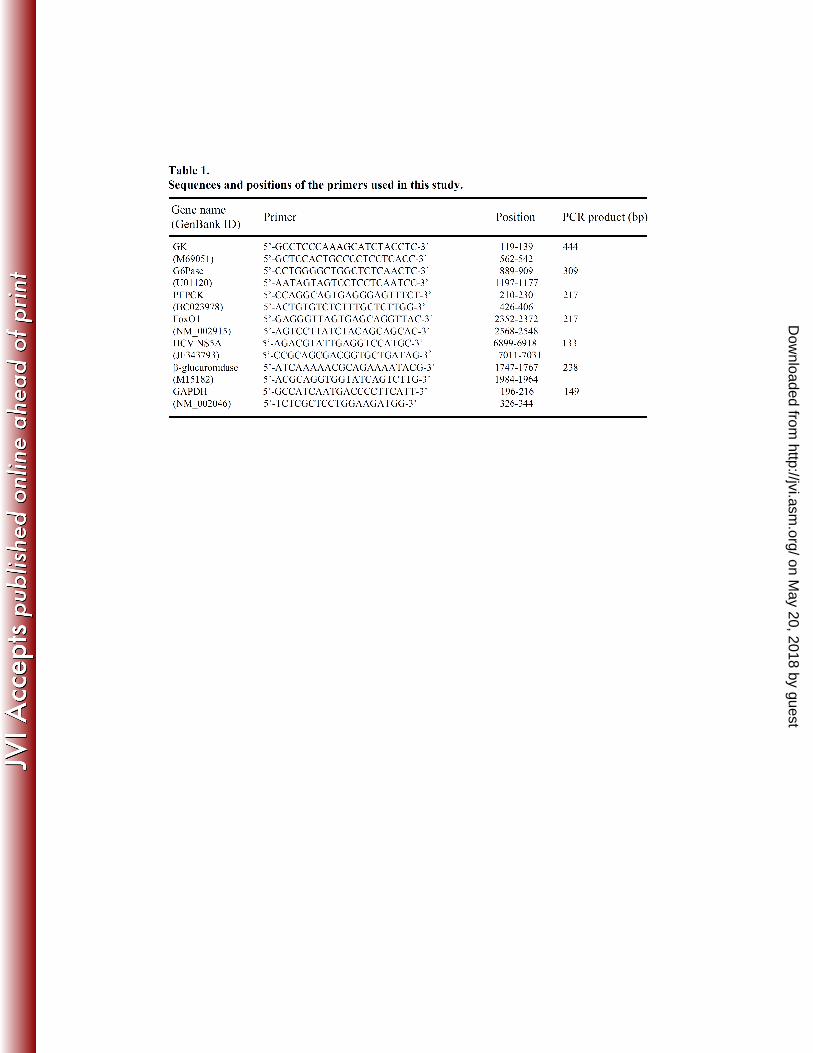
used as internal controls. The primers used are shown in Table 1. 117
118
G6P production assay. Huh-7.5 cells seeded in a 10-cm dish at a density of 1.0 × 10⁶ cells/dish 119
were infected with HCV or left uninfected. At different time points after infection, the cells 120
were washed twice with 5% mannitol solution and covered with methanol (1 ml) containing 25 121
µM each of four internal standards (3-aminopyrolidine, L-methionine sulfone, trimesate, and 2-122
morpholinoethanesulfonic acid) for enzyme inactivation. The methanol and cell mixtures were 123
on May 20, 2018 by guest
http://jvi.asm.org/
Dow
nloaded from
- - 8
collected and mixed with Milli-Q water and chloroform at ratios of 2:1:2. Both the medium and 124
cell sample solutions were then centrifuged at 20,000 × g for 15 min, and the aqueous layers 125
were collected for centrifugal filtration through a 5-kDa-cutoff filter at 9,000 × g for 2 h. The 126
extracted metabolites were concentrated with a centrifugal concentrator and stored at −80°C 127
until analysis. G6P concentrations were measured by capillary electrophoresis time-of-flight 128
mass spectrometry (CE-TOFMS), and the results were normalized to cell number as described 129
previously (60, 61). 130
131
Glucose production assay. Culture medium was replaced with 1 ml of glucose production 132
buffer consisting of glucose-free DMEM (Sigma Chemical), without phenol red, supplemented 133
with gluconeogenic substrate (2 mM sodium pyruvate and 20 mM sodium lactate). After 24 h of 134
incubation, the medium was collected and the total glucose concentration was measured by 135
using a commercial kit (Glucose CII Test Wako; Wako Pure Chemical Industries, Osaka, Japan) 136
and normalized to the cellular protein content. As the base-line of glucose production, glucose-137
free DMEM with neither sodium pyruvate nor sodium lactate was used. Glucose production via 138
gluconeogenesis = total glucose production – base-line glucose production. 139
140
Luciferase reporter assay. PEPCK gene promoter (−1263/+225) and a deletion mutant 141
(−998/+225) were inserted into the pGL3 Luciferase reporter plasmid (Promega, Madison, WI). 142
They were designated rPEPCK-P5(−1263)-pGL3basic and rPEPCK-P4(−998)-pGL3basic. 143
on May 20, 2018 by guest
http://jvi.asm.org/
Dow
nloaded from

- - 9
pRL-CMV-Renilla (Promega), which expresses Renilla luciferase, was used as an internal 144
control. Huh-7.5 cells prepared in a 12-well tissue culture plate at a density of 1.0 x 10⁵ 145
cells/well were transiently transfected with pRL-CMV-Renilla and rPEPCK-P5(−1263)-146
pGL3basic or rPEPCK-P4(−998)-pGL3basic in the presence of pEF1/NS4A, pEF1/NS5A or a 147
control vector (32). After 48 h, a luciferase assay was performed by using the Dual-Luciferase 148
Reporter assay system (Promega). Firefly and Renilla luciferase activities were measured on a 149
Lumat LB 9501 luminometer (Berthold, Bad Wildbad, Germany). Firefly luciferase activity 150
was normalized to Renilla luciferase activity for each sample. 151
152
Detection of mitochondrial reactive oxygen species (ROS). Mitochondrial ROS production 153
was analyzed as described previously (14). Briefly, cells seeded on glass coverslips in a 24-well 154
plate were incubated with 5 µM MitoSOXTM
Red (Molecular Probes, Eugene, OR) at 37ºC for 155
10 min, then fixed with 3.7% paraformaldehyde and observed under a confocal laser scanning 156
microscope (Carl Zeiss, Oberkochen, Germany). When needed, the fixed cells were subjected 157
to indirect immunofluorescence analysis to confirm HCV infection or NS5A expression, as 158
described below. 159
160
Indirect immunofluorescence. Huh7.5 cells seeded on glass coverslips in a 24-well plate were 161
infected with HCV or transfected with NS5A expression plasmid. At 5 days post-infection or 3 162
days post-transfection, the cells were fixed with 3.7% paraformaldehyde in PBS for 15 min at 163
on May 20, 2018 by guest
http://jvi.asm.org/
Dow
nloaded from
- - 10
room temperature, and permeabilized in 0.1% Triton X-100 in PBS for 15 min at room 164
temperature. Mock-infected or empty vector-transfected cells were similarly treated as controls 165
for comparison. After being washed with PBS twice, cells were consecutively stained with 166
primary and secondary antibodies. Primary antibodies used were anti-FoxO1 rabbit monoclonal 167
antibody (Cell Signaling Technology, Danvers, MA), anti-NS5A mouse monoclonal antibody 168
(Chemicon International, Temecula, CA) and HCV-infected patient’s serum. Secondary 169
antibodies used were Alexa Fluor 488-conjugated goat anti-rabbit IgG, Alexa-Fluor 594-170
conjugated goat anti-mouse IgG or anti-human IgG (Molecular Probes) and FITC-conjugated 171
goat anti-mouse IgG or anti-human IgG (MBL, Nagoya, Japan). The stained cells were 172
observed under a confocal laser scanning microscope (Carl Zeiss). 173
174
Cell fractionation and immunoblotting. Nuclear and cytoplasmic extracts from cells were 175
prepared using an NE-PER Nuclear and Cytoplasmic Extraction Reagents kit (Pierce Chemical, 176
Rockford, IL). For immunoblotting, cells were lysed with SDS sample buffer, and equal 177
amounts of protein were subjected to SDS-polyacrylamide gel electrophoresis and transferred 178
onto a polyvinylidene difluoride membrane (Millipore, Bedford, MA), which was then 179
incubated with the respective primary antibody. The primary antibodies used were mouse 180
monoclonal antibodies against HCV core (clone 2H9; a kind gift from Dr. T. Wakita, 181
Department of Virology II, National Institute of Infectious Diseases, Tokyo, Japan), NS3, NS4A, 182
NS5A, GAPDH (Chemicon), FoxO1 (Sigma Chemical), phospho-Akt (Ser473) (Cell Signaling 183
on May 20, 2018 by guest
http://jvi.asm.org/
Dow
nloaded from

- - 11
Technology), c-Myc (9E10; Santa Cruz Biotechnology, Santa Cruz, CA); rabbit polyclonal 184
antibodies against phospho-FoxO1 (Ser139), Oct-1 (Santa Cruz Biotechnology), c-Jun N-185
terminal kinase (JNK), phospho-JNK (Thr183/Tyr185), c-Jun, phospho-c-Jun (Ser63) and Akt 186
(Cell Signaling Technology); and goat polyclonal antibody against HSP60 (Santa Cruz 187
Biotechnology). Horseradish peroxidase-conjugated goat anti-mouse immunoglobulin (IgG), 188
goat anti-rabbit IgG (Molecular Probes) and donkey anti-goat IgG (Santa Cruz Biotechnology) 189
were used to visualize the respective proteins by means of an enhanced chemiluminescence 190
detection system (ECL; GE Healthcare, Buckinghamshire, UK). 191
192
Statistical analysis. Results were expressed as means ± SEM. Statistical significance was 193
evaluated by ANOVA, and defined as P < 0.05. 194
195
RESULTS 196
197
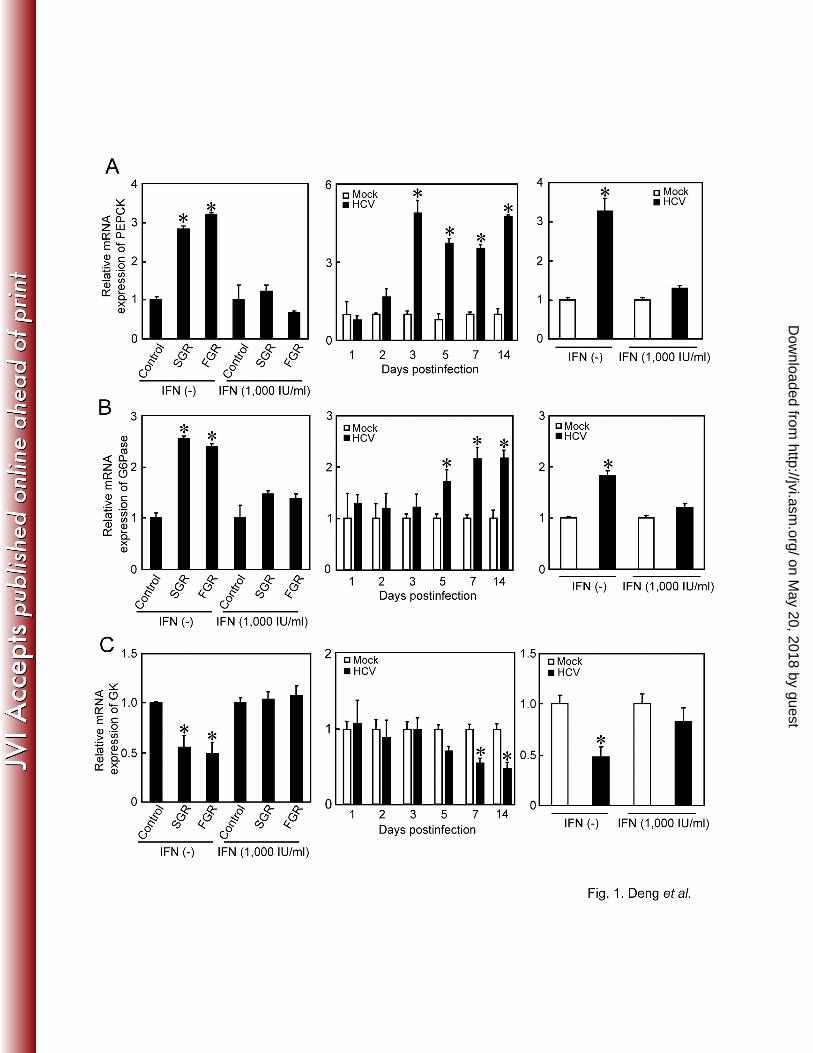
HCV upregulates gene expression of PEPCK and G6Pase and downregulates gene 198
expression of GK. 199
We first examined the expression levels of the genes for the rate-limiting enzymes in hepatic 200
gluconeogenesis, PEPCK and G6Pase, and of those for GK, which catalyzes the first step of 201
glycolysis, by means of real-time quantitative RT-PCR analysis. We observed that the PEPCK 202
and G6Pase genes were transcriptionally activated in SGR- and FGR-harboring cells (Fig. 1A, 203
on May 20, 2018 by guest
http://jvi.asm.org/
Dow
nloaded from
- - 12
1B, left panels). Similarly, the PEPCK and G6Pase genes were upregulated in HCV-infected 204
cells in a time-dependent manner, starting from 3 or 5 days post-infection (dpi) up to 14 dpi 205
(Fig. 1A, 1B, middle panels). On the other hand, the GK gene was transcriptionally 206
downregulated in SGR- and FGR-harboring cells and HCV-infected cells in a time-dependent 207
manner (Fig. 1C). It is noteworthy that gene expression of six glycolytic enzymes (not 208
including GK) was observed to be upregulated in HCV-infected cells at 1 dpi (16). 209
210
When IFN treatment eliminated HCV from the cells, the observed upregulation of PEPCK and 211
G6Pase gene expression, as well as the downregulation of GK gene expression in SGR- and 212
FGR-harboring cells and HCV-infected cells, were cancelled (Fig. 1A, 1B, 1C, left and right 213
panels). Thus, our results suggest that there was a trend towards an increase in gluconeogenesis 214
in SGR- and FGR-harboring cells and HCV-infected cells. In subsequent studies we further 215
examined whether or not HCV replication was correlated with gluconeogenesis. 216
217
HCV promotes cellular production of glucose and G6P. 218
We then examined the effect of HCV on cellular glucose production. The results showed that 219
SGR- and FGR-harboring cells and HCV-infected cells produced greater amounts of glucose 220
than did the control cells (Fig. 2A, upper and middle panels). IFN treatment cancelled the 221
enhanced glucose production in SGR- and FGR-harboring cells and in HCV-infected cells (Fig. 222
2A, upper and bottom panels). We also investigated the production of G6P, which is an 223
on May 20, 2018 by guest
http://jvi.asm.org/
Dow
nloaded from
- - 13
important precursor molecule that is converted to glucose in the gluconeogenesis pathway, by 224
means of metabolome analysis. As shown in Fig. 2B, a significantly higher level of G6P was 225
accumulated in HCV-infected cells than in the controls. Taken together, these results indicate 226
that HCV indeed promotes hepatic gluconeogenesis to cause hyperglycemia. In the following 227
analyses, we examined the possible mechanisms of HCV-induced increased gluconeogenesis. 228
229
HCV suppresses FoxO1 phosphorylation at Ser319, leading to the nuclear accumulation of 230
FoxO1. 231
It has been demonstrated that FoxO1 in hepatocytes enhances gluconeogenesis through the 232
transcriptional activation of various genes, including G6Pase and PEPCK (25). To investigate 233
the possible effects of FoxO1 on HCV-induced gluconeogenesis, we examined the gene 234
expression levels of FoxO1 by real-time quantitative RT-PCR analysis. As shown in Fig. 3A, 235
there was neither upregulation nor downregulation of FoxO1 gene expression in SGR- or FGR-236
harboring cells or HCV-infected cells. The FoxO1 transcription factor is controlled by various 237
post-translational modifications, which include phosphorylation, ubiquitylation and acetylation. 238
The phosphorylated form of FoxO1 is exported from the nucleus and thereby loses its 239
transcriptional function (30). We therefore examined the phosphorylation status of FoxO1 at 240
Ser319, which is critical for FoxO1 nuclear exclusion (72). The results showed that FoxO1 241
phosphorylation at Ser319 was markedly suppressed in HCV-infected cells from 4 dpi up to 8 242
dpi, compared to that in the HCV-negative control cells (Fig. 3B, first panel), in a time-243
on May 20, 2018 by guest
http://jvi.asm.org/
Dow
nloaded from
- - 14
dependent manner that was roughly the inverse of the pattern observed for PEPCK and G6Pase 244
mRNA upregulation (Fig. 1A and 1B) and glucose production (Fig. 2A), while the total protein 245
expression levels of FoxO1 were unchanged (Fig. 3B, second panel). In this connection, 246
Banerjee et al. reported that FoxO1 phosphorylation at Ser256 was also inhibited in HCV-247
infected cells (4). Since FoxO1 is known to be phosphorylated by Akt so as to be exported from 248
the nucleus and transcriptionally inactivated (38), we examined whether Akt function was 249
suppressed through its impaired phosphorylation in HCV-infected cells. The result obtained 250
revealed that this was not the case; Akt phosphorylation was enhanced in HCV-infected cells 251
from 4 dpi up to 6 dpi compared with the control cells (Fig. 3B, third panel) while the total 252
protein expression levels of Akt were comparable (Fig. 3B, fourth panel). This result is 253
consistent with a recent observation by Burdette et al. (10) that Akt phosphorylation was 254
elevated in HCV-infected cells. These data suggest that the observed decrease in FoxO1 255
phosphorylation in HCV-infected cells is caused by a mechanism independent of Akt. 256
257
Next, we tested whether HCV indeed promoted FoxO1 nuclear accumulation. The majority of 258
FoxO1 was accumulated in the nuclear fraction in HCV-infected cells (Fig. 3C, second panel, 259
lanes 2 and 4) whereas in control cells FoxO1 was distributed in both the nuclear and 260
cytoplasmic fractions (lanes 1 and 3). Taken together, these results suggest that HCV 261
suppressed FoxO1 phosphorylation, leading to nuclear accumulation of FoxO1. 262
263
on May 20, 2018 by guest
http://jvi.asm.org/
Dow
nloaded from
- - 15
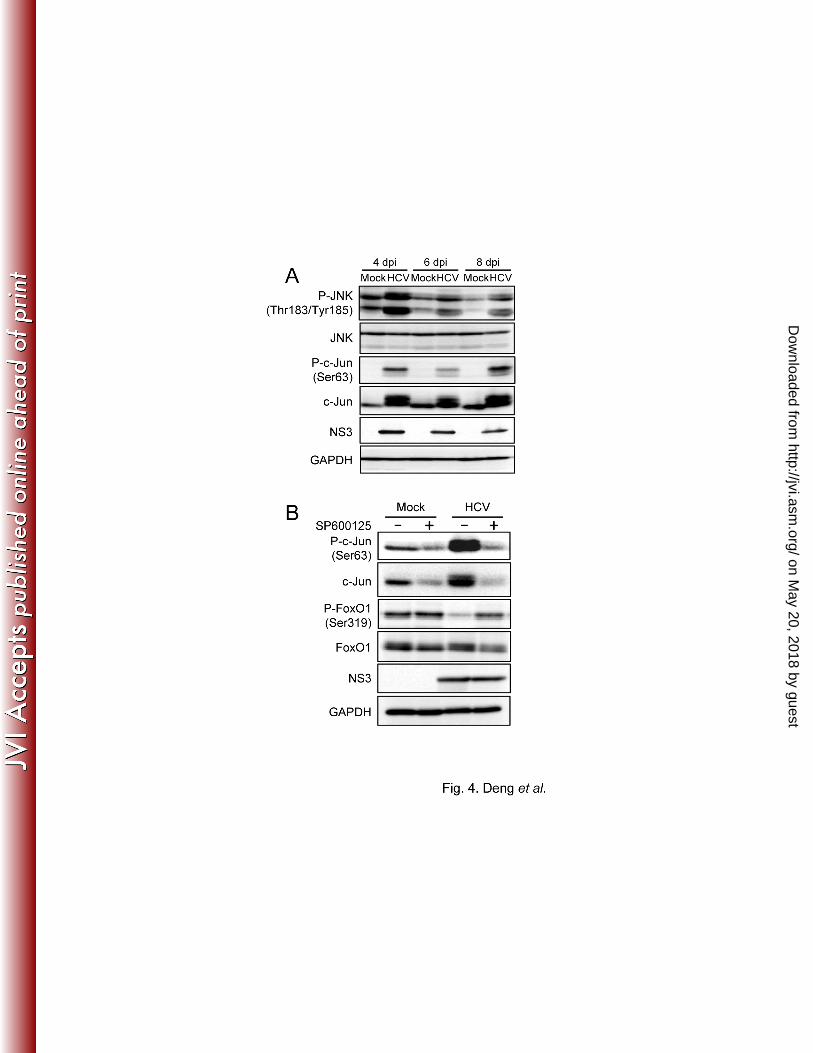
HCV-induced JNK activation is involved in the suppression of FoxO1 phosphorylation. 264
Recent studies have demonstrated that a signaling pathway that involves the stress-sensitive 265
serine/threonine kinase JNK regulates FoxO at multiple levels (36, 66). We therefore 266
investigated whether HCV induced JNK activation in Huh-7.5 cells. As shown in Fig. 4A, the 267
amount of phosphorylated (activated) JNK markedly increased in HCV-infected cells in a time-268
dependent manner similar to that observed for the suppression of FoxO1 phosphorylation, while 269
the total expression levels of JNK were unchanged. As a result, c-Jun, a key substrate for JNK, 270
was phosphorylated (activated) in HCV-infected cells, but not in the mock-infected control 271
cells. It should also be noted that the total expression levels of c-Jun in HCV-infected cells were 272
significantly higher than those in the mock-infected control cells, suggesting that c-Jun 273
activation through its phosphorylation stabilizes c-Jun protein expression in HCV-infected cells, 274
as has been proposed by Zhang et al. (71). 275
276
We next sought to determine whether JNK activation was involved in the HCV-induced 277
suppression of FoxO1 phosphorylation. HCV-infected cells at 5 days after virus infection were 278
treated with the specific JNK inhibitor SP600125 (20 µM) (6) for 24 h. The catalytic JNK 279
activity was assayed by following the phosphorylation of c-Jun. As shown in Fig. 4B, 280
SP600125 clearly prevented the phosphorylation of c-Jun, and concomitantly recovered the 281
suppression of FoxO1 phosphorylation in HCV-infected cells. These results suggest that HCV 282
activates the JNK/c-Jun signaling pathway, which induces the nuclear accumulation of FoxO1 283
on May 20, 2018 by guest
http://jvi.asm.org/
Dow
nloaded from

- - 16
by reducing its phosphorylation status. 284
285
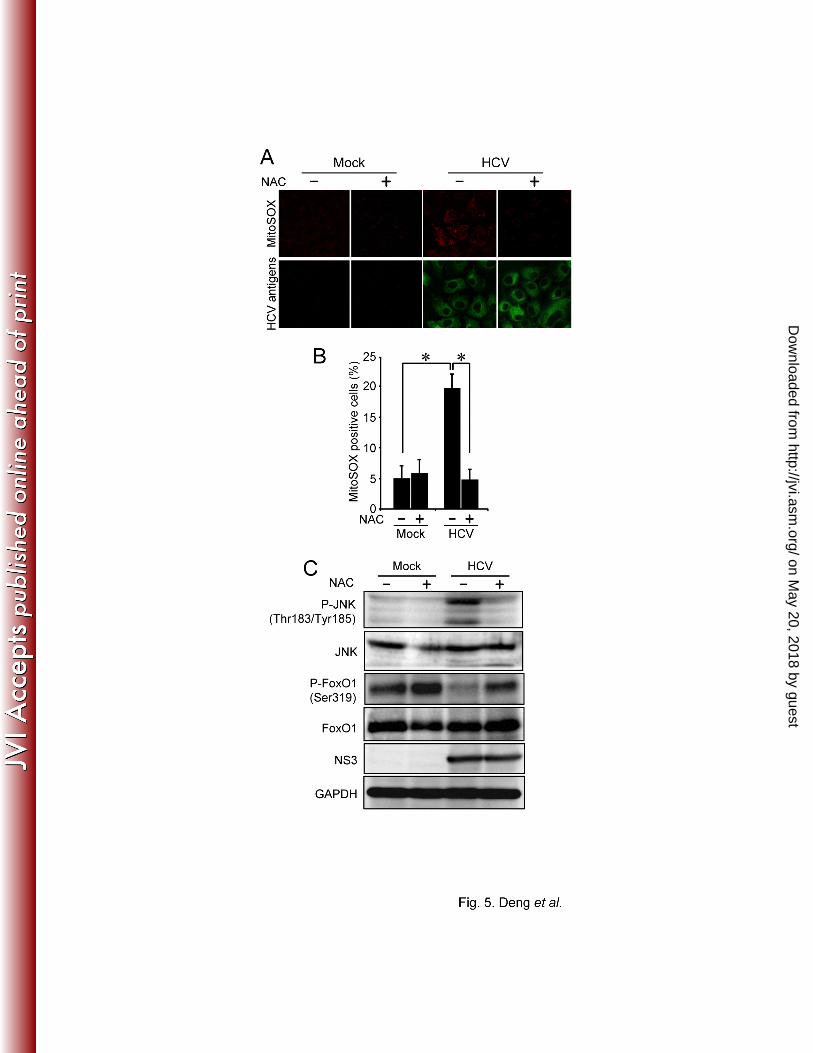
HCV-induced mitochondrial ROS production is involved in FoxO1 phosphorylation 286
suppression, FoxO1 nuclear accumulation and increased glucose production through JNK 287
activation. 288
We previously reported that HCV infection increases mitochondrial ROS production (14). JNK 289
is known to be activated by ROS (35). We therefore sought to determine whether the HCV-290
induced increase in ROS production is an event occurring upstream of JNK activation by HCV. 291
Pretreatment of HCV-infected cells (at 6 dpi) with 5 mM N-acetyl cysteine (NAC) (a general 292
antioxidant) for 2 h significantly reduced the HCV-induced increase in ROS (Fig. 5A and 5B), 293
as revealed by using MitoSOX, a fluorescent probe specific for superoxide that selectively 294
accumulates in the mitochondrial compartment. As shown in Fig. 5C, NAC clearly prevented 295
the phosphorylation of JNK, and concomitantly recovered the suppression of FoxO1 296
phosphorylation in HCV-infected cells. These results suggest that HCV-induced ROS 297
production is involved in JNK activation, which results in the inhibition of FoxO1 298
phosphorylation. 299
300
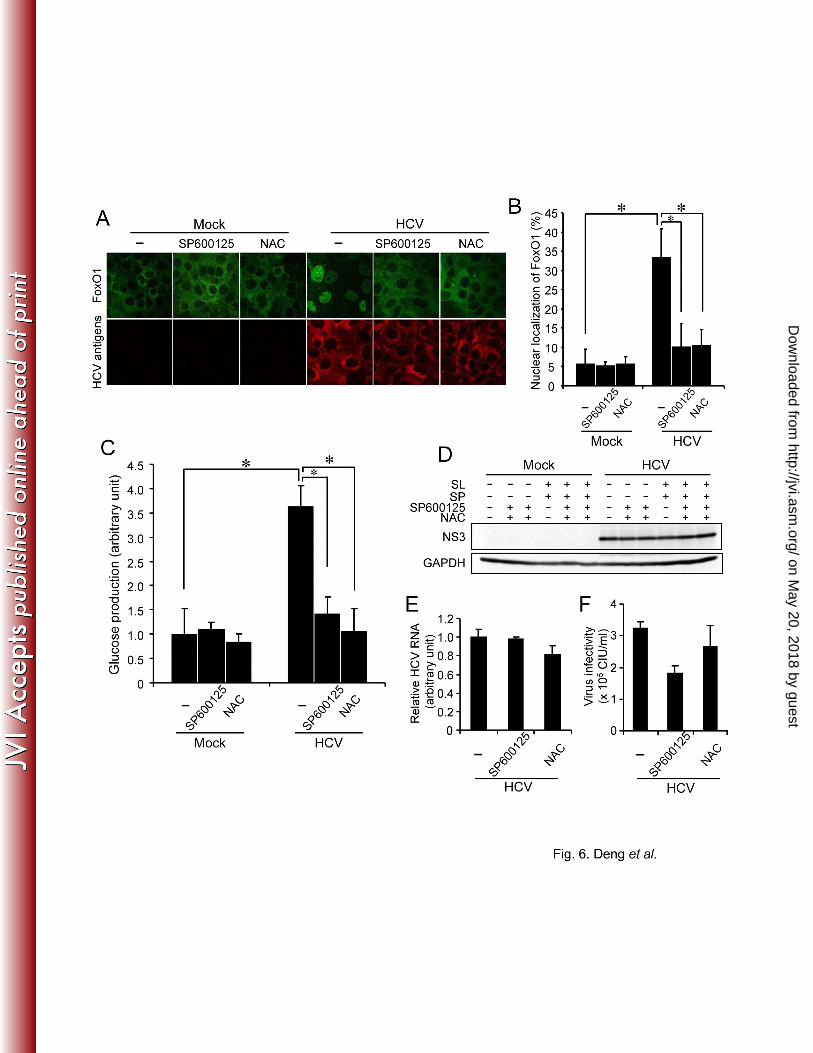
We next investigated the effects of JNK activation and ROS production on subcellular 301
localization of FoxO1 in HCV-infected cells by indirect immunofluorescence staining. As 302
shown in Fig. 6A and 6B, FoxO1 was localized predominantly in the cytoplasm in mock-303
on May 20, 2018 by guest
http://jvi.asm.org/
Dow
nloaded from
- - 17
infected control cells. On the other hand, nuclear accumulation of FoxO1 was clearly observed 304
in approximately 35% of HCV-infected cells at 5 dpi. Treatment of HCV-infected cells with a 305
JNK inhibitor (SP600125; 20 µM, 24 h) or an antioxidant (NAC; 5 mM, 2 h) significantly 306
inhibited HCV-induced FoxO1 nuclear accumulation. 307
308
To further verify the role played by JNK activation and ROS production in HCV-induced 309
hepatic gluconeogenesis, the glucose production in SP600125- or NAC-treated HCV-infected 310
cells was assessed. Treatment with SP600125 or NAC significantly impaired HCV-induced 311
increased glucose production at 7 dpi (Fig. 6C), but did not affect the overall abundance of 312
HCV NS3 protein (Fig. 6D). We also examined the possible effects of SP600125 or NAC on 313
HCV RNA replication and infectious virus production. The results obtained revealed that 314
treatment with SP600125 (20 µM, 24 h) or NAC (5 mM, 2 h) barely affected HCV RNA 315
replication (Fig. 6E). On the other hand, a tendency was noted that infectious virus production 316
was only slightly suppressed by SP600125, but not by NAC (Fig. 6F). A short-term inhibition 317
of glucose production might not sufficiently affect HCV RNA replication or virus production. 318
319
Taken together, these results indicate that ROS-mediated JNK activation plays a key role in the 320
suppression of FoxO1 phosphorylation, nuclear accumulation of FoxO1, and enhancement of 321
glucose production in HCV-infected cells. 322
323
on May 20, 2018 by guest
http://jvi.asm.org/
Dow
nloaded from

- - 18
HCV NS5A is involved in the enhancement of glucose production. 324
To examine which HCV protein(s) is involved in the enhancement of gluconeogenesis, 325
expression constructs of each of the HCV viral proteins were transfected into Huh-7.5 cells, and 326
the gene expression levels of PEPCK and G6Pase were examined by real-time quantitative RT-327
PCR analysis. We observed that NS5A significantly promoted G6Pase gene expression (Fig. 328
7A). Moreover, both the NS5A and NS4A proteins significantly enhanced PEPCK gene 329
expression at 3 and 5 days post-transfection, respectively (Fig. 7B). The expression of each of 330
the HCV proteins except NS2 was verified by immunoblot analysis (Fig. 7C). NS2 was 331
reported to be unstable and rapidly degraded by the proteasome (22). 332
333
Next, we performed a luciferase reporter assay to examine the possible effects of NS5A and 334
NS4A on PEPCK promoter activities. The construct rPEPCK-P5(−1263)-pGL3basic carries 335
1263 bp of the PEPCK 5’-flanking region (−1263 PEPCK) and is used to monitor PEPCK 336
promoter activity. The results demonstrated that the levels of PEPCK promoter activities were 337
significantly higher in both NS5A- and NS4A-expressing cells than in the control cells (Fig. 338
6C). Interestingly, when the region of the PEPCK promoter from −1263 to −998 was deleted, 339
the activation of PEPCK promoter activity in cells expressing NS5A and NS4A was abolished. 340
These results confirmed that NS5A and NS4A activate the PEPCK promoter, leading to an 341
increase in PEPCK mRNA expression. Database searches of the deleted sequence did not find 342
any potential binding sequences for transcription factors (data not shown). 343
on May 20, 2018 by guest
http://jvi.asm.org/
Dow
nloaded from

- - 19
344
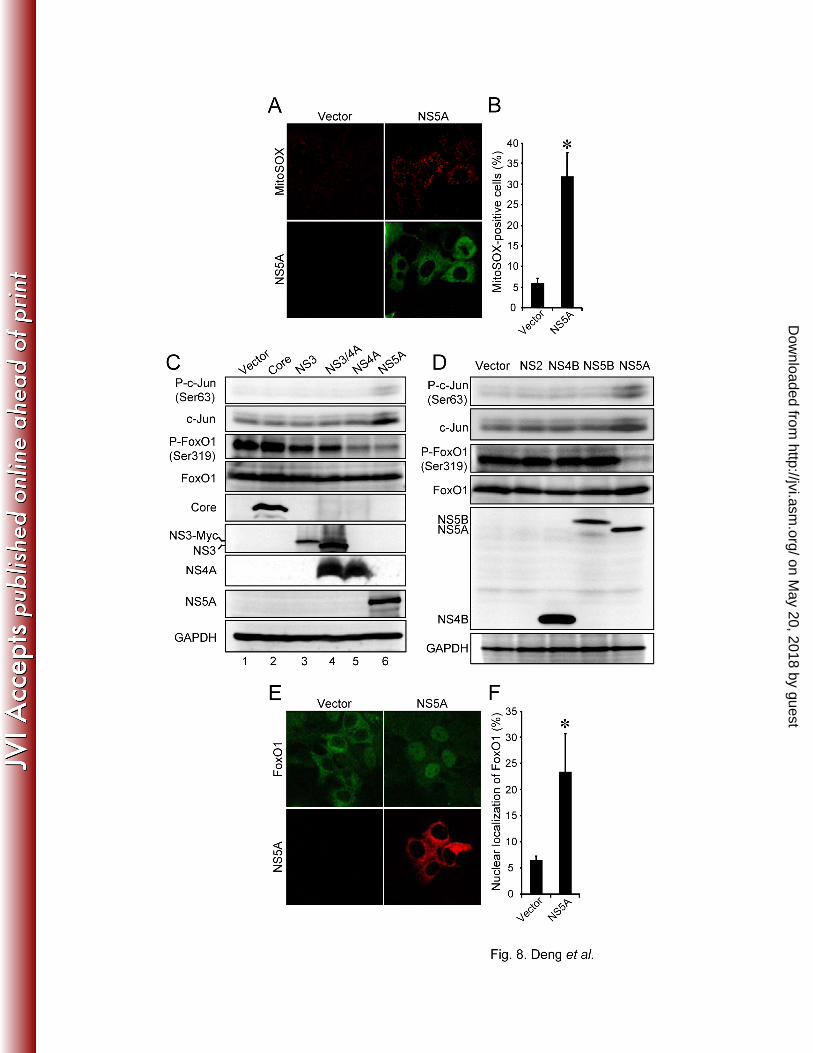
Recent data suggest that ROS production is induced in NS5A-expressing cells (17) or in 345
hepatocytes of NS5A transgenic mice (68). We therefore sough to determine whether NS5A 346
contributes to increased hepatic gluconeogenesis through the induction of ROS production. The 347
NS5A expression plasmid was transfected into Huh-7.5 cells, and ROS production was assessed 348
by MitoSOX at 3 days post-transfection. As shown in Fig. 8A and 8B, approximately 30% of 349
NS5A-expressing cells displayed a much stronger signal than that observed with the vector-350
transfected control. 351
352
We then examined whether NS5A mediated JNK/c-Jun activation and FoxO1 phosphorylation 353
inhibition. The results obtained revealed that both phosphorylation level at Ser63 and total 354
expression level of c-Jun were upregulated in NS5A-expressing cells compared to the control 355
cells transfected with the vector plasmid or in cells expressing the other HCV proteins (Fig. 8C 356
and 8D, top two panels). Concomitantly, FoxO1 phosphorylation at Ser319 was clearly 357
suppressed in NS5A- and NS4A-expressing cells compared to the control cells (Fig. 8C, 358
compare lanes 6, 5 and 1 in the third panel). NS4A, a small protein of ca. 7 kDa, forms a stable 359
complex with NS3 to function as a cofactor for NS3 serine protease and RNA helicase activities 360
(51). We previously reported that NS4A caused mitochondrial damage when expressed alone, 361
but not when coexpressed with NS3 (47). We therefore speculated that the otherwise observed 362
decrease in FoxO1 phosphorylation in NS4A-expressing cells might be canceled when 363
on May 20, 2018 by guest
http://jvi.asm.org/
Dow
nloaded from
- - 20
coexpressed with NS3. To verify this notion, we tested the FoxO1 phosphorylation in cells 364
coexpressing NS3 and NS4A. As had been expected, FoxO1 phosphorylation levels did not 365
differ between NS3/4A-coexpressing cells and the vector-transfected control (Fig. 8C, compare 366
lanes 4 and 1). 367
368
Notably, we observed that HCV core protein did not alter the phosphorylation status of c-Jun 369
and FoxO1 (Fig. 8C, compare lanes 2 and 1), with result being consistent with what was 370
observed for gene expression levels of PEPCK and G6Pase in HCV core-expressing cells (Fig. 371
7A and 7B). These results imply that core is not primarily involved in HCV-induced increased 372
gluconeogenesis under our experimental condition. Similarly, other HCV nonstructural proteins, 373
such as NS4B and NS5B, did not significantly influence the phosphorylation status of c-Jun and 374
FoxO1 (Fig. 8D). 375
376
In order to further verify the effect of NS5A on the nuclear accumulation of FoxO1, we 377
examined the subcellular localization of FoxO1 in NS5A-expressing cells by indirect 378
immunofluorescence staining. As shown in Fig. 8E and 8F, nuclear accumulation of FoxO1 was 379
clearly observed in approximately 25% of NS5A-expressing cells but not in the vector-380
transfected control. These results suggest that NS5A activates JNK/c-Jun signaling pathway via 381
increased ROS production, which results in the decreased phosphorylation and nuclear 382
accumulation of FoxO1. 383
on May 20, 2018 by guest
http://jvi.asm.org/
Dow
nloaded from

- - 21
384
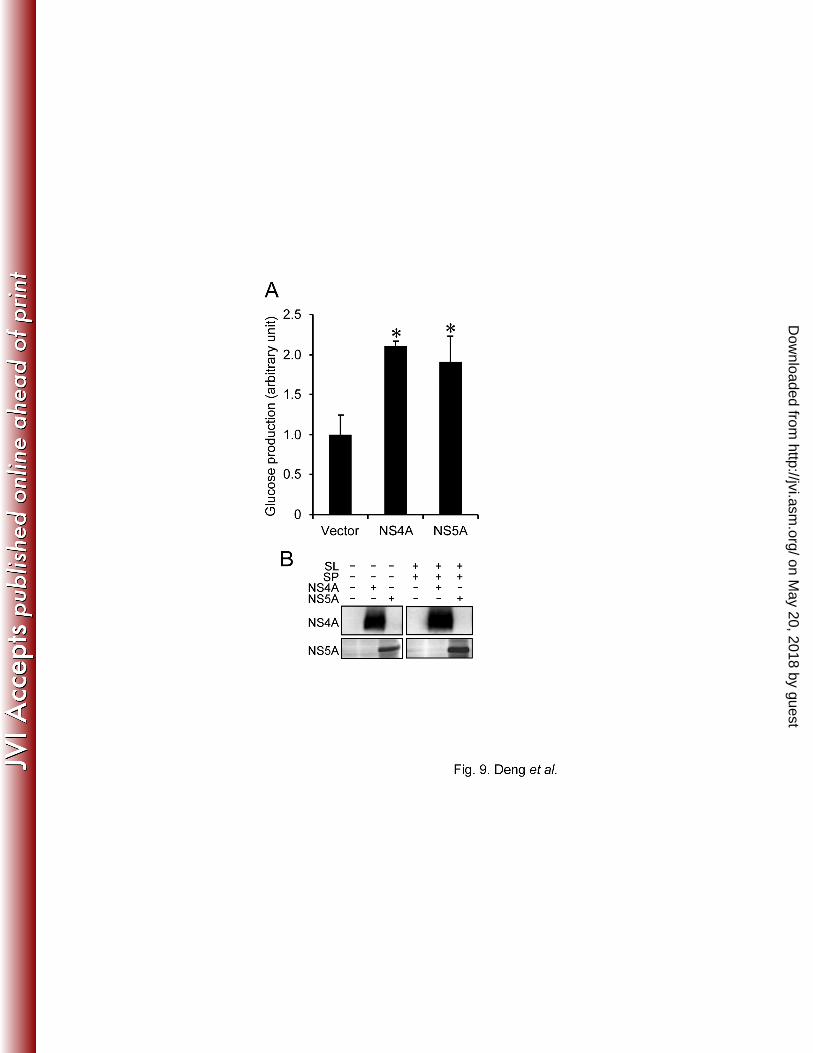
Finally, we examined the effects of NS5A and NS4A on glucose production. As shown in Fig. 9, 385
the amounts of glucose were significantly increased in culture supernatants of NS5A- and 386
NS4A-expressing cells, compared with the control, at 5 days post-transfection. Again, it is 387
reasonable to assume that the observed increase in glucose production in NS4A-expressing cells 388
might be canceled when coexpressed with NS3. 389
390
These results collectively suggest that NS5A plays a role, at least to some extent, in HCV-391
induced enhancement of hepatic gluconeogenesis. 392
393
DISCUSSION 394
395
Hepatocytes play an important role in maintaining plasma glucose homeostasis by adjusting the 396
balance between hepatic glucose production and utilization via the gluconeogenic and 397
glycolytic pathways, respectively. We previously reported that HCV suppresses cellular glucose 398
uptake by downregulating the surface expression of glucose transporters GLUT1 and GLUT2 399
(37). In this study, we have demonstrated that HCV promotes FoxO1-mediated hepatic 400
gluconeogenesis, as evidenced by the increased accumulation of FoxO1 in the nucleus via the 401
reduction of its phosphorylation status (Figs. 3 and 6A, 6B), which leads to the increased 402
PEPCK and G6Pase gene expression (Fig. 1A and 1B) and subsequent upregulation of G6P and 403
on May 20, 2018 by guest
http://jvi.asm.org/
Dow
nloaded from
- - 22
glucose production (Fig. 2). Moreover, our results indicate that HCV-induced ROS production 404
causes JNK activation, which results in the decreased phosphorylation and nuclear 405
accumulation of FoxO1, leading eventually to increased glucose production (Figs. 4 to 6). Our 406
results thus suggest that FoxO1 is a prime transcription factor in the HCV-mediated progression 407
of hepatic gluconeogenesis through an ROS/JNK-dependent mechanism, as summarized in the 408
schema in Fig. 10. Our results also suggest that HCV NS5A plays a role in enhanced hepatic 409
gluconeogenesis by promoting ROS production and JNK activation (Figs. 7 to 9). In line with 410
our observations, NS5A-mediated induction of ROS production (68) and JNK activation (49) 411
was reported by other investigators. 412
413
Increasing evidence suggests that mitochondrial dysfunction is causative of insulin resistance 414
and type 2 diabetes. Mitochondrial dysfunction causes upregulation of PEPCK and G6Pase, 415
leading to increased gluconeogenesis and insulin resistance (42, 46). We previously reported 416
that HCV causes mitochondrial damage and mitochondrion-mediated apoptosis (14, 47). Our 417
current data further support the concept that altered mitochondrial function plays a role in the 418
development of increased glucose production in hepatocytes. 419
420
We and other groups have reported that HCV infection increases the production of 421
mitochondrial ROS, which plays an important role in the development and progression of 422
inflammatory liver disease mediated by HCV (12, 14). Increased mitochondrial ROS generation 423
on May 20, 2018 by guest
http://jvi.asm.org/
Dow
nloaded from

- - 23
has also been shown to be an underlying mediator of multiple forms of insulin resistance 424
including inflammation- or glucocorticoid-induced insulin resistance (27, 29). Moreover, a 425
significant correlation was observed between oxidative stress and insulin resistance in patients 426
infected with HCV genotype 1 or 2 (44). ROS has also been shown to regulate the activity of 427
the FoxO transcription factor by post-translational modifications, including phosphorylation 428
(21), deacetylation (8) and ubiquitylation (67). 429
430
Although this study showed that JNK induces the nuclear accumulation of FoxO1 by reducing 431
its phosphorylation status under oxidative stress conditions in HCV-infected cells, the precise 432
mechanism(s) of interplay between JNK and FoxO1 still remains to be addressed. It has been 433
reported that activated JNK phosphorylates IRS-1 at Ser307, which results in attenuated insulin 434
signal transduction through inhibition of tyrosine phosphorylation of IRS-1 (1). Akt is a major 435
downstream signaling protein for the insulin/IRS-1 signaling and is activated through its 436
phosphorylation on Thr308 and Ser473, the latter of which is believed to be more crucial (53). 437
Therefore, an impairment of the insulin/IRS-1 signaling pathway should involve 438
downregulation of Akt phosphorylation. However, our present data showed that Akt 439
phosphorylation on Ser473 was upregulated in HCV-infected cells at 4 and 6 dpi (Fig. 3B), 440
suggesting that an Akt-independent pathway is involved in the JNK-mediated suppression of 441
FoxO1 phosphorylation. In this connection, it should be noted that the 14-3-3 protein, a binding 442
partner for phosphorylated FoxO1 that mediates its nuclear export (72), is phosphorylated by 443
on May 20, 2018 by guest
http://jvi.asm.org/
Dow
nloaded from

- - 24
JNK and that phosphorylated 14-3-3 protein releases its binding partners, which would 444
facilitate nuclear accumulation of FoxO (63, 65, 70). Further studies are needed to elucidate this 445
issue. 446
447
Another trigger that causes excessive JNK activation and insulin resistance is endoplasmic 448
reticulum (ER) stress (28, 48). Several studies have reported that HCV infection induces ER 449
stress (34, 55). Under our experimental condition, however, we did not detect significant ER 450
stress in HCV-infected cells (14). It is thus likely that ER stress was not the primary cause of 451
increased gluconeogenesis in our experimental system using Huh-7.5 cells and the P-47 strain 452
of HCV J6/JFH-1 (9, 14). 453
454
Notably, our present data showed that cells harboring SGR or FGR and HCV-infected cells 455
produced greater amounts of glucose than did the control cells (Fig. 2A), however, the changes 456
in the phosphorylation status of FoxO1 and JNK in SGR- and FGR-harboring cells were not so 457
significant compared to the virus-infected cells (data not shown). One of the reasons for this 458
difference is that SGR- and FGR- harboring cells were obtained through a longer cultivation in 459
a selection medium for a month or more and that the balance of host gene induction may be 460
somewhat different from that in virus-infected cells. Therefore, it is possible that, in addition to 461
the JNK-FoxO1 pathway, another signaling pathway(s) is involved in increased 462
gluconeogenesis in SGR- and FGR-harboring cells. Studies on this issue are now under way in 463
on May 20, 2018 by guest
http://jvi.asm.org/
Dow
nloaded from

- - 25
our laboratory. 464
465
We observed that HCV infection modulated, either positively or negatively, the transcription of 466
the PEPCK, G6Pase and GK genes at 3 to 5 dpi (Fig. 1). Virus infection, in general, causes 467
dynamically changing induction and suppression of a wide variety of host genes. For example, 468
expression levels of certain genes, such as the interferon genes, increase during an early phase 469
of virus infection, e.g., 1 dpi, but return to normal levels within a few days in cell culture 470
system. On the other hand, virus infection-induced expression of other genes, such as the ERK 471
gene, remains for a prolonged period of time (data not shown). Also, some of the gene products 472
induced in the acute phase may suppress expression of other genes. Under this balanced 473
condition, it is quite possible that certain genes are induced only at a later timing, e.g., 3 to 5 dpi, 474
but not immediately after virus infection. 475
476
It has been reported that HCV core protein-expressing transgenic mice exhibit marked insulin 477
resistance by inhibiting IRS-1 tyrosine phosphorylation and Akt phosphorylation (45, 58). 478
However, our present results showed that HCV NS5A, but not the core protein, was associated 479
with increased gluconeogenesis. Moreover, it was recently reported that HCV infection 480
significantly inhibited cellular glucose levels at 10 dpi (69), which is quite opposite to what we 481
observed in the present study. These results collectively suggest the possibility that multiple 482
pathways are involved in glucose metabolism in HCV-infected cells. Also, the possible effect(s) 483
on May 20, 2018 by guest
http://jvi.asm.org/
Dow
nloaded from
- - 26
of the dysregulation of hepatic gluconeogenesis on the HCV life cycle needs to be clarified. 484
485
In conclusion, our present results collectively suggest that HCV promotes hepatic 486
gluconeogenesis, resulting in increased glucose production in hepatocytes via an NS5A-487
mediated, FoxO1-dependent pathway. 488
489
ACKNOWLEDGMENTS 490
The authors are grateful to Dr. C. M. Rice (The Rockefeller University, New York, NY) for 491
providing Huh-7.5 cells and pFL-J6/JFH1, Dr. R. Bartenschlager (University of Heidelberg, 492
Heidelberg, Germany) for providing an HCV subgenomic RNA replicon (pFK5B/2884Gly), 493
and Dr. N. Kato (Okayama University, Okayama, Japan) for providing an HCV full-length RNA 494
replicon (pON/C-5B). Thanks are also due to Dr. T. Adachi (Kyoto Prefectural University of 495
Medicine, Kyoto, Japan), Ms. K. Igarashi, Ms. K. Kashikura, and Ms. A. Suzuki (Keio 496
University, Yamagata, Japan) for their technical assistance. This work was supported in part by 497
grants-in-aid for Research on Hepatitis from the Ministry of Health, Labour and Welfare, Japan, 498
and the Japan Initiative for Global Research Network on Infectious Diseases (J-GRID) program 499
of Ministry of Education, Culture, Sports, Science and Technology, Japan. This study was also 500
carried out as part of the Global Center of Excellence program of Kobe University Graduate 501
School of Medicine, and the Science and Technology Research Partnership for Sustainable 502
Development (SATREPS) program of Japan Science and Technology Agency (JST) and Japan 503
on May 20, 2018 by guest
http://jvi.asm.org/
Dow
nloaded from
- - 27
International Cooperation Agency (JICA).504
on May 20, 2018 by guest
http://jvi.asm.org/
Dow
nloaded from

28
FIGURE LEGENDS 505
506
FIG. 1. HCV upregulates gene expression of PEPCK and G6Pase and downregulates gene 507
expression of GK. Quantitative RT-PCR analysis was performed to quantify PEPCK (A), 508
G6Pase (B), and GK (C) mRNA expression in SGR- and FGR-harboring cells and HCV-509
infected cells (moi = 2), and the results were normalized to β-glucuronidase mRNA 510
expression levels. In parallel, SGR- and FGR-harboring cells and HCV-infected cells (at 5 511
dpi) were treated with IFN (1,000 IU/ml) for 10 days to eliminate HCV replication before 512
being subjected to quantitative RT-PCR. Data represent mean ± SEM of three independent 513
experiments, and the values for the control cells were arbitrarily expressed as 1.0. *, P<0.01 514
compared with the control. 515
516
FIG. 2. HCV promotes the production of glucose and G6P. (A) Extracellular glucose 517
production was measured in SGR- and FGR-harboring cells and HCV-infected cells (moi = 2), 518
and normalized to total cellular protein expression. In parallel, SGR- and FGR-harboring 519
cells and HCV-infected cells (at 5 dpi) were treated with IFN (1,000 IU/ml) for 10 days to 520
eliminate HCV replication before being subjected to glucose production analysis. Data 521
represent mean ± SEM of three independent experiments and the value for the control cells 522
was arbitrarily expressed as 1.0. *, P<0.01 compared with the control. (B) Cellular G6Pase 523
on May 20, 2018 by guest
http://jvi.asm.org/
Dow
nloaded from
29
production was measured in HCV-infected cells (moi = 2), and the results were normalized to 524
cell number. Data represent mean ± SEM of three independent experiments. *, P<0.01 525
compared with the control. 526
527
FIG. 3. HCV suppresses FoxO1 phosphorylation, leading to nuclear accumulation of FoxO1 528
(A) Quantitative RT-PCR analysis was performed to determine FoxO1 mRNA expression in 529
SGR- and FGR-harboring cells and HCV-infected cells (moi = 2) and normalized to β-530
glucuronidase mRNA expression levels. (B) The expression levels of FoxO1, phospho-531
FoxO1 (Ser319), Akt, and phospho-Akt (Ser473) were analyzed by immunoblotting in HCV-532
infected cells and mock-infected control cells. Blots were reprobed with antibodies 533
recognizing NS3 and GAPDH. The amounts of GAPDH were measured as an internal control 534
to verify equal amounts of sample loading. (C) Cytoplasmic and nuclear fractions were 535
prepared from HCV-infected cells and the mock-infected control at 4 dpi, and were analyzed 536
by immunoblotting using antibodies against FoxO1, phospho-FoxO1 (Ser319), NS3, Hsp60, 537
and Oct-1. The amounts of Hsp60 and Oct-1 were measured to verify that they were equal to 538
the amounts of cytoplasmic and nuclear fractions, respectively. 539
540
FIG. 4. HCV-induced JNK activation is required for the suppression of FoxO1 541
phosphorylation. (A) HCV activates the JNK/c-Jun signaling pathway. Activation 542
on May 20, 2018 by guest
http://jvi.asm.org/
Dow
nloaded from
30
(phosphorylation) of JNK (Thr183/Tyr185) and c-Jun (Ser63) in whole-cell lysates of HCV-543
infected cells and the mock-infected control was analyzed by immunoblotting. Blots were 544
reprobed with antibodies recognizing total JNK and c-Jun, NS3 and GAPDH. The amounts of 545
GAPDH were measured as an internal control to verify equal amounts of sample loading. (B) 546
Pretreatment with JNK inhibitor SP600125 abrogates HCV-induced c-Jun activation and 547
FoxO1 phosphorylation suppression. Phosphorylation of c-Jun (Ser63) and that of FoxO1 548
(Ser319) were analyzed by immunoblotting at 6 dpi in HCV-infected cells and the mock-549
infected control with or without SP600125 pretreatment (20 µM, 24 h). Blots were reprobed 550
with antibodies recognizing total c-Jun and FoxO1, NS3 and GAPDH. The amounts of 551
GAPDH were measured as an internal control to verify equal amounts of sample loading. 552
553
FIG. 5. HCV-induced production of mitochondrial ROS suppresses FoxO1 phosphorylation 554
through activation of JNK. (A) Pretreatment with NAC abrogates HCV-induced increased 555
production of mitochondrial ROS. HCV-infected cells and the mock-infected control were 556
pretreated with 5 mM NAC for 2 h at 6 dpi. The cell were then incubated with MitoSOX 557
(upper row) and then stained for HCV antigens by using an HCV-infected patient’s serum, 558
followed by FITC-conjugated goat anti-human IgG (bottom row). (B) Quantification of 559
MitoSOX-stained cells. The percentages of cells stained with MitoSOX were determined for 560
HCV-infected cells and the mock-infected control with or without NAC pretreatment. Data 561
on May 20, 2018 by guest
http://jvi.asm.org/
Dow
nloaded from

31
represent mean ± SEM of two independent experiments. *, P<0.01. (C) NAC pretreatment 562
abrogates HCV-induced JNK activation and FoxO1 phosphorylation suppression. 563
Phosphorylation of JNK (Thr183/Tyr185) and that of FoxO1 (Ser319) were analyzed by 564
immunoblotting at 6 dpi in HCV-infected cells and the mock-infected control with or without 565
NAC pretreatment (5 mM, 2h). The blots were reprobed with antibodies recognizing total 566
JNK and FoxO1, NS3 and GAPDH. The amounts of GAPDH were measured as an internal 567
control to verify equal amounts of sample loading. 568
569
FIG. 6. HCV-induced JNK activation and ROS production are involved in FoxO1 nuclear 570
accumulation and increased glucose production. (A) Subcellular localization of FoxO1 in 571
HCV-infected cells and the mock-infected control with or without a JNK inhibitor 572
(SP600125; 20 µM, 24 h) or an antioxidant (NAC; 5 mM, 2 h) pretreatment at 5 dpi was 573
examined by confocal microscopy. After fixation and permeabilization, the cells were 574
incubated with anti-FoxO1 rabbit monoclonal antibody followed by Alexa Fluor 488-575
conjugated goat anti-rabbit IgG (upper row), and with an HCV-infected patient’s serum 576
followed by Alexa Fluor 594-conjugated goat anti-human IgG (bottom row). (B) The 577
percentages of cells with FoxO1 nuclear localization were determined for HCV-infected cells 578
and the mock-infected control with or without SP600125 or NAC pretreatment. Data 579
represent mean ± SEM of two independent experiments. *, P<0.01. (C) Extracellular glucose 580
on May 20, 2018 by guest
http://jvi.asm.org/
Dow
nloaded from
32
production was measured in HCV-infected cells and the mock-infected control with or 581
without SP600125 or NAC pretreatment at 7 dpi, and normalized to total cellular protein 582
expression. Data represent mean ± SEM of two independent experiments and the value for 583
the control cells was arbitrarily expressed as 1.0. *, P<0.01. (D) Cellular expression levels of 584
NS3 in HCV-infected cells and the mock-infected control with or without sodium lactate (SL), 585
sodium pyruvate (SP), SP600125 or NAC are shown. The amounts of GAPDH were 586
measured as an internal control to verify equal amounts of sample loading. (E) Amounts of 587
HCV RNA were measured by quantitative RT-PCR analysis in HCV-infected cells treated 588
with SP600125 or NAC or left untreated at 6 dpi. The amounts were normalized to GAPDH 589
mRNA expression levels. Data represent mean ± SEM of two independent experiments, and 590
the value for the non-treated HCV-infected cells was arbitrarily expressed as 1.0. (F) Virus 591
infectivity in the culture supernatants of HCV-infected cells treated with SP600125 or NAC 592
or left untreated at 6 dpi was measured. Data represent mean ± SEM of two independent 593
experiments. CIU, cell-infecting units. 594
595
FIG. 7. HCV NS5A is involved in increased mRNA expression for G6Pase and PEPCK. 596
Huh7.5 cells were respectively transfected with the indicated HCV viral protein expression 597
plasmids. At 3 and 5 days post-transfection, quantitative RT-PCR analysis of mRNA for 598
G6Pase (A) and PEPCK (B) were conducted, and the results were normalized to β-599
on May 20, 2018 by guest
http://jvi.asm.org/
Dow
nloaded from

33
glucuronidase mRNA expression levels. Data represent mean ± SEM of three independent 600
experiments, and the values for the control cells were arbitrarily expressed as 1.0. *, P<0.01 601
compared with the control. (C) At 3 days post-transfection, the expression levels of each of 602
the HCV proteins were examined by immunoblot analysis using antibodies against c-Myc, 603
core, NS4A and GAPDH. The amounts of GAPDH served as an internal control to verify 604
equal amounts of sample loading. (D) NS5A and NS4A enhance PEPCK promoter activity. 605
NS5A and NS4A expression plasmids were each co-transfected with rPEPCK-P5(-1263)-606
pGL3basic or rPEPCK-P4(-998)-pGL3basic in Huh7.5 cells. At 48 h after transfection, the 607
PEPCK promoter activities were measured using a luciferase reporter assay. Data represent 608
mean ± SEM of three independent experiments, and the values for the control cells were 609
arbitrarily expressed as 1.0. *, P<0.05 compared with the control. 610
611
FIG. 8. HCV NS5A is involved in increased ROS production, JNK activation, FoxO1 612
phosphorylation suppression and FoxO1 nuclear accumulation. (A) NS5A promotes ROS 613
production. Huh-7.5 cells transfected with NS5A expression plasmid or the empty control 614
(vector) were incubated with MitoSOX (upper row) at 3 days post-transfection, and then 615
stained for NS5A by using anti-NS5A mouse monoclonal antibody, followed by FITC-616
conjugated goat anti-mouse IgG (bottom row). (B) Quantification of MitoSOX-stained cells. 617
The percentages of cells stained with MitoSOX were determined for NS5A-expressing cells 618
on May 20, 2018 by guest
http://jvi.asm.org/
Dow
nloaded from
34
and the control. Data represent mean ± SEM of two independent experiments. *, P<0.01. (C) 619
& (D) HCV NS5A activates c-Jun phosphorylation and suppresses FoxO1 phosphorylation. 620
Huh-7.5 cells transfected with the indicated HCV viral protein expression plasmids were 621
harvested at 3 days post-transfection, and the whole-cell lysates were subjected to 622
immunoblot analysis using antibodies against phospho-c-Jun (Ser63), c-Jun, phospho-FoxO1 623
(Ser319), FoxO1, GAPDH, and core, NS3, NS4A, NS5A (C) or and c-Myc (D). The amounts 624
of GAPDH were measured as an internal control to verify equal amounts of sample loading. 625
(E) NS5A facilitates FoxO1 nuclear accumulation. Huh-7.5 cells transfected with NS5A 626
expression plasmid or the empty control (vector) were fixed and permeabilized at 3 days 627
post-transfection. The cells were incubated with anti-FoxO1 rabbit monoclonal antibody 628
followed by Alexa Fluor 488-conjugated goat anti-rabbit IgG (upper row), or with anti-NS5A 629
mouse monoclonal antibody followed by Alexa Fluor 594-conjugated goat anti-mouse IgG 630
(bottom row). (F) The percentages of cells with nuclear localization of FoxO1 were 631
determined for NS5A-expressing cells and the control. Data represent mean ± SEM of two 632
independent experiments. *, P<0.01. 633
634
FIG. 9. HCV NS5A and NS4A enhance glucose production. (A) Huh7.5 cells were 635
transfected with either NS5A or NS4A expression plasmid. At 5 days post-transfection, 636
extracellular glucose production was measured and normalized to the total cellular protein 637
on May 20, 2018 by guest
http://jvi.asm.org/
Dow
nloaded from

35
expression. Data represent mean ± SEM of two independent experiments, and the values for 638
the control cells were arbitrarily expressed as 1.0. *, P<0.05 compared with the control. (B) 639
Cellular expression levels of NS4A and NS5A in the absence and presence of sodium lactate 640
(SL) and sodium pyruvate (SP) are shown. 641
642
FIG. 10. Schematic presentation of the HCV-dysregulated hepatic gluconeogenesis signaling 643
pathway. HCV induces mitochondrial dysfunction (14). This results in increased ROS 644
production and JNK activation, which induces the nuclear accumulation of FoxO1 by 645
reducing its phosphorylation status. Consequently, PEPCK and G6Pase gene expressions are 646
upreglulated, leading to upregulation of G6P and glucose production. NS5A plays a role in 647
HCV-induced gluconeogenesis via induction of ROS production. IRE, insulin response 648
element.649
on May 20, 2018 by guest
http://jvi.asm.org/
Dow
nloaded from
36
650
REFERENCES 651
652
1. Aguirre, V., T. Uchida, L. Yenush, R. Davis, and M. F. White. 2000. The c-Jun 653
NH(2)-terminal kinase promotes insulin resistance during association with insulin 654
receptor substrate-1 and phosphorylation of Ser(307). J. Biol. Chem. 275:9047-9054. 655
2. Alaei, M., and F. Negro. 2008. Hepatitis C virus and glucose and lipid metabolism. 656
Diabetes Metab. 34:692-700. 657
3. Aytug, S., D. Reich, L. E. Sapiro, D. Bernstein, and N. Begum. 2003. Impaired 658
IRS-1/PI3-kinase signaling in patients with HCV: a mechanism for increased 659
prevalence of type 2 diabetes. Hepatology 38:1384-1392. 660
4. Banerjee, A., K. Meyer, B. Mazumdar, R. B. Ray, and R. Ray. 2010. Hepatitis C 661
virus differentially modulates activation of forkhead transcription factors and insulin-662
induced metabolic gene expression. J. Virol. 84:5936-5946. 663
5. Baron, A. D., L. Schaeffer, P. Shragg, and O. G. Kolterman. 1987. Role of 664
hyperglucagonemia in maintenance of increased rates of hepatic glucose output in 665
type II diabetics. Diabetes 36:274-283. 666
6. Bennett, B. L., D. T. Sasaki, B. W. Murray, E. C. O'Leary, S. T. Sakata, W. Xu, J. 667
C. Leisten, A. Motiwala, S. Pierce, Y. Satoh, S. S. Bhagwat, A. M. Manning, and 668
D. W. Anderson. 2001. SP600125, an anthrapyrazolone inhibitor of Jun N-terminal 669
kinase. Proc. Natl. Acad. Sci. U. S. A. 98:13681-13686. 670
7. Blight, K. J., J. A. McKeating, and C. M. Rice. 2002. Highly permissive cell lines 671
for subgenomic and genomic hepatitis C virus RNA replication. J. Virol. 76:13001-672
13014. 673
8. Brunet, A., L. B. Sweeney, J. F. Sturgill, K. F. Chua, P. L. Greer, Y. Lin, H. Tran, 674
S. E. Ross, R. Mostoslavsky, H. Y. Cohen, L. S. Hu, H. L. Cheng, M. P. 675
Jedrychowski, S. P. Gygi, D. A. Sinclair, F. W. Alt, and M. E. Greenberg. 2004. 676
Stress-dependent regulation of FOXO transcription factors by the SIRT1 deacetylase. 677
Science 303:2011-2015. 678
9. Bungyoku, Y., I. Shoji, T. Makine, T. Adachi, K. Hayashida, M. Nagano-Fujii, Y. 679
H. Ide, L. Deng, and H. Hotta. 2009. Efficient production of infectious hepatitis C 680
virus with adaptive mutations in cultured hepatoma cells. J. Gen. Virol. 90:1681-1691. 681
10. Burdette, D., M. Olivarez, and G. Waris. 2010. Activation of transcription factor 682
Nrf2 by hepatitis C virus induces the cell-survival pathway. J. Gen. Virol. 91:681-690. 683
11. Caronia, S., K. Taylor, L. Pagliaro, C. Carr, U. Palazzo, J. Petrik, S. O'Rahilly, S. 684
Shore, B. D. Tom, and G. J. Alexander. 1999. Further evidence for an association 685
on May 20, 2018 by guest
http://jvi.asm.org/
Dow
nloaded from
37
between non-insulin-dependent diabetes mellitus and chronic hepatitis C virus 686
infection. Hepatology 30:1059-1063. 687
12. Choi, J., and J. H. Ou. 2006. Mechanisms of liver injury. III. Oxidative stress in the 688
pathogenesis of hepatitis C virus. Am. J. Physiol. Gastrointest. Liver Physiol. 689
290:G847-851. 690
13. Clore, J. N., J. Stillman, and H. Sugerman. 2000. Glucose-6-phosphatase flux in 691
vitro is increased in type 2 diabetes. Diabetes 49:969-974. 692
14. Deng, L., T. Adachi, K. Kitayama, Y. Bungyoku, S. Kitazawa, S. Ishido, I. Shoji, 693
and H. Hotta. 2008. Hepatitis C virus infection induces apoptosis through a Bax-694
triggered, mitochondrion-mediated, caspase 3-dependent pathway. J. Virol. 82:10375-695
10385. 696
15. Deng, L., M. Nagano-Fujii, M. Tanaka, Y. Nomura-Takigawa, M. Ikeda, N. Kato, 697
K. Sada, and H. Hotta. 2006. NS3 protein of Hepatitis C virus associates with the 698
tumour suppressor p53 and inhibits its function in an NS3 sequence-dependent 699
manner. J. Gen. Virol. 87:1703-1713. 700
16. Diamond, D. L., A. J. Syder, J. M. Jacobs, C. M. Sorensen, K. A. Walters, S. C. 701
Proll, J. E. McDermott, M. A. Gritsenko, Q. Zhang, R. Zhao, T. O. Metz, D. G. 702
Camp, 2nd, K. M. Waters, R. D. Smith, C. M. Rice, and M. G. Katze. 2010. 703
Temporal proteome and lipidome profiles reveal hepatitis C virus-associated 704
reprogramming of hepatocellular metabolism and bioenergetics. PLoS Pathog. 705
6:e1000719. 706
17. Dionisio, N., M. V. Garcia-Mediavilla, S. Sanchez-Campos, P. L. Majano, I. 707
Benedicto, J. A. Rosado, G. M. Salido, and J. Gonzalez-Gallego. 2009. Hepatitis C 708
virus NS5A and core proteins induce oxidative stress-mediated calcium signalling 709
alterations in hepatocytes. J. Hepatol. 50:872-882. 710
18. Doi, H., C. Apichartpiyakul, K. I. Ohba, M. Mizokami, and H. Hotta. 1996. 711
Hepatitis C virus (HCV) subtype prevalence in Chiang Mai, Thailand, and 712
identification of novel subtypes of HCV major type 6. J. Clin. Microbiol. 34:569-574. 713
19. Dunning, B. E., and J. E. Gerich. 2007. The role of alpha-cell dysregulation in 714
fasting and postprandial hyperglycemia in type 2 diabetes and therapeutic 715
implications. Endocr. Rev. 28:253-283. 716
20. Eslam, M., M. A. Khattab, and S. A. Harrison. 2011. Insulin resistance and 717
hepatitis C: an evolving story. Gut. 718
21. Essers, M. A., S. Weijzen, A. M. de Vries-Smits, I. Saarloos, N. D. de Ruiter, J. L. 719
Bos, and B. M. Burgering. 2004. FOXO transcription factor activation by oxidative 720
stress mediated by the small GTPase Ral and JNK. EMBO J. 23:4802-4812. 721
22. Franck, N., J. Le Seyec, C. Guguen-Guillouzo, and L. Erdtmann. 2005. Hepatitis 722
C virus NS2 protein is phosphorylated by the protein kinase CK2 and targeted for 723
degradation to the proteasome. J. Virol. 79:2700-2708. 724
on May 20, 2018 by guest
http://jvi.asm.org/
Dow
nloaded from
38
23. Galossi, A., R. Guarisco, L. Bellis, and C. Puoti. 2007. Extrahepatic manifestations 725
of chronic HCV infection. J. Gastrointestin. Liver Dis. 16:65-73. 726
24. Gottwein, J. M., T. K. Scheel, T. B. Jensen, J. B. Lademann, J. C. Prentoe, M. L. 727
Knudsen, A. M. Hoegh, and J. Bukh. 2009. Development and characterization of 728
hepatitis C virus genotype 1-7 cell culture systems: role of CD81 and scavenger 729
receptor class B type I and effect of antiviral drugs. Hepatology 49:364-377. 730
25. Gross, D. N., A. P. van den Heuvel, and M. J. Birnbaum. 2008. The role of FoxO 731
in the regulation of metabolism. Oncogene 27:2320-2336. 732
26. Hirota, K., J. Sakamaki, J. Ishida, Y. Shimamoto, S. Nishihara, N. Kodama, K. 733
Ohta, M. Yamamoto, K. Tanimoto, and A. Fukamizu. 2008. A combination of 734
HNF-4 and Foxo1 is required for reciprocal transcriptional regulation of glucokinase 735
and glucose-6-phosphatase genes in response to fasting and feeding. J. Biol. Chem. 736
283:32432-32441. 737
27. Hoehn, K. L., A. B. Salmon, C. Hohnen-Behrens, N. Turner, A. J. Hoy, G. J. 738
Maghzal, R. Stocker, H. Van Remmen, E. W. Kraegen, G. J. Cooney, A. R. 739
Richardson, and D. E. James. 2009. Insulin resistance is a cellular antioxidant 740
defense mechanism. Proc. Natl. Acad. Sci. U. S. A. 106:17787-17792. 741
28. Hotamisligil, G. S. 2005. Role of endoplasmic reticulum stress and c-Jun NH2-742
terminal kinase pathways in inflammation and origin of obesity and diabetes. Diabetes 743
54 Suppl 2:S73-78. 744
29. Houstis, N., E. D. Rosen, and E. S. Lander. 2006. Reactive oxygen species have a 745
causal role in multiple forms of insulin resistance. Nature 440:944-948. 746
30. Huang, H., and D. J. Tindall. 2007. Dynamic FoxO transcription factors. J. Cell Sci. 747
120:2479-2487. 748
31. Ikeda, M., K. Abe, H. Dansako, T. Nakamura, K. Naka, and N. Kato. 2005. 749
Efficient replication of a full-length hepatitis C virus genome, strain O, in cell culture, 750
and development of a luciferase reporter system. Biochem. Biophys. Res. Commun. 751
329:1350-1359. 752
32. Inubushi, S., M. Nagano-Fujii, K. Kitayama, M. Tanaka, C. An, H. Yokozaki, H. 753
Yamamura, H. Nuriya, M. Kohara, K. Sada, and H. Hotta. 2008. Hepatitis C virus 754
NS5A protein interacts with and negatively regulates the non-receptor protein tyrosine 755
kinase Syk. J. Gen. Virol. 89:1231-1242. 756
33. Iynedjian, P. B., P. R. Pilot, T. Nouspikel, J. L. Milburn, C. Quaade, S. Hughes, C. 757
Ucla, and C. B. Newgard. 1989. Differential expression and regulation of the 758
glucokinase gene in liver and islets of Langerhans. Proc. Natl. Acad. Sci. U. S. A. 759
86:7838-7842. 760
34. Joyce, M. A., K. A. Walters, S. E. Lamb, M. M. Yeh, L. F. Zhu, N. Kneteman, J. S. 761
Doyle, M. G. Katze, and D. L. Tyrrell. 2009. HCV induces oxidative and ER stress, 762
and sensitizes infected cells to apoptosis in SCID/Alb-uPA mice. PLoS Pathog. 763
on May 20, 2018 by guest
http://jvi.asm.org/
Dow
nloaded from

39
5:e1000291. 764
35. Kamata, H., S. Honda, S. Maeda, L. Chang, H. Hirata, and M. Karin. 2005. 765
Reactive oxygen species promote TNFalpha-induced death and sustained JNK 766
activation by inhibiting MAP kinase phosphatases. Cell 120:649-661. 767
36. Karpac, J., and H. Jasper. 2009. Insulin and JNK: optimizing metabolic homeostasis 768
and lifespan. Trends Endocrinol. Metab. 20:100-106. 769
37. Kasai, D., T. Adachi, L. Deng, M. Nagano-Fujii, K. Sada, M. Ikeda, N. Kato, Y. H. 770
Ide, I. Shoji, and H. Hotta. 2009. HCV replication suppresses cellular glucose 771
uptake through down-regulation of cell surface expression of glucose transporters. J. 772
Hepatol. 50:883-894. 773
38. Kops, G. J., and B. M. Burgering. 1999. Forkhead transcription factors: new insights 774
into protein kinase B (c-akt) signaling. J. Mol. Med. 77:656-665. 775
39. Lindenbach, B. D., M. J. Evans, A. J. Syder, B. Wolk, T. L. Tellinghuisen, C. C. 776
Liu, T. Maruyama, R. O. Hynes, D. R. Burton, J. A. McKeating, and C. M. Rice. 777
2005. Complete replication of hepatitis C virus in cell culture. Science 309:623-626. 778
40. Lindenbach, B. D., and C. M. Rice. 2005. Unravelling hepatitis C virus replication 779
from genome to function. Nature 436:933-938. 780
41. Lohmann, V., F. Korner, A. Dobierzewska, and R. Bartenschlager. 2001. 781
Mutations in hepatitis C virus RNAs conferring cell culture adaptation. J. Virol. 782
75:1437-1449. 783
42. Lowell, B. B., and G. I. Shulman. 2005. Mitochondrial dysfunction and type 2 784
diabetes. Science 307:384-387. 785
43. Mehta, S. H., F. L. Brancati, M. S. Sulkowski, S. A. Strathdee, M. Szklo, and D. L. 786
Thomas. 2000. Prevalence of type 2 diabetes mellitus among persons with hepatitis C 787
virus infection in the United States. Ann. Intern. Med. 133:592-599. 788
44. Mitsuyoshi, H., Y. Itoh, Y. Sumida, M. Minami, K. Yasui, T. Nakashima, and T. 789
Okanoue. 2008. Evidence of oxidative stress as a cofactor in the development of 790
insulin resistance in patients with chronic hepatitis C. Hepatol. Res. 38:348-353. 791
45. Miyamoto, H., K. Moriishi, K. Moriya, S. Murata, K. Tanaka, T. Suzuki, T. 792
Miyamura, K. Koike, and Y. Matsuura. 2007. Involvement of the PA28gamma-793
dependent pathway in insulin resistance induced by hepatitis C virus core protein. J. 794
Virol. 81:1727-1735. 795
46. Morino, K., K. F. Petersen, and G. I. Shulman. 2006. Molecular mechanisms of 796
insulin resistance in humans and their potential links with mitochondrial dysfunction. 797
Diabetes 55 Suppl 2:S9-S15. 798
47. Nomura-Takigawa, Y., M. Nagano-Fujii, L. Deng, S. Kitazawa, S. Ishido, K. Sada, 799
and H. Hotta. 2006. Non-structural protein 4A of Hepatitis C virus accumulates on 800
mitochondria and renders the cells prone to undergoing mitochondria-mediated 801
apoptosis. J. Gen. Virol. 87:1935-1945. 802
on May 20, 2018 by guest
http://jvi.asm.org/
Dow
nloaded from

40
48. Ozcan, U., Q. Cao, E. Yilmaz, A. H. Lee, N. N. Iwakoshi, E. Ozdelen, G. Tuncman, 803
C. Gorgun, L. H. Glimcher, and G. S. Hotamisligil. 2004. Endoplasmic reticulum 804
stress links obesity, insulin action, and type 2 diabetes. Science 306:457-461. 805
49. Park, K. J., S. H. Choi, D. H. Choi, J. M. Park, S. W. Yie, S. Y. Lee, and S. B. 806
Hwang. 2003. 1Hepatitis C virus NS5A protein modulates c-Jun N-terminal kinase 807
through interaction with tumor necrosis factor receptor-associated factor 2. J. Biol. 808
Chem. 278:30711-30718. 809
50. Puigserver, P., J. Rhee, J. Donovan, C. J. Walkey, J. C. Yoon, F. Oriente, Y. 810
Kitamura, J. Altomonte, H. Dong, D. Accili, and B. M. Spiegelman. 2003. Insulin-811
regulated hepatic gluconeogenesis through FOXO1-PGC-1alpha interaction. Nature 812
423:550-555. 813
51. Reed, K. E., and C. M. Rice. 2000. Overview of hepatitis C virus genome structure, 814
polyprotein processing, and protein properties. Curr. Top Microbiol. Immunol. 815
242:55-84. 816
52. Rozance, P. J., S. W. Limesand, J. S. Barry, L. D. Brown, S. R. Thorn, D. 817
LoTurco, T. R. Regnault, J. E. Friedman, and W. W. Hay, Jr. 2008. Chronic late-818
gestation hypoglycemia upregulates hepatic PEPCK associated with increased 819
PGC1alpha mRNA and phosphorylated CREB in fetal sheep. Am. J. Physiol. 820
Endocrinol. Metab. 294:E365-370. 821
53. Sale, E. M., and G. J. Sale. 2008. Protein kinase B: signalling roles and therapeutic 822
targeting. Cell Mol. Life Sci. 65:113-127. 823
54. Schmoll, D., K. S. Walker, D. R. Alessi, R. Grempler, A. Burchell, S. Guo, R. 824
Walther, and T. G. Unterman. 2000. Regulation of glucose-6-phosphatase gene 825
expression by protein kinase Balpha and the forkhead transcription factor FKHR. 826
Evidence for insulin response unit-dependent and -independent effects of insulin on 827
promoter activity. J. Biol. Chem. 275:36324-36333. 828
55. Sekine-Osajima, Y., N. Sakamoto, K. Mishima, M. Nakagawa, Y. Itsui, M. Tasaka, 829
Y. Nishimura-Sakurai, C. H. Chen, T. Kanai, K. Tsuchiya, T. Wakita, N. 830
Enomoto, and M. Watanabe. 2008. Development of plaque assays for hepatitis C 831
virus-JFH1 strain and isolation of mutants with enhanced cytopathogenicity and 832
replication capacity. Virology 371:71-85. 833
56. Seo, H. Y., M. K. Kim, A. K. Min, H. S. Kim, S. Y. Ryu, N. K. Kim, K. M. Lee, H. 834
J. Kim, H. S. Choi, K. U. Lee, K. G. Park, and I. K. Lee. 2010. Endoplasmic 835
reticulum stress-induced activation of activating transcription factor 6 decreases 836
cAMP-stimulated hepatic gluconeogenesis via inhibition of CREB. Endocrinology 837
151:561-568. 838
57. Shepard, C. W., L. Finelli, and M. J. Alter. 2005. Global epidemiology of hepatitis 839
C virus infection. Lancet Infect. Dis. 5:558-567. 840
58. Shintani, Y., H. Fujie, H. Miyoshi, T. Tsutsumi, K. Tsukamoto, S. Kimura, K. 841
on May 20, 2018 by guest
http://jvi.asm.org/
Dow
nloaded from

41
Moriya, and K. Koike. 2004. Hepatitis C virus infection and diabetes: direct 842
involvement of the virus in the development of insulin resistance. Gastroenterology 843
126:840-848. 844
59. Simmonds, P., J. Bukh, C. Combet, G. Deleage, N. Enomoto, S. Feinstone, P. 845
Halfon, G. Inchauspe, C. Kuiken, G. Maertens, M. Mizokami, D. G. Murphy, H. 846
Okamoto, J. M. Pawlotsky, F. Penin, E. Sablon, I. T. Shin, L. J. Stuyver, H. J. 847
Thiel, S. Viazov, A. J. Weiner, and A. Widell. 2005. Consensus proposals for a 848
unified system of nomenclature of hepatitis C virus genotypes. Hepatology 42:962-849
973. 850
60. Soga, T., R. Baran, M. Suematsu, Y. Ueno, S. Ikeda, T. Sakurakawa, Y. Kakazu, 851
T. Ishikawa, M. Robert, T. Nishioka, and M. Tomita. 2006. Differential 852
metabolomics reveals ophthalmic acid as an oxidative stress biomarker indicating 853
hepatic glutathione consumption. J. Biol. Chem. 281:16768-16776. 854
61. Soga, T., K. Igarashi, C. Ito, K. Mizobuchi, H. P. Zimmermann, and M. Tomita. 855
2009. Metabolomic profiling of anionic metabolites by capillary electrophoresis mass 856
spectrometry. Anal. Chem. 81:6165-6174. 857
62. Streeper, R. S., C. A. Svitek, S. Chapman, L. E. Greenbaum, R. Taub, and R. M. 858
O'Brien. 1997. A multicomponent insulin response sequence mediates a strong 859
repression of mouse glucose-6-phosphatase gene transcription by insulin. J. Biol. 860
Chem. 272:11698-11701. 861
63. Sunayama, J., F. Tsuruta, N. Masuyama, and Y. Gotoh. 2005. JNK antagonizes 862
Akt-mediated survival signals by phosphorylating 14-3-3. J. Cell Biol. 170:295-304. 863
64. Takashima, M., W. Ogawa, K. Hayashi, H. Inoue, S. Kinoshita, Y. Okamoto, H. 864
Sakaue, Y. Wataoka, A. Emi, Y. Senga, Y. Matsuki, E. Watanabe, R. Hiramatsu, 865
and M. Kasuga. 2010. Role of KLF15 in regulation of hepatic gluconeogenesis and 866
metformin action. Diabetes 59:1608-1615. 867
65. Tsuruta, F., J. Sunayama, Y. Mori, S. Hattori, S. Shimizu, Y. Tsujimoto, K. 868
Yoshioka, N. Masuyama, and Y. Gotoh. 2004. JNK promotes Bax translocation to 869
mitochondria through phosphorylation of 14-3-3 proteins. EMBO J. 23:1889-1899. 870
66. van der Horst, A., and B. M. Burgering. 2007. Stressing the role of FoxO proteins 871
in lifespan and disease. Nat. Rev. Mol. Cell Biol. 8:440-450. 872
67. van der Horst, A., A. M. de Vries-Smits, A. B. Brenkman, M. H. van Triest, N. 873
van den Broek, F. Colland, M. M. Maurice, and B. M. Burgering. 2006. FOXO4 874
transcriptional activity is regulated by monoubiquitination and USP7/HAUSP. Nat. 875
Cell Biol. 8:1064-1073. 876
68. Wang, A. G., D. S. Lee, H. B. Moon, J. M. Kim, K. H. Cho, S. H. Choi, H. L. Ha, 877
Y. H. Han, D. G. Kim, S. B. Hwang, and D. Y. Yu. 2009. Non-structural 5A protein 878
of hepatitis C virus induces a range of liver pathology in transgenic mice. J. Pathol. 879
219:253-262. 880
on May 20, 2018 by guest
http://jvi.asm.org/
Dow
nloaded from

42
69. Woodhouse, S. D., R. Narayan, S. Latham, S. Lee, R. Antrobus, B. Gangadharan, 881
S. Luo, G. P. Schroth, P. Klenerman, and N. Zitzmann. 2010. Transcriptome 882
sequencing, microarray, and proteomic analyses reveal cellular and metabolic impact 883
of hepatitis C virus infection in vitro. Hepatology 52:443-453. 884
70. Yoshida, K., T. Yamaguchi, T. Natsume, D. Kufe, and Y. Miki. 2005. JNK 885
phosphorylation of 14-3-3 proteins regulates nuclear targeting of c-Abl in the 886
apoptotic response to DNA damage. Nat. Cell Biol. 7:278-285. 887
71. Zhang, S., J. Liu, G. MacGibbon, M. Dragunow, and G. J. Cooper. 2002. 888
Increased expression and activation of c-Jun contributes to human amylin-induced 889
apoptosis in pancreatic islet beta-cells. J. Mol. Biol. 324:271-285. 890
72. Zhao, X., L. Gan, H. Pan, D. Kan, M. Majeski, S. A. Adam, and T. G. Unterman. 891
2004. Multiple elements regulate nuclear/cytoplasmic shuttling of FOXO1: 892
characterization of phosphorylation- and 14-3-3-dependent and -independent 893
mechanisms. Biochem. J. 378:839-849. 894
895
896
on May 20, 2018 by guest
http://jvi.asm.org/
Dow
nloaded from


![Hepatitis B virus and hepatitis C virus play different ... · alcoholic cirrhosis, hepatitis viruses, tobacco and metabolic diseases[4]. Hepatitis viruses, including hepatitis B virus](https://img.dokumen.tips/doc/110x75/60e46cab5bd9101a6f539e91/hepatitis-b-virus-and-hepatitis-c-virus-play-different-alcoholic-cirrhosis.jpg)