Embed Size (px)
Citation preview
1
Hepatitis B virus requires intact caveolin-1 function 1
for productive infection in HepaRG cells 2
3
Alina Macovei,1
Cristina Radulescu1
, Catalin Lazar,1
Stefana Petrescu1
, David 4
Durantel,2
Raymond A. Dwek, 3
Nicole Zitzmann,3
and Norica Branza Nichita 1*
5
1Institute of Biochemistry, Splaiul Independentei, 296, Sector 6, Bucharest 77700, 6
Romania
7
2Université de Lyon, IFR62 Lyon Est, Hospices Civils de Lyon, and
INSERM, U871, 8
151 Cours Albert Thomas, 69003 Lyon, France 9
3Oxford Glycobiology Institute, Department of Biochemistry, University of Oxford, 10
Oxford OX1 3QU, United Kingdom 11
12
*Corresponding author. Mailing address: Dr. Norica Branza- Nichita, Institute of 13
Biochemistry, Splaiul Independentei, 296, Sector 6, Bucharest 77700, Romania; 14
Tel: ++40 1 2239069 Fax: ++40 1 2239068 15
e-mail: [email protected] 16
17
18
Abstract word count: 246; text word count: 5686 19
20
21
22
Running title: Role of Cav-1 in HBV infection 23
24
Copyright © 2009, American Society for Microbiology and/or the Listed Authors/Institutions. All Rights Reserved.J. Virol. doi:10.1128/JVI.01207-09 JVI Accepts, published online ahead of print on 21 October 2009
on August 26, 2018 by guest
http://jvi.asm.org/
Dow
nloaded from

2
25
Abstract 26
Investigation of the entry pathways of Hepatitis B virus (HBV), a member of the 27
Hepadnaviridae family, has been hampered by the lack of versatile in vitro infectivity 28
models. Most concepts on hepadnaviral infection come from the more robust duck 29
hepatitis B virus (DHBV) system; however, whether or not the two viruses use the 30
same mechanisms to invade the target cells, is still a matter of controversy. In this 31
study, we investigated the role of an important plasma membrane component, 32
caveolin-1 (Cav-1), in HBV infection. Caveolins are the main structural components 33
of caveolae, plasma membrane microdomains enriched in cholesterol and 34
sphingolipids, which are involved in the endocytosis of numerous ligands and 35
complex signalling pathways within the cell. We used the HepaRG cell line 36
permissive to HBV infection to stably express dominant negative Cav-1 and dynamin-37
2 (Dyn-2), a GTP-ase involved in vesicle formation at the plasma membrane and 38
other organelles. The endocytic properties of the newly established cell lines, 39
designated HepaRG Cav-1
, HepaRG Cav-1∆1-81
, HepaRG Dyn-2
and HepaRG Dyn-2K44A
were 40
validated using specific markers for different entry routes. The cells maintained their 41
properties during cell culture, supported differentiation and were permissive for HBV 42
infection. The level of both, HBV transcripts and antigens was significantly decreased 43
in cells expressing the mutant proteins, while viral replication was not directly 44
affected. Chemical inhibitors that specifically inhibit the clathrin-mediated 45
endocytosis had no effect on HBV infection. We concluded that HBV requires a Cav-46
1-mediated entry pathway to initiate productive infection in HepaRG cells. 47
48
49
on August 26, 2018 by guest
http://jvi.asm.org/
Dow
nloaded from

3
Introduction 50
Hepatitis B virus (HBV) is a small enveloped DNA virus and member of the 51
Hepadnaviridae family. The viral envelope surrounding the partially double stranded 52
DNA genome consists of multiple copies of the viral surface transmembrane proteins 53
inserted into a lipid bilayer derived from the host cells (24). 54
The first steps of a virus life cycle involve receptor recognition and attachment to the 55
cell surface, followed by internalization of the virion or its components into the 56
cytoplasm, through either the plasma membrane, or the membrane of an endocytic 57
vesicle. Therefore, for many viruses, the lipid composition of both viral and cellular 58
target membranes is an important factor in the infection process (4, 26, 34).
59
For hepatitis B viruses, there is evidence suggesting that receptor-mediated 60
endocytosis is the mechanism of entry into the target cells; however, the molecular 61
details of this process are largely unknown (14). Recent studies have brought insights 62
into the role of cholesterol in hepadnaviral infection. Using chemical compounds that 63
either extract, or interfere with biosynthesis of this lipid, it was shown that cholesterol 64
depletion from host membranes does not affect internalization of duck hepatitis B 65
virus (DHBV), the avian member of hepadnaviruses. In contrast, cholesterol 66
extraction from the envelope of both DHBV and human HBV strongly reduces virus 67
infectivity, possibly interfering with its release from endosomes (6, 13). 68
A variety of potential cellular binding partners involved in viral entry has also been 69
reported in the last years for HBV and DHBV (14). Of the initial candidates, only 70
carboxypeptidase D could be confirmed to be essential for DHBV infection, but 71
intriguingly, not for HBV. This and other discrepancies observed between the two 72
viral models, such as the different response to bafilomycin A1 (Baf), an inhibitor of 73
vacuolar proton ATPases, often used to dissect intracellular trafficking, raise the 74
on August 26, 2018 by guest
http://jvi.asm.org/
Dow
nloaded from

4
important question as to whether or not HBV and DHBV use the same entry pathway 75
to infect hepatocytes (7).
76
In this study we addressed the role of another important plasma membrane 77
component, caveolin-1 (Cav-1), in HBV entry. Caveolins are the major components 78
of caveolae, highly structured membrane microdomains enriched in cholesterol and 79
sphingolipids, with a flask-shaped morphology (22). Multiple binding partners have 80
been reported for Cav-1, thus the assumption that the protein acts as a scaffolding 81
molecule, determining the cargo for caveolae-dependent endocytosis. In addition to 82
endocytosis, caveolins are involved in numerous other cellular processes, including 83
transcytosis of macromolecules, cholesterol homeostasis, and signal transduction; 84
however, their specific functions strictly depend on the host cells (10, 32). 85
To investigate the implication of caveolae in HBV internalization, we used the 86
HepaRG cell line which is permissive to HBV infection, to stably express mutant 87
variants with dominant negative functions of Cav-1 and dynamin-2 (Dyn-2), as 88
control. Dyn-2 is a mechanochemical GTPase involved in vesicle formation at the 89
plasma membrane, the trans-Golgi network, and various other intracellular organelles 90
(30). The GTPase activity is crucial in the final stage of vesicle scission membrane in 91
both, caveolae- and clathrin mediated entry pathways and expression of mutant 92
variants that have no enzymatic function, results in impaired cell endocytosis (16). 93
The newly established cell lines, designated HepaRG Cav-1
, HepaRG Cav-1∆1-81
, 94
HepaRG Dyn-2
and HepaRG Dyn-2K44A
, were successfully maintained in cell culture and 95
differentiated to allow infection with HBV. Since this process requires a long time in 96
tissue culture, the endocytic properties of the cells were periodically confirmed using 97
specific markers. The level of HBV transcripts and antigens was significantly reduced 98
in cells expressing the mutant proteins, while chemical inhibitors that specifically 99
on August 26, 2018 by guest
http://jvi.asm.org/
Dow
nloaded from
5
inhibit the clathrin-mediated endocytosis had no effect on HBV infection. In addition, 100
overexpression of the Cav-1 and Dyn-2 dominant negative proteins in HepG2.2.2.15 101
cells, stably transfected with the whole HBV genome, had no effect on HBV 102
replication. We therefore concluded that Cav-1 function is essential for HBV to 103
initiate productive infection in HepaRG cells. 104
Materials and Methods 105
1. DNA plasmids and cloning. Plasmids pEGFP-N1Dyn-2 and pEGFP-N1Dyn-106
2K44A expressing the wild-type and a GTPase defective mutant of dynamin-2 with 107
lysine 44 changed to alanine, respectively, were a kind gift from Dr. Mark McNieven, 108
Mayo Clinic, USA. Both dynamins are expressed as fusion proteins with Enhanced 109
Green Fluorescence Protein (EGFP), as described (9). The bicistronic plasmids 110
pCINeo/IRES-GFP/Cav-1 and pCINeo/IRES-GFP/Cav-1∆1-81, expressing the wild-111
type and a truncated form of caveolin-1 with dominant negative function, were a kind 112
gift from Prof. Jan Eggermont, Catholic University of Leuven, Belgium. Both 113
plasmids also express the Green Fluorescent Protein (GFP), as described (36). 114
Plasmids pEGFP-N1 Dyn-2 and pEGFP-N1 Dyn-2 K44A were cut with Hind III and 115
Not I (Promega) and the DNA fragments were inserted into pLNCX2 retroviral vector 116
(Clontech), resulting the plasmids pLNCX2- EGFP-Dyn-2 and pLNCX2- EGFP-Dyn-117
2K44A. 118
Plasmids pCINeo/IRES-GFP/Cav-1 and pCINeo/IRES-GFP/Cav-1∆1-81 were used 119
as Polymerase Chain Reaction (PCR) templates to amplify the sequences coding for 120
IRES-GFP/Cav-1 and IRES-GFP/Cav-1∆1-81, using primers containing Not I and 121
Bgl II sites. The amplified DNA fragments were inserted into pLNCX2, resulting the 122
plasmids pLNCX2/IRES-GFP/Cav-1 and pLNCX2/IRES-GFP/Cav-1∆1-81. 123
on August 26, 2018 by guest
http://jvi.asm.org/
Dow
nloaded from
6
2. Generation of HepaRG cell lines stably expressing the wild-type and dominant 124
negative mutants of Dyn-2 and Cav-1. Plasmids pLNCX2- EGFP-Dyn-2, pLNCX2- 125
EGFP-Dyn-2K44A, pLNCX2-Cav-1-IRES-GFP and pLNCX2- Cav-1∆1-81-IRES-126
GFP were independently used to transfect the RetroPack PT67 cell line using the 127
Retroviral Gene Transfer and Expression system protocols (Clontech). Retrovirus-128
containing medium from PT67 cell lines stably expressing the wild-type and dominant 129
negative variants of Dyn-2 and Cav-1 were further used to infect the HepaRG cells. 130
Briefly, the cells were seeded at 60-80% confluence in 25 cm2 flasks and grown in D-131
MEM medium (Gibco) supplemented with 10% foetal bovine serum (FCS), 100 132
units/ml penicillin, 100 µg/ml streptomycin and 4mM GlutaMAX. Cell medium was 133
harvested 24 hours later, cleared by centrifugation at 500xg for 10 minutes and passed 134
through a 0.45 µm cellulose acetate filter. HepaRG cells were seeded into 6-well 135
plates and grown in William’s E medium (Gibco) supplemented with 10% FCS, 50 136
units/ ml penicillin, 50 µg/ ml streptomycin, 2mM GlutaMAX, 5 µg/ ml insulin, and 5 137
x 105 M hydrocortisone hemisuccinate, as described (15). The next day, cells were 138
infected with 3 ml of virus-containing medium, in the presence of 8 µg /ml polybren. 139
The medium was changed 24 hours later and infection was repeated 3 times, at 48 140
hours intervals. HepaRG colonies stably expressing wild-type and mutant Dyn-2 141
(HepaRGDyn-2
and HepaRGDyn-2K44A
) or wild-type and mutant Cav-1 (HepaRGCav-1
and 142
HepaRGCav-1∆1-81
) were selected under G418 treatment (600µg/ml). The colonies were 143
further expanded and recombinant protein expression was confirmed by monitoring 144
EGFP or GFP expression under the UV light microscope. Following stabilisation, the 145
new cell lines were maintained in William’s medium containing 200 µg /ml G418. 146
3. Sodium dodecyl sulfate-polyacrylamide gel electrophoresis (SDS-PAGE) and 147
Western blotting. All cell lines taken into the study were lysed in a buffer containing 148
on August 26, 2018 by guest
http://jvi.asm.org/
Dow
nloaded from
7
2 % SDS, 5 mM DTT, 50 mM Tris-Cl (pH 7.5), 150 mM NaCl, 2 mM EDTA (SDS- 149
TSE buffer), and a mixture of protease inhibitors (Sigma), by boiling for 15 minutes, 150
to extract both soluble and raft-associated membrane proteins. Cell lysates were 151
clarified by centrifugation at 10,000xg for 15 minutes. The proteins in the supernatant 152
were quantified using the BCA method (Pierce) and equal amounts were loaded on 153
SDS-PAGE. The proteins were transferred to nitrocellulose membranes using a semi-154
dry blotter (Millipore). The blots were incubated with either goat anti-Dyn-2 (Santa 155
Cruz Biotechnology, dilution 1/1000) or rabbit anti–Cav-1 (Cell Signaling 156
Technology, dilution 1/1000) antibodies (Ab), followed by donkey anti-goat (Santa 157
Cruz Biotechnology, dilution 1/2000) or goat anti-rabbit horseradish peroxidase 158
(HRP) Ab (Pierce, dilution 1/1000). When actin or calnexin expression was used as 159
loading control, the blots were incubated with either mouse monoclonal antibodies 160
(mAb) against β-actin (Abcam, dilution 1/500) or rabbit anti-calnexin Ab (Santa Cruz 161
Biotechnology, dilution 1/4000), followed by goat anti-mouse/rabbit HRP Ab 162
(Amersham, dilution 1/1000). The proteins were detected using an enhanced 163
chemiluminiscence (ECL) detection system (Amersham) according to the 164
manufacturer’s instructions. 165
4. Fluorescence microscopy. HepaRG, HepaRGDyn-2
, HepaRGDyn-2K44A
, HepaRGCav-1
166
and HepaRGCav-1∆1-81
cells were split every 3 days and maintained in culture for 6 167
weeks, the average time required to perform the HBV infectivity tests. For 168
internalization experiments, cells were plated in 4-well chamber slides (Nunc) at 25-169
30% confluence. The cells were washed the next day with ice-cold phosphate buffered 170
saline (PBS) followed by incubation with either human Transferrin (hTfn)-Alexa 171
Fluor 594 or Cholera Toxin subunit B (CTB)- Alexa Fluor 594 (at concentrations 172
indicated in the figure legends), for 30 minutes, at 4°C. When the effect of cholesterol 173
on August 26, 2018 by guest
http://jvi.asm.org/
Dow
nloaded from
8
depleting agents on CTB internalization was tested, 10 mM methyl-β-cyclodextrin 174
(MβCD) was added 30 minutes before CTB treatment and maintained throughout the 175
experiment. The medium containing the fluorescent markers was removed, and cells 176
were washed 3 times with PBS, followed by 2h incubation at 37°C. Cells were then 177
fixed with 4% paraformaldehyde, washed 3 times with PBS and mounted with 178
Vectashield Mounting Medium (Vector Laboratories), containing DAPI to visualise 179
the nuclei. Cells were analyzed under a Nikon Eclipse E600 microscope, using a 40 x 180
objective. 181
5. Spectrofluorimetry. Internalization of CTB and hTfn in HepaRGDyn-2
, HepaRGDyn-
182
2K44A, HepaRG
Cav-1 and HepaRG
Cav-1∆1-81cell lines was also analysed in a quantitative 183
manner, at differentiated state. Cells were seeded in collagen 12-well plates and 184
differentiated as described before, with minor modifications (15). Briefly, the cells 185
were maintained for 2 weeks in William’s complete medium, supplemented with 200 186
µg/ ml G418, followed by 2 weeks in the same medium containing 1.8 % DMSO. 187
CTB and hTfn internalization assay was performed as above, except that cell 188
monolayers were first disrupted and cells were replated at 70-80% confluence before 189
incubation with either of the two ligands. This step was required to increase the cell 190
uptake of the ligands, a process which occurs with very low efficiency in confluent 191
cells. In control experiments, cells were pretreated with either 10 mM MβCD or 10 192
mg/ml chlorpromazine (Cpz) and the inhibitors were maintained during ligand 193
internalization, for 30 minutes. After washing with PBS, cells were lysed in Chaps–194
HSE buffer (2 % Chaps {3-[(3-chloramidopropyl)-dimethylammonio]-1-195
propanesulfonate} in 50mM Hepes (pH 7.5) – 200mM NaCl– 2mM EDTA). The 196
amount of fluorescent markers released
into the cell lysates was quantified by 197
spectrofluorometry (Jasco FP-6500, 590 nm excitation/ 617 nm emission 198
on August 26, 2018 by guest
http://jvi.asm.org/
Dow
nloaded from
9
wavelengths) and normalized to the total cell protein levels. Lysates of cells not 199
incubated with the two fluorescent markers were used as blanks. 200
6. HBV preparation from cell supernatants. HepG2 2.2.15 cells stably transfected 201
with two copies of the HBV genome were grown in RPMI 1640 medium (Euroclone) 202
containing 10% foetal bovine serum, 50 units/ml penicillin, 50 µg/ml streptomycin, 203
2mM GlutaMAX and 200 µg/ml of G418 (Gibco). Cell supernatants were collected 204
every 3 days and clarified from cell debris by a brief centrifugation at 2,000 x g. Virus 205
particles were pelleted by ultracentrifugation through a 20% sucrose cushion in a SW 206
41 Ti Beckman rotor at 36,000 rpm, for 4 hours. The pellet was resuspended in PBS 207
and virus concentration was determined by real time PCR, using serial dilutions of 208
known amounts of a pTriExHBV1.1 vector as standard curve. 209
7. Infection of HepaRG cell lines and inhibitor treatment. The HepaRG, 210
HepaRGDyn-2
, HepaRGDyn-2K44A
, HepaRGCav-1
and HepaRGCav-1∆1-81
cell lines were 211
seeded in collagen 6-well plates at 80% confluence and differentiated as described 212
(15, 16). The differentiated cells were infected with 50 µl of concentrated HBV 213
containing 1 x 10⁸ genome equivalents (gEq). When the effect of chemical inhibitors 214
on HBV endocytosis was investigated, cells were incubated with medium containing 215
25 µg/ ml nystatin (Ny), 10 mM MβCD, 50 mM NH4Cl, 200 nM Baf, 10 mg/ml Cpz, 216
or 50 µg/ ml genistein (Gen), for 2 hours prior to HBV infection. The drugs were 217
either removed when the viral inoculum was added to the cells (Ny and MβCD), or 218
maintained throughout infection (NH4Cl, Baf, Cpz and Gen). Sixteen hours post-219
infection (pi) the cells were extensively washed with PBS and further incubated with 220
medium supplemented with 1.8% DMSO for the time indicated in the figure legends. 221
on August 26, 2018 by guest
http://jvi.asm.org/
Dow
nloaded from
10
Infected cells were harvested and HBV-specific RNA and antigens were quantified by 222
reverse-transcription (RT) real-time PCR and ELISA. 223
8. RT-PCR. Total RNA was isolated from the HepaRG, HepaRGDyn-2
, HepaRGDyn-
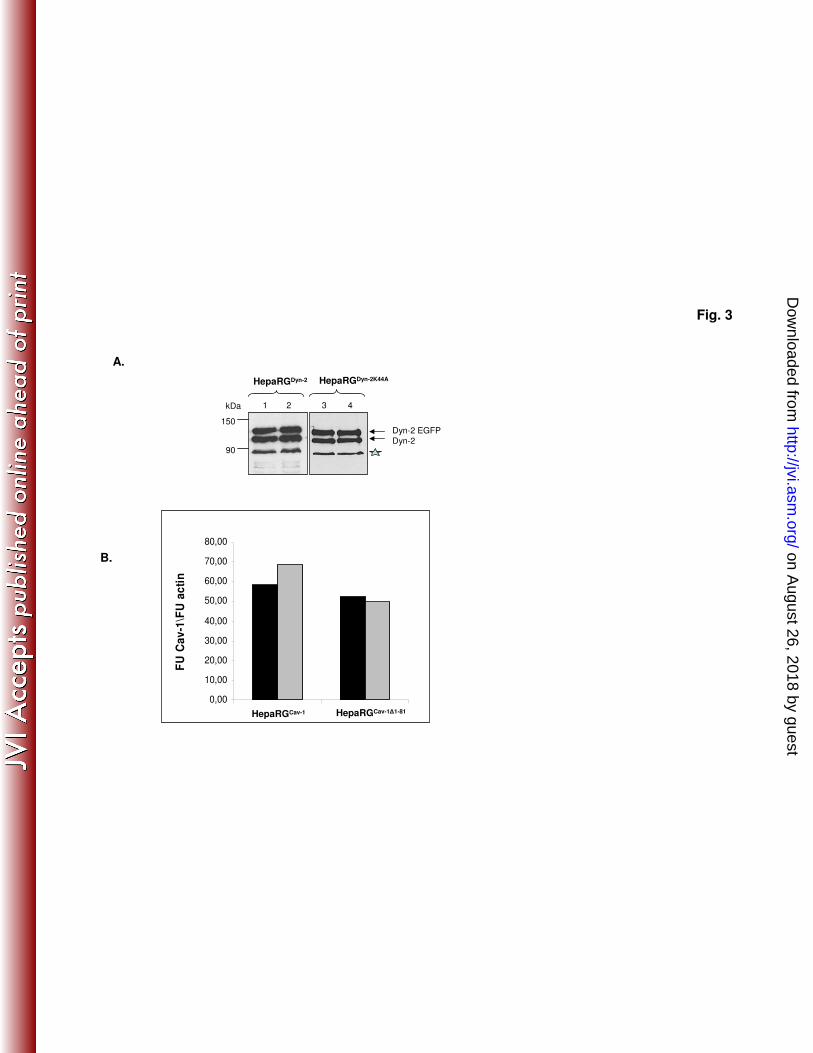
224
2K44A, HepaRG
Cav-1 and HepaRG
Cav-1∆1-81cell lines using the RNeasy mini kit (Qiagen) 225
and serially diluted. To discriminate between endogenous and either wild-type or 226
dominant negative overexpressed Cav-1, different set of primers were used: a) Cav-227
1FL pair, to amplify the full length of both endogenous and overexpressed Cav-1 (534 228
base pairs, bp), b) Cav-1WT pair, to amplify the full length the overexpressed Cav-1 229
only (554 bp) and c) Cav-1DN pair, to amplify the full length of Cav-1∆1-81 and a 230
220 bp of the overexpressed Cav-1 (Supporting table 1). The specificity of Cav-1 231
primers was first confirmed in a standard RT-PCR reaction using the One step RT-232
PCR system (Qiagen). The serially diluted RNA samples were further analysed using 233
the same procedure. Amplified samples were visualised in 1% agarose gel using 234
ethidium bromide staining. The DNA bands corresponding to each serial dilution 235
were quantified using the Quality One software (BioRad). The values obtained were 236
standardized against an internal β-actin control (Supporting table 1) and expressed as 237
percentage of Cav-1 expression from parental HepaRG cells. 238
9. RT-real-time PCR. Total RNA from control or HBV-infected cells was isolated 239
using RNeasy mini kit (Qiagen) viral replication. The RNA was quantified using a 240
Corbett Rotor Gene 6000 real-time PCR system and the SensiMix One-Step Kit 241
(Quantance). Primers were designed to amplify a 279 bp HBV-specific fragment 242
(Supporting table 1). For viral quantification, a calibration curve containing known 243
amounts of HBV was used. The values obtained were standardized against an internal 244
β-actin control (Supporting table 1). Endogenous Cav-1 expression during 245
differentiation of the HepaRG cells was also monitored using the Cav-1FL primers. 246
on August 26, 2018 by guest
http://jvi.asm.org/
Dow
nloaded from

11
10. Quantification of intracellular HBV antigen expression by ELISA. HBV-247
infected HepaRG cells were lysed in TSE buffer containing 0.5% Triton X-100, for 1 248
hour, on ice. Lysates were clarified by centrifugation at 10,000xg for 15 minutes. The 249
protein content in the supernatant was determined using the BCA method. The sample 250
volumes were adjusted to equal amounts of total protein and the level of HBsAg 251
expression was determined using the Monolisa HBs Ag Ultra kit (Bio-Rad), according 252
to the manufacturer’s instruction. Results were obtained as ratios of signal to cut-off 253
and were converted to percentage of HBsAg expression. 254
11. Cell transfection and quantification of HBV replication and secretion. 255
Plasmids pLNCX2- EGFP-Dyn-2, pLNCX2- EGFP-Dyn-2K44A, pLNCX2-Cav-1-256
IRES-GFP and pLNCX2- Cav-1∆1-81-IRES-GFP were used to transfect the HepG2 257
2.2.15 cell monolayers twice, at 24 h interval, using the Fugene 6 transfection reagent 258
(Roche), following the manufacturer’s protocols. The transfection rate was estimated 259
to be about 40%, based on the number of GFP/EGFP expressing cells counted under 260
the microscope. Both cells and supernatants were collected at 24 h post-second 261
transfection. Encapsidated viral DNA was purified by phenol-chloroform extraction 262
from transfected cells as described previously (17) and real time PCR was performed 263
using the SensiMix Plus Kit (Quantance) and the same primers as for the RT-real time 264
PCR described above. Secretion of HBsAg was determined in cell supernatants 265
following centrifugation for 5 minutes at 2000 x g, by using the Monolisa HBs Ag 266
Ultra kit, as above. 267
In a parallel experiment, proliferating HepaRGDyn-2
, HepaRGDyn-2K44A
, HepaRGCav-1
268
and HepaRG Cav-1∆1-81
cells were transfected with pTriExHBV 1.1. The plasmid 269
contains 1.1 units of the whole HBV genome cloned into Not I and Sph I sites and is 270
able to support viral replication, assembly and secretion of fully infectious virions 271
on August 26, 2018 by guest
http://jvi.asm.org/
Dow
nloaded from

12
(our unpublished data). Transfected cells were maintained in culture for 7 days to 272
allow accumulation of mature virions. The amount of virus produced in each cell line 273
was further quantified as described for the HepG2.2.2.15 cells. 274
Results 275
Biochemical characterization of HepaRG cell lines overexpressing wild-type and 276
dominant-negative Cav-1 and Dyn-2. Caveolae-dependent endocytosis is 277
characterised by its dependence on functional caveolin, and sensitivity to dynamin 278
inhibition and cholesterol depletion. To investigate the role of caveolae in the HBV 279
entry pathway, HepaRG cell lines stably expressing wild-type Cav-1 (HepaRGCav-1
), 280
N-terminally-truncated Cav-1 (HepaRGCav-1∆1-81
), wild-type Dyn-2 (HepaRGDyn-2
) and 281
mutant Dyn-2 with no GTP-ase activity (HepaRGDyn-2K44A
), were established. Since 282
few or no caveolae are present in cell lines in which Cav-1 expression is reduced or 283
absent (12), the level of endogenous Cav-1 and Dyn-2 were first determined by 284
Western blotting in the parental HepaRG cells at both, non-differentiated (ND) and 285
differentiated (D) state. As shown in Fig 1A, Cav-1 and Dyn-2 were synthesized in 286
detectable amounts in HepaRG cells and their expression level was not significantly 287
altered during the 4 weeks of differentiation. Interestingly, a transient increase in Cav-288
1 expression was observed in HepaRG cells during HBV infection, while Dyn-2 289
expression did not change. This could be due to a better susceptibility of Cav-1 to 290
detergent extraction, as a result of virus binding to the plasma membrane and further 291
internalization. A direct comparison of Cav-1 expression in HepaRG and epithelial 292
cells such as HeLa and MDBK, which are well known for their ability to form 293
caveolae, showed that the highest level was synthesized in HepaRG cells (Fig. 1B), 294
while another hepatoma derived cell line, Huh7, completely lacked Cav-1 expression 295
(35). Although not a direct proof that Cav-1 is expressed in caveolae in HepaRG cells, 296
on August 26, 2018 by guest
http://jvi.asm.org/
Dow
nloaded from

13
the important amount of the protein available in these cells and its transient increase 297
during HBV infection are indications for a role in this process. 298
A similar Western blotting experiment was performed to analyze the endogenous and 299
overexpressed Dyn-2, in HepaRGDyn-2
, HepaRGDyn-2K44A
, HepaRGCav-1
, HepaRGCav-
300
1∆1-81 lines, compared to parental HepaRG cells (Fig. 2A). As expected, in addition to 301
the endogenous Dyn-2, an upper band with the apparent electrophoretic mobility of 302
EGFP-fused Dyn-2 was identified in both HepaRGDyn-2
(Dyn-2-EGFP) and 303
HepaRGDyn-2K44A
(Dyn-2K44A-EGFP) cells. The expression level of the fused protein 304
was comparable to that of the endogenous Dyn-2 in parental HepaRG as well as 305
HepaRGCav-1
and HepaRGCav-1∆1-81
cell lines, suggesting similar turnover rates. A 306
slight increase of the intensity of the band corresponding to the endogenous Dyn-2 307
was observed in HepaRG cells overexpressing both wild-type and dominant negative 308
Dyn-2. This could be the result of a partial cleavage of EGFP from the recombinant 309
protein, rather than of compensatory mechanisms activated in cells expressing GTP-310
ase deficient Dyn-2 (Fig. 2A). The ratio between endogenous and recombinant wild-311
type and mutant Dyn-2 was maintained throughout differentiation of HepaRG cells, 312
demonstrating the stability of the cell lines (Fig. 3A). 313
Cav-1 antibodies used in this study recognize the endogenous as well as the 314
overexpressed wild-type Cav-1, but not the mutant variant lacking the 81 amino acid 315
fragment of the N-terminal part (Fig. 1A, and data not shown). Therefore, a PCR 316
approach was taken to investigate Cav-1 expression. Specific oligonucleotides were 317
designed to discriminate between endogenous and overexpressed wild-type Cav-1, on 318
one hand, and Cav-1∆1-81, on the other hand. The specificity of the primers was 319
confirmed by standard RT-PCR (Fig. 2B), and the presence of Cav-1 and β-actin 320
transcripts, was further analysed by semiquantitative RT-PCR in all HepaRG cell 321
on August 26, 2018 by guest
http://jvi.asm.org/
Dow
nloaded from

14
lines (Fig. 2C). The endogenous Cav-1 transcripts were expressed at comparable 322
levels in all cell lines, regardless whether they also expressed wild-type or dominant 323
negative Dyn-2/Cav-1. Similar to Dyn-2, Cav-1 expression did not change 324
significantly throughout differentiation of HepaRG cells, as demonstrated by RT- real 325
time PCR using the Cav-1-FL primers, in an independent experiment (Fig. 3B). 326
Altogether, the results show that the HepaRGDyn-2
, HepaRGDyn-2K44A
, HepaRGCav-1
, 327
HepaRGCav-1∆1-81
can support differentiation and can be further used as models to 328
investigate HBV entry. 329
Endocytic properties of HepaRG cell lines overexpressing wild-type and 330
dominant negative Cav-1. To validate the effect of dominant negative Cav-1 331
expression on internalization properties of the HepaRG cells, CTB uptake was 332
monitored by fluorescence microscopy. Owing to its targeting to caveolae through the 333
ganglioside GM1 receptor, CTB has been largely used as a marker for caveolin-334
dependent endocytosis in many cells (20). In both, HepaRG and HepaRGCav-1
cell 335
lines, fluorescently-labeled CTB (red) was readily internalized and concentrated 336
around the cell nucleus, a pattern described for other cell lines (Fig. 4A and B) (29). 337
In contrast, CTB was poorly endocytosed in HepaRGCav-1∆1-81
cells, as fluorescence 338
appeared mainly diffuse in the cytoplasm and also decorating the cell plasma 339
membrane (Fig. 4D). The green, diffuse fluorescence present in both HepaRGCav-1
and
340
HepaRGCav-1∆1-81
cells is due to the cytoplasmic localization of GFP, expressed along 341
with Cav-1 from the bicistronic, retroviral plasmid. Despite the large amount of 342
internalized CTB, no co-localization with GFP was observed, confirming the specific 343
uptake of the toxin through vesicles of the endocytic pathway. 344
It has been previously shown that caveolae-mediated uptake of CTB is strongly 345
affected by sterol-binding compounds (19). Thus, to further characterize the endocytic 346
on August 26, 2018 by guest
http://jvi.asm.org/
Dow
nloaded from
15
properties of HepaRGCav-1
and HepaRGCav-1∆1-81
cells and their response to altered 347
levels of plasma membrane cholesterol, CTB internalization was also studied in the 348
presence of 10 mM MβCD. As shown in Fig. 4C, CTB entry in MβCD–treated 349
HepaRG Cav-1
cells was similar to that observed in untreated HepaRGCav-1∆1-81
. CTB 350
fluorescence was barely visible at plasma membrane of MβCD–treated HepaRGCav-
351
1∆1-81 cells demonstrating a strong inhibition of entry when both cholesterol level and 352
Cav-1 function are perturbed (Fig. 4E). Inhibition of CTB entry in HepaRGCav-1∆1-
353
81cells also showed that expression of dominant negative Cav-1 was not compensated 354
by upregulating other, non-caveolae-mediated pathways that CTB could use as 355
alternatives to enter the cells. To rule out a potential general inhibitory effect on cell 356
endocytosis when expressing mutant Cav-1, internalization of hTfn -a well-357
characterized marker for clathrin-dependent receptor-mediated entry was investigated 358
in addition to that of CTB (27). As shown in Fig. 4 F and G, hTfn was taken up at 359
similar levels by both, HepaRGCav-1
and HepaRGCav-1∆1-81
, confirming the specificity 360
of the dominant negative Cav-1 in perturbing the caveolae-dependent entry. Using a 361
spectrofluorimetric approach, the uptake of both endocitic markers was further 362
investigated in these cell lines, in a quantitative manner. The results shown in Fig. 6A 363
confirmed the efficiency of Cav-1∆1-81 expression to alter the caveolae-mediated 364
pathway (60% inhibition of CTB internalization), while hTfn entry was not affected 365
(Fig. 6B). 366
Endocytic properties of HepaRG cell lines overexpressing wild-type and 367
dominant negative Dyn-2. Dynamins are important regulators of both, caveolae- and 368
clathrin-mediated endocytosis, as well as other non-caveolae-, non-clathrin-dependent 369
entry pathways (8, 16). The GTPase-deficient Dyn-2 (Dyn-2K44A) has been the 370
mutant of choice to study the role of these pathways in many different membrane-371
on August 26, 2018 by guest
http://jvi.asm.org/
Dow
nloaded from

16
traffic events, including virus entry into target cells (31). To define the effect of wild-372
type and mutant Dyn-2 expression on cell endocytosis, internalization of hTfn and 373
CTB was investigated, as described above. The green, punctuate fluorescence in 374
HepaRGDyn-2
and HepaRGDyn-2K44A
cells was the result of EGFP expression as a 375
fusion protein with either Dyn-2 or Dyn-2K44A. The dominant negative Dyn-2 376
efficiently reduced CTB entry in HepaRGDyn-2K44A
(Fig. 5B) and almost completely 377
inhibited uptake of hTfn, which mostly remained attached to the plasma membrane 378
(Fig. 5G, H). This indicated that in this cell line non-clathrin-, non-caveolae-mediated 379
pathways were either not upregulated in compensation for the perturbed entry routes, 380
or not used by the two endocytic markers. In contrast, overexpression of wild-type 381
Dyn-2 did not have any effect on entry of either CTB (Fig. 5A) or hTfn (Fig. 5E and 382
F). The fluorescence level of both endocytic markers in HepaRGDyn-2
cells was similar 383
to that found in parental HepaRG cells (Fig. 4A, 5C and D). Similar to Cav-1 384
expressing cell lines, the amount of CTB and hTfn taken up by these cells was 385
measured by spectrofluorimetry, in the absence or the presence of a clathrin coat 386
assembly inhibitor, Cpz. Interestingly, a similar inhibitory effect, of about 58 %, was 387
observed for both CTB and hTfn entry in HepaRGDyn-2K44A
, as compared to the wild-388
type Dyn-2 expressing cells (Fig. 6 A and B). This inhibition is close to that obtained 389
for hTfn in the presence of Cpz (67%) confirming the Dyn-2K44A ability to disrupt 390
the clathrin-mediated endocytosis in these cells. 391
HBV infection in HepaRGCav-1
, HepaRGCav-1∆1-81
, HepaRGDyn-2
and HepaRGDyn-
392
2K44A cell lines. Having characterized the endocytic properties of the newly 393
established HepaRG cells, we next assayed the ability of HBV to initiate productive 394
infection in these cells. Prior to virus infection, all cell lines were differentiated in 6-395
well collagen-coated plates, as described (17). The cells were successfully maintained 396
on August 26, 2018 by guest
http://jvi.asm.org/
Dow
nloaded from

17
in culture during differentiation, regardless of whether they overexpressed wild-type 397
or dominant negative Cav-1 or Dyn-2 and their morphology was similar to that of the 398
parental HepaRG cells (data not shown). The virus purified from the HepG2.2.2.15 399
cell supernatants was quantified and equal amounts were used for infection of the cell 400
lines. Chemical inhibitors of both, clathrin- and caveolae-mediate endocytosis (31) 401
were also included in independent experiments, as controls. The synthesis of HBV-402
specific transcripts and proteins was quantified by RT real-time PCR and ELISA, 403
respectively, at 11 days pi. To rule out any potential interference with HBV 404
replication of either GFP/EGFP expression or other factors resulting from the 405
retroviral infection of the parental HepaRG cells, the wild-type expressing Cav-1 or 406
Dyn-2 cells were used as controls for their dominant negative counterparts expressing 407
cells. The RT real-time PCR results showed a strong inhibition (75%), of HBV 408
infection in HepaRGCav-1∆1-81
, compared to HepaRGCav-1
, while a more moderate 409
effect (about 52 %) was obtained in HepaRGDyn-2K44A
, compared to HepaRGDyn-2
(Fig. 410
7A). 411
HBV infection was only slightly affected (35% inhibition) when Ny and MβCD 412
where used to decrease the cholesterol level in the parental HepaRG cells (Fig. 5B). 413
For these drugs, the treatment was discontinued prior to HBV infection, to avoid 414
alteration of the viral envelope which is sensitive to cholesterol depleting reagents (6). 415
Thus, the short time of cell exposure to the drugs, accompanied by the complete 416
reversibility of their effect upon removal may explain the attenuated consequences on 417
viral infection, as compared to the strong effect observed in HepaRGCav-1∆1-81
cells 418
(25). A similar effect on HBV infection was obtained in the presence of Gen, an 419
inhibitor of tyrosine kinases involved in caveolae-mediated endocytosis (21). In this 420
case the cells were treated with the drug throughout infection; however a moderate 421
on August 26, 2018 by guest
http://jvi.asm.org/
Dow
nloaded from
18
concentration (50 µg/ ml) was used to avoid cellular toxicity due to prolonged 422
incubation (18). Of the clathrin-mediated pathway inhibitors, neither the endosomal 423
pH modulators NH4Cl and Baf, nor the coat assembly inhibitor Cpz, were toxic or 424
had any effect on HBV infection, in spite of the treatment being maintained during 425
virus inoculation of the cells (Fig. 7B). 426
The consequence of Cav-1 and Dyn-2 altered functions was also investigated on HBV 427
protein synthesis, using a standard ELISA kit. The amount of HBsAg in HepaRGCav-
428
1∆1-81 - and HepaRG
Dyn-2K44A - infected cells was reduced by about 70 and 45%, 429
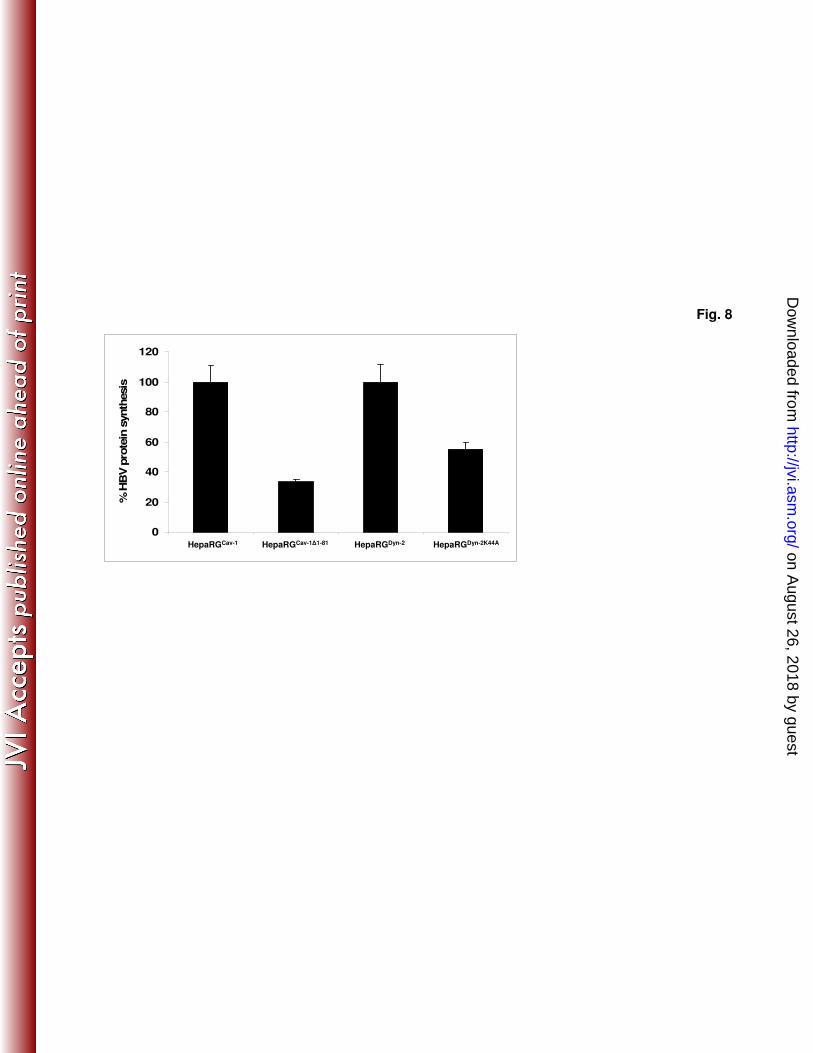
respectively, compared to that from the control cell lines expressing the wild-type 430
counterparts (Fig. 8), thus confirming the inhibitory effect observed at transcriptional 431
level. These results are in agreement with the effect of the mutant Cav-1 and Dyn-2 432
on CTB internalization in HepaRG cells, suggesting a clear dependence of HBV 433
infection on functional Cav-1 and sensitivity to Dyn-2 inhibition. 434
HBV replication is not affected by overexpression of dominant negative Cav-1 435
and Dyn-2. To investigate a potential direct interference with HBV replication in 436
cells expressing mutant Cav-1 and Dyn-2, two control experiments were performed. 437
In a first approach, the proteins were transiently expressed in HepG2.2.2.15 cells 438
which are not permissive for HBV infection, thus allowing a clear distinction between 439
viral entry and later steps of the life cycle. In the second approach, the plasma 440
membrane events were bypassed by transfecting the replication- and assembly- 441
competent pTriExHBV1.1 plasmid into proliferating HepaRGCav-1
, HepaRGCav-1∆1-81
, 442
HepaRGDyn-2
and HepaRGDyn-2K44A
cell lines. The amount of virus produced in both, 443
transfected HepG2.2.2.15 and HepaRG cells was quantified by real time PCR and 444
secretion of HBsAg, by ELISA. As shown in Fig.9, HBV was replicated at similar 445
levels in these cells, regardless whether they expressed the wild-type or dominant 446
on August 26, 2018 by guest
http://jvi.asm.org/
Dow
nloaded from

19
negative variants of Cav-1 and Dyn-2, stably or transiently. Interestingly, a significant 447
inhibitory effect of Dyn-2K44A was clearly observed when secretion of HBsAg was 448
monitored in the cell media of HepG2.2.2.15 cells. This is in agreement with 449
previously published data showing a role for Dyn-2 in a post-replication/assembly 450
step necessary for HBV secretion from HepG2.2.2.15 cells (1). The result also 451
confirms that the transfection rate in these cells was sufficiently high to ensure an 452
inhibitory level of expression of the investigated structural proteins. 453
Discussion 454
While an important amount of data on HBV replication and assembly is now 455
available, the early steps of the life cycle remains obscure for reasons related to the 456
poor in vitro infectivity systems available, which until recently were based on primary 457
human and chimpanzee hepatocytes (14). Thus, most of the findings on hepadnaviral 458
entry came from the more robust DHBV infectivity model and were assumed to apply 459
to HBV. The development of the proliferating HepaRG cell line opened up new 460
possibilities to explore HBV infection in a more specific and accurate manner. One 461
option to investigate the routes of virus infection in target cells is the use of chemical 462
inhibitors that target intracellular structural proteins, enzymes or signal transduction 463
molecules with established functions in entry pathways (31). However, this approach 464
should be treated with caution, as these drugs often have pleiotropic effects on cell 465
function and become toxic with prolonged treatment. The use of chemical compounds 466
is particularly difficult in studying HBV entry, which requires long incubation time of 467
the cells with the viral inoculum for efficient infection (16 to 20 hours) (6, 15). Also, 468
the post-entry processes seem to proceed very slowly, as viral replication markers are 469
not detectable before 6 days post-infection, making the inhibition effects more 470
difficult to interpret. 471
on August 26, 2018 by guest
http://jvi.asm.org/
Dow
nloaded from

20
The development of non-chemical inhibitors in the form of dominant–negative
472
molecules provided a more specific way to analyze the function of defined cellular 473
pathways, minimizing the side-effects associated with the use of chemical inhibitors. 474
When expressed at high levels, dominant–negative mutant versions of cellular 475
proteins act by overwhelming the wild-type protein, perturbing
its function. 476
Overexpression of Dyn-2K44A or Cav-1 deletion mutants, usually over a short length 477
of time, has been successfully used to dissect the entry pathways of a plethora of 478
viruses (3, 11, 28). However, this too is problematic to achieve in the HBV infectivity 479
systems currently available, since primary hepatocytes are notoriously difficult to 480
transfect and the HepaRG cells proved refractory to transient transfections or viral 481
infection/transduction, once differentiated (data not shown). To overcome these 482
difficulties, we took a different approach and first infected the HepaRG cells with 483
retroviral vectors encoding for wild-type/mutant Cav-1 and Dyn-2 at the non-484
differentiated stage and cloned them under G418 treatment. The resulting cell lines, 485
designated HepaRGCav-1
, HepaRGCav-1∆1-81
, HepaRGDyn-2
and HepaRGDyn-2K44A
, where 486
then subjected to differentiation and HBV infection. 487
Cells expressing dominant-negative proteins may tend to upregulate mechanisms in 488
compensation for the lost function, especially when inhibition is maintained over a 489
longer time frame. To investigate such potential interference in our system, the 490
endocytosis characteristics of the established cell lines were monitored at 2 week 491
intervals, using specific markers for caveolae- and clathrin-mediated entry. The 492
expression of the endogenous proteins, whose functions were interfered with, was also 493
examined in cells overexpressing their mutant counterparts. Together, the results of 494
these experiments demonstrated that the cell lines were stable, maintained their 495
properties during differentiation and were susceptible to HBV infection. 496
on August 26, 2018 by guest
http://jvi.asm.org/
Dow
nloaded from

21
Of the two dominant negative proteins used in our study, the Cav-1 deletion mutant 497
effectively prevented internalization of the caveolar ligand CTB and inhibited HBV 498
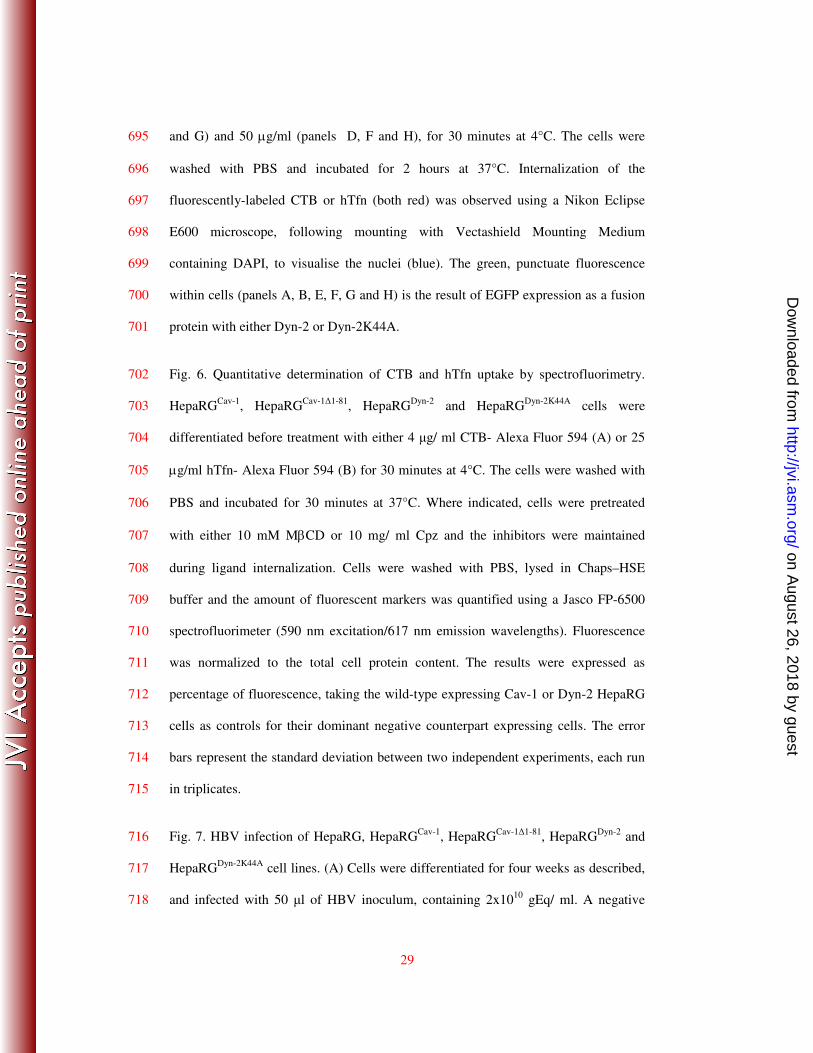
infection, while Dyn-2K44A had a more moderate effect. Overexpression of the 499
dominant negative proteins did not interfere with HBV replication, which shows that 500
an earlier event in the viral life cycle must be affected. Since Cav-1 is the key player 501
of caveolae structure and function, these results strongly point at HBV using a 502
caveolae-mediated endocytosis pathway to enter the cells. Ligand internalization 503
through caveolae, although very efficient, is a slow process and occurs in the neutral 504
pH range, bypassing the acidic endosomal route characteristic for the clathrin-505
dependent entry pathway. Both acidification inhibitors used in our study, NH4Cl and 506
Baf, which specifically blocks the vacuolar H+-ATP-ase pumps, have no effect on 507
HBV infection in HepaRG cells. In addition, treatment with the clathrin assembly 508
inhibitor, Cpz, had no consequences on the rate of infection, despite prolonged 509
incubation with the cells. These results support the notion that HBV is not using a 510
clathrin-mediated, pH-dependent entry route. Interestingly, the virus is also able to 511
translocate trophoblastic cells, a process known to be mediated by caveolae (5). 512
Recently published data demonstrated that DHBV preferentially binds to detergent-513
soluble domains of the duck hepatocyte plasma membrane (13). Combined with the 514
failure of MβCD treatment to inhibit DHBV infection, the observation suggests that 515
caveolae may not be involved in DHBV entry. However, following internalization in 516
primary duck hepatocytes, the virus was found in Cav-1 positive endosomes, as well 517
as the cytosol. Thus, the hypothesis that DHBV may use both, Cav-1 dependent and 518
independent endocytic pathways to gain access into cells, cannot be entirely ruled out. 519
The discrepancy between HBV and DHBV may be a consequence of different uptake 520
strategies adopted within the Hepadnaviridae family, by the two prototypes of the 521
on August 26, 2018 by guest
http://jvi.asm.org/
Dow
nloaded from
22
ortho- and avihepadnaviridae genera. A similar behaviour has been documented for 522
other families of viruses; for example, extensive work performed on polyomaviruses 523
showed that despite the high similarity between the members of this family, they use 524
different endocytic routes to invade the host (2, 23). 525
In conclusion, the data presented in this work are consistent with a mechanism 526
implicating caveolae in the cellular uptake of HBV. The caveolae-mediated entry 527
seems to avoid the degradative endosomal-lysosomal route and can be stimulated by 528
virus binding on the cell surface. This process has been well documented for the 529
simian virus 40, which was shown to enhance the pool of the trafficking competent, 530
mobile caveolae and possibly, induce formation of new ones (33). It is tempting to 531
hypothesize that the transient increase in the amount of detergent extractable Cav-1 532
observed during early HBV infection in HepaRG cells may be a consequence of 533
signaling activation upon virus binding to its receptor(s). The molecular details of the 534
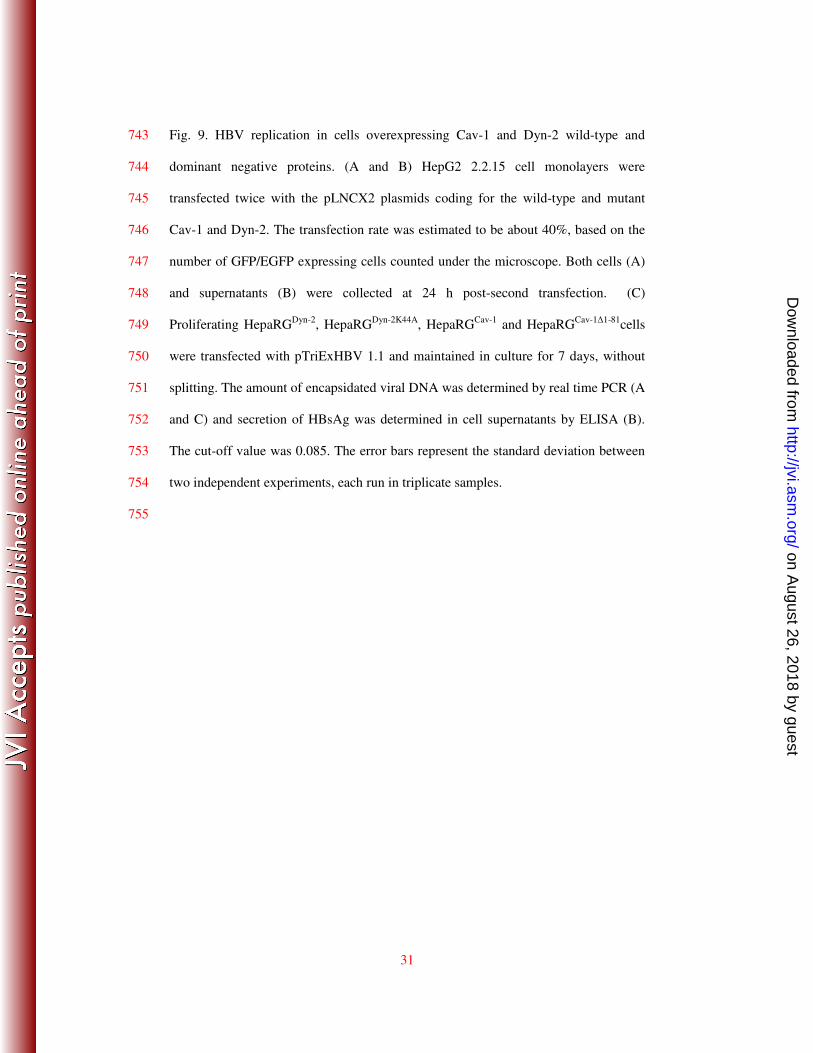
internalization events, as well as the intracellular trafficking and the delivery of the 535
HBV genome to the nucleus of the host cell are yet to be determined. 536
537
Acknowledgements 538
This work was supported by the Idei Grant of the Romanian National Council for 539
Research and Higher Education (CNCSIS), ID_84 and a Collaborative Research 540
International Grant awarded by the Wellcome Trust to Dr. Norica Nichita. 541
542
References 543
1. Abdulkarim, A.S., H. Cao, B. Huang, and M.A. McNiven. 2003. The large 544
GTPase dynamin is required for hepatitis B virus protein secretion from 545
hepatocytes. J Hepatol. 38:76–83. 546
on August 26, 2018 by guest
http://jvi.asm.org/
Dow
nloaded from

23
2. Anderson, H.A., Y. Chen, and L.C. Norkin. 1996. Bound simian virus 40 547
translocates to caveolin enriched membrane domains, and its entry is inhibited 548
by drugs that selectively disrupt caveolae. Mol Biol Cell. 7:1825-34. 549
3. Bartlett, J.S., R. Wilcher, and R.J. Samulski. 2000. Infectious entry pathway of 550
adeno-associated virus and adeno-associated virus vectors. J Virol. 74:2777-551
85. 552
4. Bender, F.C., J.C. Whitbeck, M. Ponce de Leon, H. Lou, R.J. Eisenberg, and 553
G.H. Cohen. 2003. Specific association of glycoprotein B with lipid rafts 554
during herpes simplex virus entry. J Virol. 77:9542–52. 555
5. Bhat, P., and D.A. Anderson. 2007. Hepatitis B Virus Translocates across a 556
Trophoblastic Barrier. J Virol. 81: 7200–07. 557
6. Bremer, C.M., C. Bung, N. Kott, M. Hardt, and D. Glebe. 2009. Hepatitis B 558
virus infection is dependent on cholesterol in the viral envelope. Cell 559
Microbiol. 11:249-60. 560
7. Chojnacki, J., D.A. Anderson, and E.V. Grgacic. 2005. A hydrophobic domain 561
in the large envelope proteinis essential for fusion of duck hepatits B virus at 562
the late endosomes. J Virol. 79:14945-55. 563
8. Conner, S.D., and S.L. Schmid. 2003. Regulated portals of entry into the cell. 564
Nature. 422:37-44. 565
9. Cook, T.A, R. Urrutia, and M.A. McNiven. 1994. Identification of dynamin 2, 566
an isoform ubiquitously expressed in rat tissues. Proc Natl Acad Sci USA. 567
91:644-48. 568
10. Deurs, B.V., K. Roepstorff, A.M. Hommelgaard and K. Sandvig. 2003. 569
Caveolae: anchored, multifunctional platforms in the lipid ocean. Trends Cell 570
Biol. 13:92-100. 571
on August 26, 2018 by guest
http://jvi.asm.org/
Dow
nloaded from
24
11. Eash, S., W. Querbes, and W.J. Atwood. 2004. Infection of Vero cells by BK 572
virus is dependent on caveolae. J Virol. 78:11583-90. 573
12. Fra, A.M., E. Williamson, K. Simons, and R.G. Parton. 1995. De novo 574
formation of caveolae in lymphocytes by expression of VIP21-caveolin. Proc 575
Natl Acad Sci USA. 92:8655–59. 576
13. Funk, A., M. Mhamdi, H. Hohenberg, J. Heeren, R. Reimer, C. Lambert, R. 577
Prange, and H. Sirma. 2008. Duck hepatitis B virus requires cholesterol for 578
endosomal escape during virus entry. J Virol. 82:10532-42. 579
14. Glebe, D., and S. Urban. 2007. Viral and cellular determinants involved in 580
hepadnaviral entry. World J Gastroenterol. 13:22-38. 581
15. Gripon, P., S. Rumin , S. Urban , J. Le Seyec , D. Glaise , I. Cannie , C. 582
Guyomard , J. Lucas , C. Trepo , and C. Guguen-Guillouzo . 2002. Infection 583
of a hepatoma cell line by hepatitis B virus. Proc Natl Acad Sci USA. 584
99:15655-60. 585
16. Henley, J.R., E.W. Krueger, B.J. Oswald, and M.A. McNiven. 1998. 586
Dynamin-mediated internalization of caveolae. J Cell Biol. 141:85-99. 587
17. Lazar, C., D. Durantel, A. Macovei, N. Zitzmann, F. Zoulim, R.A. Dwek, and 588
N. Branza-Nichita. 2007. Treatment of hepatitis B virus-infected cells with 589
alpha-glucosidase inhibitors results in production of virions with altered 590
molecular composition and infectivity. Antiviral Res. 76:30-37. 591
18. Linford, N.J., Y. Yang, D.G. Cook, and D.M. Dorsa. 2001. Neuronal apoptosis 592
resulting from high doses of the isoflavone genistein: role for calcium and 593
P42/44 mitogen-activated protein kinase. J Pharmacol Exp Therap. 299:67–75 594
on August 26, 2018 by guest
http://jvi.asm.org/
Dow
nloaded from
25
19. Orlandi, P.A, and P.H. Fishman. 1998. Filipin-dependent inhibition of cholera-595
toxin: evidence for toxin internalization and activation through caveolae-like 596
domains. J Cell Biol. 141:905-15. 597
20. Pelkmans, L., T. Burli, M. Zerial, and A. Helenius. 2004. Caveolin-stabilized 598
membrane domains as multifunctional transport and sorting devices in 599
endocytic membrane traffic. Cell. 118:767-80. 600
21. Parton, R.G., B. Joggerst, and K. Simons. 1994. Regulated internalization of 601
caveolae. J. Cell Biol.127:1199–1215. 602
22. Parton, R.G. Caveolae and caveolins. 1996. Curr Opin Cell Biol. 8:542–48. 603
23. Pho, M.T., A. Ashok, and W.J. Atwood. 2000. JC virus enters human glial 604
cells by clathrin dependent receptor mediated endocytosis. J Virol. 74:2288-605
92. 606
24. Robinson, W.S., D.A. Clayton, and R.L. Greenman. 1974. DNA of a human 607
hepatitis B virus candidate. J Virol. 14:384-91. 608
25. Rodal, S.K., G. Skretting, O. Garred, F. Vilhardt, B. van Deurs, and K. 609
Sandvig. 1999. Extraction of Cholesterol with Methyl-β-Cyclodextrin Perturbs 610
Formation of Clathrin-coated Endocytic Vesicles. Mol Biol Cell. 10:961-74. 611
26. Rojek, J.M., M. Perez, and S. Kunz. 2008. Cellular entry of lymphocytic 612
choriomeningitis virus. J Virol. 82:1505-17. 613
27. Rothenberger, S., B.J. Iacopetta, and L.C. Kuhn. 1998. Endocytosis of the 614
transferrin receptor requires the cytoplasmic domain but not its 615
phosphorylation site. Cell. 49:423-31. 616
28. Roy, A.M., J.S. Parker, C.R. Parrish, and G.R. Whittaker. 2000. Early stages 617
of influenza virus entry into Mv-1 lung cells: involvement of dynamin. 618
Virology. 267:17-28. 619
on August 26, 2018 by guest
http://jvi.asm.org/
Dow
nloaded from

26
29. Sanchez-San Martin, C., T. Lopez, C.F. Arias, and S. Lopez. 2004. 620
Characterization of rotavirus cell entry. J Virol. 78:2310-18. 621
30. Schmid, S.L., M.A. McNiven, and P. De Camilli. 1998. Dynamin and its 622
partners: a progress report. Curr Opin Cell Biol. 10:504-12. 623
31. Sieczkarski, S.B., and G.R. Whittaker. 2002. Disecting virus entry via 624
endocytosis. J Gen Virol. 83:1535-45. 625
32. Smart, E.J., G.A. Graf, M.A. McNiven, W.C. Sessa, J.A. Engelman, P.E. 626
Scherer, T. Okamoto, and M.P. Lisanti. 1999. Caveolins, liquid-ordered 627
domains, and signal transduction. Mol Cell Biol. 19:7289-304. 628
33. Tagawa, A., A. Mezzacasa, A. Hayer, A. Longatti, L. Pelkmans, and A. 629
Helenius. 2005. Assembly and trafficking of caveolae domains in the cell: 630
caveolae as stable, cargo-triggered, vesicular transporters. J Cell Biol. 170: 631
769-79. 632
34. Teissier, E., and E.I. Pécheur. 2007. Lipids as modulators of membrane fusion 633
mediated by viral fusion proteins. Eur Biophys J. 36:887-99. 634
35. Thomsen, T., K. Roepstorff, M. Stahlhut and B. van Deurs. 2002. Caveolae 635
are highly immobile plasma membrane microdomains, which are not involved 636
in constitutive endocytic trafficking. Mol Biol Cell. 13: 238-250. 637
36. Trouet, D., D. Hermans, G. Droogmans, B. Nilius, and J. Eggermont. 2001. 638
Inhibition of volume-regulated anion channels by dominant-negative caveolin-639
1. Biochem Biophys Res Commun. 284:461-65. 640
641
Figure legends 642
Fig.1. Cav-1 and Dyn -2 expression in HepaRG and control cell lines. (A) Lysates of 643
nondifferentiated (ND), differentiated (D) and HBV-infected HepaRG cells at 16 h 644
on August 26, 2018 by guest
http://jvi.asm.org/
Dow
nloaded from
27
and 3 days pi (+HBV) were quantified for the total protein content and equal amounts 645
of protein were loaded on SDS-PAGE. Endogenous Cav-1 and Dyn-2 were 646
determined by Western blotting, using anti-Cav1 and anti-Dyn-2 Ab. Expression of β-647
actin was used as loading control. (B) The level of endogenous Cav-1 expression was 648
determined in cell lysates of Huh7, MDBK, HepaRG and HeLa cells, as above, using 649
calnexin as loading control. 650
Fig.2. Analysis of wild-type and dominant negative Cav-1 and Dyn -2 expression in 651
HepaRG cells. (A) HepaRG, HepaRGDyn-2
, HepaRGDyn-2K44A
, HepaRGCav-1
and 652
HepaRGCav-1∆1-81
cells were maintained in culture for 2 weeks, lysed and the total 653
protein content was quantified. Equal amounts of protein were analysed by SDS-654
PAGE followed by Western blotting of endogenous and overexpressed Dyn-2 655
(marked as Dyn-2 and Dyn-2 EGFP, respectively) using anti-Dyn-2 Ab. The amount 656
of β-actin in each sample was used as loading control. (B and C) HepaRG, HepaRG 657
Dyn-2, HepaRG
Dyn-2K44A, HepaRG
Cav-1 and HepaRG
Cav-1∆1-81cells were grown in 658
duplicate samples, for 2 weeks and lysed. Total RNA was purified and subjected to 659
standard (B) or semiquantitative (C) RT-PCR analysis using three different pairs of 660
primers: Cav-1-FL, Cav-1-WT and Cav-1-DN, to discriminate between endogenous 661
(black bars), and overexpressed (open bars) wild-type and dominant negative Cav-1. 662
(C) The results are shown as percentage of Cav-1 expression in parental HepaRG 663
cells. The error bars represent the standard deviation between two independent 664
experiments. 665
Fig.3. Dyn-2 and Cav-1 expression in HepaRG cell lines is stable during 666
differentiation. HepaRG Dyn-2
, HepaRG Dyn-2K44A
, HepaRG Cav-1
and HepaRG Cav-1∆1-81
667
cells were differentiated in the presence of 1.8% DMSO, or maintained 668
undifferentiated, by splitting at two day intervals in normal growing medium, as 669
on August 26, 2018 by guest
http://jvi.asm.org/
Dow
nloaded from
28
controls. (A) Undifferentiated (lanes 1 and 3) and differentiated (lanes 2 and 4) 670
HepaRG Dyn-2
and HepaRG Dyn-2K44A
cells were lysed and equal amounts of protein 671
were subjected to SDS-PAGE followed by Western blotting analysis of endogenous 672
and overexpressed Dyn-2 (marked as Dyn-2 and Dyn-2 EGFP, respectively) using 673
anti-Dyn-2 Ab. The contaminating band marked with an asterisk, usually present in 674
retrovirus-infected HepaRG cells, was used as loading control. (B) Undifferentiated 675
(black bars) and differentiated (open bars) HepaRG Cav-1
and HepaRG Cav-1∆1-81
cells 676
were lysed and total RNA was purified. Cav-1 expression was quantified by RT-real 677
time PCR using the Cav-1-FL primers. Amplification of β-actin in the same samples 678
was used as loading control. The results were expressed as Cav-1 divided by β-actin 679
fluorescence units (FU). 680
Fig. 4. Endocytic properties of HepaRG, HepaRG Cav-1
and HepaRG Cav-1∆1-81
cells. 681
Six week old cells were grown on chamber slides for 24 hours, then treated with 682
either 4µg/ml CTB- Alexa Fluor 594, (panels A-E), or 50 µg/ml hTfn- Alexa Fluor 683
594 (panels F and G), for 30 minutes at 4°C. Before CTB addition, cells were treated 684
with 10 mM MβCD, for 30 minutes (C, E) or left untreated, as controls (A, B and D). 685
The cells were washed with PBS and further incubated for 2 hours at 37°C. 686
Internalization of the fluorescently-labeled CTB and hTfn (both red) was observed 687
using a Nikon Eclipse E600 microscope, following mounting with Vectashield 688
Mounting Medium containing DAPI, to visualise the nuclei (blue). The green, diffuse 689
fluorescence within cells (panels B-G) is due to the cytoplasmic localization of GFP, 690
expressed along with Cav-1 from the bicistronic, retroviral plasmid. 691
Fig. 5. Endocytic properties of HepaRGDyn-2
and HepaRGDyn-2K44A
cells. Six week old 692
cells were grown on chamber slides for 24 hours, then treated with either 4 µg/ ml 693
CTB- Alexa Fluor 594, (panels A and B), or hTfn- Alexa Fluor 594 at 25 (panels C, E 694
on August 26, 2018 by guest
http://jvi.asm.org/
Dow
nloaded from
29
and G) and 50 µg/ml (panels D, F and H), for 30 minutes at 4°C. The cells were 695
washed with PBS and incubated for 2 hours at 37°C. Internalization of the 696
fluorescently-labeled CTB or hTfn (both red) was observed using a Nikon Eclipse 697
E600 microscope, following mounting with Vectashield Mounting Medium 698
containing DAPI, to visualise the nuclei (blue). The green, punctuate fluorescence 699
within cells (panels A, B, E, F, G and H) is the result of EGFP expression as a fusion 700
protein with either Dyn-2 or Dyn-2K44A. 701
Fig. 6. Quantitative determination of CTB and hTfn uptake by spectrofluorimetry. 702
HepaRGCav-1
, HepaRGCav-1∆1-81
, HepaRGDyn-2
and HepaRGDyn-2K44A
cells were 703
differentiated before treatment with either 4 µg/ ml CTB- Alexa Fluor 594 (A) or 25 704
µg/ml hTfn- Alexa Fluor 594 (B) for 30 minutes at 4°C. The cells were washed with 705
PBS and incubated for 30 minutes at 37°C. Where indicated, cells were pretreated 706
with either 10 mM MβCD or 10 mg/ ml Cpz and the inhibitors were maintained 707
during ligand internalization. Cells were washed with PBS, lysed in Chaps–HSE 708
buffer and the amount of fluorescent markers was quantified using a Jasco FP-6500 709
spectrofluorimeter (590 nm excitation/617 nm emission wavelengths). Fluorescence 710
was normalized to the total cell protein content. The results were expressed as 711
percentage of fluorescence, taking the wild-type expressing Cav-1 or Dyn-2 HepaRG 712
cells as controls for their dominant negative counterpart expressing cells. The error 713
bars represent the standard deviation between two independent experiments, each run 714
in triplicates. 715
Fig. 7. HBV infection of HepaRG, HepaRGCav-1
, HepaRGCav-1∆1-81
, HepaRGDyn-2
and 716
HepaRGDyn-2K44A
cell lines. (A) Cells were differentiated for four weeks as described, 717
and infected with 50 µl of HBV inoculum, containing 2x10¹⁰
gEq/ ml. A negative 718
on August 26, 2018 by guest
http://jvi.asm.org/
Dow
nloaded from

30
control (NC) sample was included for each cell line, consisting of mock-infected 719
cells. The viral inoculum was removed the following day and cells were washed with 720
PBS before further incubation for 11 days. The level of HBV specific transcripts 721
within infected cells was quantified by RT- real time PCR and normalized to β-actin 722
internal control following substraction of the NC values. The results were expressed 723
as percentage of HBV replication, taking the wild-type expressing Cav-1 or Dyn-2 724
HepaRG cells as controls for their dominant negative counterpart expressing cells. (B) 725
As in A, except that HepaRG cells were treated with either 25 µg/ ml Ny, 10 mM 726
MβCD, 50 mM NH4Cl, 200 nM Baf, 10 mg/ ml Cpz, or 50 µg/ ml Gen, for 2 hours 727
prior to HBV infection, or left untreated (control). The drugs were either removed 728
when the viral inoculum was added to the cells (Ny and MβCD), or maintained during 729
infection (NH4Cl, Baf, Cpz and Gen). The results were expressed as percentage of 730
HBV replication from untreated controls. The error bars represent the standard 731
deviation between two independent experiments, each run in triplicate samples (A and 732
B). 733
Fig. 8. HBsAg biosynthesis in HepaRGCav-1
, HepaRGCav-1∆1-81
, HepaRGDyn-2
and 734
HepaRGDyn-2K44A
cell lines. Cells were differentiated, infected with HBV as above, 735
and harvested at 11 days pi. Cells were lysed and the level of HBsAg expression was 736
determined by ELISA. The values of optical density units were divided to the total 737
protein content in each sample. The results were expressed as percentage of HBsAg 738
expression taking the wild-type expressing Cav-1 or Dyn-2 HepaRG cells as controls 739
for their dominant negative counterpart expressing cells. The error bars represent the 740
standard deviation between 3 independent experiments, each run in triplicate samples. 741
The cut-off value varied between 0.085-0.095. 742
on August 26, 2018 by guest
http://jvi.asm.org/
Dow
nloaded from
31
Fig. 9. HBV replication in cells overexpressing Cav-1 and Dyn-2 wild-type and 743
dominant negative proteins. (A and B) HepG2 2.2.15 cell monolayers were 744
transfected twice with the pLNCX2 plasmids coding for the wild-type and mutant 745
Cav-1 and Dyn-2. The transfection rate was estimated to be about 40%, based on the 746
number of GFP/EGFP expressing cells counted under the microscope. Both cells (A) 747
and supernatants (B) were collected at 24 h post-second transfection. (C) 748
Proliferating HepaRGDyn-2
, HepaRGDyn-2K44A
, HepaRGCav-1
and HepaRGCav-1∆1-81
cells 749
were transfected with pTriExHBV 1.1 and maintained in culture for 7 days, without 750
splitting. The amount of encapsidated viral DNA was determined by real time PCR (A 751
and C) and secretion of HBsAg was determined in cell supernatants by ELISA (B). 752
The cut-off value was 0.085. The error bars represent the standard deviation between 753
two independent experiments, each run in triplicate samples. 754
755
on August 26, 2018 by guest
http://jvi.asm.org/
Dow
nloaded from

A.
B.
Fig. 1
HBV - - + +
Time (pi) - - 16 h 3 days
ND D
135
90
45
26
17
Dyn-2
β-Actin
Cav -1
kDa
90
26
17
Cav -1
Calnexin
Huh7M
DBK
HeLa
HepaRG
kDa
on August 26, 2018 by guest
http://jvi.asm.org/
Dow
nloaded from
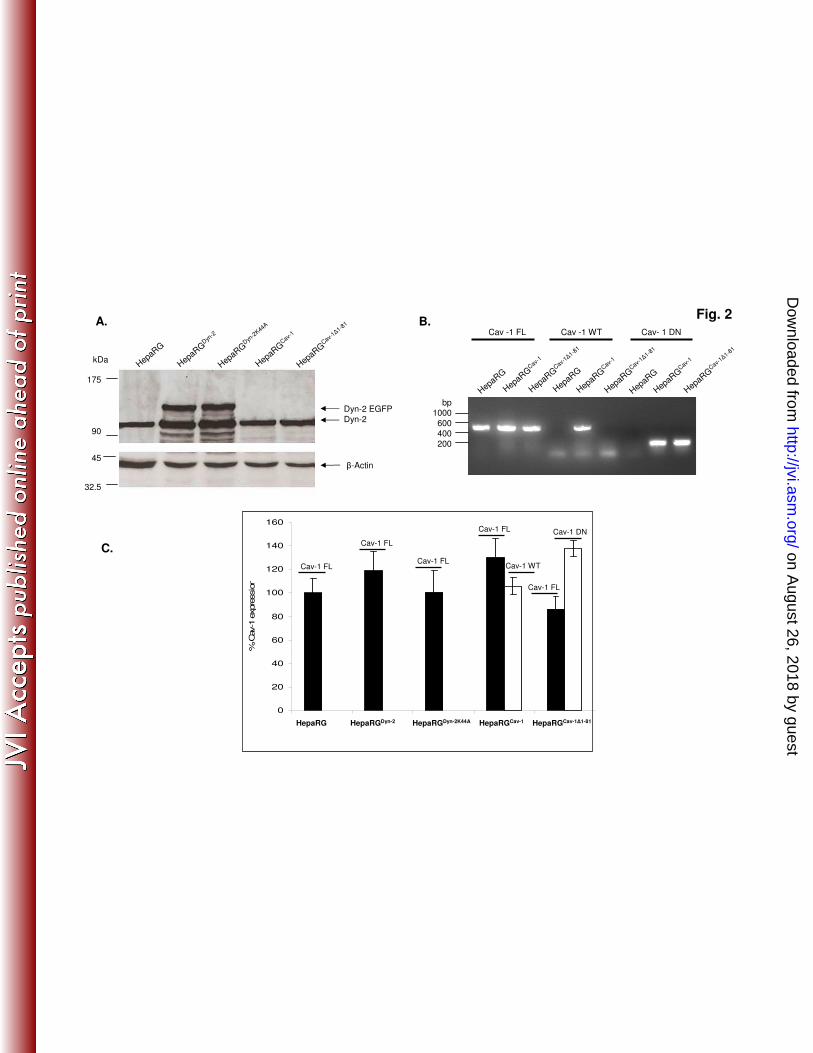
Fig. 2B.
HepaRGCav-
1∆1-8
1
Cav -1 FL Cav -1 WT Cav- 1 DN
bp
1000
600
400
200
HepaRG
HepaRGCav-
1
HepaRGCav-
1∆1-8
1
HepaRG
HepaRGCav-
1
HepaRGCav-
1∆1-8
1
HepaRG
HepaRGCav-
1
C.
A.
175
90
45
32.5
kDa
Dyn-2 EGFP
Dyn-2
HepaRGCav-
1∆1-8
1
β-Actin
HepaRG
HepaRGD
yn-2
HepaRGD
yn-2
K44A
HepaRGCav-
1
HepaRG HepaRGDyn-2 HepaRGDyn-2K44A HepaRGCav-1 HepaRGCav-1∆1-81
0
20
40
60
80
100
120
140
160
% C
av-1
expre
ssio
n
Cav-1 FL
Cav-1 FL
Cav-1 FL
Cav-1 FL
Cav-1 FL
Cav-1 DN
Cav-1 WT
on August 26, 2018 by guest
http://jvi.asm.org/
Dow
nloaded from
A.
B.
Fig. 3
0,00
10,00
20,00
30,00
40,00
50,00
60,00
70,00
80,00
FU
Ca
v-1
\FU
ac
tin
HepaRGCav-1∆1-81HepaRGCav-1
Dyn-2 EGFP
Dyn-2
1 2 3 4
HepaRGDyn-2K44AHepaRGDyn-2
150
90
kDa
on August 26, 2018 by guest
http://jvi.asm.org/
Dow
nloaded from

Fig. 4
HepaRGCav-1
+CTB
HepaRGCav-1
+MβCD +CTB
HepaRGCav-1∆1-81
+CTB
HepaRGCav-1∆1-81
+MβCD+CTB
HepaRG
+CTB
HepaRGCav-1
+hTf
HepaRGCav-1∆1-81
+hTf
on August 26, 2018 by guest
http://jvi.asm.org/
Dow
nloaded from
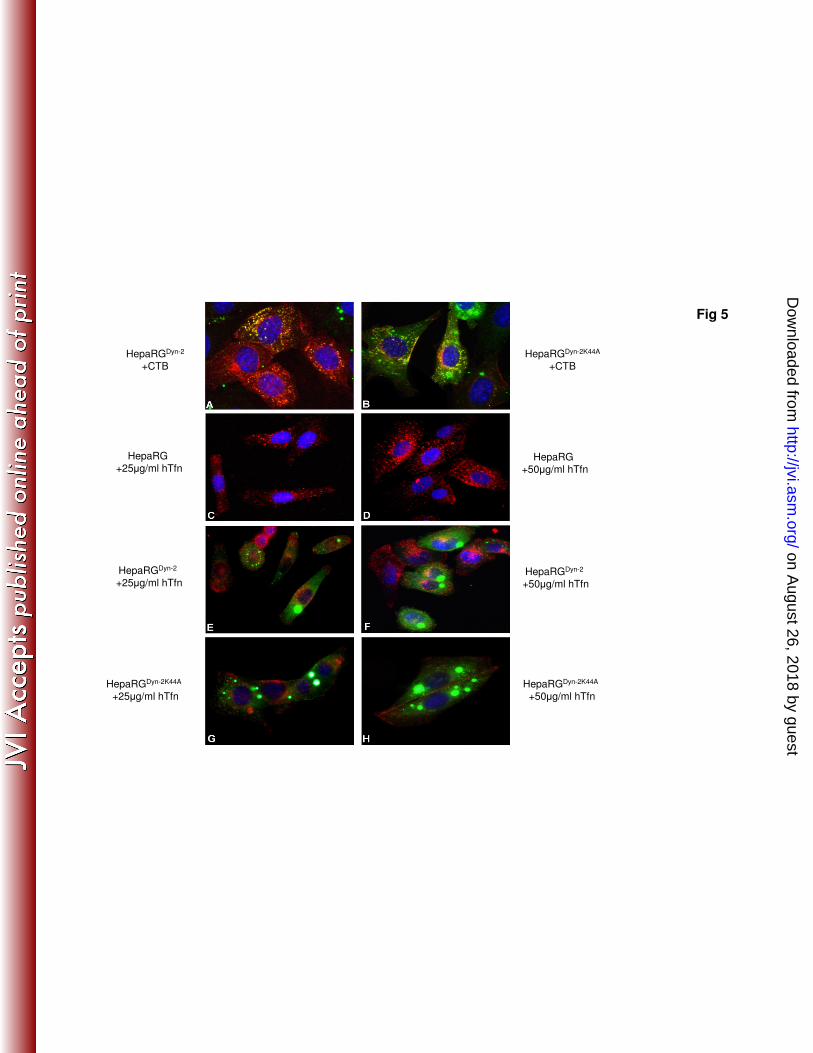
Fig 5
HepaRGDyn-2
+CTB
HepaRGDyn-2K44A
+CTB
HepaRG
+25µg/ml hTfnHepaRG
+50µg/ml hTfn
HepaRGDyn-2
+25µg/ml hTfnHepaRGDyn-2
+50µg/ml hTfn
HepaRGDyn-2K44A
+25µg/ml hTfn
HepaRGDyn-2K44A
+50µg/ml hTfn
on August 26, 2018 by guest
http://jvi.asm.org/
Dow
nloaded from

0
20
40
60
80
100
120
1 2 3 4 5 6
% h
Tfn
up
take
HepaRGCav-1 HepaRGCav-1∆1-81 HepaRGDyn-2 HepaRGDyn-2 HepaRGDyn-2K44A HepaRGDyn-2K44
+Cpz +Cpz
0
20
40
60
80
100
120
1 2 3 4 5 6
% C
TB
upta
ke
HepaRGCav-1 HepaRGCav-1 HepaRGCav-1∆1-81 HepaRGCav-1∆1-81 HepaRGDyn-2 HepaRGDyn-2K44A
+ MβCD + MβCD
A.
B.
Fig. 6
on August 26, 2018 by guest
http://jvi.asm.org/
Dow
nloaded from

Fig. 7A.
0
20
40
60
80
100
120
1 2 3 4
% H
BV
rep
licati
on
HepaRGCav-1 HepaRGCav-1∆1-81 HepaRGDyn-2 HepaRGDyn-2K44A
B.
0
20
40
60
80
100
120
140
HepaRG bafilo cpz NH4Cl MbCD Ny Gen
% H
BV rep
licat
ion
HepaRG HepaRG HepaRG HepaRG HepaRG HepaRG HepaRG
+ Baf + Cpz + NH4Cl + MβCD + Ny + Gen
on August 26, 2018 by guest
http://jvi.asm.org/
Dow
nloaded from
0
20
40
60
80
100
120
cavwt cavdDN Dyn WT DynDN
% H
BV
pro
tein
synth
esis
HepaRGCav-1 HepaRGCav-1∆1-81 HepaRGDyn-2 HepaRGDyn-2K44A
Fig. 8
on August 26, 2018 by guest
http://jvi.asm.org/
Dow
nloaded from
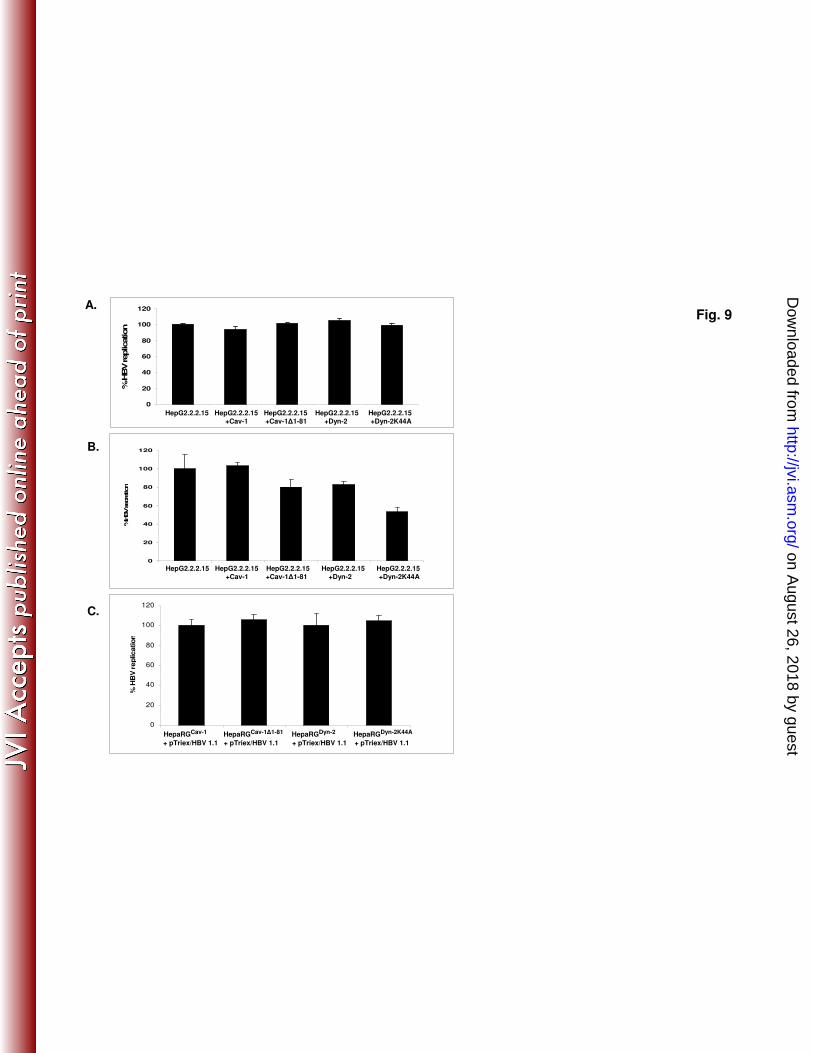
Fig. 9
0
20
40
60
80
100
120
1 2 3 4 5
% H
BV replication
HepG2.2.2.15 HepG2.2.2.15 HepG2.2.2.15 HepG2.2.2.15 HepG2.2.2.15+Cav-1 +Cav-1∆1-81 +Dyn-2 +Dyn-2K44A
A.
0
20
40
60
80
100
120
1 2 3 4 5
%HBV secre
tion
HepG2.2.2.15 HepG2.2.2.15 HepG2.2.2.15 HepG2.2.2.15 HepG2.2.2.15+Cav-1 +Cav-1∆1-81 +Dyn-2 +Dyn-2K44A
B.
C.
0
20
40
60
80
100
120
1 2 3 4
% H
BV
replication
HepaRGCav-1 HepaRGCav-1∆1-81 HepaRGDyn-2 HepaRGDyn-2K44A
+ pTriex/HBV 1.1 + pTriex/HBV 1.1 + pTriex/HBV 1.1 + pTriex/HBV 1.1
on August 26, 2018 by guest
http://jvi.asm.org/
Dow
nloaded from