Embed Size (px)
Citation preview

i
HEMOSTASIS AND ANTICOAGULATION MONITORING DURING EXTRACORPOREAL MEMBRANE OXYGENATION IN CHILDREN
by
Erin Lynn Wolff
BS, University of Pittsburgh, 2011
Submitted to the Graduate Faculty of
Swanson School of Engineering in partial fulfillment
of the requirements for the degree of
Master of Science
University of Pittsburgh
2011

ii
UNIVERSITY OF PITTSBURGH
SWANSON SCHOOL OF ENGINEERING
This thesis was presented
by
Erin Lynn Wolff
It was defended on
July 19, 2011
and approved by
Peter D. Wearden, MD, PhD Department of Pediatric Cardiac Surgery, Children’s Hospital of UPMC, Department
of Bioengineering, McGowan Institute for Regenerative Medicine, University of Pittsburgh School of Medicine
Harvey S. Borovetz, PhD Professor & Chair, Department of Bioengineering; Robert L. Hardesty Professor, Department
of Surgery; Professor, Department of Chemical & Petroleum Engineering
William R. Wagner, PhD Thesis Advisor Professor, Departments of Bioengineering, Chemical & Petroleum
Engineering, & Surgery

iii
Copyright © by Erin Lynn Wolff
2011
iv
HEMOSTASIS AND ANTICOAGULATION MONITORING DURING EXTRACORPOREAL MEMBRANE OXYGENATION IN CHILDREN
Erin Lynn Wolff, MS
University of Pittsburgh, 2011
Background: Bleeding and thromboembolism continue to be the greatest cause of
morbidity and mortality during extracorporeal membrane oxygenation (ECMO). The activated
clotting time (ACT) remains a standard for heparin management in both ECMO and
cardiopulmonary bypass (CPB), despite its weak correlation to the lower plasma heparin levels
of ECMO. Furthermore, little is known about the hemostatic alterations related to ECMO versus
CPB in children. We hypothesize that the hemostatic profile of ECMO patients differs
significantly from those undergoing CPB, and furthermore that age-specific differences exist
between neonatal and pediatric ECMO patients.
Methods: A prospective observational study evaluating antithrombin III (ATIII),
fibrinolysis, thrombin generation, platelet activation and platelet response to agonist during CPB
and ECMO at baseline, 4 and 24 hrs. Differences between age groups (neonatal vs. pediatric) in
the ECMO group were also compared at baseline, 4, 12, 24, 72, and 144 hrs respectively.
Results: The ECMO group was younger, weighed less, and had a lower body surface
index than the CPB group. There were significant differences in baseline ATIII levels, platelet

v
functionality, D-Dimer, and F1+2 concentrations between groups. Dichotomization of the
ECMO group revealed that D-Dimer and F1+2 generation increased with time in neonatal
patients.
Conclusions: ECMO generally had greater impact on the hemostatic system than CPB.
Circulating platelets were less responsive and markers of fibrinolytic and coagulation activation
were greater in the ECMO group at all 3 time points compared between the two therapies.
Fibrinolytic and coagulation activation increased with time significantly in the neonatal ECMO
population.

vi
TABLE OF CONTENTS
1.0 INTRODUCTION ........................................................................................................ 1
1.1 INDICATIONS & COMPLICATIONS ............................................................ 1
1.2 PROTEIN ADSORPTION & PLATELET ACTIVITY .................................. 5
1.3 CONTACT ACTIVATION & COAGULATION CASCADE ........................ 7
1.3.1 Extrinsic Cascade .......................................................................................... 8
1.3.2 Common Pathway ......................................................................................... 9
1.3.3 Fibrinolysis .................................................................................................. 10
1.3.4 Regulation of the Coagulation Cascade .................................................... 12
1.3.5 Complement Activation .............................................................................. 13
1.4 ANTICOAGULATION IN ECMO .................................................................. 15
1.5 MEASUREMENTS OF ANTICOAGULATION AND HEMOSTASIS ...... 17
1.5.1 Activated Clotting Time ............................................................................. 18
1.5.2 Activated Partial Thromboplastin Time ................................................... 19
1.5.3 Antithrombin III ......................................................................................... 21
1.5.4 Prothrombin Fragment 1+2 ....................................................................... 22
1.5.5 D-Dimer ....................................................................................................... 22
1.5.6 S100β ............................................................................................................ 24
1.5.7 Platelet Activation ....................................................................................... 25

vii
2.0 PATIENTS AND METHODS ................................................................................... 27
2.1 PATIENT CRITERIA AND CIRCUIT SET-UP ........................................... 27
2.2 BLOOD COLLECTION & ASSESSMENT OF CLOTTING TIMES ........ 29
2.3 ASSESSMENT OF PLASMA MARKERS ..................................................... 29
2.4 ASSESSMENT OF PLATELET ACTIVATION AND AGGREGATION . 30
2.5 ASSESSMENT OF GRANULOCYTE-PLATELET AGGREGATES ........ 30
2.6 DATA & STATISTICAL ANALYSIS ............................................................. 31
3.0 RESULTS ................................................................................................................... 33
4.0 DISCUSSION ............................................................................................................. 52
BIBLIOGRAPHY ....................................................................................................................... 58

viii
LIST OF TABLES
Table 1.1 Reasons for Respiratory ECMO Cannulation in Neonatal and Pediatric Patients.
Included is the percent of the respiratory cases both internationally and at Children’s
Hospital of Pittsburgh (CHP) along with the percent survival. Adapted from ECLS
International Registry Report January 2011 [2]. ............................................................ 2
Table 1.2 Reasons for Cardiac ECMO Cannulation in Neonatal and Pediatric Patients. Included
is the percent of the cardiac cases both internationally and at Children’s Hospital of
Pittsburgh (CHP) along with the percent survival. Adapted from ECLS International
Registry Report January 2011 [2]. ................................................................................. 3
Table 1.3 Complications encountered during ECMO. Included is the percent of the reported
cases both internationally and at Children’s Hospital of Pittsburgh (CHP) along with
the percent survival for each complication. Adapted from ECLS Registry Report
January 2011 [2]. ............................................................................................................ 4
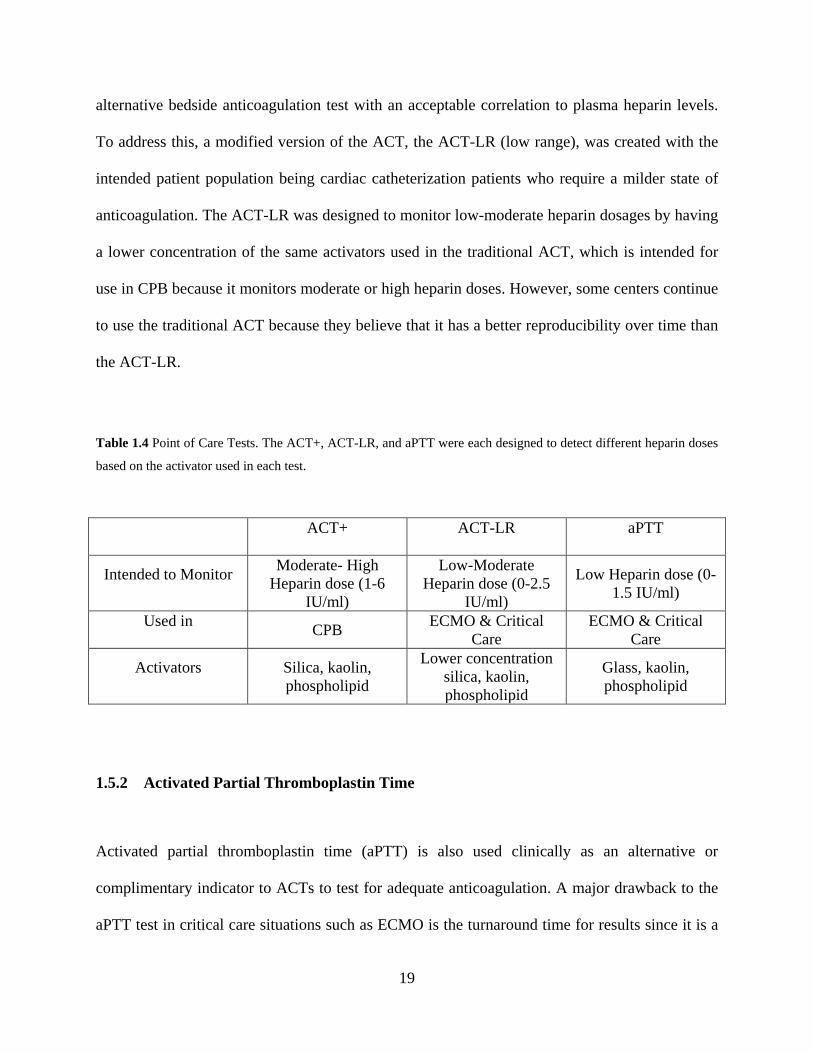
Table 1.4 Point of Care Tests. The ACT+, ACT-LR, and aPTT were each designed to detect
different heparin doses based on the activator used in each test. ................................. 19
Table 3.1. Patient Demographics .................................................................................................. 33
Table 3.2 Blood Product Administration (mL blood products/ kg patient/ hr) ............................ 36
Table 3.3 Point of Care Testing: Spearman Correlation ............................................................... 36

ix
LIST OF FIGURES
Figure 1.1 Platelet Activation during ECMO. Upon platelet activation, platelets form cross
bridges with fibrinogen that has deposited on the surface of circuit. Once activated,
platelets release both α and dense granules into the environment activating even
more platelets. ............................................................................................................. 7
Figure 1.2 The Coagulation Cascade. ECMO activates the intrinsic part of the coagulation
cascade via contact activation; however, the extrinsic portion can become activated
due to tissue damage producing TF. ATIII is the primary naturally occurring
anticoagulant and is therefore the target of many anticoagulants such as heparin. ... 10
Figure 1.3 Fibrinolysis. The generation of thrombin in the ECMO circuit eventually results in
fibrin clot formation, which is cleaved by plasmin, producing D-Dimer a marker of
fibrinolysis. ................................................................................................................ 11
Figure 3.1. Diagnosis for ECMO Patients .................................................................................... 34
Figure 3.2 Diagnosis for CPB Patients ......................................................................................... 35
Figure 3.3: Antithrombin III Levels Comparing ECMO and CPB Patients at baseline, 4 hours
post-cannulation and 24 post-op (CPB) or 24 hours on ECMO. Mann-Whitney Rank
Sum: Presented at Median and IQ Range (25%-75%).. ............................................ 38
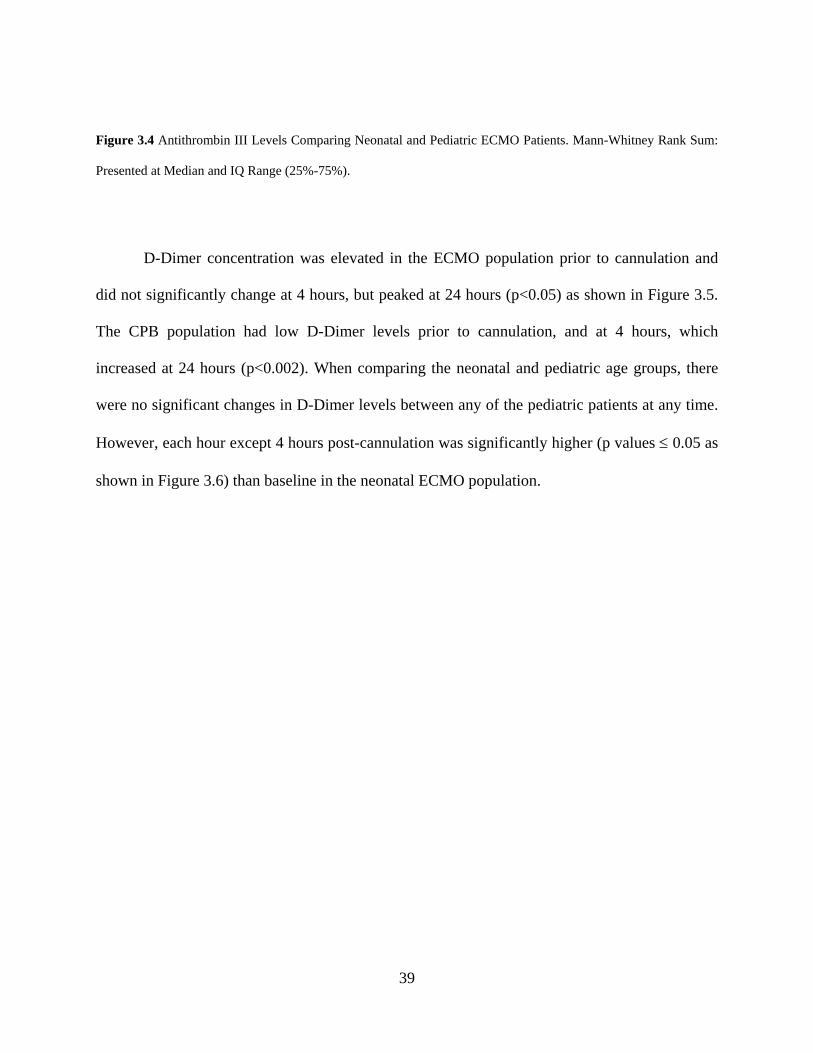
Figure 3.4 Antithrombin III Levels Comparing Neonatal and Pediatric ECMO Patients. Mann-
Whitney Rank Sum: Presented at Median and IQ Range (25%-75%). ..................... 39

x
Figure 3.5 D-Dimer Levels Comparing ECMO and CPB Patients at baseline, 4 hours post-
cannulation and 24 post-op (CPB) or 24 hours on ECMO. Mann-Whitney Rank
Sum: Presented at Median and IQ Range (25%-75%). ............................................. 40
Figure 3.6 D-Dimer Levels Comparing Neonatal and Pediatric ECMO Patients. Mann-Whitney
Rank Sum: Presented at Median and IQ Range (25%-75%). .................................... 41
Figure 3.7 F1+2 Levels Comparing ECMO and CPB Patients at baseline, 4 hours post-
cannulation and 24 post-op (CPB) or 24 hours on ECMO. Mann-Whitney Rank
Sum: Presented at Median and IQ Range (25%-75%). ............................................. 42
Figure 3.8 F1+2 Levels Comparing Neonatal and Pediatric ECMO Patients. Mann-Whitney
Rank Sum: Presented at Median and IQ Range (25%-75%). Significant differences
were found between neonatal time indices. ............................................................... 43
Figure 3.9 Percent Platelet Activation (using P-selectin) Comparing ECMO and CPB Patients at
baseline, 4 hours post-cannulation and 24 post-op (CPB) or 24 hours on ECMO.
Mann-Whitney Rank Sum: Presented at Median and IQ Range (25%-75%). .......... 44
Figure 3.10 Percent of Granulocytes Positive for CD42b (Granulocyte-Platelet Aggregates)
Comparing ECMO and CPB Patients at baseline, 4 hours post-cannulation and 24
post-op (CPB) or 24 hours on ECMO. Mann-Whitney Rank Sum: Presented at
Median and IQ Range (25%-75%). ........................................................................... 45
Figure 3.11 Percent Platelet Activation (using P-selectin) Comparing Neonatal and Pediatric
ECMO Patients. Mann-Whitney Rank Sum: Presented at Median and IQ Range
(25%-75%). ............................................................................................................... 46

xi
Figure 3.12 Percent of Granulocytes Positive for CD42b (Granulocyte-Platelet Aggregates)
Comparing Neonatal and Pediatric ECMO Patients. Mann-Whitney Rank Sum:
Presented at Median and IQ Range (25%-75%). ...................................................... 46
Figure 3.13 Percent Platelet Activation with ADP Stimulation Comparing ECMO and CPB
Patients at baseline, 4 hours post-cannulation and 24 post-op (CPB) or 24 hours on
ECMO. Mann-Whitney Rank Sum: Presented at Median and IQ Range (25%-75%).
................................................................................................................................... 47
Figure 3.14 Percent Platelet Activation with ADP Stimulation Comparing Neonatal and Pediatric
ECMO Patients. Mann-Whitney Rank Sum: Presented at Median and IQ Range
(25%-75%). Significant differences were not found between neonatal and pediatric
ECMO groups except at 144 hours. .......................................................................... 48
Figure 3.15 S100β Levels Comparing ECMO and CPB Patients at baseline, 4 hours post-
cannulation and 24 post-op (CPB) or 24 hours on ECMO. Mann-Whitney Rank
Sum: Presented at Median and IQ Range (25%-75%). ............................................. 49
Figure 3.16 S100β Levels Comparing Neonatal and Pediatric ECMO Patients. Mann-Whitney
Rank Sum: Presented at Median and IQ Range (25%-75%). .................................... 50
Figure 3.17 S100β levels comparing one patient who experienced an intraventricular hemorrhage
to an age-matched ECMO group (n=1 vs. n=8) ± standard deviation. The head
ultrasound was performed every 2 days and the IVH was not detected until 504
hours on ECMO. ........................................................................................................ 51

1
1.0 INTRODUCTION
Extracorporeal membrane oxygenation (ECMO) provides respiratory and cardiovascular support
to neonatal (up to 30 days) and pediatric (30 days to 18 years) patients in cardiac and/or
respiratory failure. Activation of the coagulation and inflammatory systems occurs when blood
comes in contact with the ECMO circuit creating a need for systemic anticoagulation. Despite
advances in circuit technology, including surface coatings and reduction in surface area and
priming volumes, bleeding and thromboembolism remain the most common causes of morbidity
and mortality for these patients [1].
1.1 INDICATIONS & COMPLICATIONS
Extracorporeal membrane oxygenation (ECMO) has been used to support more than 26,000
neonatal and pediatric patients over the last 25 years [2, 3]. ECMO is a modified form of
cardiopulmonary bypass (CPB) that provides short-term (days to weeks) respiratory and
cardiovascular support. It has been used successfully in both adults and children with the latter
group having better outcomes [2]. The majority of neonatal patients are placed on ECMO for
respiratory conditions (86% respiratory and 12% cardiac), whereas in pediatrics, the distribution
is about equal (44% respiratory and 48% cardiac). As shown in Table 1.1, the most common
respiratory uses for ECMO in neonatal patients are congenital diaphragmatic hernia (CDH),

2
meconium aspiration syndrome (MAS), persistent pulmonary hypertension of the newborn
(PPHN)/persistent fetal circulation (FPC), respiratory distress syndromes (RDS) and sepsis. In
pediatrics, ECMO is primarily used for pneumonia (viral, bacterial, and aspiration), ARDS (non
post-operative), and acute respiratory failure (non-ARDS). Common cardiac reasons for ECMO
support (see Table 1.2) include failure to wean from CPB after congenital heart defect repairs,
cardiac arrest, cardiogenic shock, cardiomyopathy, and myocarditis. For most pediatric patients,
ECMO may be the only option for respiratory or cardiovascular support since ventricular assist
devices and other forms of mechanical circulatory support are only available for patients with
larger surface areas.
Table 1.1 Reasons for Respiratory ECMO Cannulation in Neonatal and Pediatric Patients. Included is the percent of
the respiratory cases both internationally and at Children’s Hospital of Pittsburgh (CHP) along with the percent
survival. Adapted from ECLS International Registry Report January 2011 [2].
Neonatal Pediatric
Reason for Cannulation
International % Resp. Runs / CHP % Resp.
Runs
International % Survival/ CHP %
Survival
Reason for Cannulation
International % Resp. Runs / CHP % Resp.
Runs
International % Survival/ CHP %
Survival
CDH 25 / 30 51 / 41 Viral Pneumonia
20 / 28 63 / 48
MAS 31 / 30 94 / 88 Bacterial Pneumonia
11 / 6 57 / 43
PPHN/PFC 16 / 20 78 / 74 Aspiration Pneumonia
4 / 7 66 / 25
RDS 6 / 7 84 / 69 ARDS 8 / 3 53 / 0
Sepsis 11 / 4 75 / 59 Acute Resp. Failure
17 / 32 51 / 30

3
Table 1.2 Reasons for Cardiac ECMO Cannulation in Neonatal and Pediatric Patients. Included is the percent of the
cardiac cases both internationally and at Children’s Hospital of Pittsburgh (CHP) along with the percent survival.
Adapted from ECLS International Registry Report January 2011 [2].
Neonatal Pediatric
Reason for Cannulation
International % Cardiac Runs / CHP % Cardiac
Runs
International % Survival/ CHP %
Survival
International % Cardiac Runs / CHP % Cardiac
Runs
International % Survival/ CHP %
Survival
Congenital Defect 86 / 68 38 / 59 63 / 42 44 / 54
Cardiac Arrest 1 / 13 22 / 33 3 / 14 43 / 44
Cardiogenic Shock 1 / 0 39 / 0 2 / 1 44 / 100
Cardiomyopathy 2 / 5 62 / 80 10 / 14 60 / 63
Myocarditis 1 / 0 50 / 0 5 / 7 68 / 75
Although ECMO improves survival rates from less than 20% to nearly 80% in most
cases, it is not without significant co-morbidities. In general, the most common complications for
all ECMO patients are bleeding and thrombosis. Data from the 2011 ELSO registry [2] shown in
Table 1.3 indicates that internationally the major complication for all children placed on ECMO
regardless of the reason they were placed on ECMO is the need for inotropic agents.
Additionally, the need for hemofiltration remains a major complication for all of these children.
In the cardiac population, bleeding is a major complication while in the respiratory population it
is not. It is interesting to note that according to the ECLS International Registry Report, neonates
experience more thrombotic complications whereas pediatric patients experience more bleeding.
Children’s Hospital of Pittsburgh (CHP) has similar types of complications, but the rates are
much lower. One of the reasons our institution has fewer complications is that we are a higher

4
volume center. We have more institutional experience and routinely perform these procedures.
Despite the reduced complications, CHP has a higher mortality for their respiratory patients. It is
difficult to explain the difference and make a meaningful comparison without the severity of
illness of the patients being placed on ECMO. The difference may be due to the fact that the
children that CHP is willing to place on ECMO are more ill prior to being placed on ECMO, or
that more sick children are going on ECMO because the critical care team is managing the
possible ECMO children better thereby preventing the less sick children from ever being placed
onto ECMO. Additionally, there may be discrepancies in the reporting of complications to the
international ELSO registry. This may be due to the lack of formal definitions for each category
or the lack of adjudication of the registry.
Table 1.3 Complications encountered during ECMO. Included is the percent of the reported cases both
internationally and at Children’s Hospital of Pittsburgh (CHP) along with the percent survival for each complication.
Adapted from ECLS Registry Report January 2011 [2].
Neonatal Pediatric
Respiratory Cardiac Respiratory Cardiac
Complication % Reported
(Intn’l/ CHP)
% Survived (Intn’l / CHP)
% Reported (Intn’l / CHP)
% Survived (Intn’l / CHP)
% Reported (Intn’l / CHP)
% Survived (Intn’l/ CHP)
% Reported (Intn’l/ CHP)
% Survived (Intn’l / CHP)
Clots in oxygenator 17.4 / 5.9 65.0 / 30.0 11.2 / 5.4 27.0 / 0.0 9.5 / 7.8 50.0 / 33.0 11.6 / 4.9 40.0 / 0
Need for inotropes 19.7 / 9.4 61.0 / 42.0 61.2 / 31.5 34.0 / 41.0 46.0 / 20.7 44.0 / 25.0 77.5 / 44.3 37.0 / 37.0
Hemofiltration required 14.7 / 18.1 53.0 / 52.0 26.1 / 20.7 26.0 / 37.0 21.9 / 19.0 44.0 / 36.0 14.2 / 18.0 24.0 / 36.0
Surgical site bleeding 6.2 / 6.3 44.0 / 28.0 31.8 / 12.0 29.0 / 27.0 14.6 / 11.2 45.0 / 15.0 27.9 / 16.4 35.0 / 40
Cannula site bleeding 7.1 / 10.4 64.0 / 51.0 10.4 / 9.8 28.0 / 22.0 15.7 / 14.7 51.0 / 35.0 21.3 / 13.1 42.0 / 50.0

5
1.2 PROTEIN ADSORPTION & PLATELET ACTIVITY
Blood contact with a foreign surface results in rapid fibrinogen deposition, raising the local
concentration more than 100-fold over the plasma concentration and provides a necessary ligand
for platelet adhesion. Platelets do not bind directly to the surface of a material, but upon
activation undergo a conformational change, which provides a binding site for fibrinogen (see
Figure 1.1). Although fibrinogen deposition increases platelet adhesion, it is not required for
platelet activation. Extracorporeal surface contact, thrombin, platelet activating factor, and
heparin all contribute to platelet activation during ECMO. Non-activated platelets have a very
low affinity for fibrinogen, and activation greatly increases their ability to be cross-linked with
fibrinogen. In addition to fibrinogen, platelets have been shown to adhere to von Willebrand’s
factor (vWF), fibronectin, fibrin, vitronectin, IgG, and plasma proteins containing the RGD
sequence (arginine-glycine-aspartic acid). The local mechanical environment also impacts
platelet adhesion. Zaidi et al. have shown that low to medium shear (250-800s-1) result in
adhesion of platelets to surface-bound fibrinogen while shear stresses higher than that result in
adhesion to vWF [4]. Platelet adhesion can be diminished by masking the foreign surface with a
more inert protein, such as albumin. Since albumin lacks the RGD sequence, platelet receptors
do not recognize albumin. However, albumin must occupy at least 98% of the surface to exert
these non-thrombogenic effects. In fact, fibrinogen adhesion over as little as 2% of a given
surface area has been associated with platelet activation [5].
Circulating platelet concentration is typically 150-400x109/L with an average lifespan of
7-10 days. Platelet membranes consist of a phospholipid bilayer integrated with surface
receptors, including glycoprotein IIb/IIIa (GPIIb/IIIa) and GPIb. These receptors mediate the
platelet-surface interactions (adhesion) and the platelet-platelet interactions (aggregation). The

6
platelet-phospholipid surface acts as a catalyst, selectively absorbing coagulation factors from
the plasma. Platelets also contain 2 types of storage granules: (1) α-granules which contain
platelet factor 4 (PF-4), β-thromboglobulin, and plasma proteins (fibrinogen, fibronectin, and
Factors V and VIII), platelet derived growth factor (PDGF), P-selectin, and transforming growth
factor α (TGF-α); (2) dense granules which contain adenosine diphosphate and triphosphate
(ADP and ATP), serotonin, ionized calcium (Ca2+), histamine and epinephrine [6].
When platelets become activated, they become “sticky” and develop pseudopodia.
Activation also causes the platelets to contract (via actin and myosin) and release their storage
granules into the environment (e.g. thromboxanes and ADP), which activate other platelets in a
positive feedback fashion. In addition to platelet activation, platelet adhesion to the circuit
occurs. It has been shown that upon initiation of CPB, a 40% platelet loss occurs within the first
5 minutes due to platelet adhesion to the surface and platelet aggregation [7]. As already
discussed, GPIIb/IIIa is the platelet receptor that attaches to fibrinogen that has adhered to
extracorporeal foreign surface, as well as vWF, fibronectin, fibrin, or vitronectin. GPIb acts as a
surface receptor for vWF and also contributes to platelet adhesion to the foreign surface. Because
of the ongoing platelet activation, most ECMO centers have adopted a policy of monitoring and
maintaining platelet counts of at least 100,000/µL.

7
Figure 1.1 Platelet Activation during ECMO. Upon platelet activation, platelets form cross bridges with fibrinogen
that has deposited on the surface of circuit. Once activated, platelets release both and dense granules into the
environment activating even more platelets.
1.3 CONTACT ACTIVATION & COAGULATION CASCADE
The normal process of blood activation occurs in two distinct pathways (extrinsic and intrinsic
pathways) that converge to a common pathway (see Figure 1.2). During ECMO, activation is
mostly triggered by the intrinsic pathway. Blood contact with a foreign surface results in
activation of the intrinsic pathway where zymogens begin being cleaved into their active
enzymes resulting in a cascade of events with the result being thrombin formation. Factor XII
(Hageman factor), prekallikrein (PK), high molecular weight kininogen (HMWK), and Factor XI
(FXI) comprise the four proteins responsible for this contact activation. FXII, PK, and XI are
proenzymes that are converted to the active serine proteases, FXIIa, kallikrein (K), and FXIa.

8
presence of PK and HMWK, is converted to FXIIa, which is a weak neutrophil activating agonist
that has three roles [8]. First, in the presence of HMWK and K, FXIIa activates FXI, which in
turn activates the intrinsic pathway. Second, FXIIa cleaves PK to produce K, which feeds back to
contribute to the activation of FXIa. Lastly, FXIIa cleaves HMWK to produce bradykinin, a
strong vasodilator that may be responsible for this characteristic of the inflammatory response
[8]. FXIa, in the presence of calcium, activates FIX, and the activated FIX, calcium, and FVIIIa
form a complex on the surface of activated platelets and this complex comprises the tenase
complex, whose role is to activate FX [9].
1.3.1 Extrinsic Cascade
Activation of the extrinsic system results from tissue damage, which exposes the blood to tissue
factor (TF), a membrane protein present in the subendothelium. TF is not expressed on cells that
normally come in contact with blood, but when tissue damage or inflammation occurs, it is the
most potent trigger of blood coagulation. The process and continued state of cannulation
necessary with ECMO may continually expose blood to the subendothelium and provide a
source for TF expression. Even without tissue damage, the extrinsic system can still become
mildly activated during ECMO by the expression of TF most likely released as a result of the
inflammatory state. TF binds to FVII and the resulting TF/FVIIa complex activates FX. FXa may
remain on the TF expressing cell, or diffuse into the blood and bind to activated platelets.

9
1.3.2 Common Pathway
Both FXa and already generated thrombin can activate FV. FXa, calcium, the phospholipid
surface of platelets, and FVa comprise the prothrombinase complex that cleaves prothrombin to
produce thrombin [10]. Calcium functions similarly to a cofactor, promoting the binding between
enzyme, substrate, and other components [6]. The cleavage of prothrombin to thrombin is an
important step in the common pathway because it produces protein fragment F1+2 that can be
followed as a marker of coagulation activation. Thrombin can activate FV, FVIII, and platelets,
as well as working on the substrates fibrinogen and FXIII. Therefore, once thrombin is
generated, it initiates a potent positive feedback system that continues to produce more thrombin.
The activation of FXIIIa works to stabilize the fibrin clot. The production of thrombin amplifies
the already deleterious effects of blood activation by producing fibrin, further activating
platelets, and stimulating the production of tissue factor plasminogen (tPa), which initiates
fibrinolysis.

10
Figure 1.2 The Coagulation Cascade. ECMO activates the intrinsic part of the coagulation cascade via contact
activation; however, the extrinsic portion can become activated due to tissue damage producing TF. ATIII is the
primary naturally occurring anticoagulant and is therefore the target of many anticoagulants such as heparin.
1.3.3 Fibrinolysis
Activation of the coagulation cascade ultimately results in the conversion of fibrinogen to fibrin
via thrombin generation. In addition, the production of fibrin initiates fibrinolysis, essentially
breaking down the clot that has formed. A circulating plasma proenzyme, plasminogen, is
converted to plasmin, the major fibrinolytic protease, by tissue plasminogen activator (tPA) or
urokinase-like plasminogen activator (u-PA) [6]. tPA is synthesized by endothelial cells and is

11
released due to a number of stimuli including thrombin and bradykinin, and is the most important
of the plasminogen activators [6, 11]. Once activated, plasmin cleaves available fibrin, resulting
in fibrin fragments that will eventually be degraded and cleared from the blood. One such
fragment includes D-Dimer, a noted marker of fibrinolysis (Figure 1.3) [6, 12]. In addition to
cleaving fibrin, plasmin has also been shown to activate platelets, further stimulating the
coagulation cascade [11]. Even though plasminogen is inactive and cannot cleave fibrin, its still
has an affinity for fibrin and can become integrated into a fibrin clot.
Figure 1.3 Fibrinolysis. The generation of thrombin in the ECMO circuit eventually results in fibrin clot formation,
which is cleaved by plasmin, producing D-Dimer a marker of fibrinolysis.
Because hemorrhagic complications are among the most common and result in increased
morbidity and mortality, the use of aminocaproic acid (AMICAR) has been proposed to combat
the bleeding complications in “high risk” patients. Pre-existing or anticipated surgical procedures
while on ECMO, evidence of hypoxia or acidosis, prematurity, previous intracranial hemorrhage,
and coagulopathy were common indicators for high-risk patients. In a 10 yr study from 1991 to
2001, the Children’s Hospital in Boston enrolled 431 patients, 298 of whom were deemed high

12
risk and given AMICAR [13]. This study found that there was a significant decrease in surgical
site bleeding in the AMICAR group. However, overall survival rate, quantifiable bleeding, and
transfusion requirement was not statistically significantly different between the AMICAR and
control group. There was also no difference in thrombotic complications between the two
groups, but the AMICAR groups did have a significant increase in circuit changes. In addition,
the AMICAR group required a longer duration of ECMO support than the control group but it
should be pointed out that this might be due to the fact that the patients were of higher risk. In
the same study, thrombotic complications were compared in the AMICAR group and the control
group. The results showed that there was no difference in cerebral infarction or large vessel
thrombosis. Even though the results of the study concluded that AMICAR does not decrease the
rate of ICH or improve the patients’ survival rate, it is still considered as an option to decrease
surgical site bleeding.
1.3.4 Regulation of the Coagulation Cascade
Three inhibitory pathways regulate the coagulation system: the protein C pathway, the tissue
factor pathway inhibitor (TFPI), and antithrombin III (ATIII). When thrombin binds to its
endothelial receptor, thrombomodulin, it undergoes a conformational change at its active site that
converts it from a procoagulant enzyme to activated protein C (APC) [14]. Using Protein S as a
cofactor, APC acts as an anticoagulant by inactivating FVa and FVIIIa, which blocks thrombin
generation [14]. TFPI is a regulatory protease inhibitor of the FVIIa/TF complex, which
terminates the formation FXa and FIXa [15]. ATIII is a serine protease inhibitor that
physiologically targets proteases in the intrinsic coagulation system. More specifically, ATIII has
the ability to irreversibly inactivate Factors IIa (thrombin), IXa, Xa, XIa and XIIa making it the

13
most useful agent in reducing thrombotic activity [6]. ATIII is further discussed in the section on
monitoring of anticoagulation and hemostasis.
1.3.5 Complement Activation
ECMO leads to activation of the systemic inflammatory response, which results from
complement activation generated by the large foreign surface of the ECMO circuit. Complement
activation results in cell lysis, production of inflammatory mediators that attract phagocytes,
opsonization of organisms for clearance by phagocytosis, and enhancement of antibody-
mediated immune responses. Similar to the coagulation cascade, complement proteins are
created as zymogens and later cleaved to become active enzymes. These proteins can be
activated via 3 pathways – the classical pathway, the lectin pathway, and the alternative pathway.
However, during ECMO, the alternative pathway is predominantly activated.
The alternative pathway is activated when the C3 thioester bond spontaneously
hydrolyzes in response to the activating surfaces, chemicals, or infectious agents. This is thought
to occur because there is a slow tick-over of C3 to C3b occurring all of the time due to the
instability of the C3 thioester bond. Hydrolyzed C3 binds to activated Factor B, and then Factor
D cleaves Factor B (which is bound to hydrolyzed C3), thereby activating C3 convertase, which
cleaves C3 to C3a and C3b. C3b, activates C5 convertase and also acts as an opsonin, targeting
cell surfaces for recognition by macrophages and neutrophils. C5 convertase cleaves C5 into C5a
and C5b. C6-9 sequentially bind to C5b and comprise the membrane attack complex (MAC),
which inserts into the lipid wall of bacteria or eukaryotic cells and causes osmotic lysis. If
assembly of C5b-9 takes place in the extracellular fluid, it is termed terminal complement
complex (TCC). C5a and C3a are anaphylatoxins further stimulating the inflammatory response.

14
Anaphylatoxins are molecules that can bind to the receptor of many cell types and stimulate
smooth muscle cell contraction, increase vascular permeability and activate mast cells to release
inflammatory mediators. C5a is also chemotactic for monocytes and neutrophils, stimulating
leukocyte adhesion to blood vessel walls.
Complement activation is similar in many different forms of extracorporeal circulation
including CPB, dialysis, and plasmapheresis, due primarily to contact with a large artificial
surface, which initiates the alternative pathway through autohydrolysis of C3 [16]. In fact off-
pump cardiac surgery markedly reduces complement activation [17]. After 1 hour on ECMO,
levels of C3a peaked and after 2 hours levels of C5a and terminal complement complex (TCC)
peak [16, 18]. The C5a peak may be delayed as compared to the C3a peak since C5a has stronger
binding to complement receptors [18]. In addition to an increase in complement activation,
elastase and tumor necrosis factor α (TNFα) concentration are elevated [19]. It is hypothesized
that the rapid increase in TNFα results because ECMO mobilizes preformed TNFα stores from
the gut as opposed to the de novo generation of TNFα from leukocytes [20]. These cytokines are
increased above the already elevated levels seen in critically ill patients prior to ECMO [17].
Complement and leukocyte activation remain elevated and then return to pre-ECMO levels after
24 hours [18, 19, 21].
In addition to the systemic inflammatory effects, the complement system directly impacts
the coagulation system, enhancing the thrombogenicity of blood through at least four different
mechanisms. The primary mechanism is the up-regulation of TF in leukocytes by the potent
anaphylatoxin C5a. Therefore, although TF is normally only found deep in the adventitia and
exposed upon vessel injury, interaction with a foreign surface can easily initiate the extrinsic
pathway in the absence of any tissue damage. A second mechanism for increasing coagulation is

15
the assembly of the MAC, which increases the vascular permeability and can lead to exposure of
the subendothelial layer, and consequently TF, and an increase in prothrombinase activity.
Circulating mast cells are another source of increased thrombogenesis as a result of
inflammation. They are among the first responders to sites of inflammation, and in addition to
their phagocytic functions, mast cells contribute to the regulation of vasodilation by releasing
factors such as histamine, prostaglandin D2, vascular endothelial growth factor (VEGF), and
TNF-α. Resting mast cells constitutively produce the serine protease, tPA, which is an initiator
of fibrinolysis, without producing its counterbalance, PA inhibitor 1 (PAI-1) [22]. However, in
vitro studies have shown that in the presence of C5a, mast cells begin producing more PAI-1
than tPA, switching from a pro-fibrinolytic state to an anti-fibrinolytic state [23]. Finally,
components of the complement pathway can also increase coagulation by inhibiting regulators of
the coagulation cascade. The C4b-binding protein (C4BP), a component of the classical
complement pathway, can bind to Protein S, a cofactor of the Protein C anticoagulant pathway.
This binding decreases the availability of Protein S to be used as a cofactor in the Protein C
pathway [24].
1.4 ANTICOAGULATION IN ECMO
Because blood contact with the foreign surface of the ECMO circuit results in rapid thrombin
formation, the natural anticoagulation processes are quickly overwhelmed, resulting in the need
for systemic anticoagulation. Due to its widespread use during CPB and invasive vascular
procedures, heparin is the predominant anticoagulant used during ECMO. Heparin functions as
an anticoagulant by binding to the primary blood coagulation regulator ATIII with high affinity.

16
This induces a conformational change in ATIII, and increases its effective activity by 3-4 orders
of magnitude. Heparin is advantageous for ECMO since it can be administered intravenously,
has an immediate onset of action, and can be rapidly reversed by protamine if needed. Even
though the discovery of heparin changed the treatment of thrombosis, there continues to be
limitations associated with its use. For economical reasons, unfractionated heparin (UFH) is
usually used, with only about one third of the administered dose actually containing the active
heparin sulfate molecule to bind ATIII [25]. The remaining two-thirds of UFH has minimal
anticoagulant effects at a therapeutic dose. In addition, the remaining two-thirds seems to be the
portion of the heparin molecule that non specifically binds to platelets and cells leading to the
unpredictable nature of the dose-response relationship [25]. UFH heparin has a plasma half-life
of about 30 -150 minutes depending on the dose given and its effects not only vary between
individuals but also between specific age groups such as neonatal and pediatric patients. The
age-matched individual differences have been ascribed to non-specific endothelial and cell-
surface protein binding of heparin, while the age-dependent effects are believed to result from
differences in the levels and activity of various components of the blood between birth and
aproximately 6 months of age [26, 27, 28]. The anticoagulant activity of heparin is also limited
to factors that are not surface-bound and therefore has no effect on thrombin bound to fibrin and
FXa bound to a phospholipid surface [19]. Most importantly, with regards to ECMO, the use of
heparin may lead to significant bleeding complications that may result in the discontinuation of
ECMO. In some cases, heparin can lead to heparin-induced thrombocytopenia (HIT), which is a
serious concern for adult patients following prior exposure to heparin and requires alternative
anticoagulation therapies. If fractionated heparin, also called low molecular weight heparin
(LMWH) is used, it only comprises the active one-third of the heparin molecule. LMWH was

17
developed primarily because of its superior pharmacologic properties including having reduced
anti-IIa to anti-Xa ratio, more predictable anticoagulant response making monitoring of
anticoagulation easier, longer plasma half-life, and reduced incidence of HIT and osteopenia
[25]. Although there are reports on other anticoagulants used for patients on ECMO, it is beyond
the scope of this study and will not be discussed here.
1.5 MEASUREMENTS OF ANTICOAGULATION AND HEMOSTASIS
Activation of the hemostatic system includes the vessel wall, platelets, blood coagulation and
fibrinolysis. Some tests for monitoring anticoagulation and hemostasis are capable of monitoring
all of these components at once making it difficult to determine the underlying coagulopathy or
factor deficiency, or they only look at one specific part of the hemostatic system causing the
need for it to be used in conjunction with other tests. In an ideal patient undergoing
anticoagulation therapy, there would be no tissue damage or hypoxia,
thrombocytopenia/thrombocytosis, platelet dysfunction, and no coagulation factor deficiencies or
depletion of the naturally occurring anticoagulants. However, during ECMO it is not uncommon
that more than one of these confounding factors is also present, presenting a major challenge
when monitoring hemostasis. Despite the fact that there are many laboratory tests that can be
done to look at the hemostatic profile as a whole, this is not often done and more commonly
practitioners rely on a point of care (POC)/ bedside test due to its ease of use in the critical care
setting. These POC test may not be specific enough to detect potential clotting or bleeding
problems. Introducing more sensitive biomarkers to the battery of tests available to clinicians
may enable earlier detection of potential adverse events before they matriculate.

18
1.5.1 Activated Clotting Time
The activated clotting time (ACT) has been used as a bedside monitoring tool for adequate
ECMO anticoagulation because of its ease of use and long history in CPB patient management.
Although other devices exist, the Hemochron Junior is commonly the device used in the acute
critical care setting and it is capable of doing three common POC tests including the ACT+, the
ACT-LR, and the aPTT. In general, all of these POC tests use the same mechanism. A cartridge
contains an area where the whole blood sample is added and this blood can pass into one of two
channels. Blood (15 µL) passes into the test channel and the remaining blood into the waste
channel. The test channel contains an activator (see Table 1.4) that will promote blood
coagulation. The activated blood passes through a series of LED optical detectors that are
aligned with the test channel of the cuvette. The speed of the blood sample between detectors is
measured until the blood stops and the ACT is reported in seconds.
The ACT has previously been reported to exhibit a poor correlation with heparin
concentrations. Previous studies have shown weak to excellent correlations (ρ=0.38-0.98)
between the weight-normalized heparin dose or plasma heparin levels and ACTs [29, 30, 31].
However, for ACT values less than 225 seconds there appears to be no correlation between the
ACT and plasma heparin level (assessed by the anti-Xa assay) or the weight-normalized heparin
dose [32, 33]. This is important with respect to ECMO because most institutional protocols
maintain ACT values between 180 and 220 seconds, which may result in inadequate or over
anticoagulation [30]. Further, significant hemodilution of hemostatic factors, activation of the
hemostatic system, and activation of platelets occurs during ECMO and can affect whole blood
tests such at the ACT [29]. Thus, the inadequacy of ACTs to effectively indicate anticoagulation
status, particularly in neonatal and pediatric patients on ECMO, has increased the demand for an
19
alternative bedside anticoagulation test with an acceptable correlation to plasma heparin levels.
To address this, a modified version of the ACT, the ACT-LR (low range), was created with the
intended patient population being cardiac catheterization patients who require a milder state of
anticoagulation. The ACT-LR was designed to monitor low-moderate heparin dosages by having
a lower concentration of the same activators used in the traditional ACT, which is intended for
use in CPB because it monitors moderate or high heparin doses. However, some centers continue
to use the traditional ACT because they believe that it has a better reproducibility over time than
the ACT-LR.
Table 1.4 Point of Care Tests. The ACT+, ACT-LR, and aPTT were each designed to detect different heparin doses
based on the activator used in each test.
ACT+ ACT-LR aPTT
Intended to Monitor Moderate- High Heparin dose (1-6
IU/ml)
Low-Moderate Heparin dose (0-2.5
IU/ml)
Low Heparin dose (0-1.5 IU/ml)
Used in CPB ECMO & Critical Care
ECMO & Critical Care
Activators Silica, kaolin, phospholipid
Lower concentration silica, kaolin, phospholipid
Glass, kaolin, phospholipid
1.5.2 Activated Partial Thromboplastin Time
Activated partial thromboplastin time (aPTT) is also used clinically as an alternative or
complimentary indicator to ACTs to test for adequate anticoagulation. A major drawback to the
aPTT test in critical care situations such as ECMO is the turnaround time for results since it is a

20
laboratory-based test. To address this, ITC introduced the POC aPTT. The POC aPTT was
designed for use in ECMO and critical care because of its ability to monitor small changes in low
heparin dosages due to the fact that it contains a weaker activator than both the ACT+ and the
ACT-LR (see Table 1.4). The POC aPTT uses a conversion table programmed into the
Hemochron Jr device to convert the whole blood POC aPTT to a plasma based lab aPTT. Since
this conversion assumes a healthy adult individual with normal platelet count (150,000/µL) and
normal coagulation factor levels, there will be discrepancies between the POC aPTT and the lab
aPTT when these conditions are not met.
It has been shown that there is little correlation between ACTs and plasma heparin levels
or ACTs with aPTTs. Several studies have shown a good linear correlation between the aPTT
and plasma heparin concentrations up to 2.0 units/ml [32, 34, 35]; however, one study did
demonstrate no correlation when specifically looking at pediatric patients treated for
thromboembolism [36]. This may be due to components of the coagulation cascade being
dependent on both gestational and postnatal age, resulting in infants having prolonged aPTT
values that do not reach adult values until 3 months [37]. The POC aPTT has been shown to have
varying correlation to the laboratory values, and is impacted by many factors including sampling
technique, sample size, operator variability, and variations in sample processing [31]. The
Hemochron Jr. whole blood POC PTT has previously been shown to correlate well (ρ=0.72) with
plasma heparin levels (measured by the anti-Xa assay) in pediatric cardiac catheterization
patients [38]. Caution should be taken when using the PTT as a sole indicator of anticoagulation
or when comparing the POC PTT to the lab PTT. Since the lab PTT measures the generation of
thrombin by the intrinsic pathway involving coagulation factors synthesized by the liver, patients
on ECMO with liver dysfunction or chronic inflammation would be more likely to have

21
inaccurate PTT values. It is not uncommon in the ECMO population for patients to be septic or
have some type of liver dysfunction. In addition, coagulation parameters constantly change over
the first few weeks to months of life. These parameters are dependent on postnatal age in
addition to gestational age resulting in infants having prolonged lab PTT values that do not reach
adult values until 3 months [37]. Vitamin K factor (II, VII, IX, X) deficiencies, contact factor
(XII, XI, PK, HMWK) deficiencies, as well as deficiencies in coagulation inhibitors (AT, Protein
C), are believed to cause the altered lab PTT values [37].
1.5.3 Antithrombin III
In addition to measures of the “clotting times”, measurements of the concentrations of particular
components of the clotting cascade can give insight into the relative production or breakdown of
these components, which can in turn be correlated to the coagulation state of the patient.
Antithrombin III (ATIII) irreversibly binds to and inactivates factors such as FXa, thrombin, and
FVIIa. Since the absence (or depletion) of ATIII limits the effectiveness of heparin-based
anticoagulation, it may be clinically important measure the ATIII levels of children on ECMO.
Measurements are made using a chromogenic assay to quantitatively determine ATIII levels in
plasma. Measurement of ATIII in the neonatal population has shown their levels are only 25% of
normal adult levels; suggesting a possible reason for poor correlation between plasma heparin
levels and measures of anticoagulation such as ACT and PTT [26, 28]. Some hospitals
continuously infuse ATIII in ECMO patients, while others monitor ATIII levels and give fresh
frozen plasma for reduced ATIII levels or concentrated ATIII for very low levels, while other
institutions do not even use the ATIII to assist in developing the coagulation profile of ECMO

22
patients. Depletion of ATIII during prolonged ECMO support may be responsible for the
procoagulant state seen in patients days after the initial activation period [39].
1.5.4 Prothrombin Fragment 1+2
F1+2 is one of the fragments generated during the cleavage of prothrombin to thrombin and can
be detected as a marker of thrombin generation. Although not FDA approved to be used
clinically, F1+2 is frequently used in the literature to study thrombin in many aspects of
medicine especially when investigating the hemostasis profiles in patient populations. Since this
test is not used clinically and there are no standard normal values established to determine
whether it is elevated, most studies use their own baseline F1+2 concentrations as a reference.
Few studies have examined the F1+2 levels in ECMO patients. Urlesberger et al. found in a
small study of 7 infants that F1+2 increased steeply in the first 2 hrs on ECMO followed by a
slow decrease [39]. Even though the F1+2 began decreasing after 2 hrs, the D-Dimer remained
high. They speculated that there were 2 possible reasons for the decreasing F1+2 despite a high
D-Dimer. First, the half-life of D-Dimer is much longer (9 hr) than the half-life of F1+2 (90
min), and second, that fibrin dependent fibrinolysis is responsible for the D-Dimer levels
remaining high [39].
1.5.5 D-Dimer
D-Dimer is a breakdown product of cross-linked fibrin, and has been used clinically as a marker
of fibrinolysis. A D-Dimer test can be used to indicate that significant clot formation occurred

23
resulting in an increase in fibrinolysis to breakdown the clot. D-Dimer can also be a sign of a
serious coagulation disorder called disseminated intravascular coagulopathy (DIC). Consumptive
coagulopathy or disseminated intravascular coagulopathy (DIC) seems to occur in ECMO
patients within the first 24 hours on ECMO. Consumptive coagulopathy occurs when you have
increased activation of the coagulation pathway resulting in intravascular fibrin deposition, and
depletion of coagulation proteins and platelets. This leads to 2 simultaneous events: bleeding and
clotting. Normal D-Dimer values are not only age dependent but also dependent on the test
method, meaning that normal values must be established for each lab. Pediatric D-Dimer normal
values have been established by our institution to be between 0 - 0.499 µg/ml, which agrees with
the results from other institutions [40], but no neonatal norms have been established.
Consideration needs to be taken when using D-Dimer to measure fibrinolysis and it should be
used in conjunction with other anticoagulation tests. High levels of D-Dimer are also seen with
elevated rheumatoid factor (as seen in rheumatoid arthritis), high triglycerides, lipedemia,
bilirubin and increased hemolysis.
Compared to adults, healthy, non-stressed neonates have been shown to have higher
levels of D-Dimer within the first 24 hours of life, with stressed neonates having an even higher
increase in thrombin generation [41, 42]. During the first 2 hours of ECMO, D-Dimer levels
increase drastically accompanied by an increase in thrombin-antithrombin levels, low fibrinogen
levels and low platelet counts, which can be interpreted as consumptive coagulopathy [39].
Tests indicative of DIC would include a prolonged PTT (due to consumption of coagulation
proteins), decreased fibrinogen (due to its conversion to fibrin), increased D-Dimer (due to the
increased fibrinolysis from an increase in clot formation), and a decreased platelet count (due to
consumption of activated platelets within the clot). Although the consumptive coagulopathy

24
seems to improve after 24 hours, D-Dimer levels remain high for 48 hours before returning to
baseline [39]. It has been suggested that the increase in D-Dimer in children on CPB is a result of
tissue damage and/or inadequate anticoagulation [29].
1.5.6 S100β
The most serious end organ outcome resulting from bleeding/clotting complications in pediatric
ECMO patients is brain damage. However, current diagnostic tools (e.g. CT scan, MRI, and
ultrasound) only detect serious infarction or hemorrhage. Therefore, a sub-clinical marker of
brain injury may be useful as an early measure of organ injury to initiate corrective action before
irreversible damage occurs and to guide anticoagulation management. S100β has been proposed
as an early marker for brain damage. This protein is not normally found in the plasma prior to
stroke, subarachnoid hemorrhage, head injury or CPB [43]. S100β levels > 0.5 ng/mL are
considered pathological in the adult population [44]. Previous studies have shown that detectable
levels of S100β occur with the start of CPB in adults, and peak at CPB termination [45].
Conversely, coronary bypass or thoracic surgery without CPB does not increase S100β levels
[44, 46]. Neonates and children younger than 8 years may have detectable levels of S100β
protein in the blood prior to CPB without neurological damage (neonates can have S100β levels
up to 2 ng/mL prior to CPB, and children can have levels up to about 1 ng/mL) [47]. It is
hypothesized that this may be due to the fact that young children have a less selective blood-
brain barrier combined with a high protein turnover in neural cells and decreased renal excretion
[43, 47].

25
1.5.7 Platelet Activation
As previously described, platelet activation occurs when blood comes into contact with the
foreign surface of the ECMO circuit. Platelets become activated, release granules, and express
adhesion molecules such as P-selectin (CD62P) and CD63 [48]. Structural and functional
changes have been reported in both the adult and pediatric population during CPB. However, our
knowledge of platelet activation and dysfunction is more limited in the neonatal and pediatric
ECMO population. In the adult CPB population platelets have been shown to have increased
activation within minutes of the initiation of CPB and decreased responsiveness to ADP and
collagen [49]. It has been shown that the platelets of adult CPB patients have an increased
expression of P-selectin/CD62P [50]. P-selectin has been shown to increase in the first 5 minutes
of CPB and peak at 120 minutes with activation 1.4 times greater than pre-CPB levels [50, 51]. It
has been suggested that there may be a limit of P-selectin expression in the adult CPB
population, because platelet activation is minimal, or that activated platelets are being removed
from circulation, either by adhesion to the CPB circuit or in the lungs/spleen [50]. It has also
been suggested that platelet-leukocyte aggregates are a more sensitive marker of platelet
activation than P-selectin due to the fact that once platelets have degranulated, they may rapidly
lose their surface P-selectin causing them to be undetected in circulation despite activation [52].
In patients who suffered from an acute myocardial infarction Michelson et al. showed that
monocyte-platelet aggregates were a more sensitive marker of platelet activation than P-selectin
[53].
In the neonatal CPB population, platelets have been shown to be hyporeactive in infants
less than 2 months undergoing CPB when compared to children older than 12 months. The
reason for this may be that platelets undergo an age-dependent maturation process that includes

26
less pseudopods, smaller glycogen deposits, less visible microtubular structures and less α-
granules [48]. In a study by Robinson et al., platelet aggregation was studied in the newborn
ECMO population using ADP, collagen, and ristocetin with time points pre-ECMO, the first few
hours on ECMO, then 1 and 8 hours after coming off ECMO. There was no decrease in the
ability of platelets to respond to collagen at any point during this study, but within 15 minutes on
ECMO the platelet response to ADP and ristocetin decreased [49]. In addition, there was no
change in surface expression of platelet glycoprotein Ib or IIIa by flow cytometry [49]. In this
study, we sought to investigate the neonatal and pediatric ECMO population, not only in terms of
platelet response to agonist (ADP), but also platelet activation by using P-selectin.

27
2.0 PATIENTS AND METHODS
Given the current understanding of hemostatic alternations in pediatric and neonatal ECMO, we
sought to evaluate such alterations and compare the observed parameters to a group of pediatric
patients undergoing CPB for non-emergent cardiac surgery. To accomplish this objective, we
utilized a prospective observations study to evaluate in these groups the activation of specific
coagulation factors, platelet activation and response to agonists, and markers of organ
dysfunction and early neurologic injury during ECMO and CPB.
2.1 PATIENT CRITERIA AND CIRCUIT SET-UP
This prospective study was approved by University of Pittsburgh Institutional Review Board and
written informed consent was obtained from the parents of all participants. All children receiving
ECMO for respiratory and/or cardiac failure were eligible for the study. Patients unable to
separate from CPB or receiving ECMO within 48 hours of CPB were excluded due to prior
exposure to heparin. Blood samples were taken prior to support (baseline), then at 4, 12, 24, and
every 72 hours until the discontinuation of ECMO. Data was also collected from children
undergoing elective cardiothoracic surgery (requiring CPB) to serve as population controls.
Blood samples from these patients were taken prior to support, post CPB, and 24 hours post-

28
operatively. Blood product administration was also recorded for each time point and normalized
according to the weight of the patient.
Patients in the ECMO group were supported by a roller pump (Stockert-Shiley S3, Sorin
Group), with either 3/8” or 1/4” diameter tubing and an oxygenator. The decision to use the 3/8”
circuit was based on patient weight (> 11.0 kg). The 1/4” circuit consisted of Carmeda® coated
tubing and hollow fiber oxygenator (Minimax®, Medtronic), whereas the 3/8” circuit consisted
of either Carmeda® bonded circuit with Affinity® hollow fiber oxygenator (Medtronic) or a
SafelineTM bonded circuit with Quadrox D® non-porous diffusive membrane oxygenator
(Maquet). Each 1/4” circuit was primed with 700 mL crystalloid solution with 1 unit of leuko-
reduced packed RBCs (pRBCs), 30 mL Tromethamine (Tham®) and 10 mL NaHCO3 (volumes
proportional to units of pRBCs used). A loading dose of heparin (50 U/kg) was given prior to
cannulation to achieve an ACT > 300 sec. All patients were cannulated through the internal
jugular vein and common carotid artery. Following initiation of support, a continuous heparin
infusion (Unfractionated heparin, APP Pharmaceuticals) was started when the ACT was < 220
seconds and titrated to maintain an ACT of 160-200 seconds. During ECMO support, platelets
and hematocrit were kept >100,000/cm3 and 30%, respectively, through blood, FFP, and
cryoprecipitate transfusions.
Patients in the CPB group were induced with sevoflurane and maintained with isoflurane,
fentanyl, midazolam and rocuronium. The bypass circuit and perfusion protocols were performed
according to established institutional practices as described by Manrique et al [54].

29
2.2 BLOOD COLLECTION & ASSESSMENT OF CLOTTING TIMES
Baseline blood samples were collected from central venous or arterial access lines. Blood
samples taken following initiation of ECMO or CPB blood were collected from a pre-heparin
port on the circuit. All blood samples were 10 ml and were collected in 1.8 or 2.7 ml vacutainers
containing 3.2% (0.109M) sodium citrate (Becton Dickenson, Franklin Lakes, NJ).
Point-of-care (POC) ACTs and aPTTs (Hemochron Jr ®, International Technidyne
Corporation), laboratory aPTTs (Diagnostica Stago), and weight normalized heparin
administration were recorded throughout support and compared to plasma heparin levels
measured by chromogenic anti-Xa determination (STA®-Rotachrom® Heparin kit, Diagnostica
Stago).
2.3 ASSESSMENT OF PLASMA MARKERS
Plasma for immunoassays was extracted by centrifugation of blood samples at 2,000 x g for 15
minutes and stored at -80°C. Specific markers for activation of the clotting system were also
measured: F1+2 (Enzyme-linked immunosorbant assay, Siemens), D-Dimer (Immuno-
Turbidimetric Assay, Diagnostica Stago), and ATIII (Colorimetric Assay, Diagnostica Stago). In
addition, serum S100β levels were also measured as a sub-clinical marker of brain injury (S100
enzyme-linked immunosorbant assay, International Point of Care). All assays were conducted
according to manufacturer’s specifications.

30
2.4 ASSESSMENT OF PLATELET ACTIVATION AND AGGREGATION
Whole blood (5 µL) was transferred from sodium citrate Vacutainers into 12 x 75 mm
polystyrene tubes (Falcon, Becton Dickinson) and incubated with 10 µL of each of the
monoclonal antibody combinations: CD42b-FITC mixed with CD62P-PE and CD42b-FITC
mixed with IgG1 Isotype Control-PE (BD Biosciences), and 25 µL of Phosphate Buffered Saline
(PBS, Lonza) with 1% Bovine Serum Albumin (BSA, Fraction V, Sigma). Platelet activation
was also assessed after stimulation with adenosine diphosphate (ADP). These samples were
prepared as above with 5 µL of 200 µM ADP (EMD Biosciences), 5 µL of 20 mM glycine-
proline-arginine-proline (GPRP, Anaspec) to inhibit fibrin polymerization, and 15 µL of PBS
with 1% BSA (incubation buffer). All samples were incubated for 20 minutes in the dark with
occasional gentle mixing. After incubation, samples were washed with 1 mL of PBS with 1%
BSA buffer, centrifuged at 400 x g for 10 minutes, and fixed with 500 µL of 1%
paraformaldehyde. Fixed samples were refrigerated at 4°C and analyzed by flow cytometry
within 24 hrs. Platelets were identified by their characteristic forward scatter (FSC) and CD42b
expression by a FACScan flow cytometer (Becton Dickinson) and a gate was set to collect 5000
single platelet events. Activation was defined by setting a threshold at 2% isotype control
expression, a standard flow cytometric technique.
2.5 ASSESSMENT OF GRANULOCYTE-PLATELET AGGREGATES
As described above, whole blood (100 µL) was incubated with 10 µL of each of the monoclonal
antibody combinations: CD42b-FITC/CD16-PE and IgG1 Isotype Control-FITC/CD16-PE (BD

31
Biosciences) and 80 µL of incubation buffer for 20 minutes in the dark with occasional gentle
mixing. Following incubation, 2 mL of ACK buffer was added to lyse the RBCs. Samples were
centrifuged at 400 x g for 10 min, and washed and fixed as described above. Ten thousand GPA
(identified by their FSC and CD16 expression) events were collected. The threshold for
granulocytes binding platelets was defined by setting a threshold at 2% isotype control
expression. Granulocyte-platelet aggregates were similarly measured with CD16 population that
was also positive for CD42b.
2.6 DATA & STATISTICAL ANALYSIS
Since it has been well documented that the neonatal plasma is deficient in many coagulation
factors and inhibitors [35], and that neonatal platelets are hyporeactive [46], relative to pediatric
patients, the figures and statistical analysis were split into these groups as well as the CPB group.
Samples were collected until the end of ECMO. However, after 6 days on ECMO, the number of
patients decreased to less than half of the sample population, and therefore only data within the
first 6 days is presented.
ACT, lab PTT, POC PTT, and anti-Xa were analyzed using Spearman’s ranked
correlation statistics (SPSS v18.0). POC PTTs that were greater than 250 sec and lab PTTs that
were greater than 200 sec were excluded from the analysis as they were determined to be out-of-
range by the measuring devices. CPB patient data was also excluded from the POC analysis
since the heparin dose given during CPB was so much greater than ever used in ECMO. Some
other limitations of the tests used included anti-Xa levels <0.10 IU/ml, which were given the
value 0.09 IU/ml, D-Dimer levels <0.22 µg/ml which were given the value 0.21µg/ml, D-Dimer

32
> 20 µg/ml were given the value 21 µg/ml to be conservative. Therapeutic institutional norms for
anti-Xa were established to be between 0.35 and 0.70 IU/ml. Pediatric D-Dimer normal values
were established by our institution to be between 0 - 0.499 µg/ml in accordance with other
institutions [37], but no neonatal norms have been established. D-Dimer values < 0.21µg/ml
were only seen in CPB patients, and values >20 µg/ml were only seen in the ECMO population.
Surprisingly, 2/3 of our anti-Xa values for ECMO patients only were less than 0.10 IU/ml. ATIII
levels never fell out of range, and F1+2 and S100β were diluted to fall within range of the
standard if needed. All tests were repeated if the coefficient of variance between the duplicate
samples were >15% except in the bedside tests because they were not run in duplicate. Due to
the fact that the groups were considered independent from each other and the data is not
normally distributed, Mann-Whitney rank sum was used and all data are presented as median and
IQ range (25%-75%).

33
3.0 RESULTS
Blood samples were collected from 22 ECMO patients (3 cardiac, 19 respiratory). Fourteen
patients were neonates (<30 days) while the remaining eight were pediatric patients (30 days –
18 years). The ECMO group was younger, weighed less, and had a lower body surface index
compared to the CPB control group, as shown in Table 3.1.
Table 3.1. Patient Demographics

34
Reasons for ECMO cannulation are shown in Figure 3.1 and included pulmonary
hypertension (n=8), infectious respiratory disease (n=5), heart failure (n=3), congenital
diaphragmatic hernia (n=3), and acute respiratory failure (n=3). The reason for the unequal
distribution of cardiac and respiratory cases was the inability to obtain a baseline sample from
the cardiac population. Reasons for CPB cannulation are shown in Figure 3.2 and include atrial
septal defect (n=6), atrial septal defect/ventricle septal defect (n=5), right outflow tract
obstruction (n=4), and other conditions requiring elective cardiac surgery (n=3).
Figure 3.1. Diagnosis for ECMO Patients

35
Figure 3.2 Diagnosis for CPB Patients
Blood product administration was also recorded for each time point and then normalized
according to the weight of the patient. The majority of the blood products- fresh frozen plasma
(FFP), platelets, and packed RBCs- were administered in the beginning of ECMO and
administration decreased as time on ECMO increased (Table 3.2).

36
Table 3.2 Blood Product Administration (mL blood products/ kg patient/ hr)
Blood Product (mL/kg/hr) 0-4 hrs 4-12 hrs 12-24 hrs 24- 72 hrs 72- 144 hrs
Cryoprecipitate 0 0 0.45 ± 0.09 0.13 ± 0.08 0.16 ± 0.14 FFP 4.38 ± 1.55 2.38 ± 0.85 1.36 ± 0.40 0.41 ± 0.26 0.27 ± 0.14
Platelets 3.35 ± 1.25 2.44 ± 1.54 1.14 ± 0.48 0.82 ± 0.58 0.88 ± 0.43 pRBCs 3.73 ± 2.78 1.91 ± 1.25 0.95 ± 0.29 0.53 ± 0.42 0.60 ± 0.46
In terms of bedside testing the ACT had no correlation to plasma heparin levels
(r=-0.016; p=0.44), while the lab PTT and POC PTT had a weak correlation to plasma heparin
levels (r=0.44 and r=0.31 respectively) with p<0.001 as shown in Table 3.3.
Table 3.3 Point of Care Testing: Spearman Correlation

37
Antithrombin III concentration for the ECMO population was low at baseline when
compared to the mean normal neonatal (39-87 µg/ml) and pediatric (80-120 µg/ml) ATIII
concentrations for our institution. In fact, when comparing the baseline ECMO patient average to
the CPB patient average, the CPB patient had over 2 times greater ATIII concentration (Figure
3.3). The initiation of CPB resulted in a significant (p< 0.001) decrease in ATIII from baseline,
while the initiation of ECMO did not. Twenty four hours post support, ATIII levels returned to
baseline for the CPB population whereas in the ECMO population the values remained low
despite FFP infusions in both groups. Comparing the neonatal and pediatric ECMO population
there is a significant difference between the 2 age groups at baseline, then at 24 hours, 72 hours,
and 144 hours (Figure 3.4).

38
Figure 3.3: Antithrombin III Levels Comparing ECMO and CPB Patients at baseline, 4 hours post-cannulation and
24 post-op (CPB) or 24 hours on ECMO. Mann-Whitney Rank Sum: Presented at Median and IQ Range (25%-
75%)..
39
Figure 3.4 Antithrombin III Levels Comparing Neonatal and Pediatric ECMO Patients. Mann-Whitney Rank Sum:
Presented at Median and IQ Range (25%-75%).
D-Dimer concentration was elevated in the ECMO population prior to cannulation and
did not significantly change at 4 hours, but peaked at 24 hours (p<0.05) as shown in Figure 3.5.
The CPB population had low D-Dimer levels prior to cannulation, and at 4 hours, which
increased at 24 hours (p<0.002). When comparing the neonatal and pediatric age groups, there
were no significant changes in D-Dimer levels between any of the pediatric patients at any time.
However, each hour except 4 hours post-cannulation was significantly higher (p values ≤ 0.05 as
shown in Figure 3.6) than baseline in the neonatal ECMO population.

40
Figure 3.5 D-Dimer Levels Comparing ECMO and CPB Patients at baseline, 4 hours post-cannulation and 24 post-
op (CPB) or 24 hours on ECMO. Mann-Whitney Rank Sum: Presented at Median and IQ Range (25%-75%).

41
Figure 3.6 D-Dimer Levels Comparing Neonatal and Pediatric ECMO Patients. Mann-Whitney Rank Sum:
Presented at Median and IQ Range (25%-75%).
The F1+2 thrombin generation baseline levels were higher in the ECMO population than
the CPB population (p=0.002) as shown in Figure 3.7. At 4 hours, there was no difference
between the ECMO and CPB group, nor was there a significant change from baseline in either
group. The ECMO patients had higher thrombin levels than CPB patients at 24 hours (p=0.002),
but not significantly higher than baseline. At 24 hours, the CPB patients experienced higher
thrombin levels than at baseline or 4 hours (p=0.003). After 4 hours on ECMO, neonatal patients
had significantly higher thrombin levels from baseline, whereas the pediatric patients did not
(Figure 3.8).

42
Figure 3.7 F1+2 Levels Comparing ECMO and CPB Patients at baseline, 4 hours post-cannulation and 24 post-op
(CPB) or 24 hours on ECMO. Mann-Whitney Rank Sum: Presented at Median and IQ Range (25%-75%).

43
Figure 3.8 F1+2 Levels Comparing Neonatal and Pediatric ECMO Patients. Mann-Whitney Rank Sum: Presented at
Median and IQ Range (25%-75%). Significant differences were found between neonatal time indices.
Platelet activation was similar for the ECMO and CPB groups prior to cannulation, but at
4 hours the CPB patients experience higher platelet activation as shown in Figure 3.9 (p=0.001)
and Figure 3.10 (p<0.05). At 24 hours, the CPB group continues to have higher platelet
activation than the ECMO group, but still not significantly higher than baseline as shown in
Figure 3.9 (p<0.05). Comparing the ECMO subgroups, there didn’t appear to be a difference
between the neonatal and pediatric children on ECMO (Figure 3.11 and Figure 3.12). When
platelets were stimulated with ADP, CPB patients maintained a higher percent of functional
platelets than did the ECMO patients at baseline, 4 hours, and 24 hours (p<0.05) as shown in

44
Figure 3.13. There did not appear to be a difference in platelet activation between the neonatal
and pediatric ECMO groups (Figure 3.14). Therefore, in terms of platelet activation and
dysfunction, CPB patients had more percent platelet activation and more functional platelets as
compared to the ECMO group, and there did not appear to be a difference between the neonatal
and pediatric ECMO patients in either platelets activation or functionality.
Figure 3.9 Percent Platelet Activation (using P-selectin) Comparing ECMO and CPB Patients at baseline, 4 hours
post-cannulation and 24 post-op (CPB) or 24 hours on ECMO. Mann-Whitney Rank Sum: Presented at Median and
IQ Range (25%-75%).

45
Figure 3.10 Percent of Granulocytes Positive for CD42b (Granulocyte-Platelet Aggregates) Comparing ECMO and
CPB Patients at baseline, 4 hours post-cannulation and 24 post-op (CPB) or 24 hours on ECMO. Mann-Whitney
Rank Sum: Presented at Median and IQ Range (25%-75%).

46
Figure 3.11 Percent Platelet Activation (using P-selectin) Comparing Neonatal and Pediatric ECMO Patients.
Mann-Whitney Rank Sum: Presented at Median and IQ Range (25%-75%).
Figure 3.12 Percent of Granulocytes Positive for CD42b (Granulocyte-Platelet Aggregates) Comparing Neonatal
and Pediatric ECMO Patients. Mann-Whitney Rank Sum: Presented at Median and IQ Range (25%-75%).

47
Figure 3.13 Percent Platelet Activation with ADP Stimulation Comparing ECMO and CPB Patients at baseline, 4
hours post-cannulation and 24 post-op (CPB) or 24 hours on ECMO. Mann-Whitney Rank Sum: Presented at
Median and IQ Range (25%-75%).

48
Figure 3.14 Percent Platelet Activation with ADP Stimulation Comparing Neonatal and Pediatric ECMO Patients.
Mann-Whitney Rank Sum: Presented at Median and IQ Range (25%-75%). Significant differences were not found
between neonatal and pediatric ECMO groups except at 144 hours.
In this study prior to support, children going on ECMO had significantly higher S100β
levels than CPB patients (p=0.007) as shown in Figure 3.15. At 4 hours, there was no difference
between the ECMO and CPB groups, but the CPB patients had increased S100β levels from
baseline (p<0.001). At 24 hours, S100β levels in CPB patients returned to baseline, significantly
lower than the ECMO patients (p<0.001). Unlike other studies, when we separated out the
neonatal and pediatric ECMO patients who did not experience an intraventricular hemorrhage
(IVH), there were no differences between groups, nor were there differences as the time on
ECMO increased (Figure 3.16). In this study, only one patient experienced an IVH. In Figure
3.17, this patient was separated and compared to the age-matched pediatric ECMO group. The
S100β concentration for this patient was higher than the age-matched pediatric ECMO group

49
who did not incur neurologic damage. It should be noted here that it is our institutional practice
to perform a head ultrasound every 2 days, and that the ultrasound did not pick up the IVH until
Day 21 on ECMO despite increased S100β levels from 24 hours and on.
Figure 3.15 S100β Levels Comparing ECMO and CPB Patients at baseline, 4 hours post-cannulation and 24 post-
op (CPB) or 24 hours on ECMO. Mann-Whitney Rank Sum: Presented at Median and IQ Range (25%-75%).
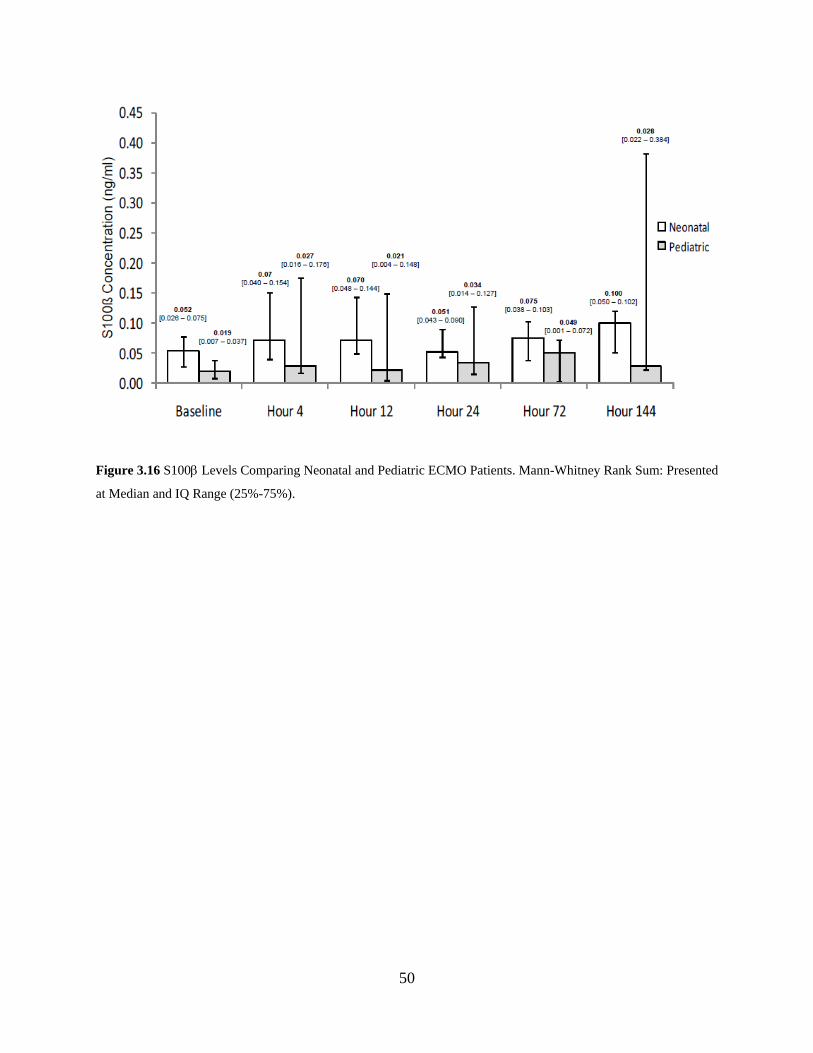
50
Figure 3.16 S100β Levels Comparing Neonatal and Pediatric ECMO Patients. Mann-Whitney Rank Sum: Presented
at Median and IQ Range (25%-75%).

51
Figure 3.17 S100β levels comparing one patient who experienced an intraventricular hemorrhage to an age-matched
ECMO group (n=1 vs. n=8) ± standard deviation. The head ultrasound was performed every 2 days and the IVH was
not detected until 504 hours on ECMO.

52
4.0 DISCUSSION
In this relatively small, controlled study evaluating differences in hemostatic values for children
who require ECMO compared to those undergoing elective repair of septal defects, we
demonstrated that children requiring ECMO had significantly lower ATIII concentrations,
increased D-Dimer concentrations, and that F1+2 thrombin generation increased substantially
during the first 24 hrs. Antithrombin III was low, not only prior to ECMO support, but
throughout support despite FFP and sometimes concentrated ATIII transfusions. Since ATIII is
the primary blood coagulation regulator and the target of heparin, ATIII insufficiency is a likely
cause of “heparin resistance”. It has been documented that heparin resistance is common (10-
20%) during CPB and hypothesized that ATIII deficiency is most likely the cause of this
resistance [55]. Traditionally, heparin dose is increased in response to suspected heparin
resistance; however this will not only be ineffective in managing the heparin resistance but may
also lead to an increase in thrombosis formation [55]. Inadequate anticoagulation secondary to
low levels of ATIII, regardless of etiology may be partially responsible for fibrin generation and
subsequent fibrinolysis, and should be considered an important component to monitor during
ECMO. Taken collectively with increased baseline D-Dimer and F1+2 in the ECMO population,
our study validates the suggestion by Urlesberger et al. that ECMO fits the pattern of
consumptive coagulopathy; however, we did not see the improvement in consumptive
coagulopathy after 24 hours as they did; rather, ATIII remained low, and D-Dimer and F1+2

53
remained high throughout the course of ECMO. In the Urlesberger et al. study a continuous
ATIII infusion (73 ± 10 IU/kg/24 hours) was administered to maintain stable ATIII levels (0.63
± 0.12 IU/mL). Fibrinogen concentrate and FFP was also administered to maintain fibrinogen
levels greater than 0.8 gm/L, whereas in this study ATIII was not continuously infused and FFP
was only given per clinician discretion (average of 8.07 ± 1.73 mL/kg/24 hours). This supports
the hypothesis that ATIII deficiency may be contributing to the prolonged consumptive
coagulopathy state.
The ECMO population had significantly less platelet activation than the CPB group in the
first 24 hours of the beginning of ECMO. The platelets of ECMO patients were also less
activated following stimulation with ADP as compared to the CPB group, including the baseline
sample. The fact that the platelets had less ability to become activated by ADP in the ECMO
group as compared to the CPB group suggests that it may be a combination of both decreased
platelet functionality due to the underlying disease state of the child (especially at baseline) and
adhesion of functional platelets to the circuit. This is supported by Weerasinghe et al. who
suggested that the decreased P-selectin expression during CPB may be due to minimal platelet
activation or removal of activated platelets from circulation, either by adhesion to the CPB
circuit or in the lungs and spleen [50]. In the CPB group, it is difficult to ascertain whether the
increased platelet activation is due to the high shear stresses encountered during CPB (including
mechanical activation of platelets through the cardiotomy reservoir and the use of suction or the
surgical procedure), or whether the preserved functionality of the platelets (from healthier pre-
operative CPB patients) is allowing them to become more activated when compared to the
ECMO group. Additionally, there may be increased platelet deposition in ECMO (as noted
above) leaving less functional platelets to circulate. Unlike other studies [48] who have shown

54
that the platelets of infants undergoing CPB are hyporeactive when compared to older children,
when we separated the neonatal from the pediatric patients, there was no difference between the
age groups when using P-selectin or granulocyte platelet aggregates as well as no difference in
the ability to become activated with ADP between the age groups. As time on ECMO increases,
platelet activation does not appear to increase either. This may be due to the rapid deposition of
platelets to the circuit within the first few minutes as previously described [7].
We further demonstrated that the current standard practice of monitoring only ACTs may
not be sufficient in monitoring anticoagulation during ECMO. All cumulative anticoagulation
tests failed to correlate well with plasma heparin levels. The ACT is used exclusively in 80% of
the 81 active neonatal ECMO centers and showed no correlation to plasma heparin levels [13].
The aPTT on the other hand demonstrated a mild correlation to plasma heparin levels. It should
be noted here that the lack of a strong correlation with plasma heparin levels does not preclude
their use as an effective anticoagulation test. The ACT, which uses a more potent stimulant of
coagulation, is designed to give an essentially binary indication of anticoagulation, which
includes coagulation factor levels, platelet activation and dysfunction, and plasma heparin levels.
Despite the lack of strong correlation, the POC aPTT showed better correlation to plasma
heparin levels than the ACT. This may be due to the weaker stimulant used in the POC aPTT
cartridge allowing for a more sensitive indication of heparin dose. Although not a bedside test,
the laboratory measures of aPTT had the highest correlation to plasma heparin levels. This is
useful since the turnaround time on the lab aPTT is not as long as some of the other laboratory
hemostatic tests. The lab aPTT utilizes only plasma as opposed to whole blood, and are therefore
independent of platelets. Therefore correlating these tests with each other (the POC a PTT and
the lab aPTT), or simply with the plasma heparin levels may be difficult if platelet

55
activation/dysfunction and coagulation factor deficiencies are present as in patients on ECMO.
These tests should be used in tandem and with other clinically available tests (e.g. ATIII, D-
Dimer) presented here in order to examine the entire hemostatic profile of the patient.
We assume that the presence or absence of “neurologic injury” is the ultimate
observational outcome. The low incidence of neurological insult in this study makes it difficult
to draw conclusions with regard to outcomes; however, we did demonstrate that ECMO patients
have higher S100β levels when compared to CPB patients prior to cannulation, but that the start
of CPB increases S100β whereas ECMO does not. Similarly to adults, S100β levels peak at CPB
termination [45] and then decrease by 24 hours post cannulation. Although neonates and children
may have detectable levels of S100β prior to CPB [47], we did not find a difference between the
two groups. The neonatal patients did exhibit higher levels of S100β, but it was not statistically
significant nor did it reach a pathological level (>2 ng/mL). This may be because neonates have a
less selective blood brain barrier, increased neural cell turnover and decreased renal excretion
causing a artificially high level of S100β in the plasma without neurological damage [43, 47], or
that low S100β levels throughout ECMO were indicative of preserved neurological function.
Only one patient throughout the study developed any documented neurological damage. Head
ultrasounds were performed on our patients every 2 days while on ECMO and one patient
developed an IVH (detected by ultrasound) 21 days (504 hours) after the initiation of ECMO.
When the S100β levels of this patient were age matched to the other ECMO pediatric patients in
this study who did not develop an IVH, it was found that the S100β levels were 37 times higher
than the age matched group and above the pediatric pathological level (>1 ng/mL) at least 15
days prior to detection by the ultrasound. Despite the low incidence of neurological insult, and
given the evidence cited in this paper and throughout literature, it appears that the S100β may

56
still be a useful tool in the early detection of neurologic damage for children in both the ECMO
and CPB population.
From this study, we suggest that the ECMO patient is in a state reflective of ongoing
hemostatic activation prior to cannulation with high thrombin generation and fibrinolysis, low
ATIII levels, and dysfunctional platelets. Further, we found that this state does not seem to
improve while on ECMO. CPB activates more platelets, but produces less thrombin and
fibrinolysis; this is most likely due to the high heparin dose, higher level of ATIII, and overall
decreased severity of illness. Furthermore, this study validated other reports that weak
correlations exist between clotting time (ACT) and heparin dose or heparin levels [32,33]
illustrating the need for a cadre of assays to understand and monitor the function of the
hemostatic system during pediatric ECMO. The use of other hemostatic tests, such as aPTT,
ATIII, and anti-Xa may reduce the incidence of bleeding and thromboembolic events during
ECMO.
This study was based on the observation that bleeding and thromboembolism remain
significant co-morbidities associated with ECMO despite attempts to effectively anticoagulate
the patient. Prior to this study, patients in the neonatal and pediatric intensive care units, like
most ECMO centers, were monitored almost solely by the ACT to determine anticoagulation
status of the patient. The goal of this study was to not only explain the hemostatic profile of the
ECMO patient, but also illustrate other assays that could be used alongside the POC tests to
develop a better understanding of the hemostatic system as a whole. As a consequence of the
patient population, there are some limitations of the study. First, this study attempted to age-
match the ECMO and CPB patients; however, during the two years of patient enrollment, all of
the patients undergoing elective CPB were in the pediatric age group and significantly older,

57
while the majority of patients undergoing ECMO were neonatal patients (70%). Another
important limitation of this study is the multiple comparisons made in clinical studies, which
increases the likelihood that the data is found significant by chance (type I error). It is important
to keep in mind that when a p-value approaches the upper limit of being statistically significant
(α = 0.05), there is less confidence that the difference did not occur by chance alone. While the
Bonferroni correction can account for this discrepancy, this correction was not performed in this
study due to the low number of multiple comparisons being made. Another limitation is the
relatively low number of participants in each group, which could fail to reveal significant
differences (type II error). While other clinical studies may be able to enroll many patients
across different institutions and centers for common procedures, ECMO is reserved for the
sickest patient population which limits the potential study enrollment pool. For future work, in
order to determine a better statistical relationship between the ECMO and CPB group and
between age groups within the ECMO population, a higher N is needed in each of the groups
which would require a longer time of patient enrollment than was available for this project, or
the inclusion of other medical centers. Other metrics may also be required, including length of
stay, outcomes, severity of illness, and individual measures of other organ function to stratify
these patients.

58
BIBLIOGRAPHY
1. Stiller B, Benk C, Schlensak C. Mechanical cardiovascular support in infants and children. Heart 2011; 97: 596-602.
2. ECLS Registry Report. Ann Arbor, MI: Extracorporeal Life Support Organization, 2011.
3. Lequier L. Extracorporeal life support in pediatric and neonatal critical care: a review. J Intensive Care Med 2004; 19:243-58.
4. Zaidi TN, McIntire LV, Farrell DH, Thiagarajan P. Adhesion of platelets to surface-bound fibrinogen under flow. Blood 1996; 88: 2967-2972.
5. Sheppeck RA, LoGerfo FW. Blood and Biomaterials. Implantation Biology: The Host Response and Biomedical Materials. Boca Raton FL: CRC Press, 1994
6. Kumar V, Abbas AK, Fausto N, Mitchell RN. Robbins Basic Pathology. pp 89-90, Philadelphia: Saunders Elsevier 2007.
7. Colman RW. Platelet and neutrophil activation in cardiopulmonary bypass. Ann Thorac Surg 1990; 49: 32-34.
8. Colman R. Surface-Mediated Defense Reactions: The Plasma Contact Activation System. J. Clin Invest 1984; 73: 1249-1253.
9. Bauer KA, Kass BL, Cate HT, Hawiger JJ, Rosenberg RD. Factor IX is activated in vivo by the tissue factor mechanism. Blood 1990; 76: 731-736.
10. Tracy PB, Rohrbach MS, Mann KG. Functional Prothrombinase Complex Assembly on Isolated Monocytes and Lymphocytes. J Bio Chem 1983; 258: 7264-7267.
11. Cesarman-Manus G, Hajjar KA. Molecular mechanisms of fibrinolysis. British J Haematology 2005; 129:307-321.
12. Walker J, Nesheim M. The molecular weights, mass distribution, chain componsition, and stricture of soluble fibrin degradation products released from a fibrin clot perfused with plasmin. J Bio Chem 1999; 274:5201-5212.

59
13. Downard CD, Betit P, Chang RW, Garza JJ, Arnold JH, Wilson JM. Impact of Amicar on Hemorrhagic Complications of ECMO: A Ten-Year Review. J Ped Surg 2003; 38:1212-1216.
14. Esmon CT. The Protein C Pathway. Chest 2003; 124: 26S-32S.
15. Panteleev MA, Zarnitsina VI, Ataullakhanov FI. Tissue Factor Pathway Inhibitor: A possible mechanism of action. Eur J Biochem 2002; 269:2016-2031.
16. Vallhonrat H, Swinford RD, Ingelfinger JR, Williams WW, Ryan DP, Tolkoff-Rubin N, Cosimi AB, Pascual M. Rapid activation of the alternative pathway of complement by extracorporeal membrane oxygenation. ASAIO 1999; 45: 113-114.
17. Hoel TN, Videm V, Mollnes TE, Saatvedt K, Brosstad F, Fiane AE, Fosse E, Svennevig JL. Off-pump cardiac surgery abolishes compliment activation. Perfusion 2007; 22: 251-256.
18. Graulich J, Sonntag J, Marcinkowski M, Bauer K, Kossel H, Buhrer C, Obladen M, Versmold HT. Complement activation by in vivo neonatal and in vitro extracorporeal membrane oxygenation. Mediators Inflamm 2002; 11:69-73.
19. Plotz FB, van Oeveren W, Bartlett RH, Wildevuur CR. Blood activation during neonatal extracorporeal life support. JTCS 1993; 105: 823-832.
20. McIlwain RB, Timpa JG, Kurundkar AR, et al. Plasma concentrations of inflammatory cytokines rise rapidly during ECMO-related SIRS due to the release of preformed stores in the intestine. Laboratory Investigation 2010; 90: 128-139.
21. Hocker JR, Wellhausen SR, Ward RA, Simpson PM, Cook LN. Effect of extracorporeal membrane oxygenation on leukocyte function in neonates. Artif Organs 1991; 15:23-28.
22. Sillaber C, Baghestanian M, Bevec D, Wilheim M, Agis H, Kapiotis S, Fureder W, Bankl HC, Kiener HP, Speiser W, Binder BR, Lechner K, Valent P. The mast cell as site of tissue-type plasminogen activator expression and fibrinolysis. J Immunol 1999; 162: 1032-1041.
23. Wojta J, Kaun C, Zorn G, Ghannadan M, Hauswirth AW, Sperr WR, Fritsch G, Printz D, Binder BR, Schatzl G, Zwirner J, Maurer G, Huber K, Valent P. C5a stimulates production of plasminogen activator inhibitor-1 in human mast cells and basophils. Blood 2002; 100:517-523.
24. Rezende S, Simmonds R, Lane D. Coagulation, inflammation, and apoptosis: different roles for protein S and the protein S-C4b binding protein complex. Blood 2004; 103: 1192-1201.
25. Hirsh J, Raschke R. Heparin and Low-Molecular-Weight Heparin: The Seventh ACCP Conference on Antithrombotic and Thrombolytic Therapy. Chest 2004; 126: 188S-203S.

60
26. Carberry KE, Gunter KS, Gemmato CJ, Morales DL. Mechanical circulatory support for the pediatric patient. Crit Care Nurs Q 2007; 30: 121-142.
27. Kearns GL, Abdel-Rahman SM, Alander SW, Blowey DL, Leeder JS, Kauffman RE. Developmental pharmacology- drug disposition, action, and therapy in infants and children. N Engl J Med 2003; 349: 1157-1167.
28. Monagle P, Chan A, Massicotte P, Chalmers E, Michelson AD. Antithrombitic therapy in children: the seventh ACCP Conference on Antithrombotic and Thrombolytic Therapy. Chest 2004; 126: 645S-687S.
29. Chan AK, Leaker M, Burrows FA, Williams WG, Gruenwald CE, Whyte L, Adams M, Brooker LA, Adams H, Mitchell L, Andrew M. Coagulation and fibrinolytic profile of paediatric patients undergoing cardiopulmonary bypass. Throb Haemost 1997; 77: 270-277.
30. Baird CW, Zurakowski D, Robinson B, Gandhi S, Burdis-Koch L, Tamblyn J, Munoz R, Fortich K, Pigula FA. Anticoagulation and pediatric extracorporeal membrane oxygenation: impact of activated clotting time and heparin dose on survival. Ann Thorac Surg 2007; 83: 912-919.
31. Smythe, MA, Koerber, JM, Nowak, SN, Mattson, JC, Begle, RL, Westley, SJ, Balasubramaniam M. Correlation between activated clotting time and activated parital thromboplatin times. Ann Pharmacother 2002; 36: 7-11.
32. Reiner JS, Coyne KS, Lundergan CF, Ross AM. Bedside monitoring of heparin therapy: comparison of activated clotting time to activated partial thromboplastin time. Cathet Cardiovasc Diagn 1994; 32:49-52.
33. Nankervis CA, Preston TJ, Dysart KC, Wilkinson WD, Chicoine LG, Welty SE, Nelin LD. Assessing heparin dosing in neonates on venoarterial extracorporeal membrane oxygenation. ASAIO J 2007; 53: 111-114.
34. Dauchot PJ, Berzina-Moettus L, Rabinovitch A, Ankeney JL. Activated coagulation and activated partial thromboplastin times in assessment and reversal of heparin-induced anticoagulation for cardiopulmonary bypass. Anesth Analg 1983; 62: 710-9.
35. Bain B, Forster T, Sleigh B. Heparin and the activated partial thromboplastin time- a difference between the in-vitro and in-vivo effects and implications for the therapeutic range. Am J Clin Pathol 1980; 74: 668-73.
36. Kuhle S, Eulmesekian P, Kavanagh B, Massocotte P, Vegh P, Lau A, Mitchell LG. Lack of correlation between heparin dose and standard clinical monitoring tests in treatment with unfractionated heparin in critically ill children. Haematologica 2007; 92: 554-557.
37. Andrew M, Paes B, Milner R, Johnston M, Mitchell L, Tollefsen DM, Powers P. Development of the human coagulation system in the full-term infant. Blood 1987; 70: 165-172.

61
38. Kim GG, El Rouby S, Thompson J, Gupta A, Williams J, Jobes DR. Monitoring unfractionated heparin in pediatric patients with congenital heart disease having cardiac catheterization or cardiac surgery. J Thromb Thrombolysis 2010;29:429
39. Urlesberger B, Zobel G, Zenz W, Kuttnig-Haim M, Maurer U, Reiterer F, Riccabona M, Dacar D, Gallisti S, Leschnik B, Muntean W. Activation of the clotting system during extracorporeal membrane oxygenation in term newborn infants. J Pediatr 1996; 129: 264-268.
40. Goldenberg NA, Knapp-Clevenger R, Manco-Johnson MJ. Elevated plasma factor viii and d-dimer levels as predictors of poor outcomes of thrombosis in children. N Engl J Med 2004;351:1081-1088.
41. Corrigan JJ, Jeter MA. Tissue-type plasminogen activator, plasminogen activator inhibitor and histidine rich glycoproteins in stressed human newborns. Pediatrics 1992; 89: 43-46.
42. Hudson IRB, Gibson BES, Brownlie J, Holland BM, Turner TL, Webber RG. Increased concentrations of D-Dimers in newborn infants. Archives of Disease in Childhood 1990; 65: 383-389.
43. Ali MS, Harmer M, Vaughan R. Serum s100 protein as a marker of cerebral damage during cardiac surgery. Br J Anaesth 2000;85:287-298.
44. Westaby S, Johnsson P, Parry AJ, et al. Serum S100 protein: A potential marker for cerebral events during cardiopulmonary bypass. Ann Thorac Surg 1996;61:88-92.
45. Blomquist S, Johnsson P, Luhrs C, et al. The appearance of s-100 protein in serum during and immediately after cardiopulmonary bypass surgery: A possible marker for cerebral injury. J Cardiothorac Vasc Anesth 1997;11:699-703.
46. Kumar P, Dhital K, Hossein-Nia M, et al. S-100 protein release in a range of cardiothoracic surgical procedures. J Thorac Cardiovasc Surg 1997;113:953-954.
47. Lindberg L, Olsson AK, Anderson K, Jogi P. Serum s-100 protein levels after pediatric cardiac operations: A possible new marker for postperfusion cerebral injury. J Thorac Cardiovasc Surg 1998;116:281-285.
48. Ichinose F, Uezono S, Muto R, Uchida H, Hatori F, Terui K, Niimi Y, Goto T, Nakata Y, Morita S. Platelet Hyporeactivity in Young Infants During Cardiopulmonary Bypass. Anesth Analg 1999; 88: 258-62.
49. Robinson TM, Kickler TS, Walker LK, Ness P, Bell W. Effect of extracorporeal membrane oxygenation on platelets in newborns. Critical Care Medicine 1993; 21: 1029-1034.
50. Weerasinghe A, Taylor K. The platelet in Cardiopulmonary Bypass. Ann Thorac Surg 1998; 66: 2145-52.

62
51. Kondo C, Tanaka K, Takagi K, Shimono T, Shinpo H,Yada I, Yuasa H, Kusagawa M, Akamatsu N, Tanoue K. Platelet dysfunction during cardiopulmonary bypass surgery. With special reference to platelet membrane glycoproteins. ASAIO J 1993; 39: M550-3.
52. Michelson AD, Barnard MR, Hechtman HB, et al. In vivo tracking of platelets: circulating degranulated platelets rapidly lose surface P-selectin but continue to circulate and function. Proc Natl Acad Sci U S A. 1996; 93: 11877–11882.
53. Michelson AD, Barnard MR, Krueger LA, et al. Circulating monocyte-platelet aggregates are a more sensitive marker of in vivo platelet activation than platelet surface P-selectin: studies in baboons, human coronary intervention, and human acute myocardial infarction. Circulation. 2001; 104: 1533–1537
54. Manrique AM, Arroyo M, Lin Y, et al. Magnesium supplementation during cardiopulmonary bypass to prevent junctional ectopic tachycardia after pediatric cardiac surgery: A randomized controlled study. J Thorac Cardiov Sur 2010;139:162-U221.
55. Ranucci, M. Antithrombin III: Key factor in extracorporeal circulation. Minerva Anesthesiologica 2002; 68: 454-7.