Embed Size (px)
Citation preview

Help for GeoGebra
www.geogebra.org
Author: Markus Hohenwarter last modified: May 24th, 2007

Table of contents Chapter 1: What is GeoGebra? .................................................................................. 4
Chapter 2: Examples .................................................................................................. 5
2.1 Triangle with angles .......................................................................................... 5 2.2 Linear equation y = k x + d................................................................................ 5 2.3 Centroid of three points A, B, C ........................................................................ 5 2.4 Split line segment AB at a ratio of 7 : 3 ............................................................. 6 2.5 Set of linear equations in two variables............................................................. 6 2.6 Tangent to a function of x.................................................................................. 7 2.7 Investigation of polynomial functions................................................................. 7 2.8 Integrals ............................................................................................................ 8
Chapter 3: Geometric input......................................................................................... 9
3.1 General notes ................................................................................................... 9 3.1.1 Context menu ............................................................................................. 9 3.1.2 Show and hide............................................................................................ 9 3.1.3 Trace .......................................................................................................... 9 3.1.4 Zoom .......................................................................................................... 9 3.1.5 Axes Ratio ................................................................................................ 10 3.1.6 Construction Protocol ............................................................................... 10 3.1.7 Redefine ................................................................................................... 10
3.2 Modes ............................................................................................................. 10 3.2.1 General Modes......................................................................................... 10 3.2.2 Point ......................................................................................................... 12 3.2.3 Vector ....................................................................................................... 12 3.2.4 Segment ................................................................................................... 12 3.2.5 Ray ........................................................................................................... 13 3.2.6 Polygon .................................................................................................... 13 3.2.7 Line........................................................................................................... 13 3.2.8 Conic Section ........................................................................................... 14 3.2.9 Arc and Sector.......................................................................................... 15 3.2.10 Number and Angle.................................................................................. 15 3.2.11 Locus...................................................................................................... 16 3.2.12 Geometric Transformations .................................................................... 16 3.2.13 Text ........................................................................................................ 17 3.2.14 Images.................................................................................................... 18 3.2.15 Properties of Images .............................................................................. 18
Chapter 4: Algebraic input ........................................................................................ 20
4.1 General notes ................................................................................................. 20 4.1.1 Change values.......................................................................................... 20 4.1.2 Animation ................................................................................................. 20
4.2 Direct Input...................................................................................................... 20 4.2.1 Numbers and angles ................................................................................ 21 4.2.2 Points and Vectors ................................................................................... 21 4.2.3 Line........................................................................................................... 21 4.2.4 Conic Section ........................................................................................... 22 4.2.5 Function of x ............................................................................................. 22
2

4.2.6 Arithmetic Operations ............................................................................... 23 4.3 Commands...................................................................................................... 23
4.3.1 General Commands ................................................................................. 24 4.3.2 Number..................................................................................................... 24 4.3.3 Angle ........................................................................................................ 25 4.3.4 Point ......................................................................................................... 26 4.3.5 Vector ....................................................................................................... 27 4.3.6 Segment ................................................................................................... 28 4.3.7 Ray ........................................................................................................... 28 4.3.8 Polygon .................................................................................................... 28 4.3.9 Line........................................................................................................... 28 4.3.10 Conic section.......................................................................................... 29 4.3.11 Function.................................................................................................. 30 4.3.12 Arc and Sector........................................................................................ 30 4.3.13 Image ..................................................................................................... 31 4.3.14 Locus...................................................................................................... 31 4.3.15 Geometric Transformations .................................................................... 31
Chapter 5: Printing and Export ................................................................................. 34
5.1 Printing............................................................................................................ 34 5.1.1 Drawing Pad............................................................................................. 34 5.1.2 Construction Protocol ............................................................................... 34
5.2 Drawing Pad as Picture................................................................................... 34 5.3 Drawing Pad to Clipboard ............................................................................... 35 5.4 Construction Protocol as Webpage................................................................. 35 5.5 Dynamic Worksheet as Webpage................................................................... 35
Chapter 6: Options ................................................................................................... 37
6.1 Point Capturing ............................................................................................... 37 6.2 Angle unit ........................................................................................................ 37 6.3 Decimal Places ............................................................................................... 37 6.4 Point style ....................................................................................................... 37 6.5 Graphics.......................................................................................................... 37 6.6 Font size ......................................................................................................... 37 6.7 Language ........................................................................................................ 37 6.8 Drawing Pad ................................................................................................... 38
Index......................................................................................................................... 39
3

Chapter 1: What is GeoGebra? GeoGebra is a mathematics software that joins geometry, algebra and calculus. It is developed by Markus Hohenwarter at the University of Salzburg for mathematics education in schools. On the one hand, GeoGebra is a dynamic geometry system. You can do constructions with points, vectors, segments, lines, conic sections as well as functions and change them dynamically afterwards. On the other hand, equations and coordinates can be entered directly. Thus, GeoGebra has the ability to deal with variables for numbers, vectors and points, finds derivatives and integrals of functions and offers commands like Root or Extremum. These two views are characteristic of GeoGebra: an expression in the algebra window corresponds to an object in the geometry window and vice versa.
4

Chapter 2: Examples To get an impression of GeoGebra's possibilities, let's have a look at some examples.
2.1 Triangle with angles - At first, choose the mode New point (see 3.2) in the toolbar and click three
times on the drawing pad to create the three vertices A, B and C of the triangle. - Select the mode Polygon and click on the points A, B, C and again A to create the
triangle P. In the algebra window the area of the triangle is shown. - To get all the angles of our triangle, choose the mode Angle in the toolbar and
click on the triangle. Now, choose the Move mode and drag the vertices to change the triangle dynamically. If you don't need the algebra window and coordinate axes, hide them by using the View menu.
2.2 Linear equation y = k x + d We concentrate on the meaning of k and d in the linear equation y = kx + d by trying different values for k and d. To do this we might enter the following lines in the input text field at the screen's bottom (press enter at the end of each line). k = 1 d = 2 y = k x + d Now we can change k and d in the algebra window (right click: "Edit" or command click: “Edit” on a Macintosh) or in the input text field k = 2 k = -3 d = 0 d = -1 You can change k and d very easily with the arrow keys (see 4.1.2) or sliders (right (Macintosh: command) click on k or d, Show Object; see 3.2.10). In a similar way we might investigate the equations of conic sections such as x /a + y /b = 1, b x + a y = a b or (x - m) + (y - n) = r .
2.3 Centroid of three points A, B, C
5

We are now going to construct the centroid of three points by entering the following lines in the input text field (press enter at the end of each line). Of course, you can also use the mouse to do this construction using the modes (see 3.2) in the toolbar. A = (-2, 1) B = (5, 0) C = (0, 5) M_a = Midpoint[B, C] M_b = Midpoint[A, C] s_a = Line[A, M_a] s_b = Line[B, M_b] S = Intersect[s_a, s_b] Alternatively we compute the centroid directly as S1 = (A + B + C) / 3 and compare both results using the command Relation[S, S1] Subsequently we experiment whether S = S1 is true for other positions of A, B, C as well. We do this by choosing the Move mode with the mouse (leftmost button in the toolbar) and dragging one of the points.
2.4 Split line segment AB at a ratio of 7 : 3 As GeoGebra allows us to calculate with vectors, this is an easy task. A = (-2, 1) B = (3, 3) T = A + 7/10 (B - A) Another way of doing this could be A = (-2, 1) B = (3, 3) v = Vector[A, B] T = A + 7/10 v In a next step we could introduce a number t (e.g. by using a Slider, see 3.2.10) and redefine the point T as T = A + t v (see 3.1.7). By changing t you can see T moving along a straight line. This line could be entered now in parameter form (see 4.2.3): g: X = T + s v
2.5 Set of linear equations in two variables
6

Two linear equations in x and y can be interpreted as two straight lines. The algebraic solution is the intersection point of these two lines. g : 3x + 4y = 12 h : y = 2x - 8 S = Intersect[g, h] You can both change the equation (right or command click, edit) and move or rotate
the line with the mouse ( Move; Rotate; see 3.2.1)
2.6 Tangent to a function of x GeoGebra offers a command for the tangent to a function f(x) at x=a. a = 3 f(x) = 2 sin(x) t = Tangent[a, f] By animating a (see 4.1.2) the tangent slides along the graph of f. Another way of doing this would be a = 3 f(x) = 2 sin(x) T = (a, f(a)) t : X = T + s (1, f'(a)) Additionally, we get the point T on the graph of f. The tangent t is given in parametric form. By the way, you can create the tangent of a function geometrically too: • Choose the mode New point (see 3.2) and click on the graph of the function f. • Choose the mode Tangents and click on the function f and then on the point
created before. Now, choose the Move mode and drag the point along the function with your mouse. The tangent is changed dynamically too.
2.7 Investigation of polynomial functions With GeoGebra you can investigate roots, local extrema and inflection points of polynomial functions. f(x) = x^3 - 3 x^2 + 1 N = Root[f] E = Extremum[f] W = InflectionPoint[f]
7
In Move mode you can drag the function f with the mouse. In this context, the first two derivatives of f are interesting too. Derivative[f] Derivative[f, 2]
2.8 Integrals To introduce integrals GeoGebra offers the possibility to visualize lower and upper sums of a function as rectangles. f(x) = x^2/4 + 2 a = 0 b = 2 n = 5 L = LowerSum[f, a, b, n] U = UpperSum[f, a, b, n] By changing a, b or n (animation, see 4.1.2; Slider, see 3.2.10) you can see the influence of these parameters. For the increment of n you should select 1 (right or command click on n, properties). The definite integral can be shown as follows: Integral[f, a, b] The antiderivative F is created using: F = Integral[f]
8

Chapter 3: Geometric input Now we will explain how the mouse is used in GeoGebra.
3.1 General notes The geometry window (to the right) shows points, vectors, segments, polygons, functions, straight lines and conic sections graphically. Whenever the mouse is moved over an object a description appears. The geometry window will be called drawing pad sometimes. There are several modes to tell GeoGebra how it should react to mouse input (new point, intersect, circle through three points, ...). This aspect will be explained in detail later (see 3.2). Double click an object in the algebra window to open its editing field. 3.1.1 Context menu Right-clicking on an object yields a context menu where you can choose the algebraic notation (polar or cartesian coordinates, implicit or explicit equation, …). Here you also find commands like Rename, Edit or Delete . Choosing Properties shows a dialog window, where you can change color, size, line thickness, line style, filling etc. 3.1.2 Show and hide Geometric objects can be drawn (show) or not (hide). Use the mode Show/hide Object (see 3.2.1) or the context menu (see 3.1.1) to change this state. The icon to the left of every object in the algebra window tells us about its current visibility state. 3.1.3 Trace Geometric objects can leave a trace on the screen when they are moved. Use the context menu (see 3.1.1) to switch this trace on or off. The menu item Refresh Views in the View menu clears all traces. 3.1.4 Zoom After right or command clicking on the drawing pad a context menu appears that let's
you zoom in or out. See also modes Zoom in or Zoom out (see 3.2.1). Zoom window: right or command click and drag the mouse to zoom a specified rectangle.
9

3.1.5 Axes Ratio Right or command click on the drawing pad to get a context menu where you can change the ratio between x-axis and y-axis. 3.1.6 Construction Protocol The interactive construction protocol (menu View) is a table that shows all construction steps. Here you can redo a construction step by step. It is even possible to insert construction steps and change their sequence. You can find more details in the construction protocol's help menu. 3.1.7 Redefine An object may be redefined using its context menu (see 3.2.1). This is very useful for subsequent changes of your construction. You can also open the Redefine dialog by double clicking on a dependent object. In order to place a free point A onto a line h, choose Redefine for the point A and enter Point[h]. To remove the point from this line and make it free again, redefine it to some free coordinates like (see 3.2). Another example is the conversion of a line h through two points A and B into a segment: choose Redefine and enter Segment[A, B]. Redefining objects is a very versatile tool to change the construction width. Please note that this may also change the order of the construction steps in the construction protocol (see 3.1.6).
3.2 Modes The following modes can be activated in the toolbar or the Geometry menu. Click on the small arrow in the lower right corner of an icon to get a menu with other modes. To mark an object means to click on it with the mouse. In all construction modes you can easily create new points by clicking on the drawing pad. 3.2.1 General Modes
Move Drag and drop free objects with the mouse. Select an object by clicking on it in Move mode; then you may • delete it by pressing the Del key • move it by using the arrow keys (see 4.1.2)
10

Hold the Ctrl-key to select several objects.
Rotate around point Select the center point of the rotation first. Afterwards you may rotate free objects around this point by dragging them with the mouse.
Relation Mark two objects to get information about their relation (see 4.3.1).
Move drawing pad Drag and drop the drawing pad to move the origin of the coordinate system. You can also move the drawing pad by pressing the Ctrl key and dragging it with the mouse.
Zoom in Click on any place of the the drawing pad to zoom in (see 3.1.4).
Zoom out Click on any place of the the drawing pad to zoom out (see 3.1.4)
Show / hide object Click on an object to show or hide it. All objects that should be hidden are highlighted. Your changes will be applied as soon as you switch to any other mode in the toolbar.
Show / hide label Click on an object to show or hide its label.
Copy visual style This mode lets you copy visual properties like colour, size, line style, etc. from one object to several others. At first, choose the object whose properties you want to copy. Afterwards click on all other objects that should adopt these properties.
Delete object Click on any object you want to delete.
11

3.2.2 Point
New point Clicking on the drawing pad creates a new point. Its coordinates are fixed when the mouse button is released again. By clicking on a segment, straight line or conic section you create a point on this object. Clicking on the intersection of two objects creates this intersection point.
Intersect two objects The intersection points of two objects can be produced in two ways. 1. Mark two objects: all intersection points are created (if possible) 2. Click on an intersection of the two objects: only this single intersection point is
created For segments, rays or arcs you may specify whether you want to allow outlying intersection points (see 3.1.1). This can be used to get intersection points that lie on the extension of an object. For example, the extension of a segment or a ray is a straight line.
Midpoint Click on ... 1. two points to get their midpoint. 2. one segment to get its midpoint. 3. a conic section to get its center. 3.2.3 Vector
Vector between two points Mark start- and endpoint of the vector.
Vector from point Mark a point A and a vector v to create the point B = A + v and the vector from A to B. 3.2.4 Segment
Segment between two points
12

Marking two points A and B fixes a segment between A and B. In the algebra window you see the segment's length.
Segment with given length from point Click on a point A that you want the segment to start from. Specify the desired length a in the appearing window. This mode will create a segment with length a and the endpoint B of this segment. The endpoint B may be rotated in Move mode around the starting point A. 3.2.5 Ray
Ray through two points Marking two points A and B creates a ray starting at A through B. In the algebra window you see the equation of the corresponding line. 3.2.6 Polygon
Polygon Mark at least three points and then click the first point again. In the algebra window you see the polygon's area. 3.2.7 Line
Line through two points Marking two points A and B fixes a straight line through A and B. The line's direction vector is (B-A).
Parallel line Marking a line g and a point A defines a straight line through A parallel to g. The line's direction is the direction of g.
Perpendicular line Marking a line g and a point A yields a straight line through A perpendicular to g. The line's direction is equivalent to the perpendicular vector (see 4.3.5) of g.
Line bisector
13
The line bisector of a line segment is stated by a segment s or two points A and B. The line's direction is equivalent to the perpendicular vector (see 4.3.5) of the segment s or AB.
Angular bisector Angular bisectors can be defined in two ways. 1. Marking three points A, B, C produces the angular bisector of the enclosed angle,
where B is the apex. 2. Marking two lines produces their two angular bisectors. The direction vectors of all angular bisectors have length 1.
Tangents The tangents to a conic can be produced in two ways: 1. Marking a point A and a conic c produces all tangents through A to c. 2. Marking a line g and a conic c produces all tangents to c that are parallel to g. Marking a point A and a function f produces the tangent line to f in x=x(A).
Polar or diameter line This mode creates the polar or diameter line of a conic section: 1. Mark a point and a conic section two get the polar line. 2. Mark a line or a vector and a conic section two get the diameter line. 3.2.8 Conic Section
Circle with center through point Marking a point M and a point P defines a circle with center M through P. This circle's radius is the distance MP.
Circle with center and radius After marking the center point M you are asked for the radius in a window.
Circle through three points Marking three points A, B, C defines a circle through these points. If the tree points lie on one straight line, the circle degenerates to this line.
14
Conic through 5 points Marking five points produces a conic section through them. If no four of these five points lie on a line, the conic section is defined. 3.2.9 Arc and Sector The algebraic value of an arc is its length, the value of a sector is its area.
Semicircle Marking two points A and B produces a semicircle above the segment AB.
Circular arc with center through two points Marking three points M, A and B produces a circular arc with center M, starting point A and endpoint B. Note: point B does not have to lie on the arc.
Circular sector with center through two points Marking three points M, A and B produces a circular sector with center M, starting point A and endpoint B. Note: point B does not have to lie on the sector.
Circumcircular arc through three points Marking three points produces a circular arc through these points.
Circumcircular sector through three points Marking three points produces a circular sector through these points. 3.2.10 Number and Angle
Distance This mode yields the distance of ... 1. two points 2. two lines 3. a point and a line
Slider
15

Click on any free place on the drawing pad to create a slider at that location for a number or an angle. The appearing window lets you specify the interval [min, max] of the number or angle and the width of the slider (in pixel). In GeoGebra a slider is nothing but the graphical representation of a free number or angle. You can easily create a slider for any existing free number or angle by showing this object (right click and choose Show object). The position of a slider may be absolute on the screen or relative to the coordinate system (see properties of the corresponding number or Angle, 3.1.1).
Angle This mode creates ... 1. the angle between three points 2. the angle between two segments 3. the angle between two lines 4. the angle between two vectors 5. all interior angles of a polygon All these angles are limited between 0 and 180° in size. If you want to allow reflex angles, choose the appropriate setting in the properties dialog (see 3.1.1).
Angle with given size After marking two points A and B a window appears where you are asked for the angle's size. This mode produces a point C and an angle , where (ABC). 3.2.11 Locus Locus First mark a point Q whose locus should be drawn. Afterwards click on a point P that Q depends upon. Note that the point P has to be a point on an object (line, segment, circle, ...). 3.2.12 Geometric Transformations The following geometric transformations work for points, lines, conic sections, polygons and for images.
Mirror object at point At first, mark the object to be mirrored. Afterwards click on the point that should be the mirror.
16

Mirror object at line At first, mark the object to be mirrored. Afterwards click on the line that should be the mirror.
Rotate object around point At first, mark the object to be rotated. Then click on the point that should be the rotation center. Afterwards a window appears where you may specify the rotation angle.
Translate object by vector At first, mark the object to be translated. Afterwards click on the translation vector.
Dilate object from point At first, mark the object to be dilated. Then click on the point that should be the dilation center. Afterwards a window appears where you may specify the dilation factor. 3.2.13 Text
Text With this mode you can create texts or LATEX formulas. 1. Clicking on the drawing pad creates a new text at this location. 2. Clicking on a point creates a new text whose position is relative to this point. Afterwards, a dialog appears where you may enter the text. It is also possible to use an object's values and thus create dynamic texts.
Input Description ''This is a text'' simple text ''Point A = '' + A dynamic text using the value of point A ''a = '' + a + ''cm'' dynamic text using the value of segment a
The position of a text may be absolute on the screen or relative to the coordinate system (see properties of the text, 3.1.1). LATEX Formulas In GeoGebra you can also write formulas. To do so set the check box for a LATEX formula in the dialog of the text mode and enter your formula in LATEX syntax. Here,
17

some important LATEX commands are explained. Please have a look at any LATEX documentation for further information.
LATEX input Result a \cdot b a . b \frac{a}{b}
ba
\sqrt{x} x \sqrt[n]{x} n x \vec{v} vr \overline{AB} AB x^{2} x a_{1} a1 \sin\alpha + \cos\beta sin α + cos β \int_{a}^{b} x dx ∫
b
axdx
\sum_{i=1}^{n} i^2 ∑ =
n
i 1i
3.2.14 Images
Insert image This mode lets you add an image to your construction. 1. Clicking on the drawing pad specifies the lower left corner of the image. 2. Clicking on a point specifies this point as the lower left corner of the image. Afterwards, a file-open dialog appears where you may choose the image file to insert. 3.2.15 Properties of Images Position The position of an image may be absolute on the screen or relative to the coordinate system (see properties of the image, 3.1.1). The latter is achieved by specifying up to three corner points. This gives you the flexibility to scale, rotate and even distort images. 1. Corner: position of the lower left corner of the image. 2. Corner (lower right): this corner may only be set if the 1. Corner was set before. It
controls the width of the image. 4. Corner (upper left): this corner may only be set if the 1. Corner was set before. It
controls the height of the image. Let’s create three points A, B and C to explore the effects of the corner points. Set A as the first and B as the second corner of your image. By dragging A and B in
Move mode you can explore their influence very easily. Now set A as the first and
18
C as the fourth corner. Finally, you could set all three corner points and see how you dragging the points distorts your image. You already saw how to influence the position and size of your image. If you want to attach your image to a point A and set its width to 3 and its height to 4 units, you could do the following: 1. Corner: A 2. Corner: A + (3,0) 3. Corner: A + (0,4) When you drag point A in Move mode now, your image keeps the desired size. See command Corner (see 4.3.13). Background Image You may set an image to be in the background (properties of the image, see 3.1.1). A background image lies behind the coordinate axes and cannot be selected with the mouse any more. In order to change the background setting of an image, choose Properties from the Edit menu. Transparency An image can be made transparent in order to see images or axes lying behind it. You can set the transparency of an image by specifying a filling value between 0 % and 100 % (see properties of the image, 3.1.1).
19

Chapter 4: Algebraic input We will now explain how the keyboard is used to make input in GeoGebra.
4.1 General notes Values, coordinates and equations of free and dependent objects are shown in the algebra window (on the left hand side). Free objects do not depend on any other objects and can be changed directly. Input can be made in the input text field at the bottom of the screen. This will be explained in detail later (see 4.2 and 4.3) 4.1.1 Change values Free objects can be changed, dependent objects can't. To manipulate a free object's value, overwrite it by entering the new value in the input text field (see 4.2). Alternatively, this can be done in the algebra window by choosing Edit in the context menu (see 3.1.1). 4.1.2 Animation To change a number or angle continuously select Move mode (see 3.2.1), click on the number or angle and press the + or - key. Keeping one of these keys pressed lets you produce animations. For example, if a point's coordinates depend on a number k like in P=(2k, k), the point will move along a straight line when k is changed continuously. With the arrow keys you can move any free object in Move mode. The increment is adjustable in the properties dialog (see 3.1.1). • Ctrl + arrow key ...10 * step width • Alt + arrow key ...100 * step width A point on a line can also be moved along its line using the + or - key.
4.2 Direct Input GeoGebra can treat numbers, angels, points, vectors, segments, lines and conic sections. We will now explain how these objects can be entered through coordinates or equations.
20

You can also use indices within the names of objects: A1 or sAB is entered as A_1 or s_{AB}. 4.2.1 Numbers and angles Numbers and angles use the sign . as decimal point.
number r r = 5.32 Angles are entered in degree (°) or radian (rad). The constant pi is useful for radian values.
degree radian angle alpha alpha = 60° alpha = pi / 3
GeoGebra does all internal calculations in radian. The symbol ° is nothing but a constant for π/180 to convert degree into radian.
Sliders and Arrow Keys Free numbers and angles can be displayed as sliders on the drawing pad (see 3.2.10). By means of the arrow keys you may change numbers and angles in the algebra window too (see 4.1.2). Limit Value to Interval Free numbers and angles may be limited to an interval [min, max] (properties, see 3.1.1). This interval is also used for Sliders (see 3.2.10). For every dependent angle you can specify whether it may become reflex or not (properties, see 3.1.1) 4.2.2 Points and Vectors Points and vectors may be entered in cartesian or polar coordinates (see 4.2.1). Upper case labels denote points, lower case labels vectors.
cartesian coordinates polar coordinates point P P = (1, 0) P = (1; 0°) vector v v = (0, 5) v = (5; 90°)
4.2.3 Line A line is entered as a linear equation in x and y or in parametric form. In both cases previously defined variables (numbers, points, vectors) can be used. The line's name has to be entered at the beginning of the input followed by a colon.
equation parametric form line g g : 3x + 4y = 2 g : X = (-5, 5) + t (4, -3)
21

Let be k=2 and d=-1 for example. Then we can define a line g by entering the equation g : y = k x + d. xAxis und yAxis The two coordinate axes are available in commands using the names xAxis and yAxis. For example, the command Perpendicular[A, xAxis] constructs the perpendicular line to the x-axis through a point A. 4.2.4 Conic Section A conic section is entered as a quadratic equation in x and y. Previously defined variables (numbers, points, vectors) can be used. The conic section's name has to be entered at the beginning of the input followed by a colon.
equation ellipse ell ell : 9x +16y = 144 hyperbola hyp hyp : 9x -16y = 144 parabola par par : y = 4x circle k1 k1 : x + y = 25 circle k2 k2 : (x - 5) + (y + 2) = 25
Let be a=4 and b=3 for example. Now we can enter an ellipse as ell : b x + a y = a b . 4.2.5 Function of x To enter a function you can use previously defined variables (numbers, points, vectors, ...) and other functions.
Input Function f f(x) = 3x - x Function g g(x) = tan(f (x))nameless Function sin(3x) + tan(x)
All internal functions (like sin, cos, tan, etc.) are described in the section about arithmetic operations (see 4.3.6). There are commands to get the integral (see 4.3.2) and derivatives (see 4.3.11) of a function. You can also use f (x), f'' (x), ... for the derivatives of a previously defined function f(x):
f(x) = 3x - x g(x) = cos(f'(x + 2))
Furthmore, functions can be translated by a vector (see 4.3.15) and a free function can be moved with the mouse. Limit Function to Interval
22
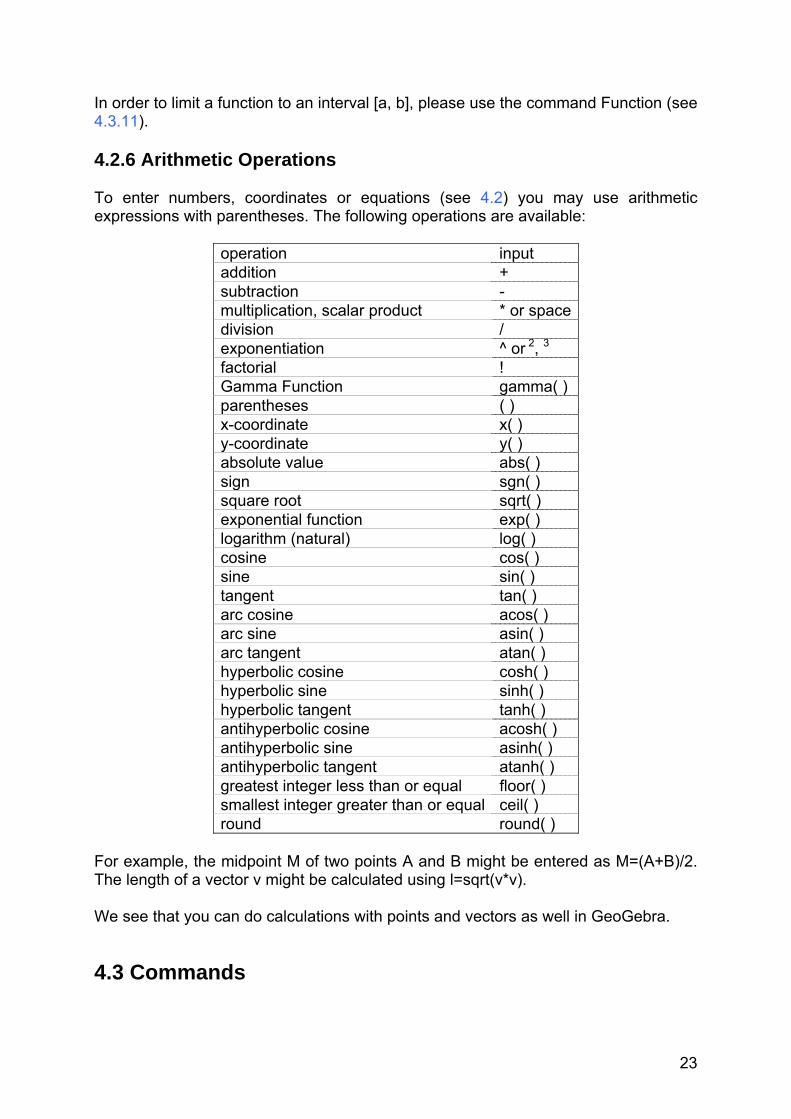
In order to limit a function to an interval [a, b], please use the command Function (see 4.3.11). 4.2.6 Arithmetic Operations To enter numbers, coordinates or equations (see 4.2) you may use arithmetic expressions with parentheses. The following operations are available:
operation input addition + subtraction - multiplication, scalar product * or space division / exponentiation ^ or 2, 3 factorial ! Gamma Function gamma( ) parentheses ( ) x-coordinate x( ) y-coordinate y( ) absolute value abs( ) sign sgn( ) square root sqrt( ) exponential function exp( ) logarithm (natural) log( ) cosine cos( ) sine sin( ) tangent tan( ) arc cosine acos( ) arc sine asin( ) arc tangent atan( ) hyperbolic cosine cosh( ) hyperbolic sine sinh( ) hyperbolic tangent tanh( ) antihyperbolic cosine acosh( ) antihyperbolic sine asinh( ) antihyperbolic tangent atanh( ) greatest integer less than or equal floor( ) smallest integer greater than or equal ceil( ) round round( )
For example, the midpoint M of two points A and B might be entered as M=(A+B)/2. The length of a vector v might be calculated using l=sqrt(v*v). We see that you can do calculations with points and vectors as well in GeoGebra.
4.3 Commands
23
With the aid of commands we can produce new and change existing objects. Intersecting two lines g and h produces a new point, for example: S = Intersect[g,h] (see 4.3.4). A command's result may be named by entering a label followed by =. In our example S = Intersect[g, h] the new point is named S. You can also use indices within the names of objects: A1 or sAB is entered as A_1 or s_{AB}. 4.3.1 General Commands
Relation Relation[object a, object b] shows a message box that tells us the relation of a and b. This command lets us find out whether two objects are equal, if a point lies on a line or conic, or if a line is tangent or a passing line to a conic. Delete Delete[object]: Deletes an object and all its dependents. 4.3.2 Number Length Length[vector]: Length of a vector Length[point A]: Length of the position vector of A Area Area[point A, point B, point C, ...]: Area of the polygon defined by the given points
Distance Distance[point A, point B]: Distance of two points A and B Distance[point A, line g]: Distance of a point A and a line g Distance[line g, line h]: Distance of lines g and h. The distance of intersecting lines is 0. This function is interesting for parallel lines. Slope Slope[line]: Slope of a line. This command also draws the slope triangle whose size may be changed (see properties, 3.1.1). Radius Radius[circle]: Radius of a circle
24

Parameter Parameter[parabola]: Parameter of a parabola (distance of directrix and focus) FirstAxisLength FirstAxisLength[conic]: Length of a conic section's principal axis SecondAxisLength SecondAxisLength[conic]: Length of a conic section's second axis Excentricity Excentricity[conic]: Excentricity of a conic Integral Integral[function f, number a, number b]: Definite integral of f(x) from a to b. This command also draws the area between the function graph of f and the x-axis. Integral[function f, function g, number a, number b]: Definite integral of f(x)-g(x) from a to b. This command also draws the area between the function graphs of f and g. See indefinte integral, see 4.3.11. LowerSum LowerSum[function f, number a, number b, number n]: Lower sum of function f on interval [a,b] with n rectangles. This command draws the rectangles of the lower sum too. UpperSum UpperSum[function f, number a, number b, number n]: Upper sum of function f on interval [a,b] with n rectangles. This command draws the rectangles of the upper sum too. 4.3.3 Angle
Angle Angle[vector, vector]: Angle between two vectors (between 0 and 360°) Angle[line, line]: Angle between the direction vectors of two lines (between 0 and 360°) Angle[point A, point B, point C]: Angle enclosed by BA and BC (between 0 and 360°). B is apex. Angle[point A, point B, angle alpha]: Angle of size alpha drawn from B with vertex A. The point Rotate[B, A, a] is created too.
25

Angle[conic]: Angle of twist of a conic section's principle axis (see 4.3.9) Angle[vector v]: Angle between x-axis and vector v Angle[point A]: Angle between x-axis and position vector of point A Angle[number]: Converts a number into an angle (result between 0 and 2pi) Angle[polygon]: All inner angles of a polygon 4.3.4 Point Point Point[line]: Point on line Point[conic]: Point on conic section (e.g. circle, ellipse, hyperbola) Point[function]: Point on function Point[vector]: Point on vector Point[point P, vector v]: Point P + v
Midpoint and Center Midpoint[point A, point B]: Midpoint of A and B Midpoint[segment]: Midpoint of segment Center[conic]: Center of a conic section (e.g. circle, ellipse, hyperbola) Focus Focus[conic]: (All) foci of a conic section Vertex Vertex[conic]: (All) vertices of a conic section Centroid Centroid[polygon]: Centroid of a polygon Intersect Intersect[line g, line h]: Intersection point of lines g and h Intersect[line g, conic c]: All Intersection points of g and c (max. 2) Intersect[line g, conic c, number n]: n-th intersection point of g and c Intersect[conic c, conic d]: All intersection points of c and d (max. 4) Intersect[conic c, conic d, number n]: n-th intersection point of c and d Intersect[polynomial f, polynomial g]: All intersection points of f and g Intersect[polynomial f, polynomial g, number n]: n-th intersection point of f and g Intersect[polynomial f, line g]: All intersection points of f and g Intersect[polynomial f, line g, number n]: n-th intersection point of f and g Intersect[function f, function g, point A]: Intersection point of f and g with initial value A (for Newton's method) Intersect[function f, line g, point A]: Intersection point of f and g with initial value A (for Newton's method)
26

(see also mode Intersect two objects, 3.2.2) Root Root[polynomial f]: All roots of polynomial f (as points) Root[function f, number a]: One root of function f with initial value a (Newton's method) Root[function f, number a, number b]: One root of function f with on interval [a, b] (regula falsi) Extremum Extremum[polynomial f]: All local extrema of polynomial f (as points) InflectionPoint InflectionPoint[polynomial f]: All inflection points of polynomial f 4.3.5 Vector Vector Vector[point A, point B]: Vector from A to B Vector[point]: Position vector of a point Direction Direction[line]: Direction vector of a line. A line with equation ax + by = c has direction (b, - a). UnitVector UnitVector[line]: Direction vector with length 1 of a line UnitVector[vector]: Vector with length 1, same direction and orientation as the given vector PerpendicularVector PerpendicularVector[line]: Perpendicular vector of a line. A line with equation ax + by = c has the perpendicular vector (a, b). PerpendicularVector[vector]: Perpendicular vector of a vector. A vector with coordinates (a, b) has the perpendicular vector (- b, a). UnitPerpendicularVector UnitPerpendicularVector[line]: Perpendicular vector with length 1 of a line. UnitPerpendicularVector[vector]: Perpendicular vector with length 1 of a vector.
27

4.3.6 Segment Segment Segment[point A, point B]: Segment between two points A and B Segment[point A, number a]: Segment with length a and starting point A. The endpoint of the segment is created too. 4.3.7 Ray Ray Ray[point A, point B]: Ray starting at A through B Ray[point A, vector v]: Ray starting at A with direction v 4.3.8 Polygon Polygon Polygon[point A, point B, point C, ...]: Polygon defined by the given points 4.3.9 Line Line Line[point A, point B]: Line through two points A and B Line[point A, line g]: Line through A parallel to g Line[point A, vector v]: Line through A with direction v Perpendicular Perpendicular[point A, line g]: Line through A perpendicular to g Perpendicular[point A, vector v]: Line through A perpendicular to v LineBisector LineBisector[point A, point B]: Line bisector of the line segment AB LineBisector[segment s]: Line bisector of the segment s AngularBisector AngularBisector[point A, point B, point C]: Angular bisector of the angle (A, B, C). B is apex of this angle. AngularBisector[line g, line h]: Both angular bisectors of g and h. Tangent Tangent[point A, conic c]: (All) tangents through A to c Tangent[line g, conic c]: (All) tangents to c that are parallel to g Tangent[number a, function f]: Tangent to f(x) at x=a Tangent[point A, function f]: Tangent to f(x) at x=x(A)
28

Asymptote Asymptote[hyperbola c]: Both asymptotes of a hyperbola Directrix Directrix[parabola c]: Directrix of a parabola Axes Axes[conic c]: Principal and second axis of a conic section FirstAxis FirstAxis[conic c]: Principal axis of a conic section SecondAxis SecondAxis[conic c]: Second axis of a conic section Polar Polar[point A, conic c]: Polar line of A relative to c Diameter Diameter[line g , conic c]: Diameter parallel to g relative to c Diameter[vector v, conic c]: Diameter with direction v relative to c 4.3.10 Conic section Circle Circle[point M, number r]: Circle with midpoint M and radius r Circle[point M, segment s]: Circle with midpoint M and radius = Length[s] Circle[point M, point A]: Circle with midpoint M through A Circle[point A, point B, point C]: Circle through A, B and C Ellipse Ellipse[point F, point G, number a]: Ellipse with foci F, G and principal axis length a. Condition: 2a > Distance[F,G] Ellipse[point F, point G, segment s]: Ellipse with foci F, G and principal axis length a = Length[s] Hyperbola Hyperbola[point F, point G, number a]: Hyperbola with foci F, G and principal axis length a. Condition: 0 < 2a < Distance[F,G]
29

Hyperbola[point F, point G, segment s]: Hyperbola with foci F, G and principal axis length a = Length[s] Parabola Parabola[point F, line g]: Parabola with focus F and directrix g Conic Conic[point A, point B, point C, point D, point E]: Conic section through five points (no four lie on one line) 4.3.11 Function Derivative Derivative[function f]: Derivative of function f(x) Derivative[function f, number n]: n-th derivative of function f(x) Integral Integral[function f]: Indefinite integral for f(x) See definte integral, see 4.3.2. Polynomial Polynomial[function f]: yields the expanded polynomial function f. Example: Polynomial[ (x - 3) ] yields x - 6x + 9 TaylorPolynomial TaylorPolynomial[function f, number a, number n]: power series expansion for function f about the point x=a to order n Function Function[function f, number a, number b]: yields a function, that is equal to f on the interval [a, b] and not defined outside of [a, b] 4.3.12 Arc and Sector The algebraic value of an arc is its length, the value of a sector is its area. Semicircle Semicircle[point A, point B]: Semicircle above the segment AB. CircularArc CircularArc[point M, point A, point B]: Circular arc with midpoint M between two points A and B. Note: point B does not have to lie on the arc.
30

CircumcircularArc CircumcircularArc[point, point, point]: Circular arc through three points Arc Arc[conic c, point A, point B]: Conic section arc between two points A and B on the conic section c (circle or ellipse) Arc[conic c, number t1, number t2]: Conic section arc between two parameter values t1 and t2 for the following parameter forms: • circle: (r cos(t), r sin(t)), where r is the circle's radius • ellipse: (a cos(t), b sin(t)), where a and b are the lengths of the first and second
axis CircularSector CircularSector[point M, point A, point B]: Circular sector with midpoint M between two points A and B. Note: point B does not have to lie on the arc. CircumcircularSector CircumcircularSector[point, point, point]: Circular sector through three points Sector Sector[conic c, point A, point B]: Conic section sector between two points A and B on the conic section c (circle or ellipse) Sector[conic c, number t1, number t2]: Conic section sector between two parameter values t1 and t2 for the following parameter forms: • circle: (r cos(t), r sin(t)), where r is the circle's radius • ellipse: (a cos(t), b sin(t)), where a and b are the lengths of the first and second
axis 4.3.13 Image Corner Corner[image, number n]: yields the n-th corner of an image (n = 1, ..., 4). 4.3.14 Locus Locus Locus[point Q, point P]: yields the locus line of point Q that depends on point P. The point P has to be a point on an object (line, segment, circle, ...). 4.3.15 Geometric Transformations
31

If you assign one of the following commands to a new name, a copy of the moved object will be produced. The command Mirror[A, g] mirrors point A at line g and changes point A's location. Entering B = Mirror[A, g] will produce a new point B while A is left unchanged. Translate Translate[point A, vector v]: Translates point A by the vector v Translate[line g, vector v]: Translates line g by the vector v Translate[conic c, vector v]: Translates conic c by the vector v Translate[function c, vector v]: Translates function f by the vector v Translate[polygon P, vector v]: Translates polygon P by the vector v. New vertices and segments are created too. Translate[image p, vector v]: Translates image p by the vector v Translate[vector v, Point p]: Translates vector v to point p Rotate Rotate[point A, angle phi]: Rotates point A by angle phi around the axis origin Rotate[vector v, angle phi]: Rotates vector v by angle phi Rotate[line g, angle phi]: Rotates line g by angle phi around the axis origin Rotate[conic c, angle phi]: Rotates conic section c by angle phi around the axis origin Rotate[polygon P, angle phi]: Rotates polygon P by angle phi around the axis origin. New vertices and segments are created too. Rotate[image p, angle phi]: Rotates image p by angle phi around the axis origin Rotate[point A, angle phi, point B]: Rotates point A by angle phi around point B Rotate[line g, angle phi, point B]: Rotates line g by angle phi around point B Rotate[conic c, angle phi, point B]: Rotates conic section c by angle phi around point B Rotate[polygon P, angle phi, point B]: Rotates polygon P by angle phi around point B. New vertices and segments are created too. Rotate[image p, angle phi, point B]: Rotates image p by angle phi around point B Mirror Mirror[point A, point B]: Mirror point A at point B Mirror[line g, point B]: Mirror line g at point B Mirror[conic c, point B]: Mirror conic section c at point B Mirror[polygon P, point B]: Mirror polygon P at point B. New vertices and segments are created too. Mirror[image p, point B]: Mirror image p at point B Mirror[point A, line h]: Mirror point A at line h Mirror[line g, line h]: Mirror line g at line h Mirror[conic c, line h]: Mirror conic c at line h Mirror[polygon P, line h]: Mirror polygon P at line h. New vertices and segments are created too. Mirror[image p, line h]: Mirror image p at line h Dilate Dilate[point A, number f, point S]: Dilates point A from point S using the factor f
32

Dilate[line h, number f, point S]: Dilates line h from point S using the factor f Dilate[conic c, number f, point S]: Dilates conic section c from point S using the factor f Dilate[polygon P, number f, point S]: Dilates polygon P from point S using the factor f. New vertices and segments are created too. Dilate[image p, number f, point S]: Dilates image p from point S using the factor f
33

Chapter 5: Printing and Export
5.1 Printing 5.1.1 Drawing Pad You find the item Print Preview, Drawing Pad in the File menu. Here, you can specify title, author, date and the scale of your print-out (in cm). Press Enter after any change to update the preview window. 5.1.2 Construction Protocol There are to ways to open the print preview window of the construction protocol: • In the File menu, Print Preview you find the item Construction Protocol. • In the View menu, open the Construction Protocol first. There you find the item
Print Preview in the File menu. The second way is more flexible as you may switch on and off the different columns of the construction protocol here (see menu View of the construction protocol). In the print preview window you can enter titel, author and date.
5.2 Drawing Pad as Picture You find the item Drawing Pad as Picture in the File menu, Export. Here, you can specify the scale (in cm) and the resolution (in dpi) of the output file. The true size of the exported image is shown in the bottom of the window. Choose out of the following formats: PNG - Portable Network Graphics This is a pixel graphics format. The higher the resolution (dpi), the better the quality (300dpi will usually suffice). PNG graphics should not be scaled subsequently to avoid a loss of quality. PNG graphic files are well suited for the use on web pages (html) and with Microsoft Word. Whenever you insert a PNG graphic file into a Word document (menu Insert, Image from file) make sure that the size is set to 100 %. Otherwise the given scale (in cm) would be changed. EPS - Encapsulated Postscript
34
This is a vector graphics format. EPS pictures may be scaled without loss of quality. EPS graphic files are well suited for the use with vector graphics programs like Corel Draw and professional text processing systems like LATEX. The resolution of an EPS graphic is always 72dpi. This value is only used to calculate the true size of an image in cm and has no effect on the image's quality. Note: The transparency effect with filled polygons or conic sections is not possible with EPS.
5.3 Drawing Pad to Clipboard You find the item Drawing Pad to Clipboard in the File menu, Export. This copies a screenshot of the drawing pad to your system's clipboard as a PNG picture. This picture can be pasted into other programs (e.g. a Microsoft Word document). In Order to export your construction at a certain scale (in cm) please use the menu item Drawing Pad as Picture in the File menu, Export.
5.4 Construction Protocol as Webpage There are two ways to open the window Export Construction Protocol: • In the File menu, Export you find the item Construction Protocol as Webpage
(html). • In the View menu, open the Construction Protocol first. There you find the item
Export as Webpage in the File menu. The second way is more flexible as you may switch on and off the different columns of the construction protocol here (see menu View of the construction protocol). In the export window you can enter title, author and date of the construction and choose whether you want to export a picture of the drawing pad and the algebra window along with the protocol. The exported HTML file can be viewed with any internet browser (e.g. Mozilla, Internet Explorer) and edited with many word processing systems (e.g. Frontpage, Word).
5.5 Dynamic Worksheet as Webpage In the File menu, Export you find the item Dynamic Worksheet as Webpage (html). In the export window you can enter title, author, date and some text above and below the dynamic construction (e.g. a description of the construction and some exercises).
35

The construction itself may be included directly into a webpage or opened by clicking a button. Note: Don't take too big values for the width and height of the dynamic construction in order to make it fully visible in the internet browser. Three files are created when exporting a dynamic worksheet: 1. html file, e.g. circle.html - this file includes the worksheet itself 2. ggb file, z.B. circle_worksheet.ggb - this file includes your GeoGebra construction 3. geogebra.jar - this file includes GeoGebra and makes your worksheet interactive All three files - e.g. circle.html, circle_worksheet.ggb and geogebra.jar - have to be in one folder (directory) to let the dynamic construction work. Of course, you may copy all three files to another folder too. Note: The exported HTML file - e.g. circle.html - can be viewed with any internet browser (e.g. Mozilla, Internet Explorer). In order to let the dynamic construction work, Java has to be installed on the computer. You can get Java from http://www.java.com without charge. If you want to use your worksheet in your school's computer network, ask your local network administrator to install Java on the computers. You can also edit the worksheet's text with many word processing systems (e.g. Frontpage, Word) by opening the exported HTML file.
36
Chapter 6: Options Global options may be changed in the menu options. To change object settings, please use the context menu (see 3.1.1).
6.1 Point Capturing Point capturing to grid
6.2 Angle unit Determines whether angles are displayed in degree (°) or radian (rad). Input is always possible in both ways (degree and radian).
6.3 Decimal Places Adjustable decimal places: 0, 1, ..., 5
6.4 Point style Determines whether points are displayed as dots or crosses.
6.5 Graphics Determines the quality of graphic output in the geometry window.
6.6 Font size Determines the font size in points (pt).
6.7 Language GeoGebra is multilingual. Here you can change the current language setting. This affects all inputs including command names and all outputs. Drawing pad
37

Opens a window where properties of the drawing pad (axes, coordinate grid, etc.) may be set.
6.8 Drawing Pad Opens a dialog with the properties of the drawing pad (coordinate grid and axes, background color, etc).
38
Index angle 21
command 25 limit value, 21 mode 16 reflex 21
angle with given size mode 16
angular bisector mode 14
AngularBisector command 28
animation 20 arc
command 31 area
between two functions 24 command 24 definite integral 24
arithmetic operations 23 asymptote
command 29 axes
command 29 xAxis, yAxis 22
axes ratio 10 background image 19 centroid
command 26 circle
command 29 circle through three points
mode 14 circle with center and radius
mode 14 circle with center through point
mode 14 circular arc with center through two
points mode 15
circular sector with center through two points mode 15
CircularArc command 30
CircularSector command 31
circumcircular arc through three points
mode 15 circumcircular sector through three
points mode 15
CircumcircularArc command 31
CircumcircularSector command 31
colour 9 commands 23 conic
command 30 conic section 22 conic through 5 points
mode 15 construction protocol 10
export 35 context menu 9 copy visual style
mode 11 corner
command 31 decimal places 37 delete 9
command 24 delete object
mode 11 derivative
command 30 diameter
command 29 dilate
command 32 dilate object from point
mode 17 direction
command 27 directrix
command 29 distance
command 24 mode 15
drawing pad export 34 to clipboard 35
dynamic worksheet 35 edit 9
39
ellipse command 29
excentricity command 25
expand polynomial 30
export 34 extremum
command 27 filling 9 FirstAxis
command 29 FirstAxisLength
command 25 focus
command 26 format
copy visual style 11 formular 17 function 22
command 30 limit to interval 22
hide 9 hyperbola
command 29 image
background 19 corner 31 insert 18 position 18 transparency 19
index 21, 24 InflectionPoint
command 27 input field 20 insert image
mode 18 integral
command 25, 30 definite 25 indefinite 30
intersect command 26
intersect two objects mode 12
length command 24
limit function to interval 22
limit value number, angle 21
line 21 command 28 convert to segment, redefine 10
line bisector command 28 mode 13
line style 9 line thickness 9 line throught two points
mode 13 locus
command 31 mode 16
LowerSum command 25
midpoint command 26 mode 12
mirror command 32
mirror object at line mode 17
mirror object at point mode 16
move mode 10
move drawing pad mode 11
movements 31 new point
mode 12 number 21
limit value 21 parabola
command 30 parallel line
mode 13 parameter
command 25 perpendicular
command 28 perpendicular line
mode 13 perpendicular vector
command 27 point 21
command 26 place on a line, redefine 10 remove from line, redefine 10
point capturing 37 point style 37
40
polar command 29
polar or diameter line mode 14
polygon command 28 mode 13
polynomial command 30
print construction protocol 34 drawing pad 34
protocol 10 export 35
radius command 24
ray command 28
ray through two points mode 13
redefine 10 relation
command 24 mode 11
rename 9 root
command 27 rotate
command 32 rotate around point
mode 11 rotate object around point
mode 17 scalar product 23 SecondAxis
command 29 SecondAxisLength
command 25 sector 30
command 31 segment
command 28 convert to line
redefine 10 segment between two points
mode 12 segment with given length from point
mode 13 semicircle
command 30 mode 15
show 9 show / hide label
mode 11 show / hide object
mode 11 simplify
polynomial 30 size 9 slider
mode 15 slope
command 24 square root 23 tangent
command 28 mode 14
TaylorPolynomial command 30
text mode 17
trace 9 transformations
geometric 31 translate
command 32 translate object by vector
mode 17 transparent
image 19 trigonometric functions 22 UnitPerpendicularVector
command 27 UnitVector
command 27 UpperSum
command 25 values
change 20 vector 21
command 27 vector between two points
mode 12 vector from point
mode 12 vertex
command 26 visual style
copy 11 worksheet
dynamic 35 xAxis 22
41
yAxis 22 zoom 9 zoom in
mode 11 zoom out
mode 11
42