Embed Size (px)
Citation preview
HELICAL TRANSITION METAL COMPLEXES:
SYNTHESIS, CHARACTERIZATION AND
ASYMMETRIC EPOXIDATIONS
by
TINGTING LIU
B.E., Southwestern University of China, 1999
M.S., Lanzhou Institute of Chemical Physics, CAS, 2002
AN ABSTRACT OF A DISSERTATION
submitted in partial fulfillment of the requirements for the degree
DOCTOR OF PHILOSOPHY
Department of Chemistry
College of Arts and Sciences
KANSAS STATE UNIVERSITY
Manhattan, Kansas
2011
Abstract
A series of chiral titanium and manganese complexes with helix-directing salen ligands
have been prepared, characterized and studied. Their structures displayed as a chiral helical motif
as expected. And it was also found that all M(salen) units were exclusively M-helimeric in the
solid state, except Ti(cyclohexyl-benz[a]anthryl) as P-helix. This may be due to the energy
difference between P and M helice, which enables crystal packing forces to control and drive the
molecular structure. This is also in agreement with the previous computational studies that the M
configuration predominates in THF solution. All metal centers adopt a cis-β octahedral geometry
except in Mn(binapthyl-phenanthryl-salen). Most of M(salen) complexes in this work afforded
μ–oxo dinuclear helicates, instead of the expected monohelicate, except Mn(binapthyl-
phenanthryl-salen), which is bridged by a third salen ligand.
The titanium salt affected the complex solution behavior. In the presence of Cl-, only
mononuclear species was found by ESI-MS, while both di- and mononuclear species was found
in MeOH in the presence of –O
iPr. The NMR spectra of Ti(salen) indicated one major species
with cis-β geometry exist in most solution, which could be monomer or dimer, except
Ti(binapthyl-salen). No counterions have been found in the solid state of Mn(salen) complexes in
this work, but they affected the ligand decomposition in the solution in Mn(binapthyl-
phenanthryl-salen).
The Mn(salen) complexes could effectively and enatioselectively catalyze the asymmetric
epoxidation of somoe trans, cis and terminal olefin, and various oxidants were employed.
HELICAL TRANSITION METAL COMPLEXES:
SYNTHESIS, CHARACTERIZATION AND
ASYMMETRIC EPOXIDATIONS
by
TINGTING LIU
B.E., Southwestern University of China, 1999
M.S., Lanzhou Institute of Chemical Physics, CAS, 2002
A DISSERTATION
submitted in partial fulfillment of the requirements for the degree
DOCTOR OF PHILOSOPHY
Department of Chemistry
College of Arts and Sciences
KANSAS STATE UNIVERSITY
Manhattan, Kansas
2011
Approved by:
Major Professor
Christopher J. Levy

Copyright
TINGTING LIU
2011

Abstract
A series of chiral titanium and manganese complexes with helix-directing salen ligands
have been prepared, characterized and studied. Their structures displayed as a chiral helical motif
as expected. And it was also found that all M(salen) units were exclusively M-helimeric in the
solid state, except Ti(cyclohexyl-benz[a]anthryl) as P-helix. This may be due to the energy
difference between P and M helice, which enables crystal packing forces to control and drive the
molecular structure. This is also in agreement with the previous computational studies that the M
configuration predominates in THF solution. All metal centers adopt a cis-β octahedral geometry
except in Mn(binapthyl-phenanthryl-salen). Most of M(salen) complexes in this work afforded
μ–oxo dinuclear helicates, instead of the expected monohelicate, except Mn(binapthyl-
phenanthryl-salen), which is bridged by a third salen ligand.
The titanium salt affected the complex solution behavior. In the presence of Cl-, only
mononuclear species was found by ESI-MS, while both di- and mononuclear species was found
in MeOH in the presence of –O
iPr. The NMR spectra of Ti(salen) indicated one major species
with cis-β geometry exist in most solution, which could be monomer or dimer, except
Ti(binapthyl-salen). No counterions have been found in the solid state of Mn(salen) complexes in
this work, but they affected the ligand decomposition in the solution in Mn(binapthyl-
phenanthryl-salen).
The Mn(salen) complexes could effectively and enatioselectively catalyze the asymmetric
epoxidation of somoe trans, cis and terminal olefin, and various oxidants were employed.

vi
Table of Contents
List of Figures ................................................................................................................................ ix
List of Tables ................................................................................................................................ xv
Acknowledgements ..................................................................................................................... xvii
Dedication .................................................................................................................................. xviii
Chapter 1 - Introduction .................................................................................................................. 1
1.1 Symmetric Salen ligands and metal-salen complexes .......................................................... 1
1.1.1 trans-metallosalen complexes ........................................................................................ 3
1.1.2 cis-β-Metallosalen complexes ........................................................................................ 4
1.2 Helical complexes ................................................................................................................. 6
1.3 Catalytic asymmetric epoxidation (AE) of olefins ............................................................... 7
1.3.1 Catalytic AE – A Green and Sustainable Process .......................................................... 8
1.3.2 Epoxides ......................................................................................................................... 9
1.3.3 Oxidants ....................................................................................................................... 11
1.3.4 Successful transition metal complexes catalyzed AE examples .................................. 13
1.3.5 Mechanism of transition metal complexes-catalyzed AE ............................................ 18
1.4 Research Goals ................................................................................................................... 23
1.5 References ........................................................................................................................... 29
Chapter 2 - Synthesis, characterization and study of titanium(salen) complexes......................... 35
2.1 Introduction ......................................................................................................................... 35
2.2 Synthesis of Ti(salen) complexes ....................................................................................... 35
2.3 Electronic and infrared spectra ........................................................................................... 37
vii
2.4 Mass spectra analysis .......................................................................................................... 39
2.4.1 Complexes 1-4, Ti(salen)Cl2 ........................................................................................ 40
2.4.2 Complexes 5-8 Ti(salen)(OiPr)2 ................................................................................... 42
2.4.3 Doubly charged polymeric species derived from complexes coordinated with ligands
bearing the cyclohexyl backbone .......................................................................................... 45
2.5 Proton NMR studies ............................................................................................................ 47
2.6. Solid-state structural studies of titanium(IV) salen complexes ......................................... 62
2.6.1 Mono oxo bridged structure of complex 1 ................................................................... 63
2.6.2. Crystal structure of complex 3 .................................................................................... 66
2.6.3. Crystal structure of complex 6 .................................................................................... 68
2.6.4. Ti-dimer with di-oxo-bridges of complex 7 ................................................................ 71
2.7. Asymmetric epoxidation .................................................................................................... 73
2.3 Conclusion and future work ................................................................................................ 75
2.4 References ........................................................................................................................... 75
Chapter 3 - Synthesis, characterization and study of manganese(salen) complexes .................... 79
3.1. Introduction ........................................................................................................................ 79
3.2. Synthesis of Mn(salen) complexes .................................................................................... 81
3.3. Infrared spectra .................................................................................................................. 84
3.4 Electronic spectra ................................................................................................................ 87
3.5. Mass spectrometric studies ................................................................................................ 91
3.6 Crystal structures of Mn(salen) complexes ........................................................................ 95
3.6.1 Solid structure of complex 10 ...................................................................................... 95
3.6.2 Crystal structure of complex 12 ................................................................................... 98

viii
3.6.3 Crystal structure of complex 15 ................................................................................. 101
3.7 Asymmetric expoxidation of olefin catalyzed by manganese(salen) complexes ............. 104
3.7.1. The effect of co-catalyst on the catalytic acitivity of asymmetric epoxidation of trans
-β-methyl styrene by 9 ........................................................................................................ 104
3.7.2. Asymmetric epoxidation of trans-β-methyl styrene by 9 and 12 ............................. 105
3.7.3. The effects of counterion and oxidant on the catalytic acitivity of asymmetric
epoxidation of trans -β-methyl styrene by 12, 13 and 14 ................................................... 108
3.8. Conclusion and future work ............................................................................................. 112
3.9 References ......................................................................................................................... 113
Experimental Section .................................................................................................................. 116
Appendix A - 1
H NMR spectra ................................................................................................... 124
Appendix B - IR, UV and ECD spectra ...................................................................................... 128
Appendix C - HR-ESI-MS .......................................................................................................... 143
Appendix D - Crystal data .......................................................................................................... 158
ix
List of Figures
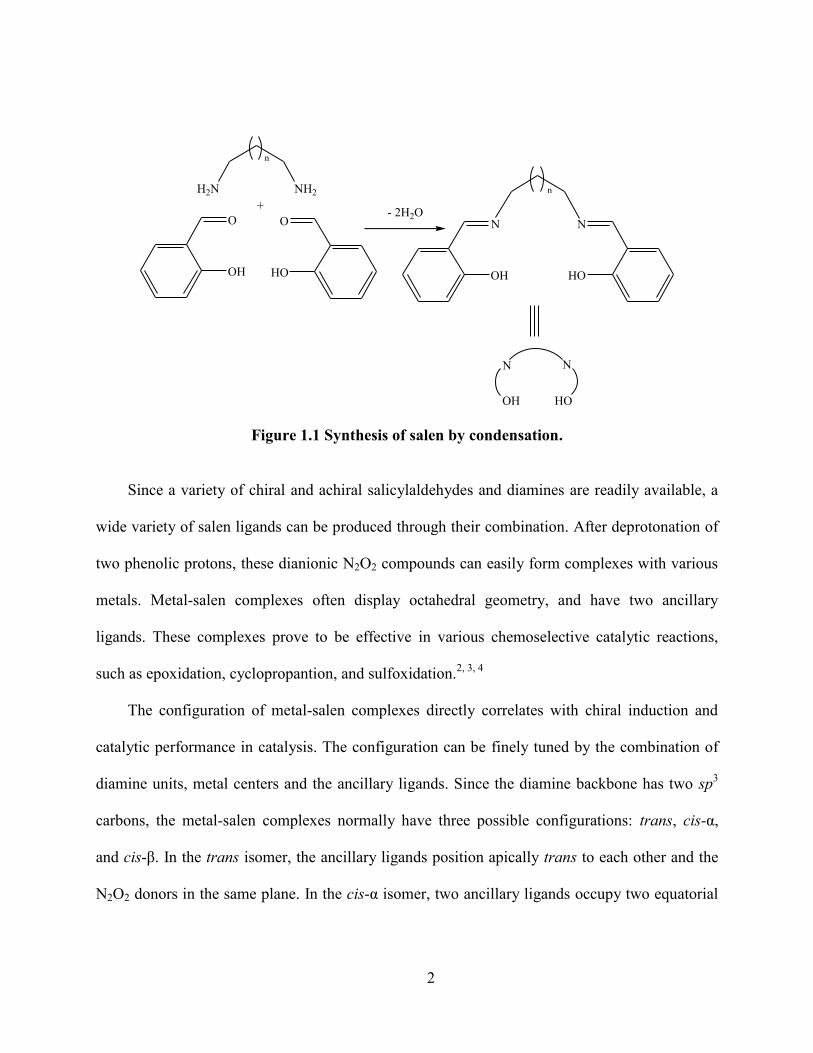
Figure 1.1 Synthesis of salen by condensation. .............................................................................. 2
Figure 1.2 Synthesis of salen by condensation Possible configurations of octahedral metallosalen
complexes. X and Y indicate ancillary ligand. ....................................................................... 3
Figure 1.3 Possible conformations of trans-metallosalen complexes. Left, step; right, umbrella.2 3
Figure 1.4 Equillibrium between two enantiomeric conformers.2 .................................................. 4
Figure 1.5 Transformation of a trans-metallosalen to a cis-β complex. A-B: bidentate reagent. .. 5
Figure 1.6 Unique reaction site for chiral cis-β metallosalens.2 ..................................................... 5
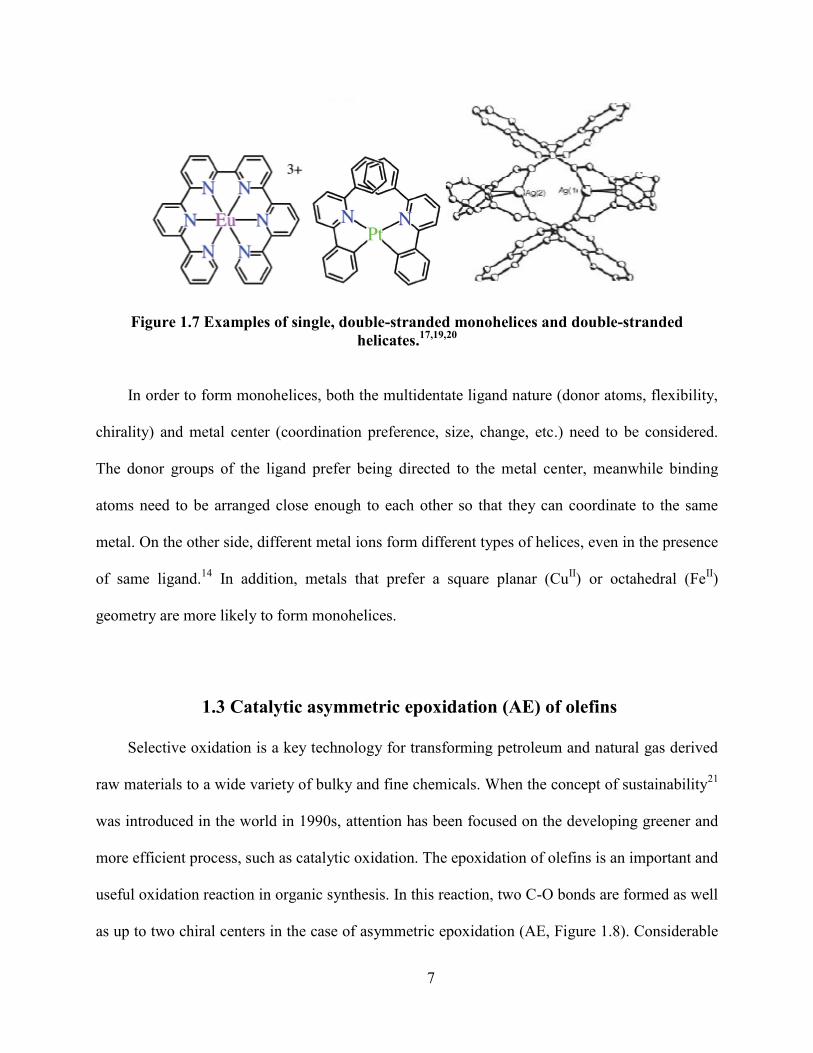
Figure 1.7 Examples of single, double-stranded monohelices and double-stranded helicates.17,19,20
................................................................................................................................................. 7
Figure 1.8 General scheme for asymmetric epoxidation. [O] indicates the oxidant. ...................... 8
Figure 1.9 Versatile conversion of α–olefin epoxide. ..................................................................... 9
Figure 1.10 Lewis acid (peroxometal) mechanism of early TM catalyzed AE. ........................... 19
Figure 1.11 Ligand exchange in the Sharpless process. ............................................................... 20
Figure 1.12 Structure of the active Ti-tartrate catalyst. (a) dominant [Ti(tartrate)2(OR)2]2 dimer;
and (b) coordinated with TBHP. ........................................................................................... 21
Figure 1.13 Redox mechanism of late transition metal catalyzed AE. ......................................... 21
Figure 1.14 Model rationalizing the stereocontrol in Mn-salen epoxidation.26
............................ 23
Figure 1.15 Possible trajectories for the approach of the substrate to the metal center of a helical
complex40
(left) and a O=Mn(salen) model, which is created using coordination of 12
(right). ................................................................................................................................... 24
Figure 1.16 Schemic structures of chiral helix-directing salen ligands. ....................................... 26

x
Figure 1.17 Examples of metal complexes chelated by our chiral helix-directing ligands. Left,
O=V(S2); right, (μ-O)2-[Mn(S1)]2. ....................................................................................... 26
Figure 1.18 trans-alkene approaching the active species of Mn-salen catalyst. ........................... 28
Figure 1.19 Simulated and experimental CD spectra of M-Zn(salen) complex.42
........................ 29
Figure 2.1 Synthesis of Ti(salen) complexes 1-8.......................................................................... 36
Figure 2.2 UV-vis spectrum of complex 1 (dashed), 5 (wavy) and free ligand H2S1 (solid). ...... 37
Figure 2.3 IR spectra of free ligand H2S1 (blue), complexes 1 (red) and 5 (green). .................... 38
Figure 2.4 Isotopic patterns of [Ti(S3)Cl]+ by LR-ESI-MS in CH2Cl2 (left) and [Ti(S3)(OMe)]
+
by HR-ESI-MS in MeOH (right) of complex 3. ................................................................... 41
Figure 2.5 Isotopic patterns of [Ti(S3)(OH)]+ and [Ti(S3)(O
iPr)]
+ by LR-ESI-MS in CH2Cl2
(left) of complex 7. ............................................................................................................... 42
Figure 2.6 Experimental (left) and simulated (right) isotopic patterns of [Ti(S3)(OMe)]+ and
[(S3)Ti(μ-O)(μ-OMe)Ti(S3)]+ by HR-ESI-MS in MeOH of complex 7. ............................. 43
Figure 2.7 Experimental (left) and simulated (right) isotopic patterns of polymeric species of
complex 5 obtained from HR-MS in MeOH solution. ......................................................... 46
Figure 2.8 Three isomers of octahedral metallosalen complexes. ................................................ 47
Figure 2.9 1H NMR spectrum of complex 1 in CDCl3: upper, aromatic; lower, aliphatic regions.
............................................................................................................................................... 48
Figure 2.10 Possible structure of complex 1 in solution. .............................................................. 49
Figure 2.11 1H NMR spectrum of complex 2 in CDCl3: upper, aromatic; lower, aliphatic regions.
............................................................................................................................................... 50
Figure 2.12 Possible structures of complex 2 in solution. ............................................................ 51
Figure 2.13 1H NMR spectrum of complex 3 in CDCl3. .............................................................. 52

xi
Figure 2.14 1H NMR spectrum of complex 4 in CDCl3. .............................................................. 53
Figure 2.15 1H NMR spectrum of complex 5 in CDCl3: upper, aromatic; lower, aliphatic regions.
............................................................................................................................................... 54
Figure 2.16 Proposed structure of complex 5 in CDCl3 solution. ................................................ 55
Figure 2.17 1H NMR spectrum of complex 6 in CDCl3. upper, aromatic; lower, aliphatic regions.
............................................................................................................................................... 56
Figure 2.181H NMR spectrum for complex 7 in CDCl3: upper, aromatic; lower, aliphatic regions
............................................................................................................................................... 58
Figure 2.19 Possible equilibrium in the solution of complex 7. ................................................... 59
Figure 2.20 1H NMR spectrum of complex 8 in CDCl3: upper, aromatic; lower, aliphatic regions.
............................................................................................................................................... 60
Figure 2.21 Possible equilibrium in the solution of complex 8. ................................................... 61
Figure 2.22 Four possible stereoisomers of a (μ-O)2-[M(salen)]2. ............................................... 63
Figure 2.23Structure of complex 1: top, thermal ellipsoid plot (50% probability, H omitted for
clarity); bottom, space filling model. .................................................................................... 64
Figure 2.24 Proposed partial hydrolysis of complex 1. ................................................................ 66
Figure 2.25 Structure of complex 3: top, thermal ellipsoid plot (50% probability, H omitted for
clarity); bottom, space filling model. (both molecules: M)................................................... 67
Figure 2.26 Structure of complex 6: top, thermal ellipsoid plot (50% probability, H omitted for
clarity); bottom, space filling model. .................................................................................... 69
Figure 2.27 Possible hydrolysis reaction of complex 6. ............................................................... 70
Figure 2.28 Structure of complex 7: top, thermal ellipsoid plot (50% probability, H omitted for
clarity); bottom left and right are stick and space filling models.......................................... 72
xii
Figure 2.29 Unseccessful asymmetric epoxidation catalyzed by complexes 1-8. ........................ 73
Figure 2.30 Putative explanation of unsuccessful AE catalyzed by complexes 1-8.18
................. 74
Figure 3.1 Scheme of theOEC mechanism in photosystem II.1 .................................................... 79
Figure 3.2 Jacobsen‟s (S,S)-Mn(salen) catalyst in asymmetric epoxidation of cis-olefins. ......... 80
Figure 3.3 trans-olefin approach to slightly (left) and deeply (right) stepped Mn(salen). ........... 81
Figure 3.4 Synthesis scheme of Mn(salen) complexes 9-15......................................................... 82
Figure 3.5 1H NMR spectrum of paramagnetic complex 12 in CDCl3. ........................................ 83
Figure 3.6 IR absorption band for Mn2O2 core.9 (a) sharp unsplit Mn-Ooxo band corresponding to
bridging ligand; (b) split Mn-Ooxo band for chelating Schiff base lignd. The lignad band is
marked with an asterisk. ....................................................................................................... 84
Figure 3.7 IR spectra of free ligand H2S1 and complexes 9, 10 and 11. ...................................... 85
Figure 3.8 IR spectra of free ligand H2S3 and complexes 12, 13 and 14. .................................... 86
Figure 3.9 UV-vis spectra of complexes and corresponding ligands in acetonitrile. Left, 9 and
H2S1; right, 12 and H2S3. ..................................................................................................... 87
Figure 3.10 Circular dichroism (CD) spectra of complexes 9 (dashed), 10 (wavy), 11 (solid) in
acetonitrile. ............................................................................................................................ 88
Figure 3.11 Experimental and simulated CD spectra of Zn(S1) complex.11
................................ 89
Figure 3.12 Circular dichroism (CD) spectra of complexes 12 (dashed), 13 (wavy) and 14 (solid)
in acetonitrile. ....................................................................................................................... 90
Figure 3.13 UV-CD spectrum of Zn(S3) complex.13
.................................................................... 90
Figure 3.14 Entire mass spectrum (left), experimental (middle) and simulated (right) isotopic
patterns of major species (top, [MnIII
(S1)]+; bottom, [CH3CN-Mn
III(S1)]
+ of 10. ............... 91
Figure 3.15 Proposed equilibrium between Mn(III) and Mn(IV) species. ................................... 92
xiii
Figure 3.16 Entire mass spectrum (left), experimental (middle) and simulated (right) isotopic
patterns of major species (top, [MnIII
(S3)]+; bottom, {[Mn
III(S3)(HS3)]-H}
+) of 13. .......... 93
Figure 3.17 Entire mass spectrum (left), experimental (middle) and similated (right) isotope
patterns of major species (top, CH3CN-[MnIII
(S2)]+; bottom, {[Mn
IV2(S2)2O2]+H}
+) of 15.
............................................................................................................................................... 94
Figure 3.18 Structure of complex 10: top, thermal ellipsoid plot (50% probability, H and
noncoordinated solvent omitted for clarity); bottom, space filling model. ........................... 96
Figure 3.19 Thermal ellipsoid plot of complex 10 grown in air. (50% probability, H and
noncoordinated solvent omitted for clarity). ......................................................................... 97
Figure 3.20 Thermal ellipsoid plot of complex 11. (50% probability, H and noncoordinated
solvent omitted for clarity). ................................................................................................... 98
Figure 3.21 Crystal structure of complex 12: top, thermal ellipsoid plot (50% probability, H and
noncoordinated solvent omitted for clarity); bottom, space filling model: left, front view;
right, back veiw. (blue indicates the carbon in bridging S2 ligand). .................................... 99
Figure 3.22 Structure of complex 15: top, thermal ellipsoid plot (50% probability, H and
noncoordinated solvent omitted for clarity); bottom, space filling model. ......................... 102
Figure 3.23 Packing diagram of complex 15. (left, view along the a axis; right, on the ab plane).
............................................................................................................................................. 103
Figure 3.24 Scheme of asymmetric epoxidation of trans-β-methyl styrene catalyzed by 9/12. 105
Figure 3.25 Percent yield versus time plot of trans-β-methyl styrene epoxidation with PhIO in
acetonitrile at room temperature catalyzed by 9 (■, solid line) and 12 (▲, dashed line). .. 106
Figure 3.26 ee value versus time plot of trans-β-methyl styrene epoxidation with PhIO in
acetonitrile at room temperature catalyzed by 9 (■, solid line) and 12 (▲, dashed line). .. 106
xiv
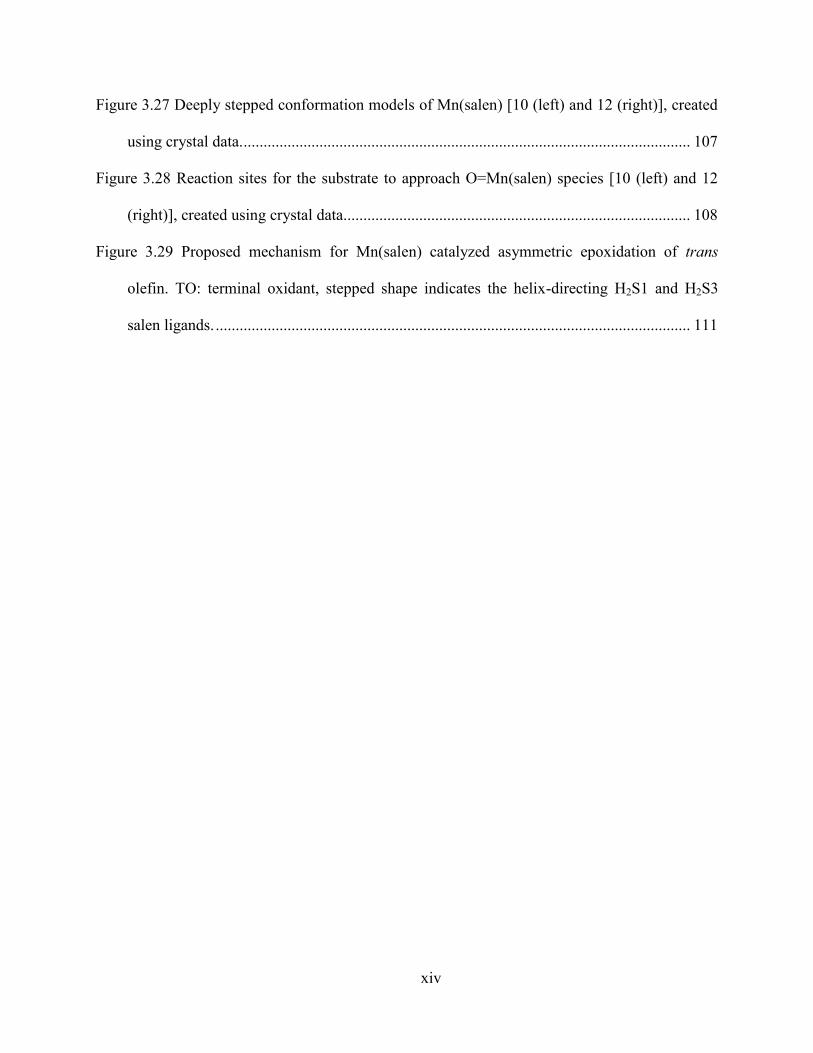
Figure 3.27 Deeply stepped conformation models of Mn(salen) [10 (left) and 12 (right)], created
using crystal data. ................................................................................................................ 107
Figure 3.28 Reaction sites for the substrate to approach O=Mn(salen) species [10 (left) and 12
(right)], created using crystal data....................................................................................... 108
Figure 3.29 Proposed mechanism for Mn(salen) catalyzed asymmetric epoxidation of trans
olefin. TO: terminal oxidant, stepped shape indicates the helix-directing H2S1 and H2S3
salen ligands. ....................................................................................................................... 111

xv
List of Tables
Table 1.1 Some common epoxides and their usage. ..................................................................... 10
Table 1.2 Oxidants used in transition-metal catalyzed epoxidation.26
.......................................... 12
Table 1.3 Sharpless Ti-tartrate AE of allylic alcohols. ................................................................. 14
Table 1.4 Jacobsen-Kaksuki AE of unfunctionalized olefins. ...................................................... 15
Table 1.5 Epoxidation of olefins by Mn-salen complexes using H2O2 as oxidant. ...................... 17
Table 1.6 Ti-complex catalyzed AE using aqueous H2O2. ........................................................... 18
Table 2.1 Characteristic IR bands for salens S1-S4 and Ti(salen) complexes 1-8. ...................... 39
Table 2.2 IR bands for Ti-(μ-O)2 vibration in complexes 5-8. ..................................................... 39
Table 2.3 Common species detected in mass spectra of Ti(salen)Cl2 complexes 1-4. ................. 41
Table 2.4 Common speices detected in the mass spectra of Ti(salen)(OiPr)2 complexes. ........... 44
Table 2.5 Doubly charged species from complexes 1, 2, 5 and 6 by HR-ESI-MS. ...................... 47
Table 2.6 Chemical shifts of imine and bay protons of ligand S1 and complex 1. ...................... 49
Table 2.7 Chemical shifts of imine and bay protons of ligand S2 and complex 2. ...................... 51
Table 2.8 Chemical shifts of imine and bay protons of ligand S3 and complex 3. ...................... 52
Table 2.9Chemical shifts of imine and bay protons of ligand S4 and complex 4. ....................... 53
Table 2.10 Proton NMR Chemical shifts of ligand H2S1 and complex 5. ................................... 55
Table 2.11 Proton NMR Chemical shifts of ligand H2S2 and complex 6. ................................... 56
Table 2.12 Proton NMR Chemical shifts of ligand H2S3 and complex 7. ................................... 58
Table 2.13 Proton NMR Chemical shifts of ligand H2S4 and complex 8. ................................... 61
Table 2.14 Selected bond distance (Å) and angles (˚) for complex 1. .......................................... 65
Table 2.15 selected bond length (Å) and bond angles (˚) for complex 3...................................... 68

xvi
Table 2.16 Selected bond lengths (Å) and bond angles (˚) for complex 6. .................................. 70
Table 2.17 Selected bond lengths (Å) and bond angles (˚) of complex 7. .................................... 73
Table 3.1 Synthetic compositions of Mn(salen) complexes 9-15. ................................................ 83
Table 3.2 Characteristic IR absorption bands for free ligand and complexes 9-11. ..................... 85
Table 3.3 Characteristic IR absorption bands for complexes 12-14. ............................................ 87
Table 3.4 %Abundance of major species in complexes 12, 13 and 14. ........................................ 93
Table 3.5 Selected bond lengths (Å) and bond angles (˚) of complex 10 grown in N2. ............... 97
Table 3.6 Selected bond lengths (Å) and bond angles (˚) of complex 12. .................................. 100
Table 3.7 Selected bond lengths (Å) and bond angles (˚) of complex 15. .................................. 103
Table 3.8 Epoxidation of alkenes catalyzed by complex 9 in dry CH3CN. ................................ 104
Table 3.9 Comparative acticity study of 12, 13 and 14 in the epoxidation of trans-β-methyl
styrene. ................................................................................................................................ 109
Table 3.10 Epoxidation of some alkenes with different oxidants using 9 as catalyst. ............... 110

xvii
Acknowledgements
First of all, I would like to thank my advisor Dr. Christopher Levy for his help, advice,
encouragement and support during my PhD years in his research group. I have learnd a lot from
him. Thanks also go to my committee members Dr. Eric Maatta, Dr. Stefen Bossmann, Dr. John
Tomich, and outside chair, Dr. Melinda Wilkerson. I would also like to express my gratitude to
Dr. John Desper, Jim and everybody else in the chemistry department: labmates, professors,
friends and staff.
Most importantly, I‟d like to thank my family: husband, son and parents. Nothing would be
possible without them. Their love, support and guidance has allowed me to not only go through
the past few years, but also become a chemist in the future.

xviii
Dedication
To my husband, son and parents
1
Chapter 1 - Introduction
Cytochrome P450 is a large and diverse group of enzymes to catalyze the oxidation of
organic substances in nature1a
. The monooxygenase reaction is one of the most common
reactions catalyzed by cytochrome P450. In such reactions, one oxygen atom of molecular
oxygen is inserted into an organic substrate (RH) while the other oxygen atom is reduced to
water (Eq 1).
RH + O2 + 2H+ + 2e- ROH + H2O (1)
The active site of cytochrome P450 contains a heme, or iron-porphyrin center. Structurally
related to the porphyrins, the metallosalen complexes have also shown various applicabilities for
the oxidation. Historically, the interest in using Mn complexes as catalyst for the epoxidation of
alkenes comes from biologically relevant oxidative Mn porphyrins.
1.1 Symmetric Salen ligands and metal-salen complexes
The first report of a reaction between an amine with an aldehyde by Schiff led to the
establishment of a large class of ligands called Schiff bases.1b
One of the most important classes
of Schiff bases are the tetradentate salen (N,N‟-bis(salicylaldehydro)ethylenediamine,), which are
generally synthesized by condensation between a salicylaldehyde and a diamine in a 2:1 ratio
(Figure 1.1). These ligands have two nitrogen and two oxygen donors, and are said to have a
N2O2 donor set.
2
O
OH
O
HO
+
H2N NH2
- 2H2ON
OH
N
HO
n
n
OH
N N
HO
Figure 1.1 Synthesis of salen by condensation.
Since a variety of chiral and achiral salicylaldehydes and diamines are readily available, a
wide variety of salen ligands can be produced through their combination. After deprotonation of
two phenolic protons, these dianionic N2O2 compounds can easily form complexes with various
metals. Metal-salen complexes often display octahedral geometry, and have two ancillary
ligands. These complexes prove to be effective in various chemoselective catalytic reactions,
such as epoxidation, cyclopropantion, and sulfoxidation.2, 3, 4
The configuration of metal-salen complexes directly correlates with chiral induction and
catalytic performance in catalysis. The configuration can be finely tuned by the combination of
diamine units, metal centers and the ancillary ligands. Since the diamine backbone has two sp3
carbons, the metal-salen complexes normally have three possible configurations: trans, cis-α,
and cis-β. In the trans isomer, the ancillary ligands position apically trans to each other and the
N2O2 donors in the same plane. In the cis-α isomer, two ancillary ligands occupy two equatorial

3
positions while one equatorial and one apical positions in cis-β isomer. In addition, N2O2 donors
are in non-planar in both cases (Figure 1.2).
MN N
O O
X
Y
trans
MNN
X
O
Y
O
cis-α
MNN
X
O
O
Y
cis-β
Figure 1.2 Synthesis of salen by condensation Possible configurations of octahedral
metallosalen complexes. X and Y indicate ancillary ligand.
1.1.1 trans-metallosalen complexes
A trans-metallosalen complex can adopt stepped or umbrella conformations (examples
using ethylenediamine as backbone, Figure 1.3) due to the free rotation of the diamine unit. The
conformation of the five-membered chelating ring comprising the central metal and
ethylenediamine can govern the complex conformation: the complex adopts a stepped
conformation when the chelating ring shows a half-chair conformer, and an umbrella
conformation when the ring bears an envelope conformer. Most of metallosalen complexes adopt
a non-planar stepped conformation.2,5
Figure 1.3 Possible conformations of trans-metallosalen complexes. Left, step; right,
umbrella.2

4
Both the chiral nature and the conformation of the metallosalen complex greatly influence
the catalytic enantioselectivity. For flexible achiral ligands, there can be an equilibrium between
two enantiomeric conformers in a stepped trans-metallosalen complex (Figure 1.4). If the salen
ligand is chiral (chiral 8 and 8‟ carbons), then one enantiomer (A) is dominant, since the half-
chair conformer allows both substituents at 8 and 8‟ postions to occupy stable quasi-equatorial
position. If the salen ligand is achiral, then there could be two conditions: when a chiral donor
ligand L is apically position, the enantiomeric conformers become diastereomeric, which makes
the equilibrium shift to one side (A); if the apical ligand is achiral, two enantiomers equilibrate
(A + B).
Figure 1.4 Equillibrium between two enantiomeric conformers.2
A wide variety of chiral trans-metallosalen, such as Co,6 Mn,
7 Cr,
8 Ru,
9 Ti,
10 V,
11 and Cu
12
complexes have been developed so far.
1.1.2 cis-β-Metallosalen complexes
In the presence of a multidentate ligand, cis-β metallosalen complexes are more often
formed than trans-metallosalens. Some metals, such as Ru and Zr, prefer to the adopt cis-β
conformation even only monodentate ligands present. Some metallosalens also adopt a cis-β
configuration when the salen ligands bear axially chiral diamines13
such as binaphthyl

5
derivatives. A trans-metallosalen can transform into a cis-β one in the presence of a bidentate
ligand (Figure 1.5).
MN N
O O
X
Y
MN N
O B
O
A
MN N
O X
O
Y
A-B
Figure 1.5 Transformation of a trans-metallosalen to a cis-β complex. A-B: bidentate
reagent.
All cis-β configurations are chiral. A finely tuned cis-β metallosalen can generate a unique
asymmetric reaction site for catalytic reactions, which may enhance asymmetric induction. The
chiral cis-β metallosalens2 show unique characters in the catalysis as compared to the trans
analogous (Figure 1.6).
Figure 1.6 Unique reaction site for chiral cis-β metallosalens.2

6
The configuration of a metal-salen complex is generally determined by spectroscopy. X-ray
diffraction is the most reliable method for its structure determination if a single crystal can be
grown. The structure can also be determined by NMR in solution samples, but in some cases, the
NMR spectra are not very informative due to the paramagnetism of metal centers and the
associated broadening.
1.2 Helical complexes
Helical complexes are common molecules in nature. A helix is defined as a coiled shape,
like a spring or spiral form. The helical compound can either be left handed (M) or right handed
(P) up to their spiral direction. The most famous helical molecule in biology is double-stranded
DNA helix. Nowadays, increasing attentions have been paid to the helical transition metal
complexes14, 15, 16
due to their potential as chiral catalysts. Furthermore, the study of self-
assembly and helix formation can help in the understanding of supermolecular chemistry.17, 18, 19,
20
Helical complexes with one metal ion are called monohelices. These can be further
classified as single, double and triple stranded molecules depending on the number of chelating
ligands around the metal center (Figure 1.7). Helical compounds with two or more metal ions are
named helicates. The common form of helicates includes double-stranded dinuclear helicates
(Figure 1.7).
7
Figure 1.7 Examples of single, double-stranded monohelices and double-stranded
helicates.17,19,20
In order to form monohelices, both the multidentate ligand nature (donor atoms, flexibility,
chirality) and metal center (coordination preference, size, change, etc.) need to be considered.
The donor groups of the ligand prefer being directed to the metal center, meanwhile binding
atoms need to be arranged close enough to each other so that they can coordinate to the same
metal. On the other side, different metal ions form different types of helices, even in the presence
of same ligand.14
In addition, metals that prefer a square planar (CuII) or octahedral (Fe
II)
geometry are more likely to form monohelices.
1.3 Catalytic asymmetric epoxidation (AE) of olefins
Selective oxidation is a key technology for transforming petroleum and natural gas derived
raw materials to a wide variety of bulky and fine chemicals. When the concept of sustainability21
was introduced in the world in 1990s, attention has been focused on the developing greener and
more efficient process, such as catalytic oxidation. The epoxidation of olefins is an important and
useful oxidation reaction in organic synthesis. In this reaction, two C-O bonds are formed as well
as up to two chiral centers in the case of asymmetric epoxidation (AE, Figure 1.8). Considerable

8
efforts are currently put into the development of new, improved catalytic AE processes for the
synthesis of enantiopure epoxides at the industrial and labotary scales.
R3 R4
R2R1
R4R1
R2 R3
O[O]
Figure 1.8 General scheme for asymmetric epoxidation. [O] indicates the oxidant.
1.3.1 Catalytic AE – A Green and Sustainable Process
Chemistry has a fundamental influence on our modern and daily life. It generates energy,
provides medicine, modifies and stores food, protect crops and invent new materials. But the
chemical industry has been traditionally considered as hazardous and polluting. It produces
stoichiometric amounts of waste, and causes air and water pollution. Furthermore, traditional
chemical industry has to face a big problem and challenge: sustainable development worldwide.
According to UN report,22
sustainability means “meeting the needs of the current generation
without sacrificing the ability to meet the need of future generation”. There are various ways to
reach sustainable development, one of which is green chemistry. The concept of “green
chemistry” was firstly introduced to the public in the 1990s, and has been promoted worldwide.
It focuses on hazard/waste prevention, rather than treating or solving.
Catalysis is an important tool for green chemistry and sustainable development. Compared
to traditional noncatalytic counterparts, catalytic processes proceed more efficiently and under
milder conditions (energy-efficient), show more selectivity and activity (usage optimal in raw
materials), and produce less waste with the catalyst recyclable. So a greater amount of efforts
must be focused on the development of new, improved catalytic processes.

9
1.3.2 Epoxides
Epoxides are very important chemical intermediates due to their versatility. They can be
easily converted to various products, as illustrated in Figure 1.9 using α-olefins as substrates. The
long-chain primary alcohols can be produced by hydrogenation in the presence of a nickel
catalyst, and the epoxides can be easily transformed to allyl alcohols over basic lithium
phosphate, and to allyl aldehydes over aluminium phosphate, by rearrangement. They can also be
converted to allylic alcohols with aluminum alkoxide catalysts.
RCH=CHCH2OH
and/or
RCHCH=CH2
OH
RH2CHC CH2
O
RC3H6OH
RCH2CCH3
RCH2H2CHO
O
H2
[Ni]
[Li2HPO4]
[AlPO4]
[H+]
Figure 1.9 Versatile conversion of α–olefin epoxide.
The amount of epoxides utilized per year varies from millions of tons for commodity
chemicals such as ethylene oxide (EO) and propylene oxides (PO), to a few grams for synthetic
intermediates.23, 24
Some of the most common and important epoxides and their usages are
summarized in Table 1.1.

10
Table 1.1 Some common epoxides and their usage.
Starting olefins epoxides usage
Ethylene/propylene Ethylene
oxide/propylene oxide
Ethylene glycols, polyurethane
polyols, propylene glycols
R R
R2HO
OR3R1
cyclohexene
Cyclohexene oxide
Polymer,
NH2
OH
Allyl alcohols
R2
R3
OHR1
O
Proprionates,α–
hydroxyketones R2
CHO
R3
R1
OH
Both ethylene oxide23
(EO) and propylene oxide23
(PO) are major commodity chemicals
produced by epoxidation. They are widely applied in the production of ethylene glycos,
polyurethane polyols, propylene glycols, and more of alcohols.
Terminal epoxides23,24
can undergo ring-opening with alcohols to produce hydroxyethers.
These hydroxyethers are lipid-soluble, non-sticky and compatible with human tissues, which
make them useful in cosmetic and pharmaceutical industry.
Cyclohexene oxide24
can act as monomer in polymerization with CO2, and convert to
enantiopure β–aminoalcohols and β–diimanes, which can be used as chirality-induced ligands
and precursors for pharmaceuticals and agrochemicals.
Allyl epoxides produced by the Sharpless process25
can be used to synthesize
polypropionate structures by Lewis acid-induced rearrangement. They also can be converted to

11
α–hydroxyketones. These ketones are difficult to obtain by conventional methods, but are vital
precursors in the synthesis of natural products, such as β–hydroxyl-α-amino acids.
Both the steric and electronic characteristics will affect the stability of epoxides.
Cyclooctene epoxide is very stable because the steric hindrance of the ring will slow down the
side reactions of the epoxide group, while cyclohexene epoxides are very reactive and the steric
properties of cyclohexane ring favor the ring-opening reaction of the epoxide. Most of the
terminal epoxides are stable to ring-opening, but styrene oxide is reactive, because the
intermediate products are electronically stabilized by the aromatic ring.
1.3.3 Oxidants
The oxygen source is an important aspect of epoxidation. There are several oxidants
available for transition-metal catalyzed AE (Table 1.2).
Alkyl hydroperoxides, such as tert-butyl hydroperoxide (TBHP) are widely applied in the
Sharpless25
system. TBHP is thermally stable, less sensitive in the presence of metal, and safer to
handle as compared to other organic peracids. Furthermore, TBHP is unreactive with most
organic compounds in contrast to peracids and H2O2, so it is particularly suitable for the
epoxidation of acid-sensitive olefins and those having a functional group that reacts with a
peracid.

12
Table 1.2 Oxidants used in transition-metal catalyzed epoxidation.26
Oxidant Active oxygen content/wt% Waste product
O2 100 Nothing or H2O
O2/reductor 50 H2O
H2O2 47 H2O
NaOCl 21.6 NaCl
CH3CO3H 21.1 CH3CO2H
tBuOOH(TBHP) 17.8
tBuOH
KHSO5 10.5 KHSO4
BTSP 9 Hexamethyldisiloxane
PhIO 7.3 PhI
Both NaOCl and iodosylbenzene (PhIO) are good terminal oxidants in metalloporphyrin27
and metal-salen28
catalyst systems. NaOCl normally requires a very basic (pH: 11~12)
environment, which limits its application. PhIO is insoluble in most organic solvents, so it is very
hard to determine its exact concentration in the reaction phase. It also has very low active oxygen
content (7.3%) and undesirable waste produced (PhI), so it is not a green oxidant.
Molecular oxygen (O2) is the most ideal oxidant for the epoxidation due to its great
availability, high active oxygen content and clean waste product. However, O2 cannot be readily
utilized in practice because of occurrence of an autooxidation radical pathway, leading to low/no
selectivity of epoxides. Currently, only a few catalytic systems29
can directly activate O2, which
limit its application in epoxidation.
Hydrogen peroxide is a very potent terminal oxidant and has been applied in some Ag, Mn-,
Pt-, Re-complexes catalyzed AE30
with good to reasonable selectivity. Its relatively high content
of active oxygen and water as product make it a candidate in the Green AE process. In some Ti
complex30
catalyzed system, diluted aqueuous H2O2 has been used to achieve reasonable to good

13
results. In the Mn-salen30
catalytic system, the problem is the catalyst deactivation in the
presence of water. Anhydrous H2O2, either in the form of urea-H2O2 or triphenylphsphine-H2O2,
have been applied to avoid this problem. The yield and selectivity are comparable to those using
NaOCl, but the catalyst loading is much higher, and the produced waste, Ph3PO, is an additional
problem.
1.3.4 Successful transition metal complexes catalyzed AE examples
In 1979 Groves27
published the first paper of olefin epoxidation catalyzed by the iron
porphyrin Fe(TPP)Cl with PhIO as oxidant.
The Sharpless reaction25
is so far the most successful example applied in industry for
catalytic AE. Typically, allylic alcohols are epoxidized in the presence of a titanium tartrate
catalyst and TBHP as the terminal oxidant. Molecular sieves need to be added in order to remove
any water. All reagents are readily available and the system is easy to handle. The enantiomeric
excess (ee) value can be achieved as high as >90% and the yield 70-90% with primary allylic
alcohols as substrate and Ti-isopropoxide-diethyltartrate (DET) as the source for in-situ catalyst
(Table 1.3). However, this kind of reaction is only appliable to allylic alcohols.

14
Table 1.3 Sharpless Ti-tartrate AE of allylic alcohols.
R3
R1
OH
R2
R3
R1
OH
R2
OTBHP, Ti(O-iPr)4
DET, CH2Cl2, -20 0C
molecular seives
70-90% yield>90% ee
Substrate Yield/% ee/%
OH
65 90
OH
70 96
Ph OH
89 >98
OH
50 >95
OH
40 95
Catalytic loading: 5 mol%
Jacobsen-Kaksuki catalysts28,31
are specialized for the epoxidation of unfuntionalized
olefins, particularly for cis-disubstitued and trisubstituted alkenes. In 1990, Jacobsen and
Kaksuki independently reported chiral Mn(III)-salen catalysts 1 and 2 for AE. Bleach or PhIO is
normally used as the oxygen atom donor, but peracides, like m-chloroperbenzoic acid (m-CPBA)
can also be used. The catalyst loading is as little as 0.5 mol% in these systems. By finely tuning
the electronic and steric properties of the salen ligand, the ee% can reach >90% (Table 1.4).

15
Table 1.4 Jacobsen-Kaksuki AE of unfunctionalized olefins.
R3R2
R1
R3R2
R1
O
* * 36-87% yield30-98% ee
aq. NaOCl, catl. (0.5 mol%)
CH2Cl2, 0 0C, pH 11.3
N N
O O
H H
Mn
Cl
1
N N
O O
Mn
OAc
Ph Ph
2
olefin Method Cata. Loading Isolated yield ee
Ph
A 4 mol%
84% 92
A
1 mol%
80%
88
A
4 mol%
67%
88
O
A
2 mol%
87%
98
O
O
B
1.5 mol%
63%
94
Ph CO2Et
B 8 mol% 67% 97
Method A: NaOCl, pH 11.3, CH2Cl2, 0 oC,
Method B: same as A, plus 0.2 eq. 4-phenylpyride-N-oxide.
In some cases, amine-N oxides32
can act as axial ligands in the active species, which
improves the selectivity. It is believed that the additives can prevent the homolysis of the O-O
16
bond and the subsequent destruction of the metal complex. One drawback of these Mn-salen
catalysts is their oxidation under reaction condition, leading to low turnover numbers (40-200)
and lack of recyclability.
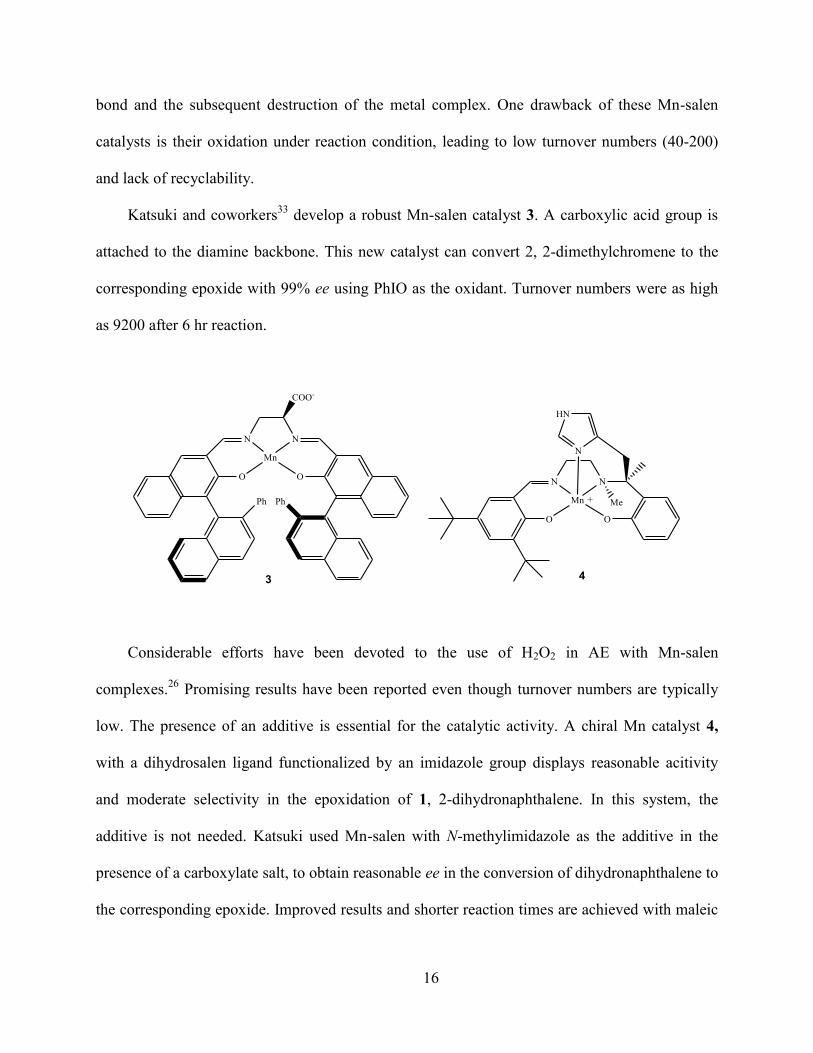
Katsuki and coworkers33
develop a robust Mn-salen catalyst 3. A carboxylic acid group is
attached to the diamine backbone. This new catalyst can convert 2, 2-dimethylchromene to the
corresponding epoxide with 99% ee using PhIO as the oxidant. Turnover numbers were as high
as 9200 after 6 hr reaction.
N N
O O
Mn
COO-
3
Ph Ph
N N
O O
Mn
N
HN
Me+
4
Considerable efforts have been devoted to the use of H2O2 in AE with Mn-salen
complexes.26
Promising results have been reported even though turnover numbers are typically
low. The presence of an additive is essential for the catalytic activity. A chiral Mn catalyst 4,
with a dihydrosalen ligand functionalized by an imidazole group displays reasonable acitivity
and moderate selectivity in the epoxidation of 1, 2-dihydronaphthalene. In this system, the
additive is not needed. Katsuki used Mn-salen with N-methylimidazole as the additive in the
presence of a carboxylate salt, to obtain reasonable ee in the conversion of dihydronaphthalene to
the corresponding epoxide. Improved results and shorter reaction times are achieved with maleic

17
anhydride and UHP (in situ prepared peroxycarboxylic acid from anhydride and anhydrous
H2O2), as compared with aqueous H2O2 and carboxylate salt (Table 1.5).
Table 1.5 Epoxidation of olefins by Mn-salen complexes using H2O2 as oxidant. PhPh
N N
O O
H H
Mn
Cl
5
[O]
O
Cata. Oxidant (equiv.) Yield/% ee/%
4 1 % H2O2 (10) 72 64
5 30% H2O2 (1.5) 74 69
5 Urea/ H2O2/maleic anhydride (1.5) 70 73
Katsuki34
et al. developed a series of Ti complexes for AE with H2O2 as oxidant. These
complexes form in situ from Ti tetraalkyloxide and salen, salan, and salalen ligands. Salan and
salalen are fully reduced and half-reduced salen ligands, and show better epoxidation results than
salen. In their AE system, excellent to reasonable yield and selectivity are achieved for terminal
olefins with aqueous H2O2 as oxidant (Table 1.6). Ti(salan) catalysts need much higher loadings
(5 mol%) and more H2O2 (1.5 eq.) as compared to Ti(salalan) counterparts (1 mol%, 1.05 eq.),
but considering the simple synthesis of salan and in situ complexaiton, it is still a promising
catalyst.

18
Table 1.6 Ti-complex catalyzed AE using aqueous H2O2.
RR
O1-5 mol% Ti-salalenor Ti-salan
1.05-1.5 eq. H2O2
toluene or ethyl acetae
N N
Ph Ph
O O
H
Ti
O
2
a
N N
O O
H
Ti
O
2
H
b
di-μ-oxo Ti(salalen)-6 di-μ-oxo Ti(salan)-7
Olefins Cata. Loading Eq. 30% aqueous H2O2 Yield ee
Ph 6 1 mol% 1.05 90% 93%
7 5 mol% 1.5 47% 82%
C6H13
6 1 mol% 1.05 70% 82%
7 5 mol% 1.5 25% 55%
6 1 mol% 1.05 99% 99%
7 5 mol% 1.5 87% 96%
1.3.5 Mechanism of transition metal complexes-catalyzed AE
Great efforts have been focused on the study of the mechanism of AE, which plays a
remarkable role not only in improving technology, but also in advancing fundamental
understanding in the field of chemistry. In the following section, the mechanic studies about two
AE systems are introduced.

19
1.3.5.1 Sharpless Ti-tartrate AE system
It is generally believed35
that a Lewis acid mechanism occurs with high-valent early
transition metal ions, such as Ti(IV), V(V), W(VI), Mo(VI) and Re(VI). The most commonly
used oxidants are hydrogen peroxide or alkyl hydroperoxides in their epoxidation system. The
peroxometal adduct (M-OOH or M-OOR) is first formed, and then the positively charged oxygen
atom next to the metal center (called proximal oxygen) is transferred to the nucleophilic olefin in
a concerted way (Figure 1.10). The metal center acts as a Lewis acid since it withdraws electrons
from the O-O bond, to facilitate the O-O dissociation and proximal O activation for the further
insertion into the olefin double bond. During the process, the oxidation state of the metal ion
does not change. The more distant O (distal O) constitutes a good leaving group in the form of
OH or OR. Active catalysts are those metals that are strong Lewis acids with vacant coordination
sites but relatively weak oxidants (to avoid one electron oxidation of the peroxides) in their
highest oxidation states.
M
O
OR
M
O
OR
R
R
CH
Figure 1.10 Lewis acid (peroxometal) mechanism of early TM catalyzed AE.
The Sharpless AE system is one of the most thoroughly investigated processes. From the
rate determination and kinetics observation, it is proposed36, 37
that the Ti(tartrate) complex is
formed by removing two alkoxide ligands, and then the remaining two alkoxide ligands are
exchanged by TBHP and the allyl alcohol. The order of displacement is not certain. The rate-

20
determing step is the oxygen transfer from the coordinated hydroperoxide to one enantioface of a
coordinated allyl alcohol (Figure 1.11).
-2ROH[Ti(tartrate)(OR)2]
TBHP, AOH
-2ROH[Ti(tartrate)(OA)(OOtBu)]
oxygen transfer
[Ti(tartrate)(OE)(OOtBu)]
Ti(OR)4
+
tartrate
Figure 1.11 Ligand exchange in the Sharpless process. AOH: allylic alcohol; OA: allylic alkoxide; OE: epoxy alkoxide
It has been found that allyl alcohols with electron-donating groups increase the reaction
rate, while the substrates with electron-withdrawing groups decrease the rate, suggesting that the
olefin substrate acts as a nucleophile. The stoichiometric study shows that more than one active
Ti-tartrate species exist, but one 2: 2 titanium(IV) tartrate dimer species (Figure 1.12 a) is
dominant based on the FTIR and NMR analysis. In this dimer, hydroperoxide is coordinated to
Ti in η2 bidentate mode (Figure 1.12, b), which indicates that TBHP is sterically more
demanding than alkoxide. The DFT calculation agrees that the Ti-O-O is approaching the allyl
C=C moiety in a spiro fashion. The ester groups prefer the equatorial site in stead of axial in the
transition state, and they do not coordinate with the Ti center.

21
OTi
O
OTi
OO
R'ORO
CO2R'RO
R'OOC
OR
OR
(a)OR'O
OTi
O
OTi
OO
R'ORO
CO2R'RO
R'OOC COOR'
O
O
(b)
tBu
O
Figure 1.12 Structure of the active Ti-tartrate catalyst. (a) dominant [Ti(tartrate)2(OR)2]2
dimer; and (b) coordinated with TBHP.
1.3.5.2 Jacobsen-Katsuki Mn-Salen catalysts
It is generally accepted35
that a redox mechanism is involved in the late transition metal
complex-catalyzed AE, such as Mn, Fe and Ru, which have multiple oxidation states. An O=M
oxo species is initially formed with the oxidant, followed by oxygen atom transfer to an olefin by
the active intermediate (Figure 1.13). This intermediate is still in question and could be a
metallacycle, or a radical or cationic species. During the process, the oxidation state of metal
ions increase by 2.
Mx+2
O
L
R R
Mx
O
R
R
L
*
Figure 1.13 Redox mechanism of late transition metal catalyzed AE.
The mechanism of Jacobsen-Katsuki Mn-salen system has been a hot topic since it was
firstly reported in 1990. It is all agreed that the active species, a O=Mn(V) oxo species, is first

22
formed, followed by adding the olefin. In contrast to the Sharpless AE process, the Mn-salen
system does not require pre-coordination of the olefin to the metal center, hence unfunctional
olefins can be efficiently and selectively oxidized.
It is found38
that with various iodosylbenzene oxidants (PhIO, C6H5IO and MesIO) in Mn-
salen AE system, the cis/trans ratio is dependent on the oxidant. It is suggested the oxidant is
complexed with the Mn center, otherwise one single active species O=Mn(salen) would generate
similar cis/trans ratio under this condition. It is also found39
that the ligand counterions play a
role in the determination of epoxide isomer: Mn-salen catalysts with ligating counterions such as
Cl- yield trans epoxide as the major products, while with nonligating counterions such as PF6
-
give cis epoxide as the major product in the epoxidation of cis-stilbene. The reason is thought to
be the participation of different spin states of oxomanganese(V) salen intermediates and/or
multiple active oxidants in oxygen transfer.
The electronic properties of the ligand directly correlate with the enantioselectivity in
AE.26,35
The complex bearing electron-donating group in salen ligand shows the highest ee
values. It is proposed that the chiral selectivity is associated with the position of the transition
state along the reaction coordinate. In the presence of electron-withdrawing group, a more
reactive Mn oxo species is generated, which is added by an olefin in the early transition state and
yield lower selectivity, while a less reactive oxo species is produced, which undergoes a late
transition state and leads to higher selectivity. This is also clear evidence that the process reacts
without substrate precoordination.
The steric character of the ligand26,35
plays an important role in governing the trajectory of
the side-on approaching of the olefin, and as a consequence the chiral induction, especially the
substituents at the C2 symmetric diimine bridge and bulky substituents at the 3,3‟-positions. As
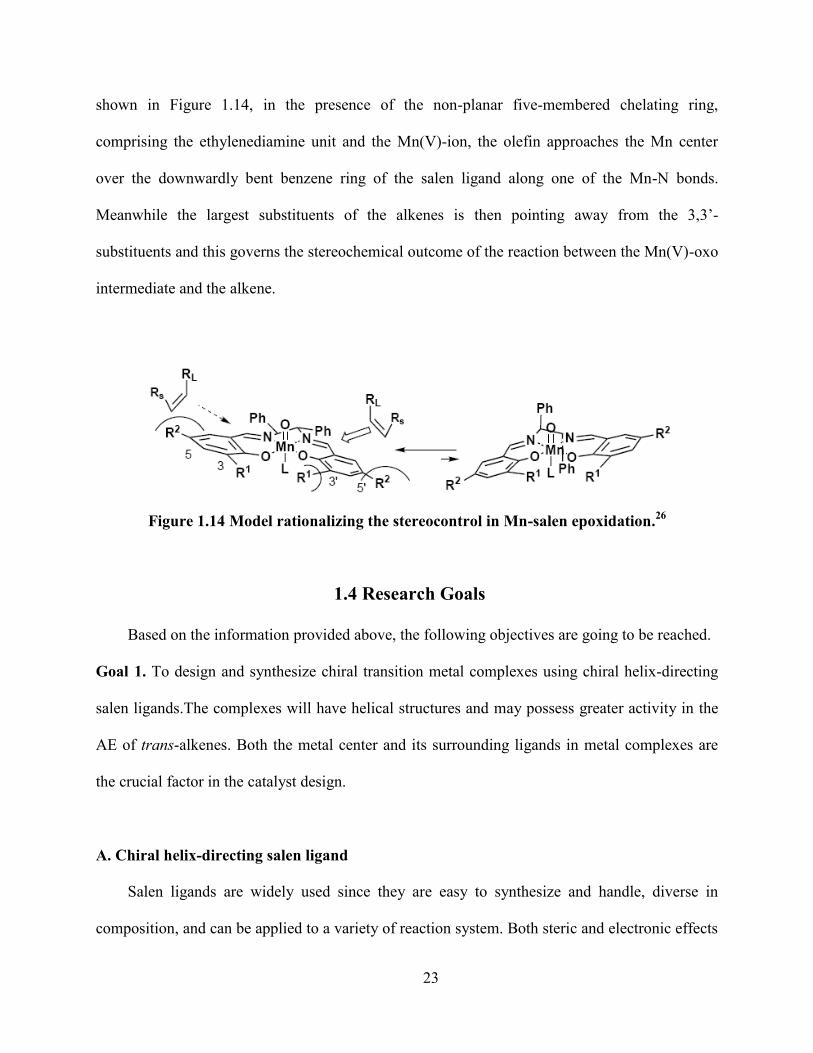
23
shown in Figure 1.14, in the presence of the non-planar five-membered chelating ring,
comprising the ethylenediamine unit and the Mn(V)-ion, the olefin approaches the Mn center
over the downwardly bent benzene ring of the salen ligand along one of the Mn-N bonds.
Meanwhile the largest substituents of the alkenes is then pointing away from the 3,3‟-
substituents and this governs the stereochemical outcome of the reaction between the Mn(V)-oxo
intermediate and the alkene.
Figure 1.14 Model rationalizing the stereocontrol in Mn-salen epoxidation.26
1.4 Research Goals
Based on the information provided above, the following objectives are going to be reached.
Goal 1. To design and synthesize chiral transition metal complexes using chiral helix-directing
salen ligands.The complexes will have helical structures and may possess greater activity in the
AE of trans-alkenes. Both the metal center and its surrounding ligands in metal complexes are
the crucial factor in the catalyst design.
A. Chiral helix-directing salen ligand
Salen ligands are widely used since they are easy to synthesize and handle, diverse in
composition, and can be applied to a variety of reaction system. Both steric and electronic effects

24
need to be considered when designing the salen ligand. The steric factors include ligand size,
flexibility and symmetry/chirality. The ligand size will not only determine the space around the
metal center, but also influence the associate/dissociate equilibrium. Usually, the dissociation of
the ligand transforms the metal complex to the active catalytic species. The ligand flexibility can
determine the ligand geometry and the coordination state in the catalytic cycle. And the
symmetry/chirality of ligand can influence the selectivity (both stereo and enantio) of product by
governing the trajectories of incoming olefins. Considering overlapping between π orbital of
substrate and d orbital of metal center of a helical complex, and easy access to the active center,
the side-on approaching from e is the most feasible in metal (Figure 1.15).
Figure 1.15 Possible trajectories for the approach of the substrate to the metal center of a
helical complex40
(left) and a O=Mn(salen) model, which is created using coordination of 12
(right).
Anionic phenoxide donors such as those incorporate within salen complexes are useful for
the oxidation, since readily stable intermediates with high valence can be generated. The
electronic character of the ligand is closely associated with the catalytic enantioselectivity in AE.
It is found26
that transition metal complexes bearing electron-donating group on the salen ligand

25
show higher ee values compared to that with electron-withdrawing substituentes. The reason is
proposed to be the different reactivity of metal oxo intermediate generated during the reaction.
In our group, some novel chiral helix-directing salen ligands (Figure 1.16) have been
already developed. The N2O2 donor set is suitable for complexation of a variety of transition
metals in various pattens (Figure 1.17).40,41,42
In addition, some transition metal salen complexes
are found to be effective catalyst in AE.2,8
Two distinct chiral diamine backbones (cyclohexyl
and binaphthyl) will not only introduce the chirality, but also provide a highly twisted shape to
the ligand, making helix formation possible after metallation. The chirality of the diamine bridge
is assumed to be transmitted to the two salicylidene rings only upon formation of the putative
species, leading to significant chiral distortion for effective stereochemical communication. Two
extended fused phenyl rings are applied as sidearms (benz[a]anthryl and phenanthryl). They are
rigid, planar and show low steric bulkiness so that they can wrap around one metal center.
Furthermore, the extended sidearms will overlap after metallation, to help to lock the
configuration, which will facilitate the selectivity in the reaction.

26
N
OH
N
HO
N
OH
N
HO
N
OH
N
HO
N
OH
N
HO
H2S1 H2S2
H2S3 H2S4
Figure 1.16 Schemic structures of chiral helix-directing salen ligands.
Figure 1.17 Examples of metal complexes chelated by our chiral helix-directing ligands.
Left, O=V(S2); right, (μ-O)2-[Mn(S1)]2.

27
B.Transition metal centers
The metal ion is another key factor in catalysis. Manganese and titanium salen complexes
have proved to be good catalyst in AE. However, all manganese complexes are paramagnetic and
difficult to characterize by NMR. They are also air/moisture sensitive. Manganese generally
prefers octahedral coordination, and Mn(III) complexes usually show a significant Jahn-Taller
elongation. In this work, manganese(II) salts (MnCl2, Mn(NO3)2 and Mn(OAc)2) are chosen as
the metal source in the complexation since they are easy to handle and readily oxidize to the 3+
state to produce catalyst precursors. And the anions from metal precursor may also participate in
complexation when the metal has a 3+ or higher oxidation state in metal-salen complexes. Both
the ligating ability and electronic features of counterions need to be considered in the catalytic
design, since they may affect the activity and selectivity of reactive species during catalysis.
Titanium is an early transition metal and d0 nature of Ti(IV) makes it suitable for NMR
characterization. In this thesis, two titanium(IV) salts are employed (TiCl4 and Ti(O-iPr)4) since
they are readily available and easily react with ligand. The effect of anions will also be observed
in the complexation and catalytic reactions. Since late and early transition metal complexes may
carry out different mechanisms during AE, the choice of manganese (late TM) and titanium
(early TM) may help us to better understand the distinct catalytic ways.
Goal 2. To examine the catalytic activity of helical complexes in asymmetric epoxidation.
As mentioned before, trans-olefin is a difficult target in AE due to the steric hinderance
between the substrate and active species when the substrate is approaching the active species
(Figure 1.18). To avoid this problem, the shape of active species must be deeply stepped. A
helical shape provides this structure. In addition, the helix is a highly asymmetric shape, which

28
can help the chiral induction, and may increase the activity due to the unique shape of
corresponding active species.
Figure 1.18 trans-alkene approaching the active species of Mn-salen catalyst.
Furthermore, the effects of metal precursor and various oxidants will also be tested, especially
those green oxidants such as aqueous H2O2, as well as the optimization of reaction conditions.
Besides the AE reaction of trans-alkene, other substrates (cis- and unfunctoinalized alkene)
and other oxidations may also be tried, to test the limitation of catalyst usage.
Goal 3. To facilitate the understanding of the mechanic process in catalysis.
The mechanism study involved in AE can not only improve the catalysis technology, but
also advance the fundamental knowledge in the area of chemical and biological system.
Computational chemistry is a good strategy in the study of mechanism. Some quantum
calculations have already been done in our lab to predict the solution conformation of some zinc
and iron salen complexes.42
Based on the direct experimental observation, the DFT calculation
(ADF) of simulated the CD spectra and confirmed the P/M assignment.

29
Figure 1.19 Simulated and experimental CD spectra of M-Zn(salen) complex.42
Such computation will predict/characterize the reaction intermediate (electronic
configuration, geometries and spin state, etc), profile energies barriers between transition states,
and explore individual steps in the catalytic cycle.
1.5 References
1. (a). Lewis, D. F. V. Guide to cytochromes P450: structure and function. Taylor&Francis,
London, 2001 (b).Schiff, H. About some reactions of the aminde oximes. Justus Liebigs
Annalen der Chemie 1902, 321, 357-371.
2. Katsuki, T. Unique asymmetric catalysis of cis- metal complexes of salen and its related
Schiff-base ligand. Chem. Soc. Rev. 2004, 33, 437-445.
3. Sheldon, R. A.; Kochi, J. K. Metal-catalyzed oxidations of organic compounds; Acedemic
Press, London, 1981.
4. Rothenberg, G. Catalysis, Wiley-VCH, Weinheim, 2008.
5. Katsuki, T. Chiral metallosalen complexes: structure and catalyst tuning for asymmetric
epoxidation and cyclopropanation. Adv. Synth. Catal. 2002, 344, 131-147.

30
6. Tokunage, M., Larrow, J. F., Kakiuchi, F., Jacobsen, E. N. Asymmetric catalysis with water;
efficient kinetic resolution of terminal epoxides by means of catalytic hydrolysis. Science,
1997, 277, 936-938.
7. Katsuki, T. Catalytic asymmetric oxidation using optically active (salen)manganese(III)
complexes as catalysts. Coord. Chem. Rev. 1995, 140, 189-214.
8. Konsler, R. G., Karl, J., Jacobsen, E. N. Cooperative asymmetric catalytic with dimeric salen
complexes. J. Am. Chem. Soc. 1998, 120, 10780-10781.
9. Uchida, T., Irie, R., Katsuki, T. cis- and enantio-selective cyclopropanation with chiral
(ON+)Ru-salen complexes as a catalyst. Tetrahedron, 2000, 56, 3501-3509.
10. Belokon, Y. N., Green, B., Ikonnikov, N. S., North, M., Parsons, T., Tararov, V. I. Optimized
catalysts for the asymmetric addition of trimethylsilyl cyanide to aldehydes and ketones.
Tetrahedron, 2001, 57, 771-779.
11. Belokon, Y. N., North, M.; Parsons, T. Vanadium-catalyzed asymmetric cyanohydrin
synthesis. Org, Lett. 2000, 2, 1617-1619.
12. Belokon, Y. N., North, M., Churkina, T. D.; Ikonnikov, N. S. Maleev, V. I. Chiral salen-
metal complexes as novel catalyst for the asymmetric synthesis of –amino acids under
phase transfer catalysis conditions. Tetrahedron, 2001, 57, 2491-2498.
13. Kight, P. D., Scott, P. Predetermination of chirality at octahedral centers with tetradentate
ligands: prospects for enantioselective catalysis. Coordin. Chem. Rev. 2003, 242, 125-143.
14. Lalehzari, A., Desper, J., Levy, C. J. Double-stranded monohelical complexes from an
unsymmetrical chiral schiff-base ligand. Inorg. Chem. 2008, 47, 1120-1126.
15. Garcia-Deibe, A. M., Sanmartin, M., Matalobos, J., Fondo, M., Vazquez, M., Bermejo, M. R.
Conformational studies on complexes of a diimine containing a (CH2)2 spacer: crystal

31
structure of a double-stranded Zn(II) meso-helicate and an enantiopure –Cu(II)
monohelicate. Inorg. Chimica Acta 2004, 357, 2561-2569.
16. Vazquez, M., Bermejo, M. R., Fondo, M., Garcia-Deibe, A. M., Sanmartin, J., Pedrido, R.,
Sorace, L., Gatteschi, D. Monohelical complexes of a novel asymmetric N4 Schiff base:
unfamiliar tetrahedral environments of manganese(II) and iron(II) helicates. Eurp. J. Inorg,
Chem. 2003, 1128-1135.
17. Constable, E. C., Chotalia, R., Tocher, T. A. The first example of a mono-helical complex of
2,2‟:6‟,2‟‟:6‟‟,2‟‟‟:6‟‟‟,2‟‟‟‟:6‟‟‟‟,2‟‟‟‟‟-sexipyridine: preparation, crystal and molecular
structure of bis(nitrato-O,O‟)(2,2‟:6‟,2‟‟:6‟‟,2‟‟‟:6‟‟‟,2‟‟‟‟:6‟‟‟‟,2‟‟‟‟‟-
sexipyridine)europium(III) nitrate. J. Chem. Soc. Chem. Comm. 1992, 771-773.
18. Bell, T. W., Jousselin, H. Self-assembly of a double-helical complex of sodium. Nature
1994, 367, 441-444.
19. Kawamoto, T., Kushi, Y. Synthesis and characterization of trinuclear metal complex showing
helical chirality. Chem. Lett. 1992, 2, 297-300.
20. Naskar, S., Naskar, S., Butcher, R. J., Chattopadhyay, S. K. Synthesis, X-ray crystal
structures and spectroscopic properties of two Ni(III) complexes of pyridoxal Schiff‟s bases
with diamines: importance of steric factor in stabilization of water helices in the lattices of
metal complex. Inorg. Chimi. Acta. 2010, 363, 404-411.
21. Anastas, P. T., Heine, L. G., Williamson, T. C. (Eds.) Green Chemical Synthesis and
Processes, 2000, American Society, Washington DC.
22. Rothenberg, G. Catalysis, 2008, Wiley-VCH, Weinheim.
23. http://www.mrw.interscience.wiley.com/kirk/ Kirk-othmer Encyclopedia of Chemical
Technology, John Wiley&Sons, New York, 2006.

32
24. http://www.mrw.interscience.wiley.com/ueic Ulmann‟s Encyclopedia of Industrial
Chemistry, Verlag Chemie, Weinheim.
25. Katsuki, T., Sharpless, K. B. The first practical method for asymmetric epoxidation. J. Am.
Chem. Soc. 1980, 102, 5974-5976.
26. Bachvall, J. E. (Ed.) Modern oxidation methods, 2004, Wiley-VCH, Weinheim
27. Grove, J. T., Nemo, T. E., Myers, R. S. Hydroxylation and epoxidation catalyzed by iron-
porphine complexes. Oxygen transfer from iodosylbenzene. J. Am. Chem. Soc. 1979, 101,
1032-1033.
28. Zhang, W., Loebach, J. L., Wilson, S. R., Jacobsen, E. N. Enantioselective epoxidation of
unfunctionalized olefins catalyzed by salen manganese complexes. J. Am. Chem. Soc. 1990,
112, 2801-2803.
29. Punniyamurthy, T., Velusamy, S., Iqbal, J. Recent advances in transition metal catalyzed
oxidation of organic substrates with molecular oxygen. Chem. Rev. 2005, 105, 2329-2363.
30. Grigoropoulou, G., Clark, J. H., Elings, J. A. Recent development on the epoxidation of
alkenes using hydrogen peroxide as an oxidant. Green Chem. 2003, 5, 1-7.
31. Irie, R., Noda, K., Ito, Y., Matsumoto, N., Katsuki, T. Catalytic asymmetric epoxidation of
unfunctionalized olefins. Tetrahedral Lett. 1990, 31, 7345-7348.
32. Berkessel, A., Frauenkron, M., Schwenkreis, T., Steinmetz, A., Baum, G., Fenske, D.
Pentacoordinated manganese(III) dihydrosalen complexes as biomimetic oxidation catalyst.
J. Mol. Catal. A: Chem. 1996, 113, 321-342.
33. Ito, Y., Katsuki, T. What is the origin of highly asymmetric induction by a chiral
(salen)manganese(III) complex? Design of a conformationally fixed complex and its

33
application to asymmetric epoxidation of 2,2-dimethylchromenes. Tetrahedral Lett. 1998, 39,
43254328.
34. Sawade, Y., Matsumoto, K., Kondo, S., Watanabe, H., Ozawa, T., Suzuki, K., Saito, B.,
Katsuki, T. Titanium-salan-catalyzed asymmetric epoxidation with aqueous hydrogen
peroxide as the oxidant. Angew. Chem. Int. Ed. 2006, 45, 3478-3480.
35. Oyama, S. T. (Ed.) Mechanisms in Homogeneous and Heterogeneous Epoxidation catalysis,
2008, Elsevier, Oxford, UK
36. Woodard, S. S., Finn, M. G., Sharpless, K. B. Mechanism of asymmetric epoxidation. 1.
kinetics. J. Am. Chem. Soc. 1991, 113, 106-113.
37. Finn, M. G., Sharpless, K. B. Mechanism of asymmetric epoxidation. 2. catalyst structure. J.
Am. Chem. Soc. 1991, 113, 113-126.
38. Collman, J. P., Zeng, L., Brauman, J. I. Donor ligand effect on the nature of the oxygenating
species in MnIII(salen)-catalyzed epoxidation of olefins: experimental evidence for multiple
active oxidants. Inorg. Chem. 2004, 43, 2672-2679.
39. Adam, W., Roschmann, K. J., Saha-Moller, C. R., Seebach, D. cis-stilbene and (1,2,3)-
(2-ethenyl-3-methoxycyclopropyl)benzene as mechanistic probes in the MnIII(salen)-
catalyzed epoxidation: influence of the oxygen source and the counterion on the
diastereoselectivity of the competitive concerted and radical-type oxygen transfer. J. Am.
Chem. Soc. 2002, 124, 5068-5073.
40.Wiznycia, A. V., Desper, J., Levy, C. J. Iron(II) and zinc(II) monohelical binaphthyl-salen
complexes with overlapping benz[a]anthryl sidearms. Dalton Transactions 2007, 15, 1520-
1527.

34
41. Wiznycia, A. V., Desper, J., Levy, C. J. Monohelical iron(II) and zine(II) complexes of a
(1R,2R)-cyclohexyl salen ligand with benz[a]anthryl sidearms. Inorg. Chem. 2006, 45,
10034-10036.
42. Wiznycia, A. V., Desper, J., Levy, C. J. Iron(II) and zinc(II) monohelical binaphthyl salen
complexes. Chem. Comm. 2005, 37, 4693-4695.

35
Chapter 2 - Synthesis, characterization and study of titanium(salen)
complexes
2.1 Introduction
Titanium salen complexes are some of the most versatile Lewis acid catalysts, used in a
wide range of reactions, such as ring-opening of epoxidations,1 Diels-Alder reactions,
2
sulfoxidations,3 addition of cyanides to aldehydes/ketones,
4 etc. These titanium salen complexes
can be monometallic5, homobimetallic
2,3 or heterobimetallic.
6 One reason for Ti(salen)
complexes as potential catalysts is that the N2O2 donor groups of salen ligands can wrap around a
Ti center to afford a variety of geometries.3 Furthermore, use of chiral ligands can lead to the
preferred formation of „chiral-at-Ti‟ complexes. All these are of great potential interest for
enantioselective catalysis. Currently, the mechanisms of these catalysts are uncertain and under
debate, due to the lack of structural models for reasonable catalyst intermediates.
2.2 Synthesis of Ti(salen) complexes
The synthesis of Ti(salen) complexes is straightforward (Figure 2.1). Solutions of salen
ligands (S1-S4) in anhydrous CH2Cl2 are metallated with equimolar TiCl4 to afford the dark red
crystalline complexes 1-4 [Ti(salen)Cl2]. The yield is between 70-90%. No added base is needed
to deprotonate the phenol groups. The unreacted ligands and TiCl4 salt are washed away by
hexane due to the low solubility of the complexes in hexane. The reactions are easily monitored
by an immediate color change from bright yellow/orange to dark brown upon adding TiCl4 to the
ligand solution. The 1H NMR spectra indicate that the products are of high purity.
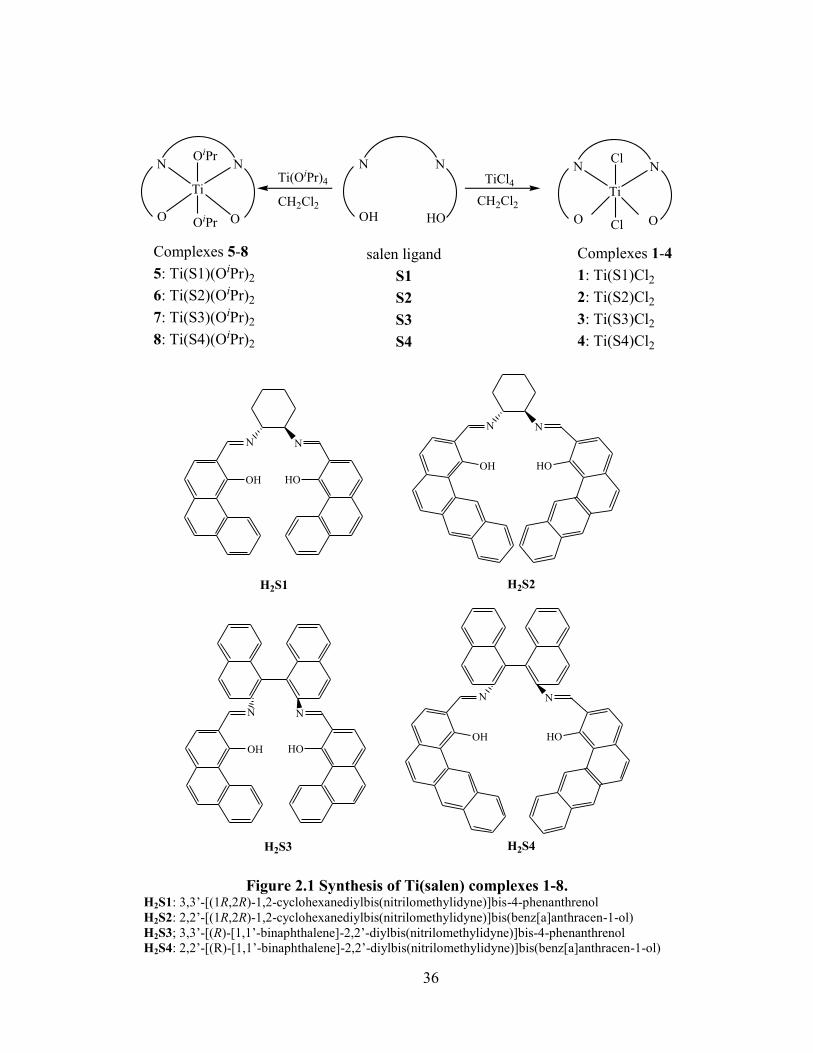
36
NN
OH HO
TiCl4
CH2Cl2CH2Cl2
Ti(OiPr)4
NN
O O
NN
O O
Ti
Cl
Cl
Ti
OiPr
OiPr
Complexes 1-4
1: Ti(S1)Cl2
2: Ti(S2)Cl2
3: Ti(S3)Cl2
4: Ti(S4)Cl2
Complexes 5-8
5: Ti(S1)(OiPr)2
6: Ti(S2)(OiPr)2
7: Ti(S3)(OiPr)2
8: Ti(S4)(OiPr)2
salen ligand
S1
S2
S3
S4
N
OH
N
HO
N
OH
N
HO
N
OH
N
HO
N
OH
N
HO
H2S1 H2S2
H2S3 H2S4
Figure 2.1 Synthesis of Ti(salen) complexes 1-8. H2S1: 3,3‟-[(1R,2R)-1,2-cyclohexanediylbis(nitrilomethylidyne)]bis-4-phenanthrenol
H2S2: 2,2‟-[(1R,2R)-1,2-cyclohexanediylbis(nitrilomethylidyne)]bis(benz[a]anthracen-1-ol)
H2S3; 3,3‟-[(R)-[1,1‟-binaphthalene]-2,2‟-diylbis(nitrilomethylidyne)]bis-4-phenanthrenol
H2S4: 2,2‟-[(R)-[1,1‟-binaphthalene]-2,2‟-diylbis(nitrilomethylidyne)]bis(benz[a]anthracen-1-ol)

37
In a similar process complexes 5-8 [Ti(salen)(OiPr)2] are synthesized by the dropwise
addition of a solution of Ti(OiPr)4 to an equimolar amount of salen ligand (H2S) in CH2Cl2. The
products are purified by decanting with diethyl ether and diethyl ether/hexane (1:1) mixture, in
order to remove unreacted Ti(OiPr)4 and ligands. The yield of greenish yellow powders is 65-
82%.
These new complexes 1-8 were characterized by UV/vis, IR and NMR, as well as mass
spectrometry and single crystal XRD. All these complexes are soluble in most organic solvents
and are extremely sensitive to moisture; therefore inert conditions must be employed.
2.3 Electronic and infrared spectra
0
0.2
0.4
0.6
0.8
1
1.2
1.4
1.6
1.8
200 250 300 350 400 450 500
wavelength/nm
Δε
1
4
ligand
Figure 2.2 UV-vis spectrum of complex 1 (dashed), 5 (wavy) and free ligand H2S1 (solid).
The UV-vis spectra of all complexes (1-8) in CH3CN show a single band in the region of
410-390 nm, which is assigned to the π-π* charge transfer band and is in accordance with a
3d04s
0 electronic configuration since no d-d transition would occur.
7 One more band is observed

38
at 290-270 nm for salen-TiCl4 and 310-300 nm for salen-Ti(OiPr)4, which may be due to
intraligand transitions.7
The characteristic IR bands of complex 1-8 are summarized in Table 2.1. Compared to the
free ligands, the red shift in the position of v(C=N) in the corresponding complexes indicates the
coordination of imine N to the Ti metal ion. Furthermore, the phenoxo v(C-O) bands are blue
shifted in the corresponding complexes, which indicates the coordination of phenol O to the
metal center (Figure 2.3.). In addition, the observation of a pair of bands around 740 and 620 cm-
1 indicates the presence of Ti-(μ-O)2 groups in complexes 5-8 (Table 2.2).
7,8,9
Figure 2.3 IR spectra of free ligand H2S1 (blue), complexes 1 (red) and 5 (green).
The characteristic bands derived from the aromatic region in the salen ligand and in the complex
are very complicated, and most are in the fingerprint region and very hard to assign. Thus, the
spectra suggest that salen ligands have complexed to Ti by coordination through imine nitrogens
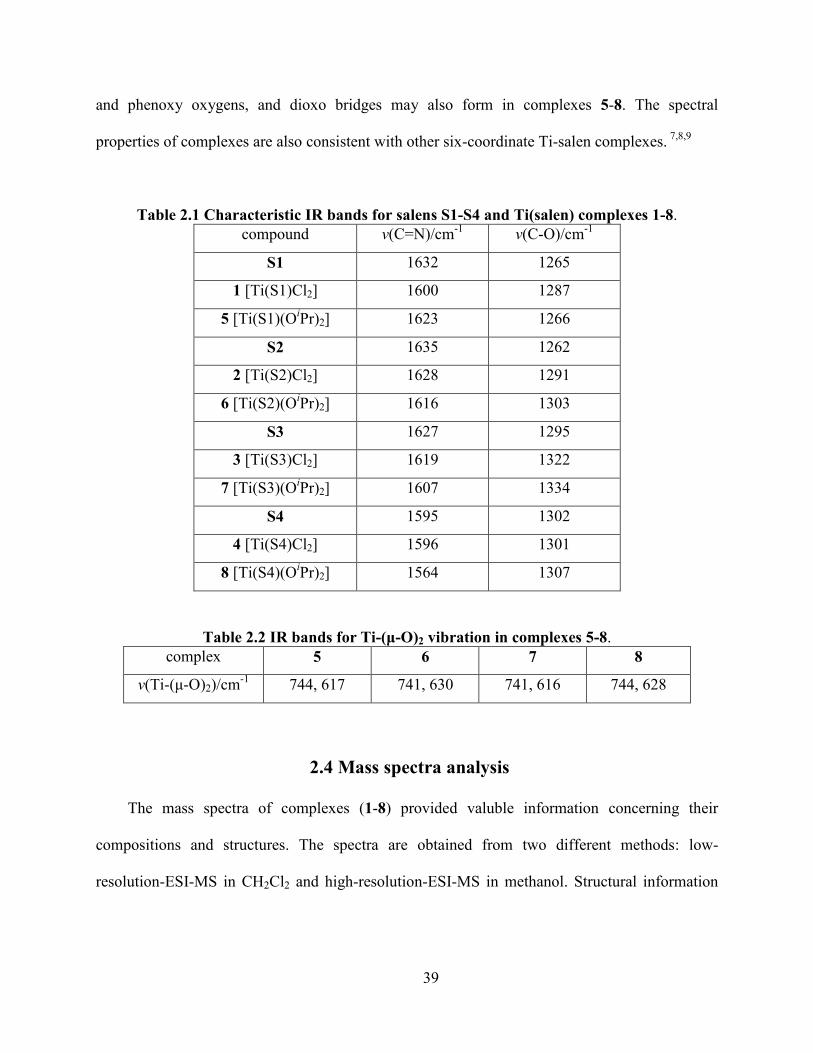
39
and phenoxy oxygens, and dioxo bridges may also form in complexes 5-8. The spectral
properties of complexes are also consistent with other six-coordinate Ti-salen complexes. 7,8,9
Table 2.1 Characteristic IR bands for salens S1-S4 and Ti(salen) complexes 1-8.
compound v(C=N)/cm-1
v(C-O)/cm-1
S1 1632 1265
1 [Ti(S1)Cl2] 1600 1287
5 [Ti(S1)(OiPr)2] 1623 1266
S2 1635 1262
2 [Ti(S2)Cl2] 1628 1291
6 [Ti(S2)(OiPr)2] 1616 1303
S3 1627 1295
3 [Ti(S3)Cl2] 1619 1322
7 [Ti(S3)(OiPr)2] 1607 1334
S4 1595 1302
4 [Ti(S4)Cl2] 1596 1301
8 [Ti(S4)(OiPr)2] 1564 1307
Table 2.2 IR bands for Ti-(μ-O)2 vibration in complexes 5-8.
complex 5 6 7 8
v(Ti-(μ-O)2)/cm-1
744, 617 741, 630 741, 616 744, 628
2.4 Mass spectra analysis
The mass spectra of complexes (1-8) provided valuble information concerning their
compositions and structures. The spectra are obtained from two different methods: low-
resolution-ESI-MS in CH2Cl2 and high-resolution-ESI-MS in methanol. Structural information

40
can be provided from the mass peaks in the molecular ion cluster and from the isotope patterns
which are matched to those calculated for particular chemical compositions.
2.4.1 Complexes 1-4, Ti(salen)Cl2
The mass spectra of the Ti(salen)Cl2 complexes 1-4 are highly sensitive to the methods used
to ionize the sample. In CH2Cl2 solutions, the mass spectra clearly show the molecular ion peaks
for the [Ti(salen)Cl]+ species except for complex 1. While the spectra recorded from HR-ESI-
MS in MeOH solution show the high-intensity peaks corresponding to [Ti(salen)(OMe)]+
species. These results agree with Katsuki‟s10
and Belokon‟s6 work on the method-dependence of
the structure of Ti(salen) complexes. The bimetallic species [(salen)Ti(μ-O)(μ-OMe)Ti(salen)]+
is also observed for complex 1 by HR-MS (m/z = 1183.3378, calc. 1183.3394, 1.4 ppm), while
not in the complexes 2-4 since the masses for the dimeric species were beyond the measurement
limits of the instrument. The mass spectra also illustrate the presence of fragments of free ligand
below m/z = 550.
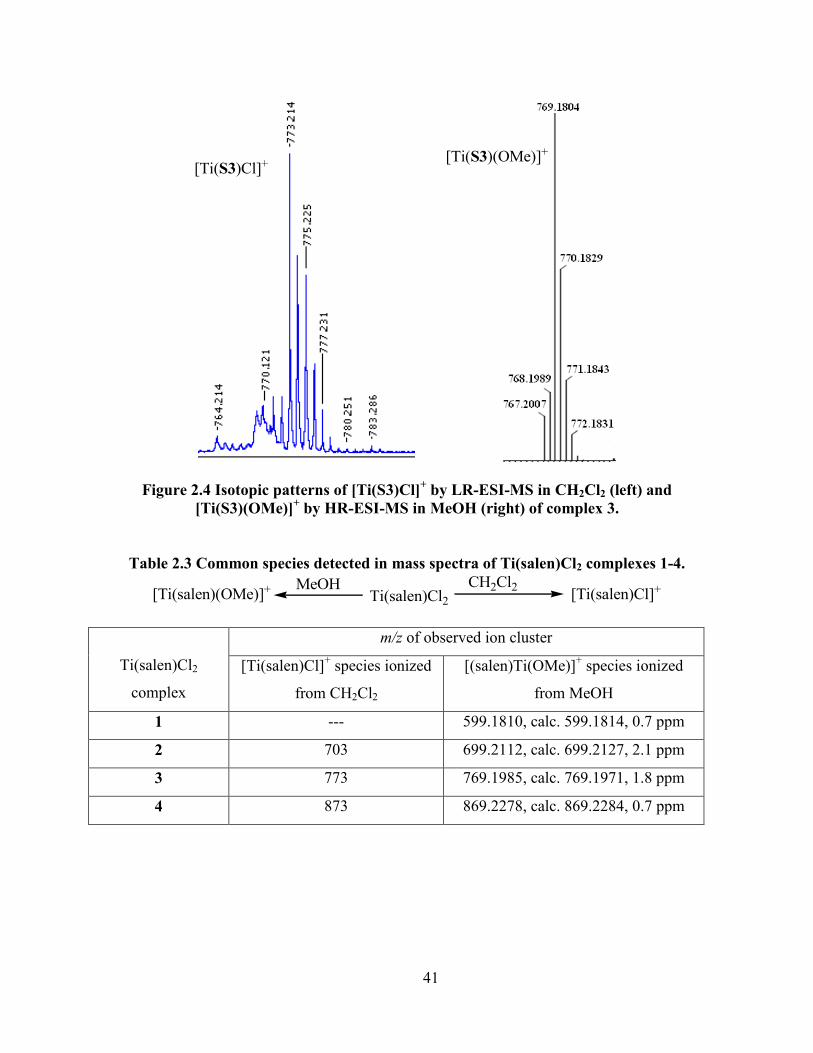
41
Figure 2.4 Isotopic patterns of [Ti(S3)Cl]+ by LR-ESI-MS in CH2Cl2 (left) and
[Ti(S3)(OMe)]+ by HR-ESI-MS in MeOH (right) of complex 3.
Table 2.3 Common species detected in mass spectra of Ti(salen)Cl2 complexes 1-4.
Ti(salen)Cl2CH2Cl2MeOH
[Ti(salen)Cl]+[Ti(salen)(OMe)]+
Ti(salen)Cl2
complex
m/z of observed ion cluster
[Ti(salen)Cl]+ species ionized
from CH2Cl2
[(salen)Ti(OMe)]+ species ionized
from MeOH
1 --- 599.1810, calc. 599.1814, 0.7 ppm
2 703 699.2112, calc. 699.2127, 2.1 ppm
3 773 769.1985, calc. 769.1971, 1.8 ppm
4 873 869.2278, calc. 869.2284, 0.7 ppm
[Ti(S3)Cl]+[Ti(S3)(OMe)]+

42
2.4.2 Complexes 5-8 Ti(salen)(OiPr)2
Ti(salen) complexes 5-8 synthesized from the Ti(OiPr)4 precursor give good and distinct
mass spectrometric results using both methods, but all these spectra are different from those of
Ti(salen)Cl2. In the CH2Cl2 sample, the signals indicate the presence of the mononuclear species
[Ti(salen)(OH)]+ and [Ti(salen)(O
iPr)]
+. Besides these main peaks, those corresponding to the
possible dimeric species are also visible, due to the high m/z value, but are not able to be
assigned. The mass peaks below m/z = 500 clearly indicates the fragment of free ligands.
Figure 2.5 Isotopic patterns of [Ti(S3)(OH)]+ and [Ti(S3)(O
iPr)]
+ by LR-ESI-MS in CH2Cl2
(left) of complex 7.
In the spectra recorded from methanol solution (Figure 2.6), both methoxo mononuclear
[Ti(salen)(OMe)]+ and dimeric [(salen)Ti(μ-O)(μ-OMe)Ti(salen)]
+ species are clearly identified,
suggesting that conversion of the di-μ-oxo complex to a monomeric Ti(salen) complex occurs
smoothly in methanol. The relative intensities of these two species are comparable in complexes
5 and 6, while the relative intensities of monomer are much higher than those of dimer in
[Ti(S3)(OH)]+
[Ti(S3)(OiPr)]+
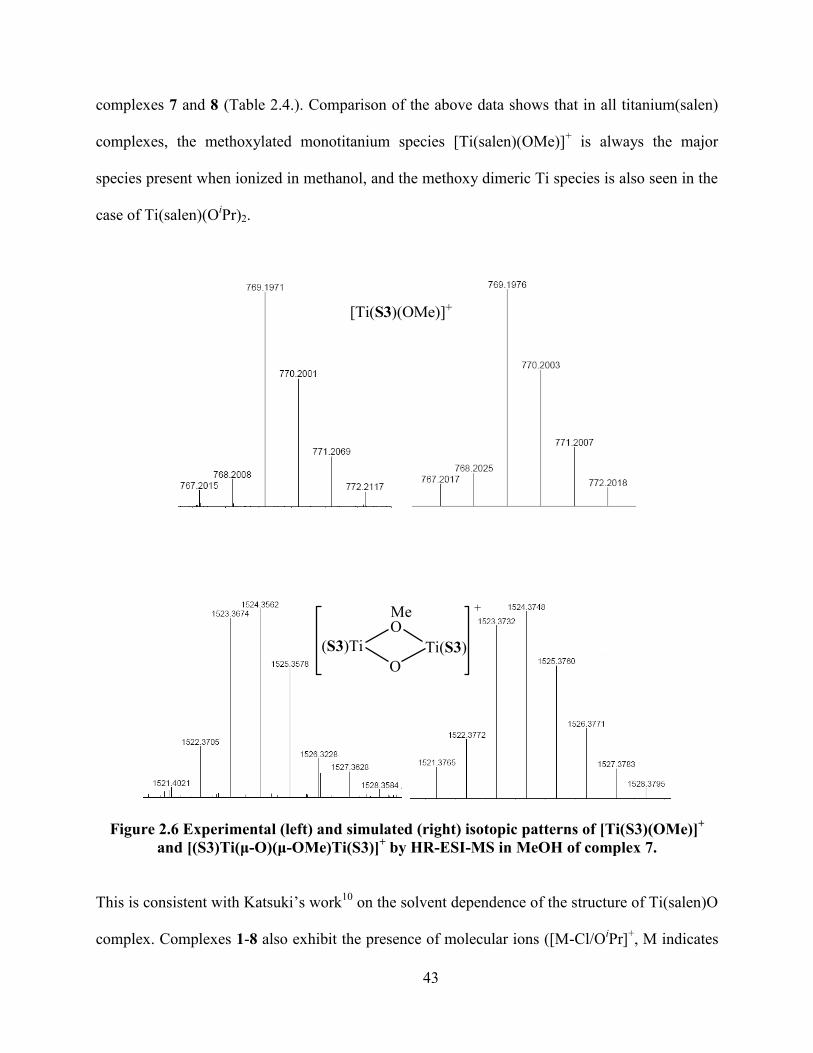
43
complexes 7 and 8 (Table 2.4.). Comparison of the above data shows that in all titanium(salen)
complexes, the methoxylated monotitanium species [Ti(salen)(OMe)]+ is always the major
species present when ionized in methanol, and the methoxy dimeric Ti species is also seen in the
case of Ti(salen)(OiPr)2.
Figure 2.6 Experimental (left) and simulated (right) isotopic patterns of [Ti(S3)(OMe)]+
and [(S3)Ti(μ-O)(μ-OMe)Ti(S3)]+ by HR-ESI-MS in MeOH of complex 7.
This is consistent with Katsuki‟s work10
on the solvent dependence of the structure of Ti(salen)O
complex. Complexes 1-8 also exhibit the presence of molecular ions ([M-Cl/OiPr]
+, M indicates
[Ti(S3)(OMe)]+
O
O
Ti(S3)(S3)Ti
Me +
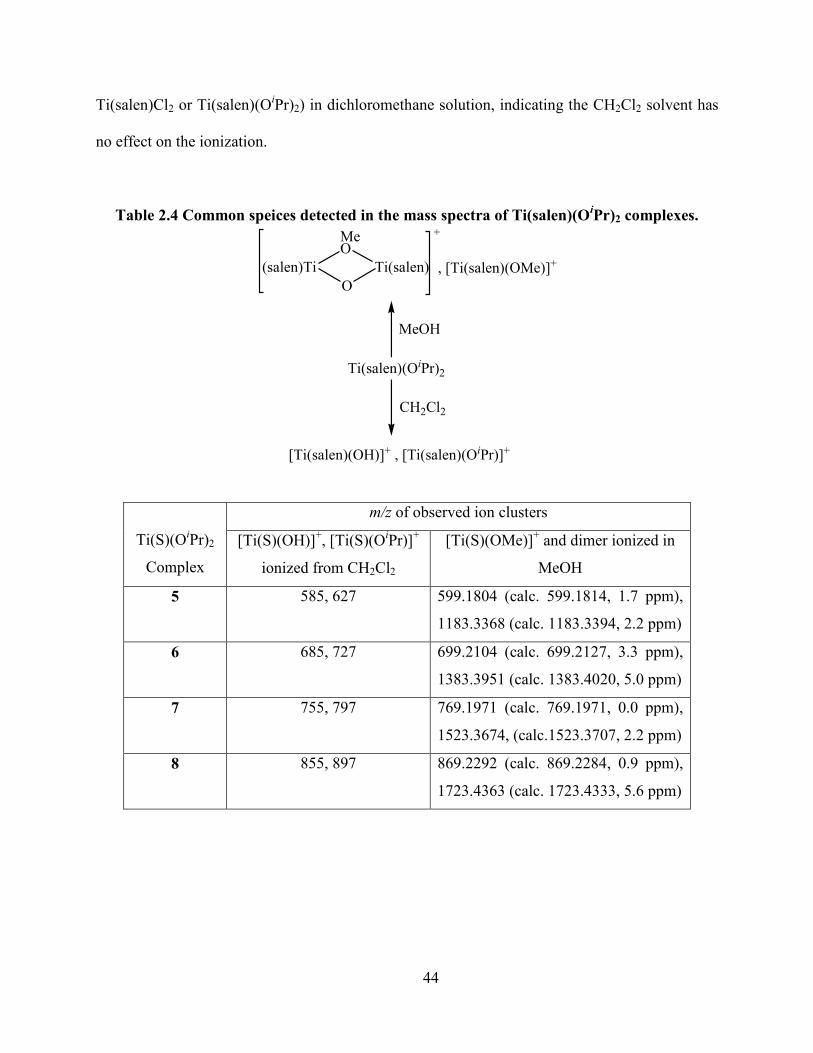
44
Ti(salen)Cl2 or Ti(salen)(OiPr)2) in dichloromethane solution, indicating the CH2Cl2 solvent has
no effect on the ionization.
Table 2.4 Common speices detected in the mass spectra of Ti(salen)(OiPr)2 complexes.
Ti(salen)(OiPr)2
CH2Cl2
MeOH
[Ti(salen)(OH)]+ , [Ti(salen)(OiPr)]+
, [Ti(salen)(OMe)]+
MeO
O
Ti(salen)(salen)Ti
+
Ti(S)(OiPr)2
Complex
m/z of observed ion clusters
[Ti(S)(OH)]+, [Ti(S)(O
iPr)]
+
ionized from CH2Cl2
[Ti(S)(OMe)]+ and dimer ionized in
MeOH
5 585, 627 599.1804 (calc. 599.1814, 1.7 ppm),
1183.3368 (calc. 1183.3394, 2.2 ppm)
6 685, 727 699.2104 (calc. 699.2127, 3.3 ppm),
1383.3951 (calc. 1383.4020, 5.0 ppm)
7 755, 797 769.1971 (calc. 769.1971, 0.0 ppm),
1523.3674, (calc.1523.3707, 2.2 ppm)
8 855, 897 869.2292 (calc. 869.2284, 0.9 ppm),
1723.4363 (calc. 1723.4333, 5.6 ppm)

45
2.4.3 Doubly charged polymeric species derived from complexes coordinated with
ligands bearing the cyclohexyl backbone
Besides those signals for singly charged species, more than one doubly charged polymeric
species are observed in complexes 1, 2, 5 and 6 by HR-MS (Figure 2.7, Table 2.5). No evidence
for the formation of such species is detected in complexes 3, 4, 7 and 8, since none of the isotope
peaks occurred at half-integer spacing.
The three polymeric species from complex 1 are identical to those seen for complex 5,
while the only species from complex 2 is also the same as one of the three from 6. In these
doubly charged polymers, tri-titanium species are the most abundant in all cases. The quatra-
titanium oligomers are the least abundant in complexes 1 and 5 with same salen ligands.
Belokon6 has isolated a trinuclear titanium(salen) complex, in which each Ti ion is coordinated
by a salen ligand and linked by oxo groups. It is proposed that the nature of the backbone may
play an important role in the unique ionization pathway. The binaphthyl backbone is more rigid
and sterically demanding than the cyclohexyl backbone. The Ti-coordinate salen ligands have to
adjust their conformation/structure, in order to facilitate the formation of such polymeric species.
The metal precursor may have little effect on the ionization, since no difference is found between
1, 2 (using TiCl4 as precursor) and 5 and 6 (using Ti(OiPr)4 as precursor). Furthermore, the π-π*
stacking effect from the sidearms may influence the population of each species, such as di-
Ti(salen) species is the least abundant in complex 6, but the quasi-Ti(salen) one is the least
abundant in complex 5.
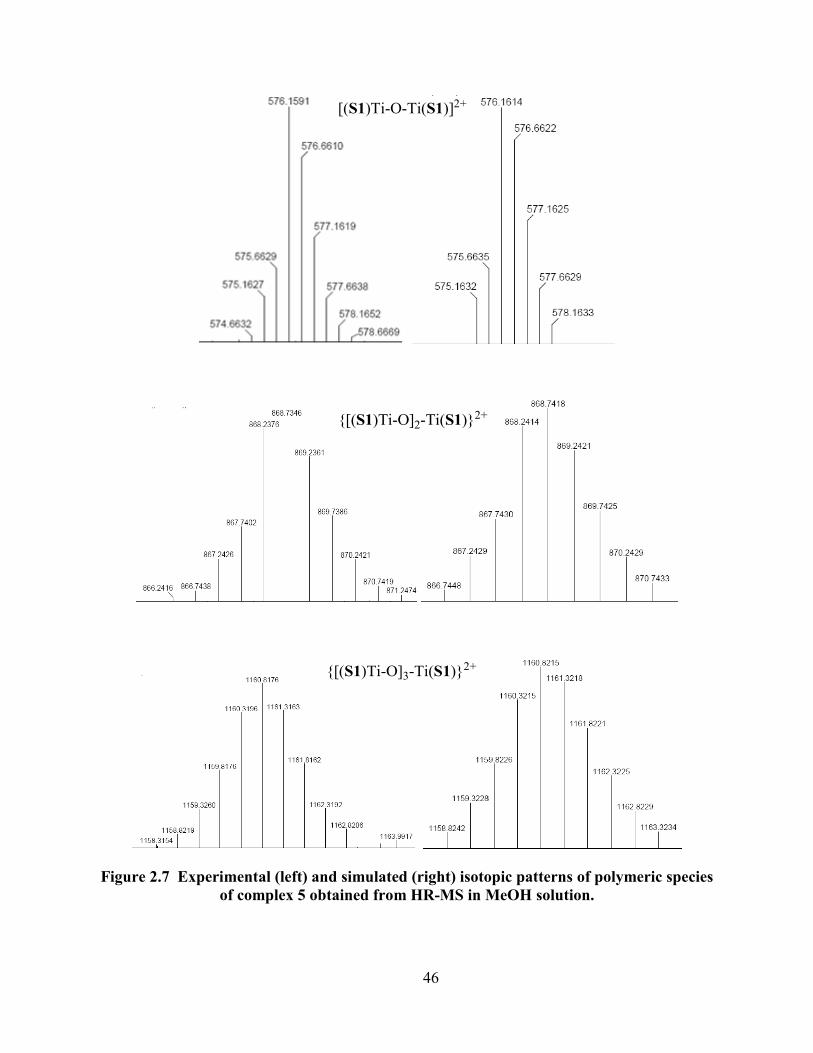
46
Figure 2.7 Experimental (left) and simulated (right) isotopic patterns of polymeric species
of complex 5 obtained from HR-MS in MeOH solution.
[(S1)Ti-O-Ti(S1)]2+
{[(S1)Ti-O]2-Ti(S1)}2+
{[(S1)Ti-O]3-Ti(S1)}2+

47
Table 2.5 Doubly charged species from complexes 1, 2, 5 and 6 by HR-ESI-MS.
Complex m/z of observed ion clusters {[Ti(salen)-O-]n-Ti(Salen)}2+
1 [Ti(S1)Cl2]
n=1, 576.1591, calc. 576.1605, 2.4 ppm (27%)
n=2, 868.2376, calc. 868.2395, 2.1 ppm (64%)
n=3, 1160.3196, calc. 1160.3184, 1.0 ppm (9%)
2 [Ti(S2)Cl2] n=2, 1018.7870, calc. 1018.7903 3.2 ppm (100%)
5 [Ti(S1)(OiPr)2]
n=1, 576.1613 ,calc. 576.1605, 1.4 ppm (30%)
n=2, 868.2381, calc. 868.2395, 1.5 ppm (47%)
n=3, 1160.8184, calc. 1160.3184, 3.4 ppm, (23%)
6 [Ti(S2)(OiPr)2]
n=1, 676.1913, cacl. 676.1918, 0.7 ppm (23%)
n=2, 1018.7809, cacl. 1018. 7903, 3.6 ppm (52%)
n=3, 1360.8773, calc. 1360.3810, 2.7 ppm (25%)
The numbers in the bracket indicates the abudances.
2.5 Proton NMR studies
Tetradentate salen ligands can afford three pseudo-octahedral-coordinated isomers, namely
trans, cis-α and cis-β (Figure 2.8). The three isomers have distinct symmetric elements (C2 for
trans and cis-α, C1 for cis-β), which will lead to the distinct 1H NMR patterns.
11,12
MN N
O O
X
Y
trans
MNN
X
O
Y
O
cis-α
MNN
X
O
O
Y
cis-β
Figure 2.8 Three isomers of octahedral metallosalen complexes.
The complexes (1-8) are characterized by 1H NMR in CDCl3. The chemical shift of phenol
protons in ligands are all above 12 ppm, while the signals in complexes disappear due to

48
deprotonation. Both the imine protons and bay protons are shifted downfield/upfield according to
the individual case due to deshielding/shielding effects after metallation, indicating the
coordination of the phenol oxygen and imino nitrogen atoms to the metal(s).
The 1H NMR spectrum of complex 1 in CDCl3 (Figure 2.9) shows only one major set of
resonances, which indicates only one species present. The number of resonances is half the
number of possible resonances, indicating the presence of a C2 symmetric, trans or cis-α
molecule (Figure 2.10).12
In the crystal analysis each Ti(salen)Cl unit also shows as trans-
isomer, even though the whole molecule is an oxo-bridged dititanium salen complex (see Section
2.6.1.).
Figure 2.9 1H NMR spectrum of complex 1 in CDCl3: upper, aromatic; lower, aliphatic
regions.
N
O
N
O
Ti
Cl
Cl
Hb
HiHi
Hb
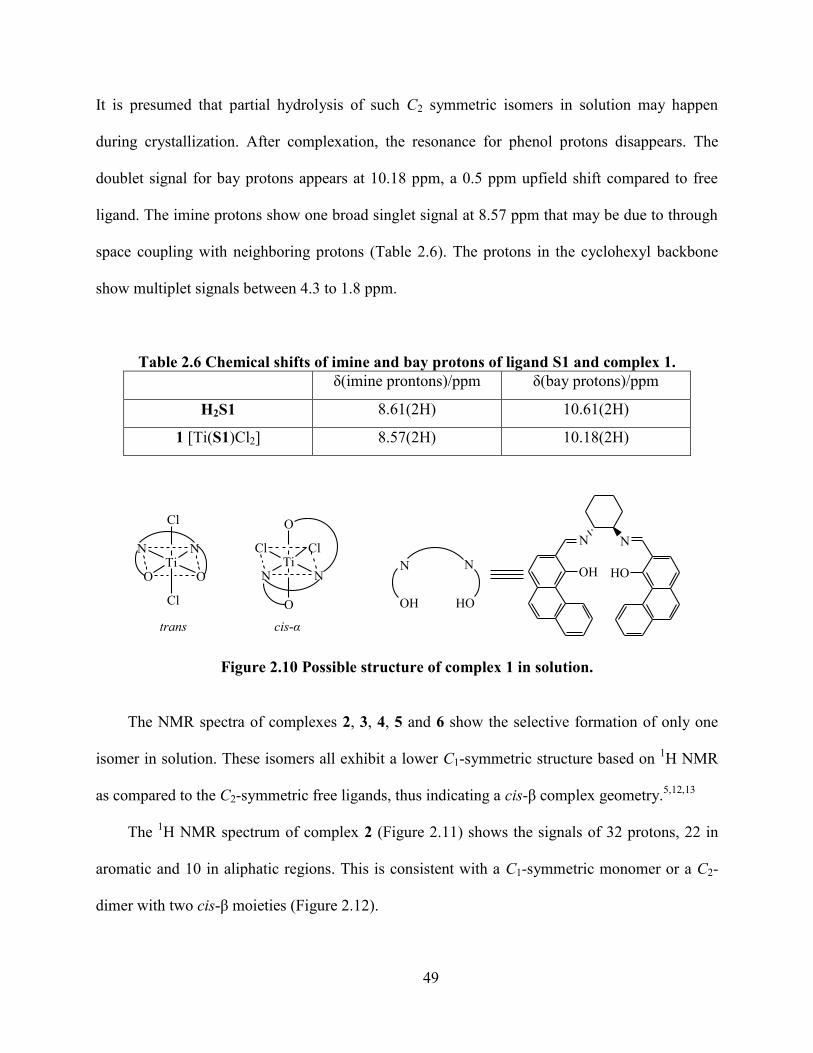
49
It is presumed that partial hydrolysis of such C2 symmetric isomers in solution may happen
during crystallization. After complexation, the resonance for phenol protons disappears. The
doublet signal for bay protons appears at 10.18 ppm, a 0.5 ppm upfield shift compared to free
ligand. The imine protons show one broad singlet signal at 8.57 ppm that may be due to through
space coupling with neighboring protons (Table 2.6). The protons in the cyclohexyl backbone
show multiplet signals between 4.3 to 1.8 ppm.
Table 2.6 Chemical shifts of imine and bay protons of ligand S1 and complex 1.
δ(imine prontons)/ppm δ(bay protons)/ppm
H2S1 8.61(2H) 10.61(2H)
1 [Ti(S1)Cl2] 8.57(2H) 10.18(2H)
TiN N
O O
Cl
Cl
trans
TiNN
Cl
O
O
Cl
cis-α
N
OH
N
HO
OH
N N
HO
Figure 2.10 Possible structure of complex 1 in solution.
The NMR spectra of complexes 2, 3, 4, 5 and 6 show the selective formation of only one
isomer in solution. These isomers all exhibit a lower C1-symmetric structure based on 1H NMR
as compared to the C2-symmetric free ligands, thus indicating a cis-β complex geometry.5,12,13
The 1H NMR spectrum of complex 2 (Figure 2.11) shows the signals of 32 protons, 22 in
aromatic and 10 in aliphatic regions. This is consistent with a C1-symmetric monomer or a C2-
dimer with two cis-β moieties (Figure 2.12).

50
Figure 2.11 1H NMR spectrum of complex 2 in CDCl3: upper, aromatic; lower, aliphatic
regions.
The protons from the cylcohexyl backbone appear as broadened multiplets peaks in the
aliphatic region due to the fluctuation of the ring. The methine protons can be found at 4.20 and
2.70 ppm, separated by 1.5 ppm. The methylene protons are partly separated in the area of 2.22-
1.49 ppm. In the aromatic region, three singlet signals (10.49, 8.60, 8.33 ppm) are clearly found,
which may be assigned to the 2 bay protons and 1 imine proton. The doublet resonance at 7.99
ppm may be assigned to the other imine proton, due to coupling to the adjacent aromatic proton
after coordination (Table 2.7). This is supported by the triplet signal around 6.18 ppm, which is a
N
O
N
O
Ti
Cl
Cl
H'b Hb
HiH'i

51
doublet at 7.11 ppm in free ligand. The upfield shift may be caused by the increased deshielding
effect after metallation.
Table 2.7 Chemical shifts of imine and bay protons of ligand S2 and complex 2.
δ(imine prontons)/ppm δ(bay protons)/ppm
H2S2 8.62(2H) 11.21(2H)
2 [Ti(S2)Cl2] 8.33(1H), 7.99(d/1H) 10.49(1H), 8.60(1H)
TiNN
Cl
O
Cl
O
cis-β monomer
TiNN
B
O
O
TiN N
B
O
O
C2 symmetric dimer
combined with cis-β monomers
B: (-2) charged bridging group
N
OH
N
HO
OH
N N
HO
Figure 2.12 Possible structures of complex 2 in solution.
The 1H NMR spectrum of complex 3 (Figure 2.13) indicates the presence of a cis-β
monomer or a C2 symmetric dimer with two cis-β halves like complex 2. The formation of a cis-
β structure is confirmed by the X-ray crystal structure analysis of complex 3 (see Section 2.6.2).
Two resonances for the bay protons (10.13 and 10.25 ppm) are observed as doublets, which are
separated by 0.12 ppm and correspond to one proton each. Accordingly, the imine protons (8.40
and 8.66 ppm) also appear as separated singlet signals (Table 2.8). The other aromatic signals
(8.2-6.90 ppm) are too complicated and overlapped to completely assign, and both upfield and
downfield shifts are observe in this area relative to the free ligand.

52
Figure 2.13 1H NMR spectrum of complex 3 in CDCl3.
Table 2.8 Chemical shifts of imine and bay protons of ligand S3 and complex 3.
δ(imine prontons)/ppm δ(bay protons)/ppm
H2S3 8.80(2H) 9.44(2H)
3 [Ti(S3)Cl2] 8.40(1H), 8.66(1H) 10.13(1H), 10.25(1H)
The 1H NMR spectum of complex 4 (Figure 2.14) exhibits a new set signal for a C1
symmetric molecule, besides the set seen for C2 symmetric ligand, indicating that both the ligand
and the Ti complex are present. Two bay protons are observed at 10.85 and 10.59 ppm,
downfield shifted compared to the free ligand. The singlet signals at 8.66 and 8.36 ppm are
assigned to the imine protons (Table 2.9). Two aromatic multiplet peaks upfield shift to 6.96 and
6.31 ppm, due to the chelating to the highly positively charged metal center.
N
O
N
O
Ti
Cl
ClHiH'i
HbH'b
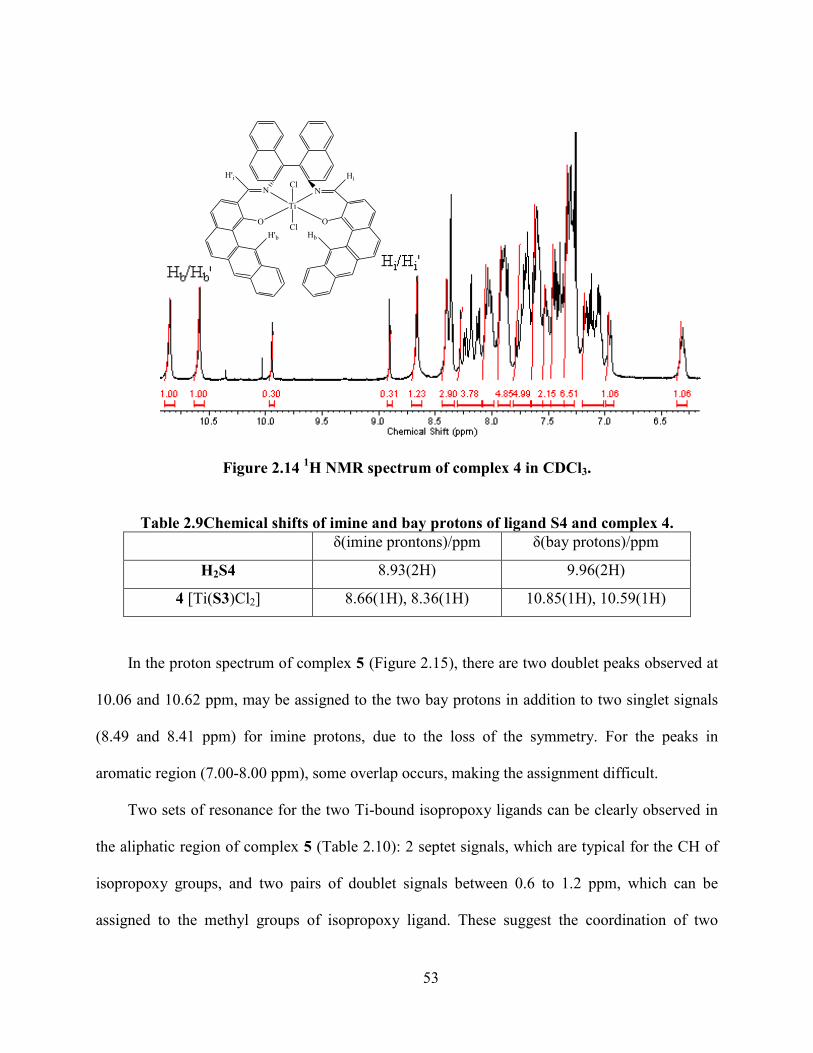
53
Figure 2.14 1H NMR spectrum of complex 4 in CDCl3.
Table 2.9Chemical shifts of imine and bay protons of ligand S4 and complex 4.
δ(imine prontons)/ppm δ(bay protons)/ppm
H2S4 8.93(2H) 9.96(2H)
4 [Ti(S3)Cl2] 8.66(1H), 8.36(1H) 10.85(1H), 10.59(1H)
In the proton spectrum of complex 5 (Figure 2.15), there are two doublet peaks observed at
10.06 and 10.62 ppm, may be assigned to the two bay protons in addition to two singlet signals
(8.49 and 8.41 ppm) for imine protons, due to the loss of the symmetry. For the peaks in
aromatic region (7.00-8.00 ppm), some overlap occurs, making the assignment difficult.
Two sets of resonance for the two Ti-bound isopropoxy ligands can be clearly observed in
the aliphatic region of complex 5 (Table 2.10): 2 septet signals, which are typical for the CH of
isopropoxy groups, and two pairs of doublet signals between 0.6 to 1.2 ppm, which can be
assigned to the methyl groups of isopropoxy ligand. These suggest the coordination of two
N
O
N
O
Ti
Cl
Cl
H'b Hb
HiH'i

54
different isopropoxy ligands to Ti center. Therefore, the structure of complex 5 can be tentatively
proposed as (R,R)-cis-β-[Ti(salen)(OiPr)2] as show in Figure 2.16.
Figure 2.15 1H NMR spectrum of complex 5 in CDCl3: upper, aromatic; lower, aliphatic
regions.
N
O
N
O
Ti
OiPr'
OiPr
H'b Hb
HiH'i

55
Table 2.10 Proton NMR Chemical shifts of ligand H2S1 and complex 5.
δ(imine H)/ppm δ(bay H)/ppm δ(isopropoxy H)/ppm
H2S1 8.61(2H) 10.61(2H)
5
[Ti(S1)(OiPr)2]
8.49(1H)
8.41(1H)
10.06(1H)
10.62(1H)
4.62, 4.82 (overlap) for 2CH;
0.80, 0.85, 1.13, 1.18 for 4CH3
N
OH
N
HO
OH
N N
HO
TiNN
PrOi
O
OiPr
O
cis-β
Figure 2.16 Proposed structure of complex 5 in CDCl3 solution.
The NMR spectrum of complex 6 in figure 2.17 exhibits 22 proton signals in the aromatic
region and 24 protons in aliphatic region, which is consistent with a C1 symmetric structure. The
two imine signals are clearly visible as singlets at 8.53 and 8.45 ppm. Two singlet resonances for
bay protons are separately observed at 10.97 and 10.58 ppm. Two ArCH signals of complex 6
shift upfield below 7 ppm.
Similarly, two sets of typical signals for two isopropoxy groups apprear (Table 2.11). The
signal for one α proton in the cyclohexylene backbone shifts downfield to 4.87 ppm, which
overlaps with the methine proton from one isopropoxy group. This may be caused by the
inefficient shielding effect after metal complexation. The structure of complex 6 is proposed to
be quite similar to that of complex 5, due to the similar 1H NMR characteristics, while the
structure analysis by single crystal XRD is partially supported this proposal.

56
Figure 2.17 1H NMR spectrum of complex 6 in CDCl3. upper, aromatic; lower, aliphatic
regions.
Table 2.11 Proton NMR Chemical shifts of ligand H2S2 and complex 6.
δ(imine H)/ppm δ(bay H)/ppm δ(isopropoxy H)/ppm
H2S2 8.62(2H) 11.21(2H) -----
6
[Ti(S2)(OiPr)2]
8.53(1H)
8.45(1H)
10.97(1H)
10.58(1H)
4.58, 4.87 (overlap) for 2CH
1.14 (3H), 0.74 (9H)
The NMR analysis of complexes 7 and 8 reveal the formation of more than one species in
the NMR solution.
Figure 2.18 shows the 1H NMR spectra of complex 7 in CDCl3. There are two sets of peaks,
one set corresponding to a C1-symmetric structure and the other for a C2-symmetric compound
N
O
N
O
Ti
OiPr'
OiPr
H'b Hb
HiH'i
57
with a ratio of 1:1, according to the peak integrals of the spectra. No signals in the characteristic
phenol proton region can be observed in either set. In the C1 symmetric set, the characteristic
resonances for two isopropoxy groups appear in the aliphatic region (doublets at -0.22, 0.32,
overlapping around 0.92, and 0.98 ppm for CH3; 4.73 and 4.83 ppm for CH), and one doublet
signal for methyl proton is greatly shifted upfield to the negative area, due to complexation to the
positively charged Ti(IV) center (Table 2.12.). The doublet resonance for one bay proton can be
clearly observed at 10.78 ppm, significantly downfield by 1.34 ppm from the free ligand.
Additionally, the singlet for one imine proton appears at 8.38 ppm, which is upfield shifted from
8.80 ppm in the free ligand. The spectrum shows a broad multiplet at 10.58 ppm, which
corresponds to 3 protons. This may be caused by the overlapping of one bay proton in C1 species
and two bay protons from C2 species. The C2 set of signals shows one septet (4.55 ppm)
corresponding for 2H and overlapped multiplet (around 0.90 ppm) for 12H, indicating the
presence of two chemically equivalent isopropoxy groups. The other signals for both species are
quite difficult to assign, due to overlapping.
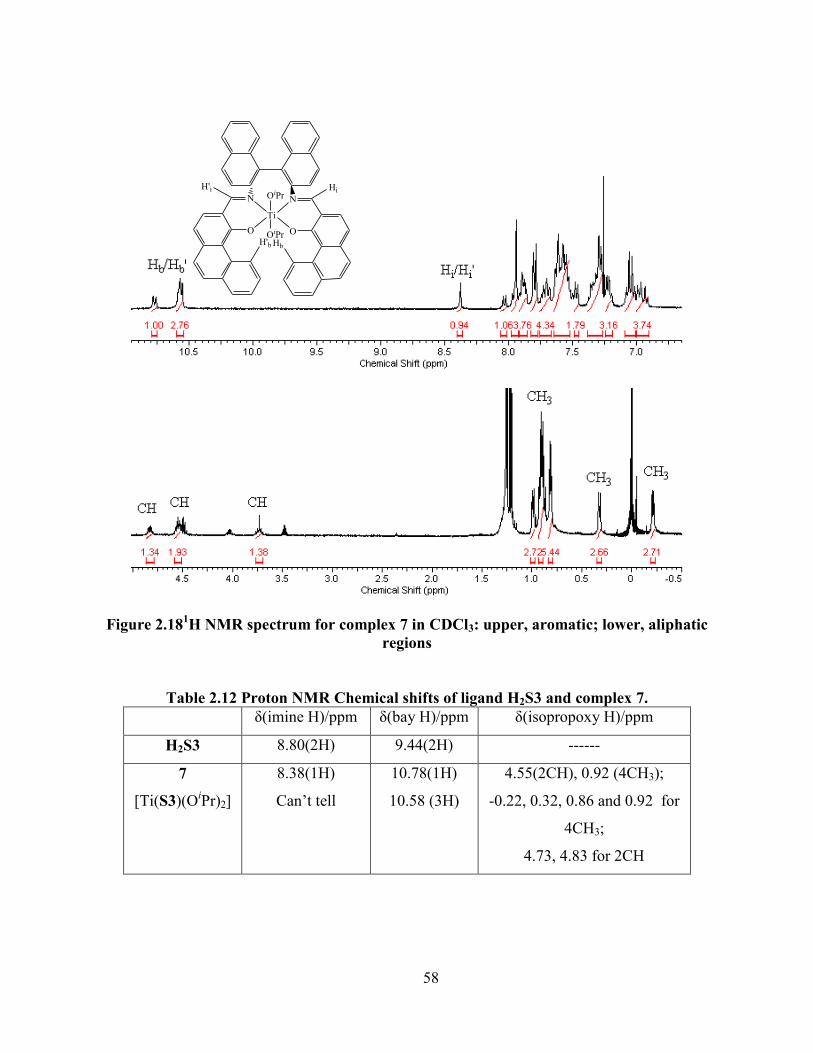
58
Figure 2.181H NMR spectrum for complex 7 in CDCl3: upper, aromatic; lower, aliphatic
regions
Table 2.12 Proton NMR Chemical shifts of ligand H2S3 and complex 7.
δ(imine H)/ppm δ(bay H)/ppm δ(isopropoxy H)/ppm
H2S3 8.80(2H) 9.44(2H) ------
7
[Ti(S3)(OiPr)2]
8.38(1H)
Can‟t tell
10.78(1H)
10.58 (3H)
4.55(2CH), 0.92 (4CH3);
-0.22, 0.32, 0.86 and 0.92 for
4CH3;
4.73, 4.83 for 2CH
N
O
N
O
Ti
OiPr
OiPrHiH'i
H'b Hb

59
All the above analysis suggests that the formation of a mixture of C1 symmetric cis-β
isomer and C2 symmetric trans/cis-α isomer of monomeric Ti(salen)(OiPr)2 complexes. The
latter two can not be distinguished by NMR analysis. All attempts to separate the mixed products
so that a single component is observed in solution have failed.
This indicates that there may be a solution equilibrium between the two species (Figure
2.19). However, the crystal structure shows somehow a different arrangement. There is no
isopropoxy group at all. And the dimeric structure shows an overall C2 symmetry, while each
(salen)Ti half shows a C1 symmtric element.
TiNN
PriO
O
OiPr
O
cis-β
TiN N
O O
OiPr
OiPr
trans
TiNN
PriO
O
O
OiPr
cis-α
or
1 : 1
OH
N N
HO
N
OH
N
HO
Figure 2.19 Possible equilibrium in the solution of complex 7.
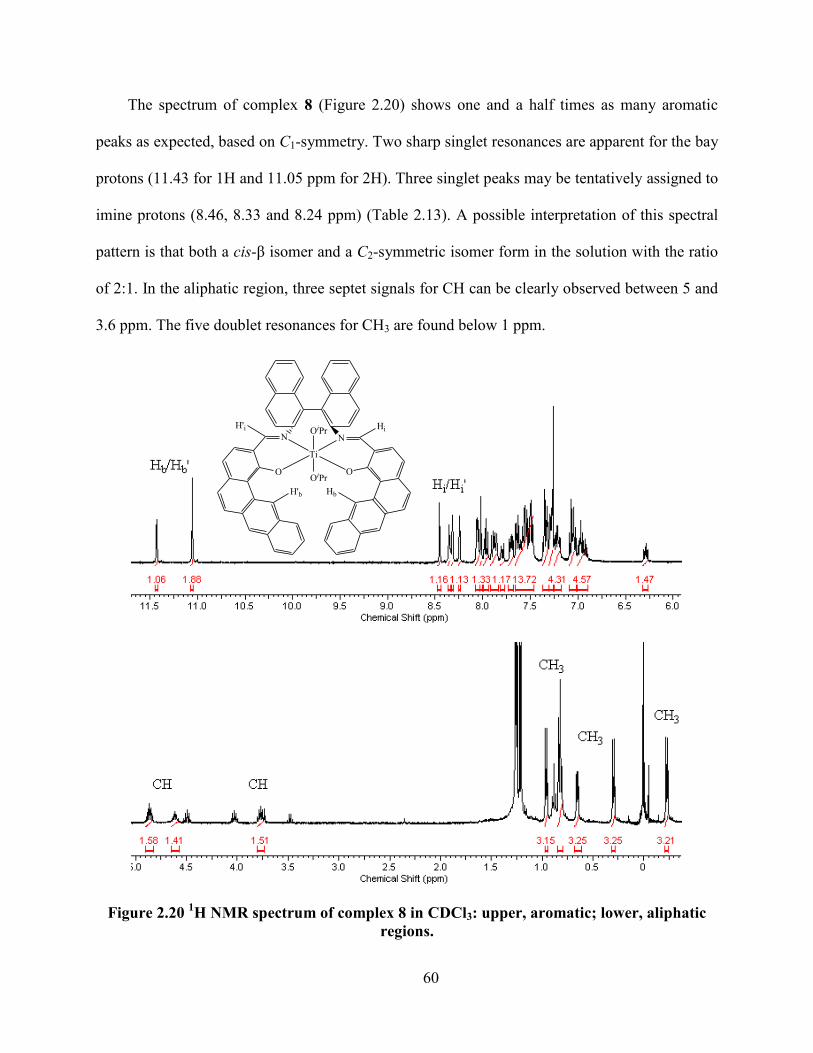
60
The spectrum of complex 8 (Figure 2.20) shows one and a half times as many aromatic
peaks as expected, based on C1-symmetry. Two sharp singlet resonances are apparent for the bay
protons (11.43 for 1H and 11.05 ppm for 2H). Three singlet peaks may be tentatively assigned to
imine protons (8.46, 8.33 and 8.24 ppm) (Table 2.13). A possible interpretation of this spectral
pattern is that both a cis-β isomer and a C2-symmetric isomer form in the solution with the ratio
of 2:1. In the aliphatic region, three septet signals for CH can be clearly observed between 5 and
3.6 ppm. The five doublet resonances for CH3 are found below 1 ppm.
Figure 2.20 1H NMR spectrum of complex 8 in CDCl3: upper, aromatic; lower, aliphatic
regions.
N
O
N
O
Ti
OiPr
OiPr
H'b Hb
HiH'i
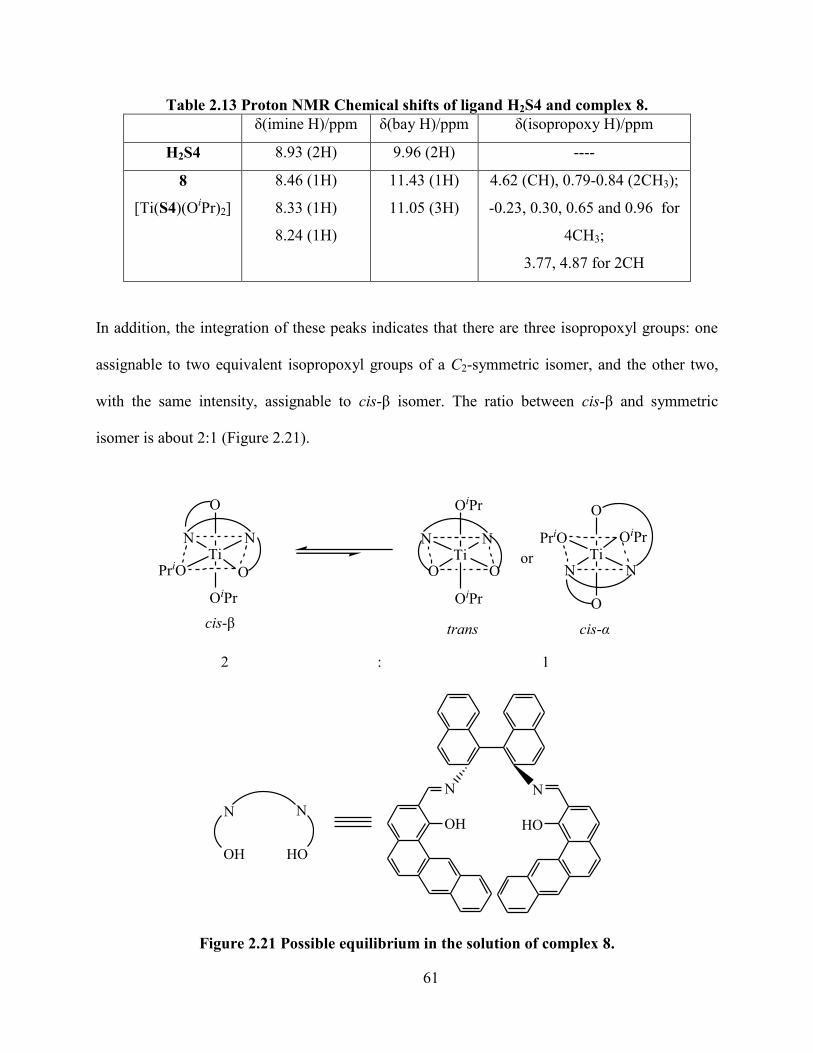
61
Table 2.13 Proton NMR Chemical shifts of ligand H2S4 and complex 8.
δ(imine H)/ppm δ(bay H)/ppm δ(isopropoxy H)/ppm
H2S4 8.93 (2H) 9.96 (2H) ----
8
[Ti(S4)(OiPr)2]
8.46 (1H)
8.33 (1H)
8.24 (1H)
11.43 (1H)
11.05 (3H)
4.62 (CH), 0.79-0.84 (2CH3);
-0.23, 0.30, 0.65 and 0.96 for
4CH3;
3.77, 4.87 for 2CH
In addition, the integration of these peaks indicates that there are three isopropoxyl groups: one
assignable to two equivalent isopropoxyl groups of a C2-symmetric isomer, and the other two,
with the same intensity, assignable to cis-β isomer. The ratio between cis-β and symmetric
isomer is about 2:1 (Figure 2.21).
TiNN
PriO
O
OiPr
O
cis-β
TiN N
O O
OiPr
OiPr
trans
TiNN
PriO
O
O
OiPr
cis-α
or
2 : 1
OH
N N
HO
N
OH
N
HO
Figure 2.21 Possible equilibrium in the solution of complex 8.
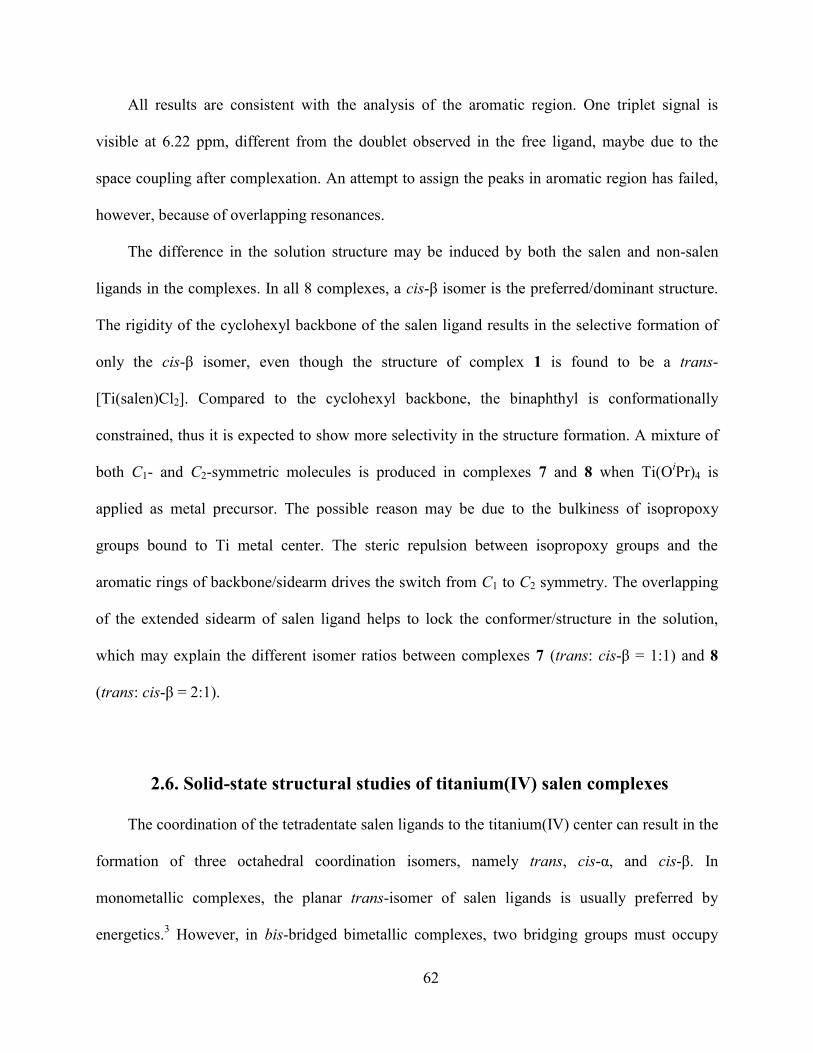
62
All results are consistent with the analysis of the aromatic region. One triplet signal is
visible at 6.22 ppm, different from the doublet observed in the free ligand, maybe due to the
space coupling after complexation. An attempt to assign the peaks in aromatic region has failed,
however, because of overlapping resonances.
The difference in the solution structure may be induced by both the salen and non-salen
ligands in the complexes. In all 8 complexes, a cis-β isomer is the preferred/dominant structure.
The rigidity of the cyclohexyl backbone of the salen ligand results in the selective formation of
only the cis-β isomer, even though the structure of complex 1 is found to be a trans-
[Ti(salen)Cl2]. Compared to the cyclohexyl backbone, the binaphthyl is conformationally
constrained, thus it is expected to show more selectivity in the structure formation. A mixture of
both C1- and C2-symmetric molecules is produced in complexes 7 and 8 when Ti(OiPr)4 is
applied as metal precursor. The possible reason may be due to the bulkiness of isopropoxy
groups bound to Ti metal center. The steric repulsion between isopropoxy groups and the
aromatic rings of backbone/sidearm drives the switch from C1 to C2 symmetry. The overlapping
of the extended sidearm of salen ligand helps to lock the conformer/structure in the solution,
which may explain the different isomer ratios between complexes 7 (trans: cis-β = 1:1) and 8
(trans: cis-β = 2:1).
2.6. Solid-state structural studies of titanium(IV) salen complexes
The coordination of the tetradentate salen ligands to the titanium(IV) center can result in the
formation of three octahedral coordination isomers, namely trans, cis-α, and cis-β. In
monometallic complexes, the planar trans-isomer of salen ligands is usually preferred by
energetics.3 However, in bis-bridged bimetallic complexes, two bridging groups must occupy

63
positions cis to each other, which results in a cis-α or cis-β configuration. The two cis-isomers
contain a chiral Ti metal center, which can result in two diaseteroisomers (Δ and Λ) for each
isomer.5,12,14
The cis-β isomer is the most preferentially formed in all cases examined so far.1,2,4,5
For bimetallic complexes bearing two identical cis-β salen ligands, there are four possible
diastereomeric coordination isomers,15
which are depicted in Figure 2.22.
M
O O
N O
O
N
M
N
O
O
N
M
N O
O O
O
N
M
O
N
O
N
M
O O
N O
O
N
M
O
N
N
O
M
N O
O O
O
N
M
N
O
N
O
syn-ΔΔ syn-ΛΛ
anti-ΛΛanti-ΔΔ
Figure 2.22 Four possible stereoisomers of a (μ-O)2-[M(salen)]2.
salen ligand adopts a cis-β configuration.
2.6.1 Mono oxo bridged structure of complex 1
Dark orange-red crystals of complex 1 Ti(IV)-S1 suitable for X-ray diffraction studies is
grown under N2 by the heating-cooling method in CH2Cl2. The crystal structure for the single
molecule is shown in Figure 2.23 and the selected bond distances and angles are summerized in
Table 2.14.

64
Figure 2.23Structure of complex 1: top, thermal ellipsoid plot (50% probability, H omitted
for clarity); bottom, space filling model.

65
The coordination environment around each titanium metal is a distorted octahedron. The
titanium center is lying in the plane of the N2O2 core of the salen ligand with shorter Ti-O bond
and longer Ti-N bond. The Cl ligand is trans to the bridged oxygen atom, indicating that the
trans isomer is selectively obtained, which is consistent with the NMR analysis in solution. It is
generally prosposed that in octahedral monometallosalen complexes, the planar, trans
configuration is preferred in the view of energy.3
The axial Cl-Ti bond is not quite orthogonal to the TiN2O2 plane and slightly bent toward
the imine nitrogen. Each salen ligand adopts a (R,R) configuration and P conformer. The
aromatic sidearm is canted above and below the TiN2O2 plane and the torsion angles between
phenanthryl sidearms are 22.3˚ and 24.5˚, respectively. The Ti-μ-O-Ti bond is bent (156.4˚) with
similar Ti-O lengths (1.82 and 1.80 Å). Attractive π-π stacking between phenanthryl planes of
two ligands is observed with carbon to centroid distance of 3.6 Å, which is within the expected
range of 3.4-3.6 Å.13,14,15
The metrical parameters for the two Ti(salen)Cl moieties are
comparable.
Table 2.14 Selected bond distance (Å) and angles (˚) for complex 1.
Ti1-O12_1 1.848(2) Ti2-O12_3 1.898(2)
Ti1-O12_2 1.885(2) Ti2-O12_4 1.870(2)
Ti1-N25_1 2.128(2) Ti2-N25_3 2.129(2)
Ti1-N25_2 2.124(2) Ti2-N25_4 2.133(2)
Ti1-Cl1 2.4173(9) Ti2-Cl1 2.4401(9)
Ti1-O1 1.823(2) Ti2-O1 1.797(2)
Cl1-Ti1-O1 172.44(7) Cl1-Ti2-O1 174.74(7)
Ti1-O1-Ti2 156.4(1)
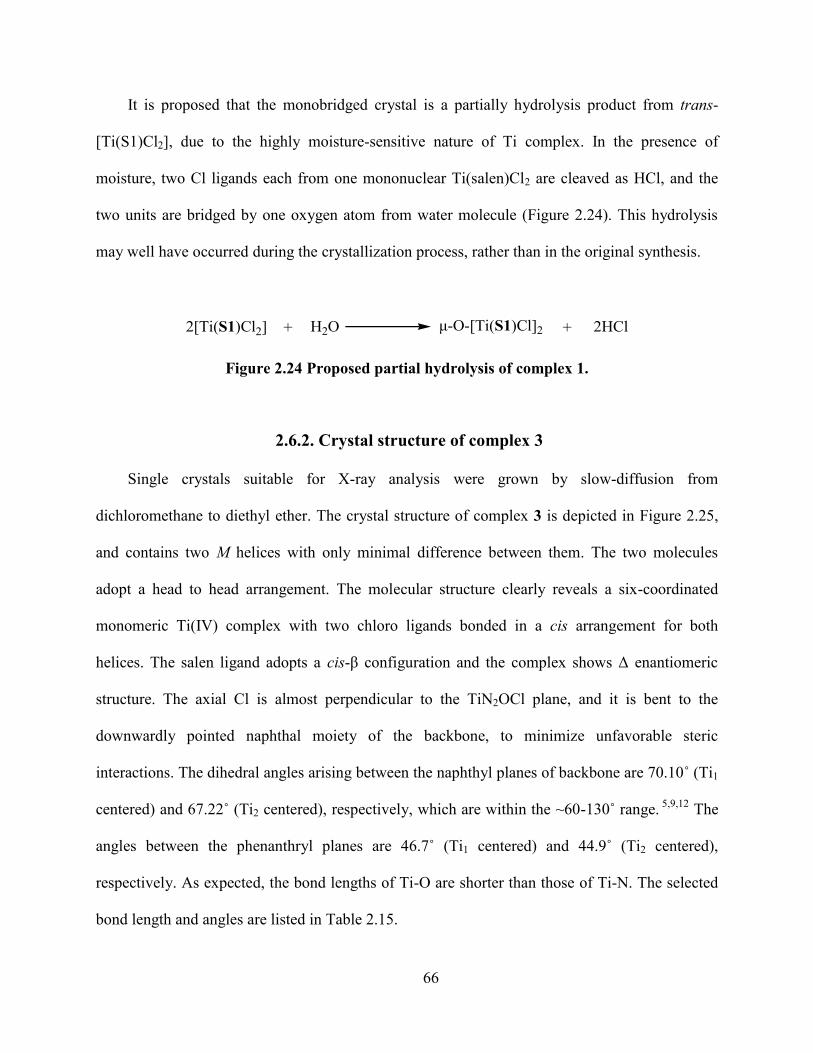
66
It is proposed that the monobridged crystal is a partially hydrolysis product from trans-
[Ti(S1)Cl2], due to the highly moisture-sensitive nature of Ti complex. In the presence of
moisture, two Cl ligands each from one mononuclear Ti(salen)Cl2 are cleaved as HCl, and the
two units are bridged by one oxygen atom from water molecule (Figure 2.24). This hydrolysis
may well have occurred during the crystallization process, rather than in the original synthesis.
2[Ti(S1)Cl2] H2O 2HClμ-O-[Ti(S1)Cl]2+ +
Figure 2.24 Proposed partial hydrolysis of complex 1.
2.6.2. Crystal structure of complex 3
Single crystals suitable for X-ray analysis were grown by slow-diffusion from
dichloromethane to diethyl ether. The crystal structure of complex 3 is depicted in Figure 2.25,
and contains two M helices with only minimal difference between them. The two molecules
adopt a head to head arrangement. The molecular structure clearly reveals a six-coordinated
monomeric Ti(IV) complex with two chloro ligands bonded in a cis arrangement for both
helices. The salen ligand adopts a cis-β configuration and the complex shows Δ enantiomeric
structure. The axial Cl is almost perpendicular to the TiN2OCl plane, and it is bent to the
downwardly pointed naphthal moiety of the backbone, to minimize unfavorable steric
interactions. The dihedral angles arising between the naphthyl planes of backbone are 70.10˚ (Ti1
centered) and 67.22˚ (Ti2 centered), respectively, which are within the ~60-130˚ range. 5,9,12
The
angles between the phenanthryl planes are 46.7˚ (Ti1 centered) and 44.9˚ (Ti2 centered),
respectively. As expected, the bond lengths of Ti-O are shorter than those of Ti-N. The selected
bond length and angles are listed in Table 2.15.

67
Figure 2.25 Structure of complex 3: top, thermal ellipsoid plot (50% probability, H omitted
for clarity); bottom, space filling model. (both molecules: M).

68
Table 2.15 selected bond length (Å) and bond angles (˚) for complex 3.
Molecule 1 Molecule 2
Ti1-Cl1 2.285(2) Ti2-Cl3 2.299(2)
Ti1-Cl2 2.304(3) Ti2-Cl4 2.300(3)
Ti1-N25_1 2.173(6) Ti2-N25_3 2.209(6)
Ti1-N25_2 2.175(7) Ti2-N25_4 2.160(6)
Ti1-O12_1 1.864(5) Ti2-O12_3 1.835(5)
Ti1-O12_2 1.868(5) Ti2-O12_4 1.832(5)
Cl1-Ti1-Cl2 90.81(9) Cl3-Ti2-Cl4 89.71(9)
Cl1-Ti1-O12_2 87.6(6) Cl3-Ti2-O12_4 89.1(2)
Cl2-Ti1-O12_2 171.0(2) Cl4-Ti2-O12_4 171.7(2)
O12_1-Ti1-O12_2 96.30(2) O12_3-Ti2-O12_4 95.1(2)
N25_1-Ti1-N25_2 81.2(2) N25_3-Ti2-N25_4 79.8(2)
2.6.3. Crystal structure of complex 6
Figure 2.26 shows the crystal structure of Ti-salen complex 6. The selected structure data
are summarized in Table 2.16. The maroon needle-shaped crystals are obtained from
hexane/CH2Cl2 by slow diffusion. The dinuclear structure shows two Ti(salen) units bridged by
two oxo groups. Both Ti(salen) moieties have the Δ–configuration at the central Ti ion, and
possess the (R,R)-configuration in the backbone. Each titanium center exhibits a distorted
octahedral geometry with two oxo bridges cis to each other. The two salen ligands show a syn
arrangement to each other. Each salen ligand adopts cis-β configuration. Exclusively M helical
conformer is observed in the solid state, and the terminal aryl rings in benz[a]anthryl sidearms
are overlapped as expected. The overall configuration is syn-Δ-(R,R)- Δ-(R, R).

69
Figure 2.26 Structure of complex 6: top, thermal ellipsoid plot (50% probability, H omitted
for clarity); bottom, space filling model.

70
The Ti2O2 core is near square, and four Ti-Obridge bonds have different lengths (1.82-1.97
Å). Moreover, the bridged Ti-O bonds are longer than the salen Ti-O bonds. The Ti-O bond
lengths are shorter than the Ti-N ones as expected. There is evidence of π-π stacking between
benz[a]anthryl from the two salen ligands. The carbon-centroid distance (3.6 Å) lies on the
border of the favored 3.4-3.6 Å range. The metric parameters of two Ti(salen) moieties are
comparable.
Table 2.16 Selected bond lengths (Å) and bond angles (˚) for complex 6.
Ti1-O1 1.829(7) Ti2-O1 1.866(7)
Ti1-O2 1.867(9) Ti2-O2 1.838(8)
Ti1-O12_1 1.905(9) Ti2-O12_3 1.963(9)
Ti1-O12_2 1.965(9) Ti2-O12_4 1.851(9)
Ti1-N29_1 2.234(9) Ti2-N29_3 2.139(9)
Ti1-N29_2 2.130(9) Ti2-N29_4 2.25(1)
O1-Ti1-O2 82.8(3) O1-Ti2-O2 82.6(3)
O12_1-Ti1-O2 103.1(4) O12_3-Ti2-O2 90.6(4)
O12_1-Ti1-O1 110.5(4) O12_3-Ti2-O1 166.7(3)
N29_1-Ti1-O2 86.8(3) N29_3-Ti2-O2 100.7(4)
N29_1-Ti1-O1 165.8(3) N29_3-Ti2-O1 90.4(3)
This dimeric structure may be generated by hydrolysis of a Ti(salen)(OiPr)2 (Figure 2.27).
The oxo bridges are formed after two (OiPr) groups from each monomer have been left as HO
iPr
in the presence of water.
O
O
Ti(S2)(S2)Ti2Ti(S2)(OiPr)2 2H2O 4HOiPr+ +
Figure 2.27 Possible hydrolysis reaction of complex 6.

71
2.6.4. Ti-dimer with di-oxo-bridges of complex 7
In order to gain further structural information of salen-Ti(OiPr)2, numerous attempts have
been made to obtain a crystal suitable for X-ray single crystal diffraction. Unfortunately, a partial
hydrolysis product has been isolated.
The crystal structure of complex 7 (Figure 2.28) is characterized as a dimer containing a
central four-membered Ti2O2 ring, which is structurally similar to complex 6. The Ti2O2 core is a
nearly planar, distorted square. The four Ti-O bonds within the ring are not of equal lengths,
instead there are two equally short Ti-O (1.837 Å, trans to a N atom of salen ligand) and the
other two equally long Ti-O bonds (1.868 Å, trans to an O atom of salen ligand).
The Ti(S3)-μ-O moieties are identical to each other. The titanium center is octahedrally
coordinated, and the salen ligand adopts a cis-β configuration. Generally, in a bis-bridged
dimeric complex as occurred in complex 7, two bridging oxo groups have to occupy the
positions cis to each other, which makes the planar, trans structure impossible. Each Ti(salen)
unit exhibits M-helicity. The dihedral angles between the naphthyl units in the backbone
decrease upon metallation, to 69.2˚ for the complex from 103.1˚ for the free ligand. Significant
π-π stacking is observed between phenylthryl planes from two ligands. The C-centroid distance
is approximate in 3.4 Å.
The crystallographic analysis shows that the two Ti(salen) units are homochiral, with both
having an R-stereocenter and Δ–configuration. The two salen ligands are oriented syn to each
other, giving selectively the syn-Δ-(R)-Δ-(R) stereoisomer. The Δ-configuration is derived from
the presence of (R)-binaphthyl backbone within the salen ligand. The formation of the syn-
conformation is the result of the different Ti-Ooxo bond lengths in the central ring (1.837 and
1.868 Å). Each Ti-O-Ti bridge must contain one long and one short Ti-O bonds to form a least
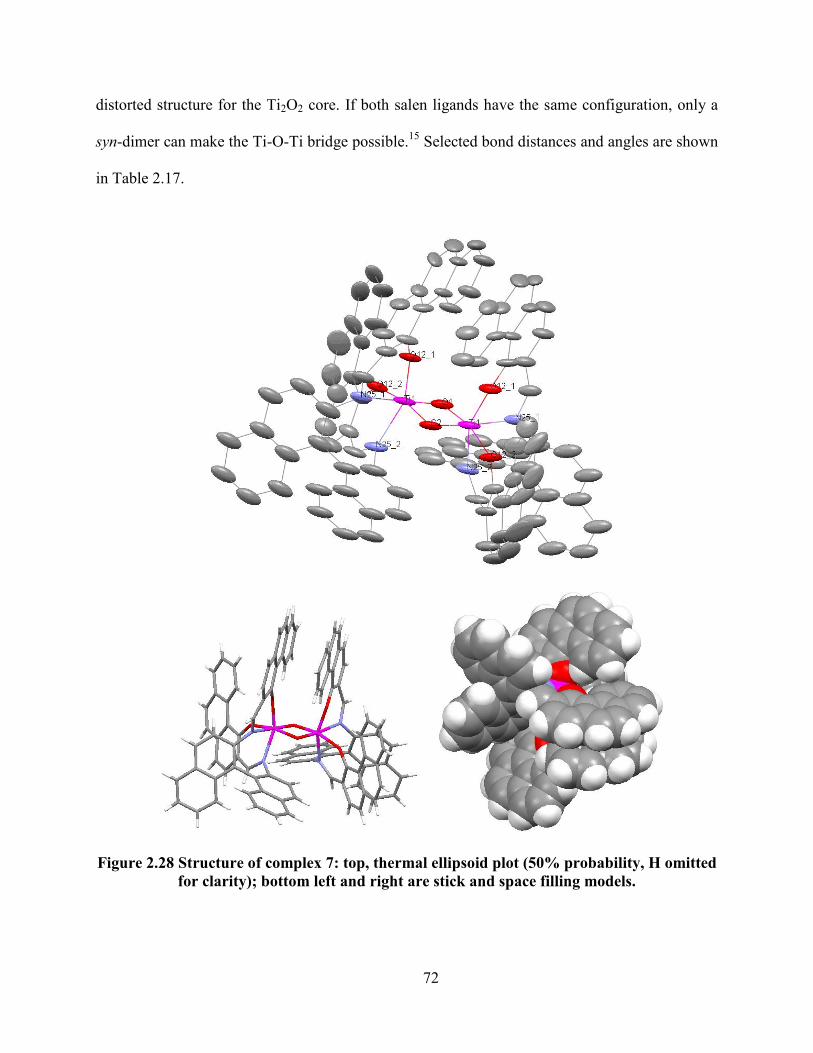
72
distorted structure for the Ti2O2 core. If both salen ligands have the same configuration, only a
syn-dimer can make the Ti-O-Ti bridge possible.15
Selected bond distances and angles are shown
in Table 2.17.
Figure 2.28 Structure of complex 7: top, thermal ellipsoid plot (50% probability, H omitted
for clarity); bottom left and right are stick and space filling models.

73
Table 2.17 Selected bond lengths (Å) and bond angles (˚) of complex 7.
Ti1-O1 1.837(5) Ti1-O2 1.868(3)
Ti1-O12_1 1.897(3) Ti1-O12_2 1.957(3)
Ti1-N25_1 2.299(7) Ti1-N25_2 2.209(4)
O1-Ti1-O2 82.0(2) O12_1-Ti1-O2 102.3(2)
O12_1-Ti1-O1 99.0(2) O12_2-Ti1-O2 164.9(2)
O12_2-Ti1-O1 93.4(2) N25_1-Ti1-O2 93.1(2)
N25_1-Ti1-O1 174.2(2) N25_2-Ti1-O2 87.5(2)
N25_2-Ti1-O1 106.0(2)
The dimeric structures may be generated by hydrolytic cleavage of the (OiPr) groups of the
Ti(salen) (OiPr)2. It is proposed by Belokon
15,16 that a bimetallic Ti complex bearing two
identical chiral salens selectively give syn-Δ stereoisomer, if the backbone of chiral salen has an
absolute R configuration. The stereochemistry of complexes 6 and 7 is as expected on the basis
of the proposal.
2.7. Asymmetric epoxidation
No epoxides have been detected by 1H NMR in the products of asymmetric epoxidation of
olefins when complexes 1-8 have been used as catalysts (Figure 2.29).
R1 R3
R2 R4
R1 R3
R2 R4
O[O]
1-8
**×
Figure 2.29 Unseccessful asymmetric epoxidation catalyzed by complexes 1-8.

74
Trans-β-methyl styrene, styrene and indene are used as substrates. Though different
reaction conditions have been applied, such as reaction solvents (CH2Cl2 and CH3CN), buffer
solutions (pH 7.4 and 8.3), heating, complex loading (0.2 and 0.5 %mol) and oxidants
(iodosylbenzene and aqueous H2O2), no epoxide is produced. It was found by Katsuki10,17
that
Ti(salen) complexes can not catalyze olefin epoxidation, while Ti(salan)/Ti(salalen) (salan and
salalen are fully and half reduced salen analogous) can serve as an efficient catalyst in
asymmetric epoxidation of unfunctionalized olefin. In addition, a μ-oxo-μ-η2:η
2-peroxo bis-
Ti(salan) complex (Figure 2.30, left)17
is formed when treated with H2O2 in the absence of olefin,
which is believed as a reservoir of active species in AE.
Figure 2.30 Putative explanation of unsuccessful AE catalyzed by complexes 1-8.18
They propose that during oxidation, the peroxotitanium species activated is by
intramolecular hydrogen bonding with the amino proton, which is proposed to be the active
species (Figure 2.30, top right). In the case of salen that contains two imine groups, no hydrogen
TiN N
O O
O
Operoxo-inactive with Ti(salen)
TiHN N
O O
O
O
H
hydrogen-bonded peroxo-active with Ti(salalen) or Ti(salan)

75
can be provided to form such bonding, which may be the main reason for the inert catalytic
ability in AE (figure 2.30, bottom right).
2.3 Conclusion and future work
A series of helical Ti(IV)-salen complexes with chiral salen ligands have been synthesized
and characterized. ESI-MS reveals that both mononuclear and dinuclear species are present,
depending on the ionization methods. 1H NMR studies show that in most cases (complexes 1-6),
one major species exists in the solution with cis-β octahedral geometry except complex 1. While
two species found in the solution of complexes 7 and 8, indicating both the salen and non-salen
lingands chelating to the Ti center would affect the solution behavior. And some crystallographic
analyses further confirm some of the NMR results. Some dimeric structures (complex 3 with
mono μ–oxo bridge, and complexes 6 and 7 with di-μ-oxo bridges) are consistent with previous
studies. All the titanium(salen) complexes 1-8 failed in the dimerization and show no catalytic
ability in the AE of olefin, and the absence of hydrogen bond in the peroxo species is proposed
as the reason.
New reactions will be tried using complexes 1-8 as catalysts, such as sulfoxidation, and
aldehyde addition. Meanwhile, titanium(salan) and titanium(salalen) complexes will be
synthesized based on the current salens, and will be applied in catalytic AE and other reactions
as well.
2.4 References
1. Zhou, Z., Li, Z., Wang, Q., Liu, B., Li, K., Zhao, G., Zhou, Q., Tang, C. (salen)Ti(IV)

76
complex catalyzed asymmetric ring-opening of epoxides using dithiophosphorus acid as the
nucleophile. J. Organometa. Chem. 2006, 691, 5790-5797.
2. Belokon, Y. N., Hunt, J., North, M. Asymmetric catalysis of carbon-carbon bond forming
reactions using amino acid-derived C1-symmetrical salen ligands. Tetrahedron: Asymm.
2008, 19, 2804-2815.
3. Matsumoto, K., Saito, B., Katsuki, T. Asymmetric catalysis of metal complexes with non-
planar ONNO ligands: salen, salalen and salan. Chem. Comm. 2007, 3619-3627.
4. Achard, T. R. J., Clutterbuck, L. A., North, M. Asymmetric catalysis of carbon-carbon bond-
forming reactions using metal(salen) complexes. Synlett. 2005, 12, 1828-1847.
5. Niemeyer, J., Cloppenburg, J., Frohlich, R., Kehr, G., Erker, G. Salen-ligands based on a
planar-chiral hydroxyferrocene moiety: synthesis, coordination chemistry and use in
asymmetric silylcyanation. J. Organometa. Chem. 2010, 695, 1801-1812.
6. Belokon, Y. N., Clegg, W., Harrington, R. W., North, M., Yong, C. In situ formation of
heterobimetallic salen complexes containing titanium and/or vanadium ions. Inorg. Chem.
2008, 47, 3801-3814.
7. Banerjee, P., Pandey, O. P., Sengupta, S. K. Microwave assisted synthesis, spectroscopic and
antibacterial studies of titanocene chelates of Schiff bases derived from 3-substituted-4-
amino-5-hydrazino-1,2,4-triazoles. Transition Meta. Chem. 2008, 33, 1047-1052.
8. Belokon, Y. N., Green, B., Ikonnikov, N., Larichev, V. S., Lokshin, B. V., Moscalenko, M.
A., North, M., Orizu, C., Peregudov, A. S., Timofeeva, G. I. Mechanistic investigation of the
asymmetric addition of trimethylsilyl cyanide to aldehydes catalyzed by dinuclear chiral
(salen)titanium complexes. Eur. J. Org. Chem., 2000, 2655-2661.
9. Belokon, Y. N., Chusov, D., Peregudov, A. S., Yashkina, L. V., Timofeeva, G. I., Maleev, V.
77
I., North, M., Kagan, H. B. Asymmetric meso-epoxide ring-opening with trimethylsilyl
cyanide promoted by chiral binuclear complexes of titanium. Dichotomy of C-C versus C-N
bond formation. Adv. Synth. Catal. 2009, 351, 3157-3167.
10. Saito, B., Katsuki, T. Mechanistic consideration of Ti(salen)-catalyzed asymmetric
sulfoxidation. Tetadedron Lett. 2001, 42, 8333-8336.
11. Belokon, Y. N., Blacker, A. J., Carta, P., Clutterbuck, L. A., North, M. Synthetic and
mechanistic studies on asymmetric cyanohydrin synthesis using a titanium(salen) bimetallic
catalyst. Tetrahedron 2004, 60, 10433-10447.
12. Soriente, A., De Rosa, M., Lamberti, M., Tedesco, C., Scettri, A., Pellecchia, C. Synthesis,
crystal structure and application in regio- and stereoselective epoxidation of allylic alcohols
of a titanium binapthyl-bridged Schiff base complex. J. Mol. Cata. A: Chem. 2005, 235, 253-
259.
13. Chen, H., White, P. S., Gagne, M. R. Synthesis and reactivity of titanium(IV)-salen
complexes containing oxygen and chloride ligands. Organometallics 1998, 17, 5358-5366.
14. Niemeyer, J., Kehr, G., Frohlich, R., Erker, G. Salen ligands revisited: synthesis and
application of a planar chiral “Ferro-salen” ligand. Eur. J. Inorg. Chem. 2010, 680-684.
15. Belokon, Y. N., Clegg, W., Harrington, R. W., Young, C., North, M. Aymmetric
cyanohydrin synthesis using heterobimetallic catalysts obtained from titanium and vanadium
complexes of chiral and achiral salen ligands. Tetrahedron 2007, 63, 5287-5299.
16. Belokon, Y. N., Caveda-Cepas, S., Green, B., Ikonnikov, N., Khrustalev, V. N., Larichev, V.
S., Moscalenko, M. A., North, M., Orizu, C., Tararov, V. I., Tasinazzo, M., Timofeeva, G. I.,
Yashkina, L. V. The asymmetric addition of trimethylsilyl cyanide to aldehydes catalyzed by
chiral (salen)titanium complexes. J. Am. Chem. Soc. 1999, 121, 3968-3973.

78
17. Kondo, S., Saruhashi, K., Seki, K., Matsubara, K., Miyaji, K., Kubo, T., Matsumoto, K.,
Katsuki, T. A –oxo--2:
2-peroxo titanium complex as a reservoir of active species in
asymmetric epoxidation using hydrogen peroxide. Angew. Chem. Int. Ed. 2008, 47, 10195-
10198.

79
Chapter 3 - Synthesis, characterization and study of
manganese(salen) complexes
3.1. Introduction
The chemistry of manganese in various oxidation states is currently attracting much
attention owing to its importance in many enzymatic systems such as superoxide dismutase,
catalase and photosystem II (PSII).1 The oxygen evolving complex (OEC) of PSII (Figure 3.1),
which is found in the thylakoid membrane of plants and algae, is critical to life, since almost all
dioxygen on earth is generated by OEC-catalyzed water oxidation reaction. The active site of
OEC is believed to be a cubane-like Mn3CaO4 cluster, coordinated with a fourth Mn ion by a
mono-μ-oxo bridge.1
Figure 3.1 Scheme of theOEC mechanism in photosystem II.1
Residues in D1, D2 and CP43 subunits are shown in yellow, orange and green, respectively. X1, X21 and X22 are
possible substrate water binding positions to Mn and Ca. Possible water is indicated as W. Possible hydrogen bonds
are shown as light-blue dotted lines.

80
The short Mn-Mn distance (2.7 Å, quite similar to manganese dimers with Mn2O2 cores)
and relatively high oxidation states during catalytic cycle lead to increasing interests in high-
valent oxo-bridged polynuclear manganese complexes, which can be regarded as the structural
model to mimic the OEC and as candidates for water oxidation catalysts.1
Epoxides are versatile building blocks in organic synthesis, since a wide range of regio- and
stereo-selective ring opening reactions are available to convert the epoxides to useful
intermediates. Asymmetric epoxidation is the most straightforward method to prepare chiral
epoxides. Since the discovery of Mn(salen) complexes as effective catalysts in epoxidation of
olefins by Kochi,2 a variety of chiral Mn(salen) complexes have been developed and
investigated.3,4,5
The best known Mn(salen) complex is the Jacobsen-Katsuki catalyst, which can
enantioselectively transform unfunctionalized olefins to chiral epoxides (Figure 3.2). The
selectivity is up to 98% ee for cis substrates. However, enantioselective epoxidation of trans
olefins is not satisfactory in the same system (25% ee for trans-β-methylstyrene).3, 4
N N
OO
tBu But
MntBuBut
HH
R2R1
O
R1 R2
HH
aq. NaOCl2-5 mol% catl.pyridine N-oxide
CH2Cl2
Figure 3.2 Jacobsen’s (S,S)-Mn(salen) catalyst in asymmetric epoxidation of cis-olefins.
It is generally assumed that the enatioselectivity is dominated by the steric interaction
between the chial O=Mn(salen) and the olefin. When the olefin substrate is approaching the
Mn=O bond at 90˚ to allow favorable orbital overlap, however one substituent (R1) from the
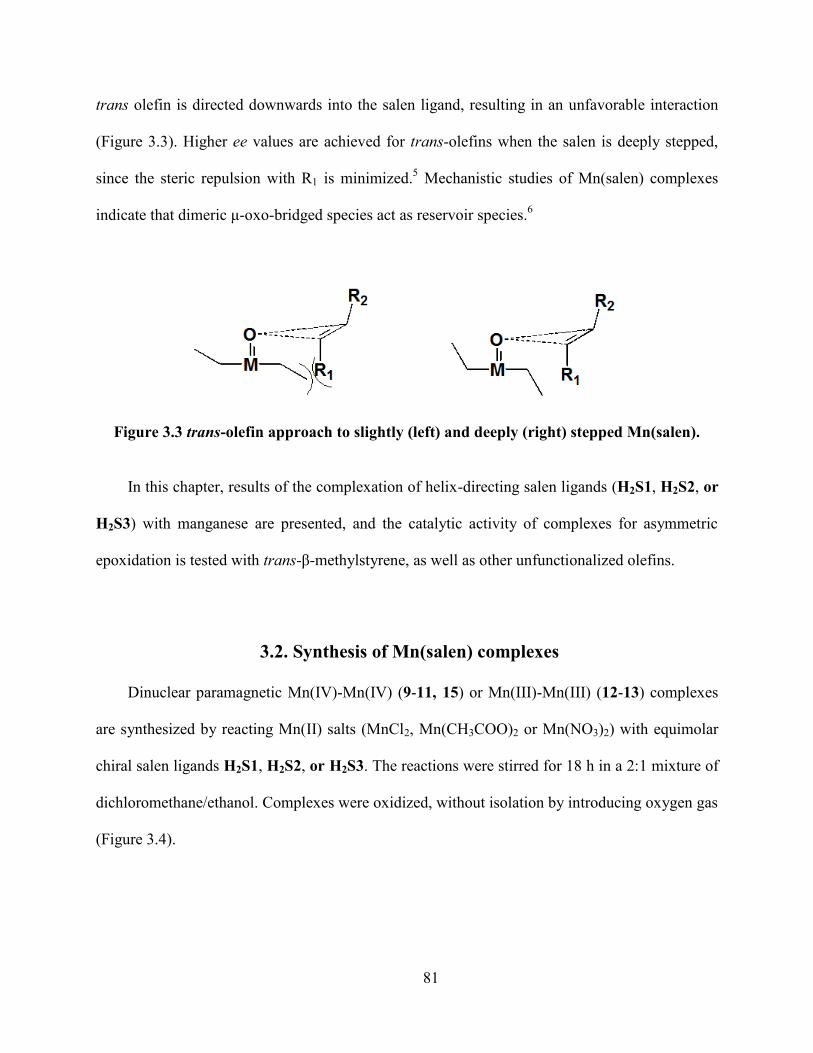
81
trans olefin is directed downwards into the salen ligand, resulting in an unfavorable interaction
(Figure 3.3). Higher ee values are achieved for trans-olefins when the salen is deeply stepped,
since the steric repulsion with R1 is minimized.5 Mechanistic studies of Mn(salen) complexes
indicate that dimeric μ-oxo-bridged species act as reservoir species.6
Figure 3.3 trans-olefin approach to slightly (left) and deeply (right) stepped Mn(salen).
In this chapter, results of the complexation of helix-directing salen ligands (H2S1, H2S2, or
H2S3) with manganese are presented, and the catalytic activity of complexes for asymmetric
epoxidation is tested with trans-β-methylstyrene, as well as other unfunctionalized olefins.
3.2. Synthesis of Mn(salen) complexes
Dinuclear paramagnetic Mn(IV)-Mn(IV) (9-11, 15) or Mn(III)-Mn(III) (12-13) complexes
are synthesized by reacting Mn(II) salts (MnCl2, Mn(CH3COO)2 or Mn(NO3)2) with equimolar
chiral salen ligands H2S1, H2S2, or H2S3. The reactions were stirred for 18 h in a 2:1 mixture of
dichloromethane/ethanol. Complexes were oxidized, without isolation by introducing oxygen gas
(Figure 3.4).

82
Mn2+ salt + salen ligand (H2S)1. NaOMe
CH2Cl2/EtOH (2:1)
18 h
2. O2 gasMn(salen) complex
2 h
N
OH
N
HO
N
OH
N
HO
H2S1 H2S2
N
OH
N
HO
H2S3
Figure 3.4 Synthesis scheme of Mn(salen) complexes 9-15.
Four equivalents sodium methoxide were added into the reaction mixture. The role of
NaOMe is to deprotonate the two phenolic oxygens from the salen ligand to facilitate the
metallation. The by-product, methanol, can be easily removed by vacuum drying. The dioxygen
gas was bubbled through the pale brown suspension for 2 h to oxidize Mn(II) to higher oxidation
states. Blackish brown solids are obtained upon Soxhlet extraction in CH2Cl2 in moderate yields

83
(ca. 40%) with high purity. All complexes (9-15 in Table 3.1) are paramagnetic, characterized by
broad 1H NMR spectra (Figure 3.5).
Table 3.1 Synthetic compositions of Mn(salen) complexes 9-15.
Complex Mn2+
salt Salen ligand
9 MnCl2 H2S1
10 Mn(OAc)2 H2S1
11 Mn(NO3)2 H2S1
12 MnCl2 H2S3
13 Mn(OAc)2 H2S3
14 Mn(NO3)2 H2S3
15 MnCl2 H2S2
11 10 9 8 7 6 5 4 3 2 1 0 -1 -2
Chemical Shift (ppm)
0.1
0.2
0.3
0.4
0.5
0.6
0.7
0.8
0.9
1.0
Norm
alized Inte
nsity
Figure 3.5 1H NMR spectrum of paramagnetic complex 12 in CDCl3.
All complexes are very soluble in CH2Cl2 and dichloroethane, moderately soluble in
toluene, THF, ethanol and acetonitrile, but only sparingly soluble in hexane and water. The
complexes are also air and moisture-stable.

84
3.3. Infrared spectra
For dinuclear complexes with the Mn2O2 core, characteristic υ(Mn-Ooxo) absorption bands
are observed in the region 630-650 cm-1
.7 This IR band is sensitive to the symmetry around
central Mn ions and can be used to distinguish between bridging and chelating Schiff base
ligands.8,9
A sharp unsplit Mn-Ooxo absorption band indicates the bridging Schiff base ligands.
Such complexes have higher symmetry than the chelating dimer type (Figure 3.6), which have a
split Mn-O band.9
Figure 3.6 IR absorption band for Mn2O2 core.9 (a) sharp unsplit Mn-Ooxo band
corresponding to bridging ligand; (b) split Mn-Ooxo band for chelating Schiff base lignd.
The lignad band is marked with an asterisk.
In the IR spectra of complexes 9-11 (Figure 3.7) the υ(C-Ophenolate) and υ(C=Nimine) bands
shift to lower frequency, 28-30 cm-1
and 11-14 cm-1
, respectively, compared to the free ligand
H2S1.

85
Figure 3.7 IR spectra of free ligand H2S1 and complexes 9, 10 and 11.
Table 3.2 Characteristic IR absorption bands for free ligand and complexes 9-11.
Compound υ(C=N)/cm-1
υ(C-Ophenolate)/cm-1
υ(Mn-Ooxo)/cm-1
H2S1 1631 1265 ---
9 1620 1237 652, 642
10 1617 1235 652, 641
11 1618 1235 653, 640
These shifts suggest the coordination of the salen ligand in its dianionic form to the metal
through the phenol oxygen and the imine N atoms. In addition, the IR spectra exhibit sharp
absorption bands with splitting pattern in the region 640-660 cm-1
, which can be assigned to
υ(Mn-Ooxo). 7,8,9
All these information indicates the possible existence of dimeric chelating Mn
salen complex in the solution, which is in agreement with the solid study in Section 3.6.1.

86
As compared to 9-11, the IR spectra of 12-14 (Figure 3.8) display no absorption bands
characteristic for a Mn2O2 core in the region 600-700 cm-1
. The small shifts are observed both in
the absorption of C=N and C-O bonds compared to free ligand, indicating the chelation of Mn to
the ONNO unit. Furthermore, the spectra exhibit more than one set of bands for the stretches of
C=N and C-O bonds (Table 3.3). It is indicated that phenolate oxygen atoms as well as imine
nitrogen atoms are located in delicately different chemical environment. The result is consistent
with the crystal structural analysis in section 3.6.2, which shows one set of ONNO unit
coordinates to Mn(IV) center, one set of ONNO unit to Mn(III)center, and the third set of ONNO
unit bridges between Mn(IV) and Mn(III).
Figure 3.8 IR spectra of free ligand H2S3 and complexes 12, 13 and 14.

87
Table 3.3 Characteristic IR absorption bands for complexes 12-14.
Compound υ(C=N)/cm-1
υ(C-Ophenolate)/cm-1
H2S3 1576 1259
12 1605, 1573 1258, 1236
13 1605, 1572 1258, 1237
14 1597, 1576 1258
3.4 Electronic spectra
UV-Vis and circular dichroism (CD) spectra of complexes 9-14 are measured in
acetonitrile. For complex 9, the absorption bands at 440 nm with moderate intensity can be
tentatively assigned to the ligand-to-metal charge-transfer transitions from the bridges to the Mn
center.8 The bands at 260 and 330 nm mainly arise from π-π* transitions in the ligand. By
comparison the free ligand H2S1 shows corresponding absorption at 250 and 280 nm (Figure 3.9,
left).
Figure 3.9 UV-vis spectra of complexes and corresponding ligands in acetonitrile. Left, 9
and H2S1; right, 12 and H2S3.
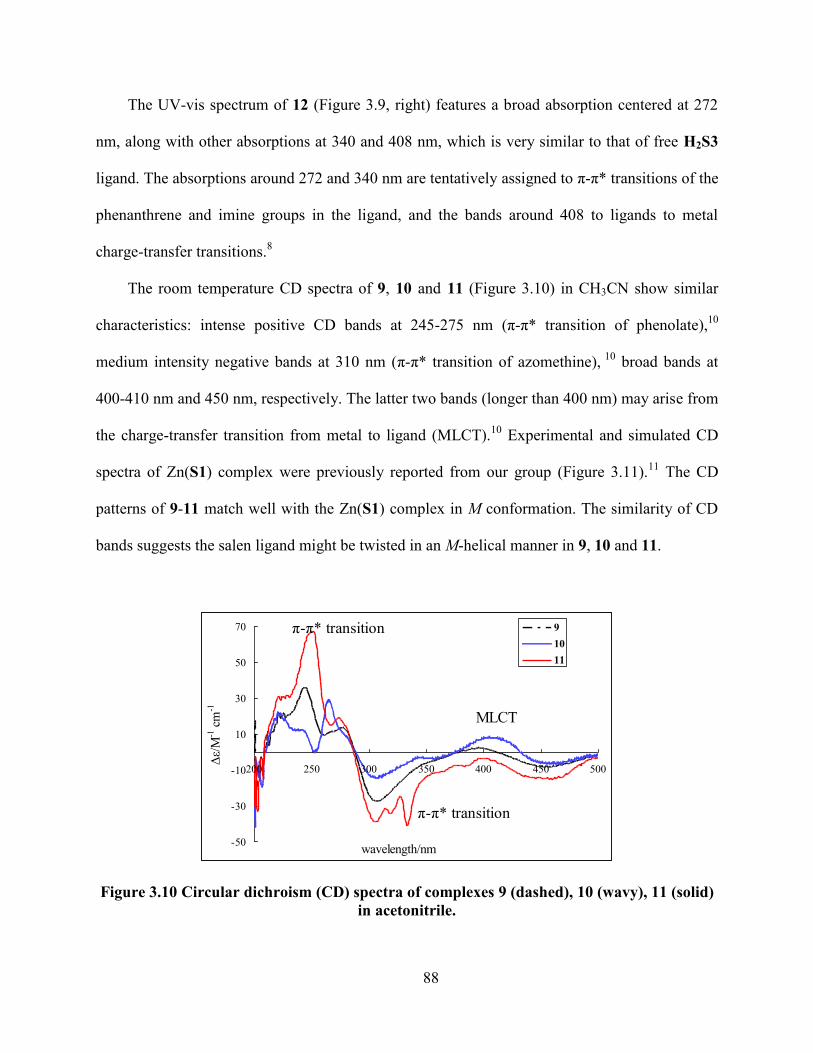
88
The UV-vis spectrum of 12 (Figure 3.9, right) features a broad absorption centered at 272
nm, along with other absorptions at 340 and 408 nm, which is very similar to that of free H2S3
ligand. The absorptions around 272 and 340 nm are tentatively assigned to π-π* transitions of the
phenanthrene and imine groups in the ligand, and the bands around 408 to ligands to metal
charge-transfer transitions.8
The room temperature CD spectra of 9, 10 and 11 (Figure 3.10) in CH3CN show similar
characteristics: intense positive CD bands at 245-275 nm (π-π* transition of phenolate),10
medium intensity negative bands at 310 nm (π-π* transition of azomethine), 10
broad bands at
400-410 nm and 450 nm, respectively. The latter two bands (longer than 400 nm) may arise from
the charge-transfer transition from metal to ligand (MLCT).10
Experimental and simulated CD
spectra of Zn(S1) complex were previously reported from our group (Figure 3.11).11
The CD
patterns of 9-11 match well with the Zn(S1) complex in M conformation. The similarity of CD
bands suggests the salen ligand might be twisted in an M-helical manner in 9, 10 and 11.
-50
-30
-10
10
30
50
70
200 250 300 350 400 450 500
wavelength/nm
Δε/
M-1
cm
-1
9
10
11
π-π* transition
π-π* transition
MLCT
Figure 3.10 Circular dichroism (CD) spectra of complexes 9 (dashed), 10 (wavy), 11 (solid)
in acetonitrile.

89
Figure 3.11 Experimental and simulated CD spectra of Zn(S1) complex.11
Complexes 12, 13 and 14 show similar CD spectra (Figure 3.12). According to the previous
study of CD of chiral salen complexes,12
the bands below 300 nm (210, 230, 255 nm) may be
assigned to π-π* transition of the phenolate, while the bands around 300-380 nm are due to π-π*
transiton of the azomethine group. The bands longer than 400 nm can be assigned to the metal-
to-ligand charge-transfer transition (MLCT). Their CD patterns show some similarity to zinc
complex with same binaphthayl salen ligand, which has dominant M conformer in solution
(Figure 3.13).13
In the solid state study, 12 exit in the M helical conformation (section 3.6.2.).
DFT simulation of CD spectra needs to be carried out to better understand the helical
conformations of the information for manganese salen complexes in solution.
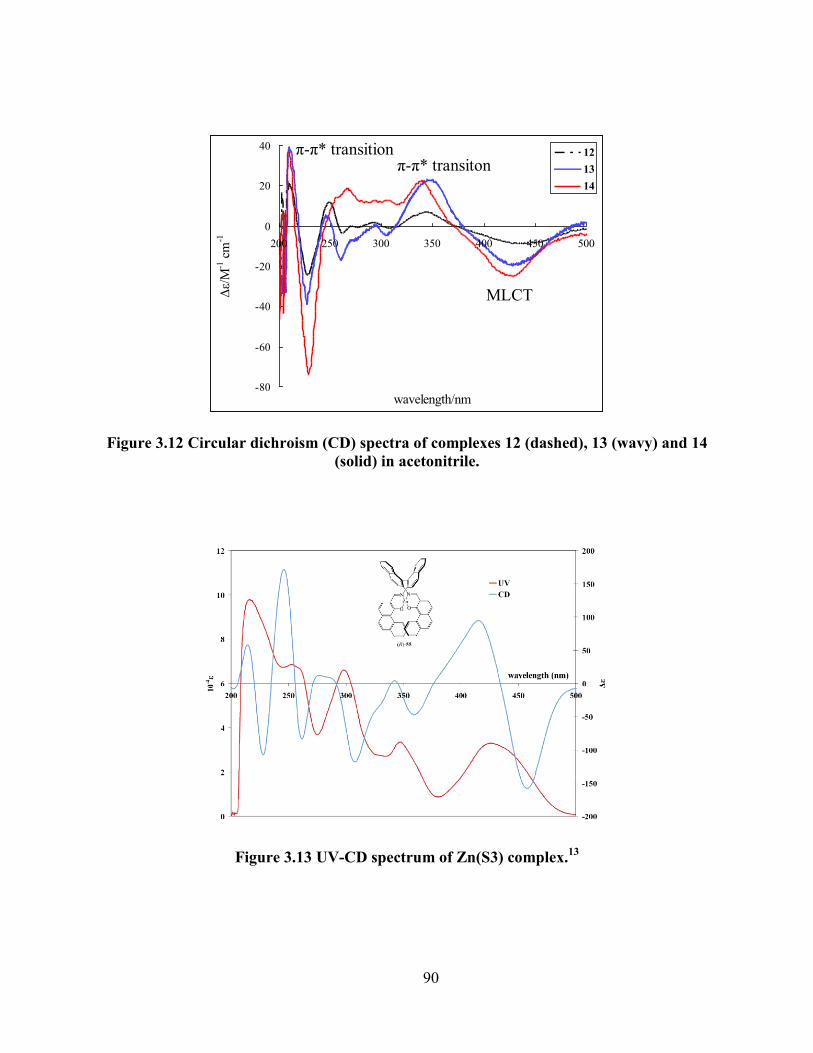
90
-80
-60
-40
-20
0
20
40
200 250 300 350 400 450 500
wavelength/nm
Δε/
M-1
cm
-1
12
13
14
π-π* transitionπ-π* transiton
MLCT
Figure 3.12 Circular dichroism (CD) spectra of complexes 12 (dashed), 13 (wavy) and 14
(solid) in acetonitrile.
Figure 3.13 UV-CD spectrum of Zn(S3) complex.13
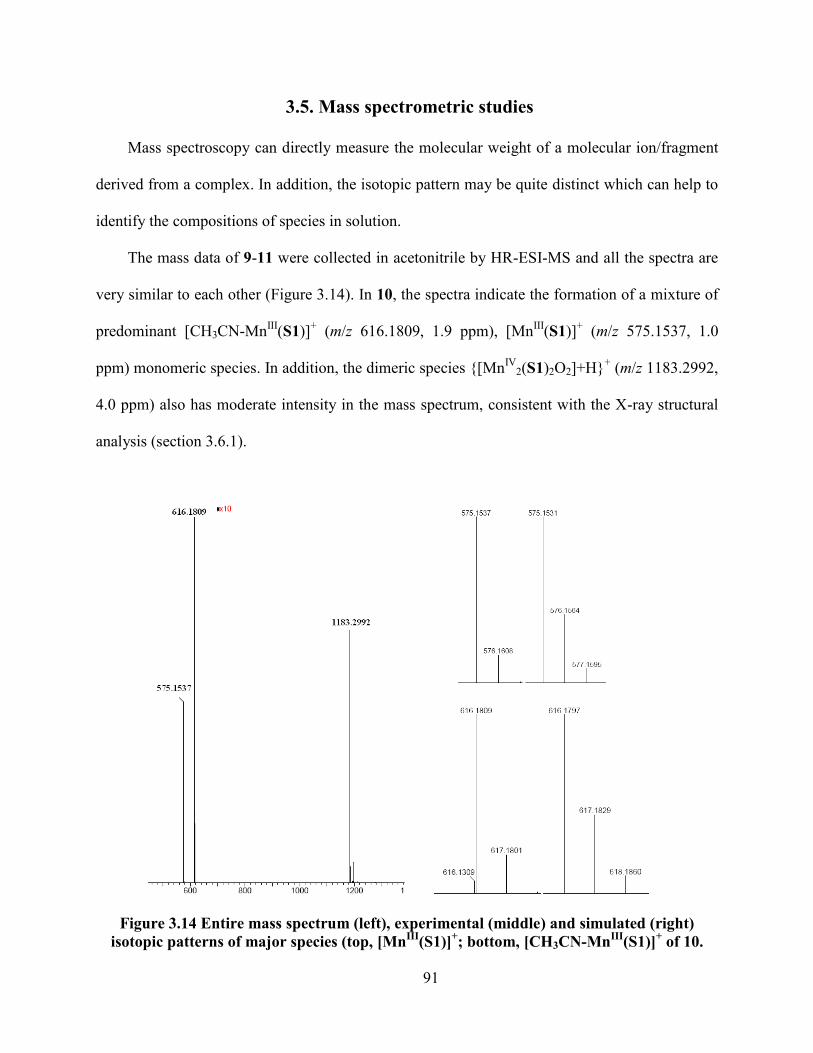
91
3.5. Mass spectrometric studies
Mass spectroscopy can directly measure the molecular weight of a molecular ion/fragment
derived from a complex. In addition, the isotopic pattern may be quite distinct which can help to
identify the compositions of species in solution.
The mass data of 9-11 were collected in acetonitrile by HR-ESI-MS and all the spectra are
very similar to each other (Figure 3.14). In 10, the spectra indicate the formation of a mixture of
predominant [CH3CN-MnIII
(S1)]+ (m/z 616.1809, 1.9 ppm), [Mn
III(S1)]
+ (m/z 575.1537, 1.0
ppm) monomeric species. In addition, the dimeric species {[MnIV
2(S1)2O2]+H}+ (m/z 1183.2992,
4.0 ppm) also has moderate intensity in the mass spectrum, consistent with the X-ray structural
analysis (section 3.6.1).
Figure 3.14 Entire mass spectrum (left), experimental (middle) and simulated (right)
isotopic patterns of major species (top, [MnIII
(S1)]+; bottom, [CH3CN-Mn
III(S1)]
+ of 10.

92
This observation suggests that the mononuclear Mn(III) complex ions are the major species
in solution, and the formation of dinuclear Mn(IV) species is less favored in solution. It is
reported that the Mn(IV) derivative is not stable and decomposes to the corresponding Mn(III)
complex.14
In addition, pairs of Mn ions can facilitate the formation and dissociation of O-O
bonds, which will leads to dimerization.14
A proposed equilibrium process is shown in Figure
3.15. It can be concluded that in the presence of H2S1 ligand, both Mn(III) and Mn(IV) complex
ions form and the cationic species with similar characteristic are observed no matter what kind of
metal salts are used in the synthesis.
O
(nelas)MnIV
O
MnIV(salen) MnIII(salen) + MnV(salen)(O)2
Figure 3.15 Proposed equilibrium between Mn(III) and Mn(IV) species.
The ESI-MS spectra of 12-14 in CH3CN solution show both salen and half-salen
coordinated Mn(III) cations (Figure 3.16). In 13, [MnIII
(S3)]+ (m/z 745.1660, 3.8 ppm) monomer
is the predominant species, and the solvated monomer [CH3CN-MnIII
(S3)]+ (m/z 786.1938, 1.9
ppm) is also present with medium intensity. In addition, the complex ion {[MnIII
(S3)(HS3)]-H}+
(m/z 1437.4133, 1.3 ppm) is also observed. The peak at m/z 1233.3553 (1.9 ppm) corresponds to
{[MnIII
(S3)(S3’)]-H}+, in which HS3’ indicates the 1:1 sidearm to backbone condensation
product. The peak for half-salen S3’ appears at m/z 489.1945 (4.5 ppm) with high intensity, and
the [H2S3-H]+ ion at m/z 693.2557 (2.2 ppm) is seen with low intensity. In 12 and 14, all these
species mentioned above are observed. The most obvious difference is the relative intensity of
these peaks (Table 3.4).

93
Figure 3.16 Entire mass spectrum (left), experimental (middle) and simulated (right)
isotopic patterns of major species (top, [MnIII
(S3)]+; bottom, {[Mn
III(S3)(HS3)]-H}
+) of 13.
Table 3.4 %Abundance of major species in complexes 12, 13 and 14.
Observed ions
m/z
% abundance
12 13 14
Half-salen S3’ 489.1862 32 33 32
Salen S3 693.2536 1 <1 36
[MnIII
(S3)]+ 745.1630 35 23 11
[CH3CN-MnIII
(S3)]+ 786.1929 17 7 <1
{[MnIII
(S3)(S3’)]-H}+ 1233.3507 8 22 <1
{[MnIII
(S3)(HS3)]-H}+ 1437.4106 6 15 20
In 13 and 14, the salen S3 and half-salen S3’ ions are the most dominant species,
respectively. Besides, one peak at m/z 285.1370 (2.2 mmu), which can be assigned to the
backbone fragment ion from the salen ligand, is present only in 13. It can be concluded that only
Mn(III) complexes form when chelated with the H2S3 ligand, and the metal sources seems to

94
influence the degree of ligand S3 degradation observed, which leads to the difference in the ion
distribution.
The HR-ESI-MS of 15 (Figure 3.17) shows the predominant ion peaks corresponding to
[MnIII
(S2)]+ species at m/z 716.2109 (0.1 ppm), and two additional peaks clearly indicate the
presence of an acetonitrile adduct CH3CN-[MnIII
(S2)]+ (m/z 675.1800, 6.5 ppm) and the dimeric
{[MnIV
2(S2)2O2]+H}+ (m/z 1383.3687, 1.6 ppm) cation with moderate intensity. No evidence for
doubly charged ions is found in the mass spectra. No ions derived from the ligand are observed.
Figure 3.17 Entire mass spectrum (left), experimental (middle) and similated (right) isotope
patterns of major species (top, CH3CN-[MnIII
(S2)]+; bottom, {[Mn
IV2(S2)2O2]+H}
+) of 15.

95
3.6 Crystal structures of Mn(salen) complexes
3.6.1 Solid structure of complex 10
Dark brown X-ray quality crystals of 10 were obtained by slow diffusion of ether into a
dichloroethane solution. The structure is shown in Figure 3.18, and selected bond lengths and
angles are listed in Table 3.5.
Based on the oxidation number of anions around the metal center, the oxidation state of the
two Mn centers was determined to be IV. The Mn(IV) center are d3 ions and are expected to be
spherically symmetric, indicating no significant axial elongation as compared to Mn(III) centers.
Two Mn(IV) centers are bridged by two μ-O groups to yield a planar Mn2O2 core. The local
coordination environment around each Mn center can be described as a distorted octahedron.
Each Mn center is chelated by one ONNO salen ligand, and two μ-O atoms. One phenolate O
atom and one imine N atom (O12-2 and N25_1, O12-3 and N25_4, respectively) and two bridging oxo
groups occupy the equatorial plane of the distorted octahedron, while the rest O and N donors in
salens occupy the positions trans to the bridging oxygens. Both salen ligands wrap around the
metal center in cis-β conformation and M helicity. The distance between two metal centers is
2.759(1) Å, which is in accordance to the reported Mn…
Mn distances (2.60-2.78 Å).15
The
bridging Mn-O-Mn angles of (98.18(6)˚ and 98.03(6)˚) are in the range of reported
dimanganese(IV) complexes data (95.1-99.5˚).15
A Small variation is observed in Mn-O bridging
distances (1.821(1) and 1.823(1) Å to Mn1, and 1.820(1) and 1.818(1) Å to Mn2), while both are
in the range of reported Mn(IV)/Mn(IV) complexes (1.774-1.826 Å for Mn-Ooxo bond).15
In
addition, the Mn-μ-O distances are longer than those of Mn-Ophenolate (mean 1.821 Å vs. mean
1.929 Å). The mean Mn-N distances of 2.000 Å and Mn-O distances of 1.850 Å are
unexceptional and typical of similar Mn(IV) systems.15

96
Figure 3.18 Structure of complex 10: top, thermal ellipsoid plot (50% probability, H and
noncoordinated solvent omitted for clarity); bottom, space filling model.

97
Table 3.5 Selected bond lengths (Å) and bond angles (˚) of complex 10 grown in N2.
Mn1-O12_1 1.902(1) Mn2-O12_3 1.936(1)
Mn1-O12_2 1.927(1) Mn2-O12_4 1.917(1)
Mn1-N25_1 2.032(2) Mn2-N25_3 1.985(1)
Mn1-N25_2 1.978(2) Mn2-N25_4 2.048(2)
Mn1-O1 1.821(1) Mn2-O1 1.818(1)
Mn1-O2 1.823(1) Mn2-O2 1.820(1)
Mn1-O1-Mn2 98.18(6) Mn1-O2-Mn2 98.03(6)
O12_1-Mn1-N25_2 165.24(6) O12_4-Mn2-N25_3 163.69(6)
It is also found that the crystal of 10 grown under inert atmosphere shows similar
characteristic to that grown in the air (Figure 3.19) and the crystal structure of 11 (Figure 3.20) is
quite comparable to two crystals of 10.
Figure 3.19 Thermal ellipsoid plot of complex 10 grown in air. (50% probability, H and
noncoordinated solvent omitted for clarity).
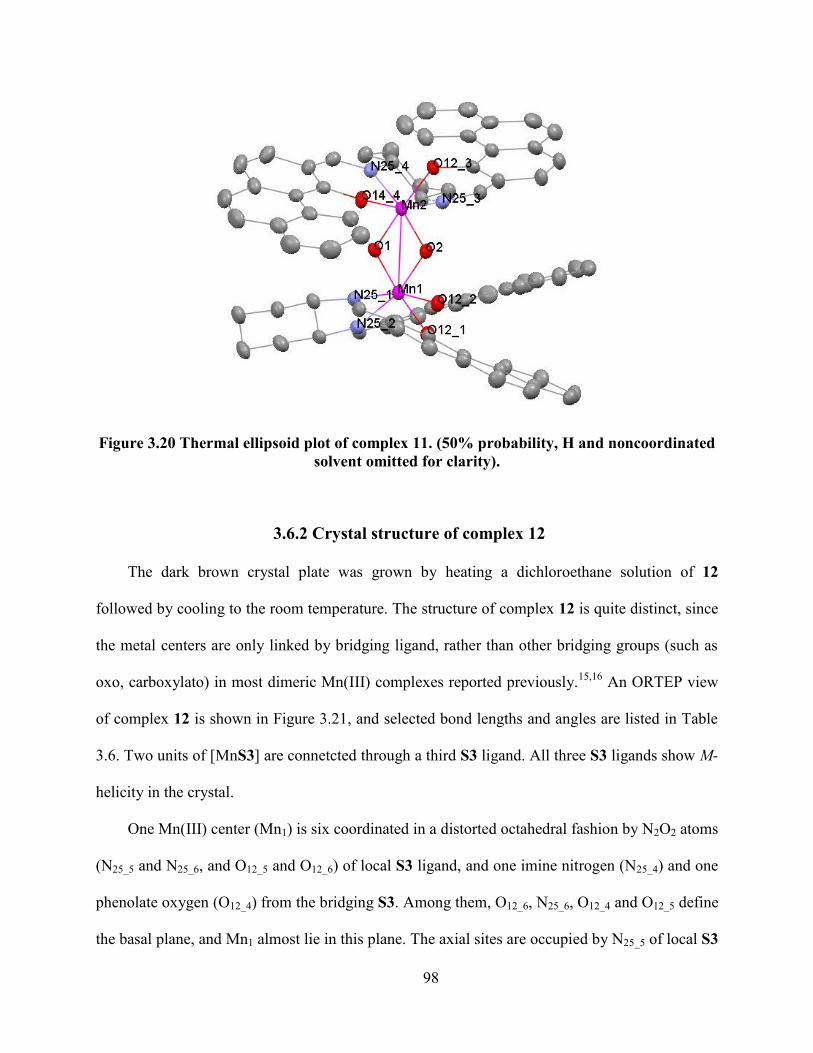
98
Figure 3.20 Thermal ellipsoid plot of complex 11. (50% probability, H and noncoordinated
solvent omitted for clarity).
3.6.2 Crystal structure of complex 12
The dark brown crystal plate was grown by heating a dichloroethane solution of 12
followed by cooling to the room temperature. The structure of complex 12 is quite distinct, since
the metal centers are only linked by bridging ligand, rather than other bridging groups (such as
oxo, carboxylato) in most dimeric Mn(III) complexes reported previously.15,16
An ORTEP view
of complex 12 is shown in Figure 3.21, and selected bond lengths and angles are listed in Table
3.6. Two units of [MnS3] are connetcted through a third S3 ligand. All three S3 ligands show M-
helicity in the crystal.
One Mn(III) center (Mn1) is six coordinated in a distorted octahedral fashion by N2O2 atoms
(N25_5 and N25_6, and O12_5 and O12_6) of local S3 ligand, and one imine nitrogen (N25_4) and one
phenolate oxygen (O12_4) from the bridging S3. Among them, O12_6, N25_6, O12_4 and O12_5 define
the basal plane, and Mn1 almost lie in this plane. The axial sites are occupied by N25_5 of local S3

99
and N25_4 of bridging S3. The conformation of its local salen displays as cis-β with M helicity.
As expected for an octahedral Mn(III) center, the Jahn-Teller distortion leads to enlogated axial
bond lengths of Mn1-N25_5 and Mn1-N25_4 (2.270(3) Å and 2.263(3) Å, respectively). The
dihedral angle between the naphthyl units in the backbone increases to 125.8˚ upon metallation
from 103.1˚ for the free ligand.
Figure 3.21 Crystal structure of complex 12: top, thermal ellipsoid plot (50% probability,
H and noncoordinated solvent omitted for clarity); bottom, space filling model: left, front
view; right, back veiw. (blue indicates the carbon in bridging S2 ligand).
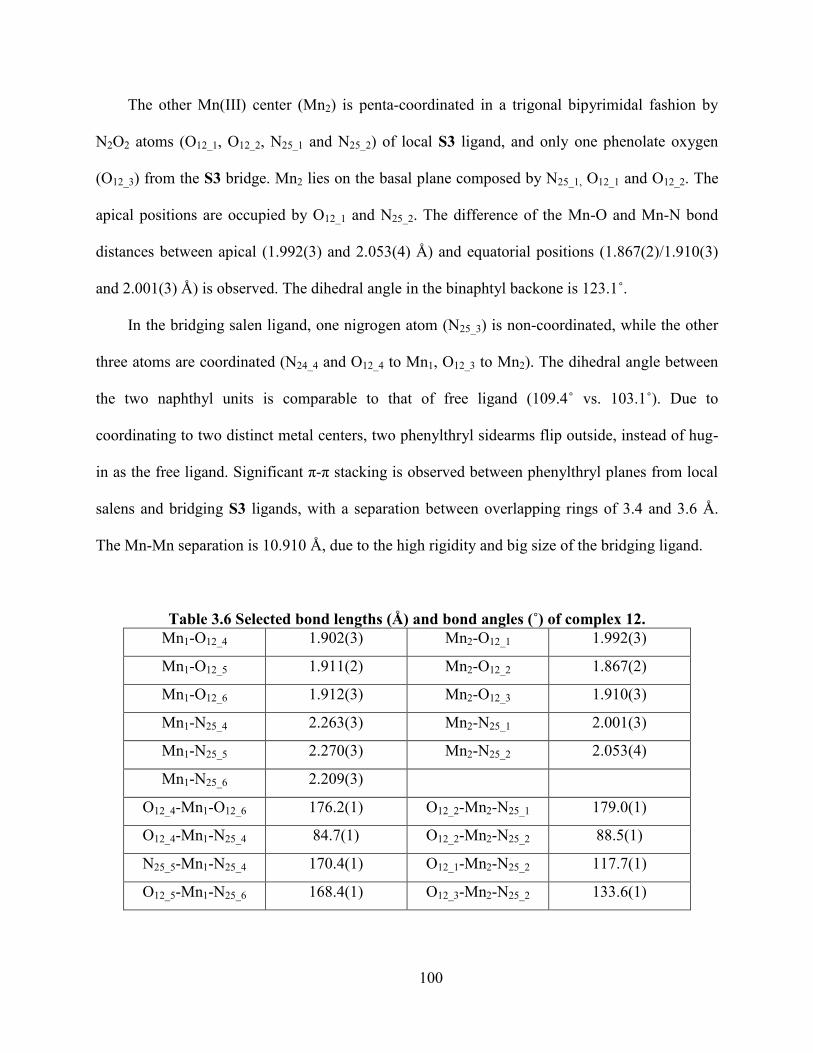
100
The other Mn(III) center (Mn2) is penta-coordinated in a trigonal bipyrimidal fashion by
N2O2 atoms (O12_1, O12_2, N25_1 and N25_2) of local S3 ligand, and only one phenolate oxygen
(O12_3) from the S3 bridge. Mn2 lies on the basal plane composed by N25_1, O12_1 and O12_2. The
apical positions are occupied by O12_1 and N25_2. The difference of the Mn-O and Mn-N bond
distances between apical (1.992(3) and 2.053(4) Å) and equatorial positions (1.867(2)/1.910(3)
and 2.001(3) Å) is observed. The dihedral angle in the binaphtyl backone is 123.1˚.
In the bridging salen ligand, one nigrogen atom (N25_3) is non-coordinated, while the other
three atoms are coordinated (N24_4 and O12_4 to Mn1, O12_3 to Mn2). The dihedral angle between
the two naphthyl units is comparable to that of free ligand (109.4˚ vs. 103.1˚). Due to
coordinating to two distinct metal centers, two phenylthryl sidearms flip outside, instead of hug-
in as the free ligand. Significant π-π stacking is observed between phenylthryl planes from local
salens and bridging S3 ligands, with a separation between overlapping rings of 3.4 and 3.6 Å.
The Mn-Mn separation is 10.910 Å, due to the high rigidity and big size of the bridging ligand.
Table 3.6 Selected bond lengths (Å) and bond angles (˚) of complex 12.
Mn1-O12_4 1.902(3) Mn2-O12_1 1.992(3)
Mn1-O12_5 1.911(2) Mn2-O12_2 1.867(2)
Mn1-O12_6 1.912(3) Mn2-O12_3 1.910(3)
Mn1-N25_4 2.263(3) Mn2-N25_1 2.001(3)
Mn1-N25_5 2.270(3) Mn2-N25_2 2.053(4)
Mn1-N25_6 2.209(3)
O12_4-Mn1-O12_6 176.2(1) O12_2-Mn2-N25_1 179.0(1)
O12_4-Mn1-N25_4 84.7(1) O12_2-Mn2-N25_2 88.5(1)
N25_5-Mn1-N25_4 170.4(1) O12_1-Mn2-N25_2 117.7(1)
O12_5-Mn1-N25_6 168.4(1) O12_3-Mn2-N25_2 133.6(1)

101
3.6.3 Crystal structure of complex 15
The crystals of 15 were obtained by slow-diffusion of dichloroethane/ether. The molecular
structure of 15 is shown in Figure 3.22. Selected bond lengths and angles of complex 15 are
listed in Table 3.7. In this bis(μ-oxo)-bridged dimanganese(IV) compound, the Mn2O2 core is
pseudo-square planar with the Mn-Mn distance of 2.747 Å. Besides two oxo bridges, two
phenolate O atoms and two imine N atoms of S2 ligand are chelated to each Mn ion, which make
the roughly octahedral coordination environment around each metal center. Both salen ligands
show as M-helix and adopt a cis-β configuration so as to leave two cis sites for two oxo bridges.
The axial ligation is provided by nitrogen and oxygen atoms from salen units. The Mn-μ-O bond
is slightly shorter that the Mn-Ophenolate (mean 1.812 vs. 1.940 Å). The bond distance trans to oxo
bridge are longer that those cis ones (Mn1-Ophenolate 1.910 vs. 1.930 Å; Mn2-Nimine 1.962 vs. 2.042
Å). This may be due to the trans influence of oxo bridging groups.
A π-π stacking interaction between the two benz[a]anthryl rings of ligands, with an
approximate separation between overlapping planes of 3.4 Å. The terminal aryl rings in
benz[a]anthryl sidearms are overlapped as expected. The angles between two sidearm planes are
41.95˚ (Mn1 centerd) and 48.08˚ (Mn2 centered), respectively. All structural parameters of 15 fall
within the ranges of other similar Mn(salen) complex containing Mn2O2 core.15

102
Figure 3.22 Structure of complex 15: top, thermal ellipsoid plot (50% probability, H and
noncoordinated solvent omitted for clarity); bottom, space filling model.

103
Table 3.7 Selected bond lengths (Å) and bond angles (˚) of complex 15.
Mn1-O12_1 1.902(1) Mn2-O12_3 1.939(1)
Mn1-O12_2 1.922(1) Mn2-O12_4 1.918(1)
Mn1-N31_1 2.042(2) Mn2-N31_3 1.960(2)
Mn1-N31_2 1.965(2) Mn2-N31_4 2.040(2)
Mn1-O1 1.818(1) Mn2-O1 1.810(1)
Mn1-O2 1.812(1) Mn2-O2 1.809(1)
Mn1-O1-Mn2 98.43(6) Mn1-O2-Mn2 98.66(6)
O12_1-Mn1-N31_2 163.84(6) O12_4-Mn2-N31_3 164.16(6)
A view of the packing diagram of 15 down the a axis and on the ac plane is present in
Figure 3.23. This reveals a 2D double-layered column structure. In each layer all di-Mn(IV)
molecule is identical and stacked. The Mn(IV) dimeric units in the neighboring columns are
reversely oriented, in order to fully occupy the space. In addition, the dimers are stabilized by π-
π stacking between the aromatic ring of sidearm and cyclohexyl backbone of adjacent molecule.
The distance between layers is about 10.60 Å. The shortest Mn…
Mn distance is around 10.87 Å.
Figure 3.23 Packing diagram of complex 15. (left, view along the a axis; right, on the ab
plane).

104
3.7 Asymmetric expoxidation of olefin catalyzed by manganese(salen)
complexes
The catalytic potential of manganese complexes as enantioselective catalysts was tested in
the asymmetric epoxidation of several simple model compounds, trans -β-methyl styrene,
styrene and indene, which are representative trans, terminal, and cis olefins respectively.
3.7.1. The effect of co-catalyst on the catalytic acitivity of asymmetric epoxidation
of trans -β-methyl styrene by 9
The beneficial effects of co-catalysts have been observed in many epoxidations.17
Both
pyridine-N-oxide (PNO) and 4-methylmorpholine-N-oxide (MNO) have been tested as co-
catalysts when the catalytic reactions performed with iodosylbenzene (PhIO) as oxidant in dry
CH3CN. The results are presented in Table 3.8.
Table 3.8 Epoxidation of alkenes catalyzed by complex 9 in dry CH3CN.
substrate
Conversion/%
Without co-catalyst With PNO With MNO
trans -β-methyl stryene 0 43.8 trace
indene 0 25.6 trace
stryrene 0 89.3 none
Conditions: 2-10 mol% catalyst, 0.1-0.4 mmol iodosylbezene, 0.1 mL substrate, 5 mL dry acetonitrile,
room temperature, yield is determined by 1H NMR.
PNO: pyridine-N-oxide; MNO: 4-methylmorpholine-N-oxide.
No epoxide products have been detected in the absence of any co-catalyst even when
increasing the catalyst loading and prolonging the reaction time. However, upon addition of
PNO, the conversion of trans -β-methyl stryene oxide is detected as 43.8% under the same

105
conditions. In the presence of MNO, the catalytic activity is very low, only traces of epoxides are
found. The role of the co-catalyst is not very clear. It may serve as an axial ligand to activate the
Mn=O species.10,17,18
3.7.2. Asymmetric epoxidation of trans-β-methyl styrene by 9 and 12
Asymmetric epoxidation of trans-β-methyl styrene is carried out in dry acetontrile in the
presence of pyridine-N-oxide (PNO) as co-catalyst at room temperature. Both 9 and 12 have
been tested to catalyze this reaction (Figure 3.24).
Ph
MePNO, CH3CN
PhIO, ~3% catl.
O
Ph H
MeH
H
H
Figure 3.24 Scheme of asymmetric epoxidation of trans-β-methyl styrene catalyzed by 9/12.
After 20 h, the epoxide conversion is found to be 74.5% by 9 with 73.6% enantiomeric
excesses (ee). Meanwhile, the conversion by 12 is 22.6% with 84.9% ee. No significant rate
decrease is observed in the epoxidation catalyzed by 9 after 6 h. The epoxide production over
this period exhibits a linear concentration increase (Figure 3.25, solid line). When catalyzed by
12 under the same conditions, the epoxidation proceeds with moderately lower conversion as
compared to 9 (19.9% vs. 24.6%) in the initial reaction period. There is no significant increase in
reaction rate after that (Figure 3.25, dashed line). The ee in both 9 and 12 reaches the maxima
after 40 mins, then the ee values level off. The enantioselectivity is slightly higher with 12 than 9
(Figure 3.26). The results indicate that both 9 and 12 display catalytic potential in the

106
asymmetric epoxidation of trans alkenes. Catalyst 9 shows better reactivity, while catalyst 12
shows better selectivity.
0
10
20
30
40
50
60
70
0 100 200 300 400
time/min
con
ver
sio
n/%
9
12
Figure 3.25 Percent yield versus time plot of trans-β-methyl styrene epoxidation with PhIO
in acetonitrile at room temperature catalyzed by 9 (■, solid line) and 12 (▲, dashed line). Conditions: 3.0 mol % catalyst, 1.05 mmol iodosobenzene, 0.1 mL substrate, 0.17 mmol pyridine N-oxide, 10 mL
dry acetonitrile, room temperature. Both converson and ee are determined by GC analysis on a chiral column.
0
10
20
30
40
50
60
70
80
90
100
0 100 200 300 400
time/min
ee
/%
Figure 3.26 ee value versus time plot of trans-β-methyl styrene epoxidation with PhIO in
acetonitrile at room temperature catalyzed by 9 (■, solid line) and 12 (▲, dashed line). Reaction condition is the same to Figure 3.24.
It is believed that catalytic epoxidation involves a reactive O=MnV species.
2,3,,6,18 The X-ray
crystallographic studies of 10 and 12 show a deep-stepped conformation. The rigidity of chiral
backbone as well as the bulkiness of phenylthryl ring sidearm can help to lock such a deeply
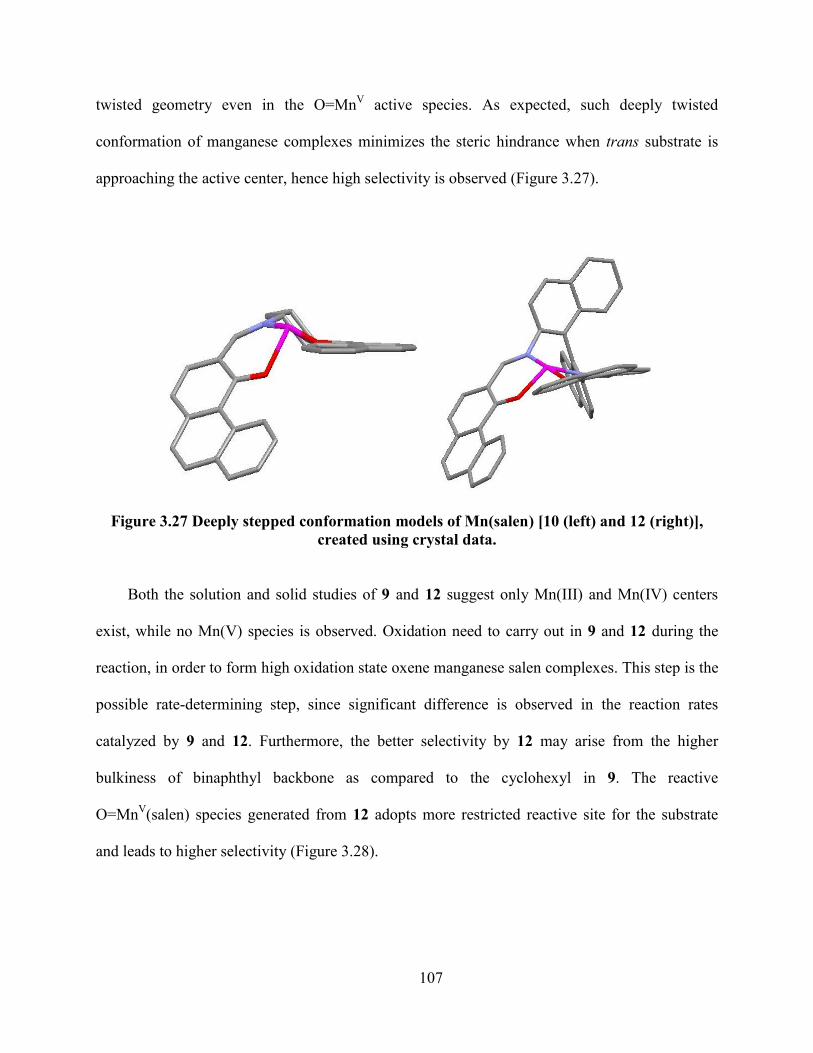
107
twisted geometry even in the O=MnV active species. As expected, such deeply twisted
conformation of manganese complexes minimizes the steric hindrance when trans substrate is
approaching the active center, hence high selectivity is observed (Figure 3.27).
Figure 3.27 Deeply stepped conformation models of Mn(salen) [10 (left) and 12 (right)],
created using crystal data.
Both the solution and solid studies of 9 and 12 suggest only Mn(III) and Mn(IV) centers
exist, while no Mn(V) species is observed. Oxidation need to carry out in 9 and 12 during the
reaction, in order to form high oxidation state oxene manganese salen complexes. This step is the
possible rate-determining step, since significant difference is observed in the reaction rates
catalyzed by 9 and 12. Furthermore, the better selectivity by 12 may arise from the higher
bulkiness of binaphthyl backbone as compared to the cyclohexyl in 9. The reactive
O=MnV(salen) species generated from 12 adopts more restricted reactive site for the substrate
and leads to higher selectivity (Figure 3.28).
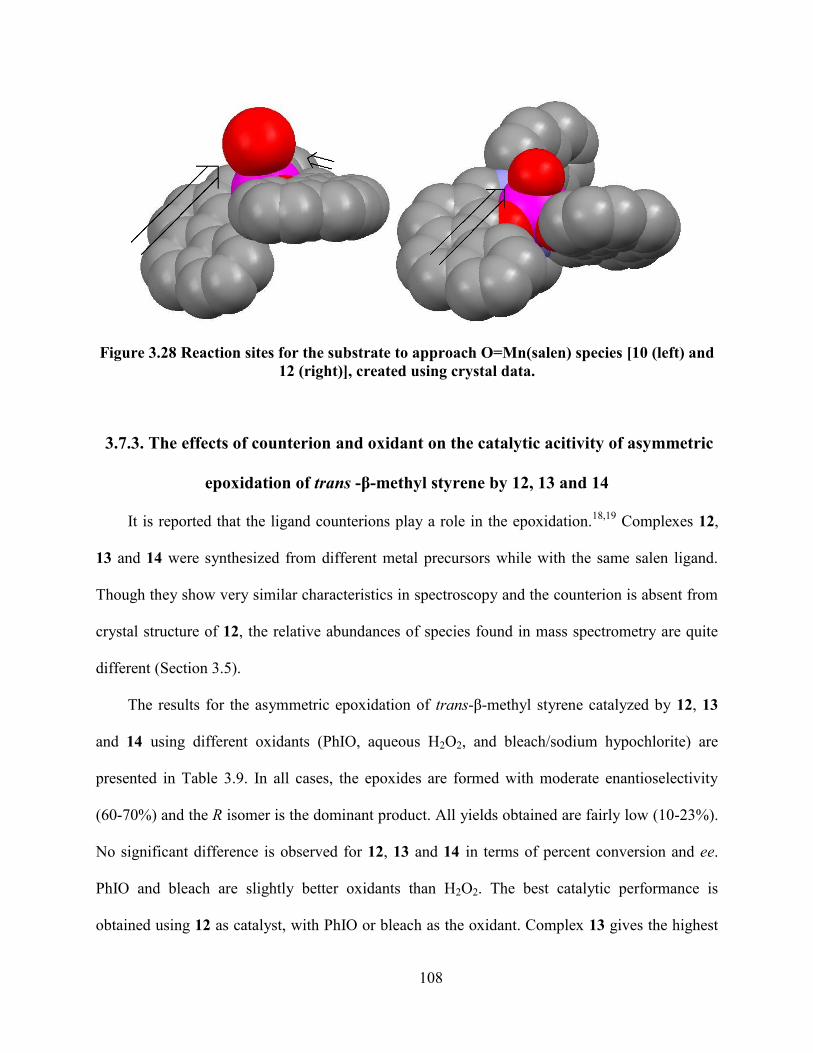
108
Figure 3.28 Reaction sites for the substrate to approach O=Mn(salen) species [10 (left) and
12 (right)], created using crystal data.
3.7.3. The effects of counterion and oxidant on the catalytic acitivity of asymmetric
epoxidation of trans -β-methyl styrene by 12, 13 and 14
It is reported that the ligand counterions play a role in the epoxidation.18,19
Complexes 12,
13 and 14 were synthesized from different metal precursors while with the same salen ligand.
Though they show very similar characteristics in spectroscopy and the counterion is absent from
crystal structure of 12, the relative abundances of species found in mass spectrometry are quite
different (Section 3.5).
The results for the asymmetric epoxidation of trans-β-methyl styrene catalyzed by 12, 13
and 14 using different oxidants (PhIO, aqueous H2O2, and bleach/sodium hypochlorite) are
presented in Table 3.9. In all cases, the epoxides are formed with moderate enantioselectivity
(60-70%) and the R isomer is the dominant product. All yields obtained are fairly low (10-23%).
No significant difference is observed for 12, 13 and 14 in terms of percent conversion and ee.
PhIO and bleach are slightly better oxidants than H2O2. The best catalytic performance is
obtained using 12 as catalyst, with PhIO or bleach as the oxidant. Complex 13 gives the highest

109
yield (11.1%) with 80.3% ee when using H2O2 as the oxidant. It seems that the counterion plays
a very limited role in the asymmetric epoxidation in this study. During the catalysis, the
couterion will dissociate to generate reactive species, even if the couterions chelate to the metal
center. The similar dissocation pathways of Cl-, OAc
-, and NO3
- lead to the identical
O=MnIV
(salen) complex. Manganese complexes are reported to decompose in the presence of
H2O2, which may cause the low conversion with this oxidant.18
Table 3.9 Comparative acticity study of 12, 13 and 14 in the epoxidation of trans-β-methyl
styrene.
oxidant catalyst % conversion % ee
PhIO 12 22.6 69.8
13 21.3 64.5
14 21.8 69.1
H2O2 12 10.3 67.1
13 11.1 80.3
14 10 84.4
Chlorox 12 36.6 61.9
13 23.5 61.1
14 20.7 61.4
Conditions: ~3.0 mol % catalyst, 1.05 mmol oxidant, 0.1 mL substrate, 0.17 mmol pyridine-N-oxide, 5 mL dry
acetonitrile for PhIO or 5 mL mixture of oxidant and dichloromethane for H2O2 and bleach, room temperature,
20 h. The conversion is determined by 1H NMR and ee is determind by GC.
The terminal oxidants, tert-butyl hydroperoxide (t-BuOOH) and di-tert-butyl peroxide (t-
BuOOBu-t) have been employed for the catalytic epoxidation by 9 in CH2Cl2 (in addition to
PhIO, aqueous H2O2, and bleach). Trans -β-methyl styrene, styrene, indene, cyclooctene and
cyclohexene were used as model substrates. Some of the results are summarized in Table 3.10.

110
Table 3.10 Epoxidation of some alkenes with different oxidants using 9 as catalyst.
oxidant
% conversion
trans-β-methyl styrene styrene indene
PhIO 43.8 (73.6) 89.3 (11.3) --
Aqueous H2O2 50 (>90) 27.8 28.6
Clorox 36.4 (83.7) 76.9 66.7
t-BuOOH 33.5 trace trace
t-BuOOBu trace trace trace
Conditions: 1.5-2.5 mol% catalyst, 1.0 mmol oxidant, 0.1 mL substrate, 0.15-0.2 mmol pyridine-N-oxide, ~ 6
mL dichloromethane at room tempature, 18 h. % Conversion is determined by 1H NMR. The numbers in
brackets indicate %ee.
Of the organic terminal oxidants, PhIO is superior to the others. It can oxidize all three
olefins to corresponding epoxides, with moderate to acceptable conversion and selectivity. t-
BuOOH can only catalytically oxidize trans-β-methyl styrene to its epoxide with moderate
conversion. t-BuOOBu-t has also been tried in this system, but no epoxides are detected in all
substrates. It is reported that polymerization of alkene could be initialized in the presence of t-
BuOOBu-t.20
Epoxidation in aqueous medium is attractive due to its green feature, but it is usually
confronted by such challenges as limited solubility, catalyst degradation, and/or relatively low
product yield/selectivity. The catalyst 9 is sparingly soluble in water, but readily soluble in
dichloromethane. This leads to a two-phase reaction media when using aqueous H2O2 and bleach
as oxidants: substrate/product, catalyst and co-catalyst are in organic phase; oxidant in water
phase. The highest activity with aqueous H2O2 is observed in trans-β-methyl styrene oxidation
with 50% conversion and 90% ee. The conversions are only modest in both styrene and indene.
It should be mentioned that at the end of reaction, the decomposition of catalyst is evidenced by
the fading color of reaction medium from dark brown to light/grayish brown. In the presence of

111
bleach, low conversion and moderate ee are observed in the oxidation of trans-β-methyl styrene,
while moderate conversion is seen for the oxidation of styrene and indene.
The catalytic epoxidation of cyclohexene and cyclooctene are also carried out with both
inorganic and organic terminal oxidants. The analysis of the reaction mixture shows that the
major products are other oxidation products (alcohol, ketone), rather than epoxide.
TO
TOMnIII
MnV
O
R2
R1
MnIII
O
T
MnV
O
R2
R1
R2
R1O
Figure 3.29 Proposed mechanism for Mn(salen) catalyzed asymmetric epoxidation of trans
olefin. TO: terminal oxidant, stepped shape indicates the helix-directing H2S1 and H2S3
salen ligands.
The prosposed reaction pathways for asymmetric epoxidation with 9/12 in the presence of
terminal oxidant (TO) are shown in Figure 3.29. When O=MnV(S) is believed to be the active
species, there are two possible ways to generate it: directly from MnIII
(S) by oxidation, or first
ligation of TO to MnIII
(S), then conversion to O=MnV(S).
18,19 This step is believed to be the rate-
determining step, since different epoxidation rate is observed with 9 and 12 (Figure 3.24 and
3.35). Different oxidants may have different abilities to generate and stabilize this species, since
different reactivity and selectivity are observed (Table 3.10). Next, the olefin approaches and the
oxygen atom transfers, leading to the regeneration of MnIII
(S). The deeply stepped conformation

112
of O=MnV(S) greatly reduces the steric repulsion when the trans substrate approaches. Other
olefins such as terminal and cis may also approach in the similar way.
3.8. Conclusion and future work
Novel Mn(IV) and Mn(III) complexes containing helix-directing salen ligands have been
synthesized and characterized. In the solution, these complexes are believed to be the mixture of
dimer and monomer, according to MS, IR and UV-vis. In the solid state, only binuclear
molecules are seen by XRD. One kind of dimeric structure is bridged by two oxo groups, and the
other kind bridged by the third salen ligand. The difference may be derived from the distinct
steric and electronic features of backbone and sidearm of the ligands. These complexes show
catalytic activity in the epoxidation of olefins, especially trans-β-methyl styrene with moderate
selectivity.
New helix-directing ligands are currently being investigated in our group, in order to
synthesize transition metal complexes that would act as catalysts for asymmetric reactions.
Magnetic characterization (EPR, magnetic susceptibility) of these Mn(salen) complexes is a
good tool to understand specific spin and oxidation states of manganese as well as other d-
electron properties. Computational studies are also necessary to further determine the
conformation in solution and explore the catalytic process.
The catalytic epoxidation systems in this work will be explored in the following aspects.
1. optimize the reaction conditions, especially when using aqueous H2O2 as oxidant;
2. examine the substrate scope;
3. investigate the underlying mechanism.

113
3.9 References
1. Ferreira, K. N.; Iverson, T. M.; Maghlaoui, K.; Barber, J.; Iwata, S. Architecture of the
photosynthetic oxygen-evolving center. Science 2004 303, 1831-1838. and related references.
2. Sheldon, R. A., Kochi, J. K. Metal-catalyzed oxidations of organic compounds, 1981,
Academic Press, London.
3. Bachvall, J. E. (Ed.) Modern oxidation methods, 2005, Wiley-VCH, Weinheim.
4. Katsuki, T. Unique asymmetric catalysis of cis- metal complexes of salen and its related
Schiff-base ligands. Chem. Soc. Rev. 2004, 33, 437-444.
5. O‟Mahony, C. P.; McGarrigle, E. M.; Renehan, M. F.; Ryan, K. M.; Bousque, C.; Gilheany,
D. G. Asymmetric alkene epoxidation with chromium oxo salen complexes. A systematic
study of salen ligand substituents. Org. Lett. 2001, 3, 3435-3438.
6. Fichtinger, D.; Plattner, D. A. Oxygen transfer to manganese-salen complexes: an electrospray
tandem mass spectrometric study. J. Chem. Soc., Perkin Trans. 2000, 2, 1023-1208.
7. Punniyamurthy, T., Velusamy, S., Iqbal, J. Recent advances in transition metal catalyzed
oxidation of organic substrates with molecular oxygen. Chem. Rev. 2005, 105, 2329-2363.
8. Torayama, H., Nishide, T., Asada, H., Fujiwara, M., Matsushita, T. Preparation and
characterization of two different types of di--oxo dimanganese(IV) complexes with
tetradentate Schiff bases. Polyhedron 1998 17, 105-118.
9. Maneiro, M., Bermerjo, M. R., Fondo, M., Gonzalez, A. M., Sanmartin, J., Garcia-
Monteagudo, J. C., Pritchard, R. G., Tyryshkin, A. M. Structural and photolytic studies on
new mononuclear and binuclear manganese complexes containing Schiff base ligands. The
crystal structure of [Mn(-3,5-Brsalpn)(-O)]2.2DMF. Polyhedron 2001, 20, 711-719.
114
10. Kurahashi, T., Fujii, H. Chiral distortion in a MnIV
(salen)(N3)2 derived from Jacobsen‟s
catalyst as a possible conformation model for its enantioselective reactions. Inorg. Chem.
2008, 47, 7556-7567. and related references.
11. Wiznycia, A. V., Desper, J., Levy, C. J. Monohelical iron(II) and zinc(II) complexes of a
(1R,2R)-cyclohexyl salen ligand with benz[a]anthryl sidearms. Inorg. Chem. 2006, 45,
10034-10036.
12. Hirotsu, M.; Nakajima, K.; Kojima, M.; Yoshikawa, Y. Manganese(III) complexes
containing optically active tetradentate Schiff base ligands. effects of phenyl substituents.
Inorg. Chem. 1995, 34, 6173-6178.
13. Wiznycia, A. The preparation and studyof bis(pyridyl-imine) and monohelical salen-type
complexes of iron and zinc. PhD thesis. 2006
14. Yin, G., McCormick, J. M., Buchalova, M., Danby, A. M., Rodgers, K., Day, V. W., Smith,
K., Perkins, C. M., Carter, J. D., Scheper, W. M., Busch, D. H. Synthesis, characterization,
and solution properties of a novel cross-bridged cyclam manganese(IV) complex having two
terminal hydroxo ligand. Inorg. Chem. 2006, 45, 8052-8061.
15. Ruiz-Garcia, R., Pardo, E., Munoz, M. C., Cano, J. High-valent bis(oxo)-bridged dinuclear
manganese oxamates: synthesis, crystal structure, magnetic properties, and electronic
structure calculations of bis(-oxo)dimanganese(IV) complexes with a binucleating o–
phenylenedioxamate ligand. Inorg. Chim. Acta. 2007, 1, 221-232.
16. Mikata, Y., So, H., Yamashita, A., Kawamura, A., Mikuriya, M., Fukui, K., Ichimura, A.,
Yano, S. Quinoline-based tetradendate nitrogen ligands stabilized the bis(-oxo) dinuclear
manganese(III,III) core. Dalton Trans. 2007, 3330-3334.

115
17. Rasmussen, K. G., Thomsen, D. S., Jorgensen, K. A. Oxidation of imines to oxaziridines
catalyzed by transition metal complexes using molecular oxygen as the terminal oxidant. J.
Chem. Soc. Perkin Trans. 1995, 699-704.
18. Oyama, S. T. (Ed.) Mechanisms in Homogeneous and Heterogeneous Epoxidation catalysis,
2008, Elsevier, Oxford, UK.
19. Adam, W., Roschmann, K. J., Saha-Moller, C. R., Seebach, D. cis–stilbene and (1,2,3)-
(2-ethenyl-3-methoxycyclopropyl)benzene as mechanistic probes in the MnIII
(salen)-
catalyzed epoxidation: influence of the oxygen source and the counterion on the
diastereoselectivity of the competitive concerted and radical-type oxygen transfer. J. Am.
Chem. Soc. 2002, 124, 5068-5073.
20. Romakh, V. B., Therrien, B., Suss-Fink, G., Shul‟pin G. B. Synthesis, molecular structure,
and catalytic potential of the tetrairon complexes[Fe4(N3O2-L)4(-O)2]4+
(L=1-
carboxymethyl-4,7-dimethyl-1,4,7-triazacyclononane). Inorg. Chem. 2007, 46, 3166-3175.
21. Wang, S. H. Mandimutsira, B. S., Todd, R., Ramdhanie, B., Fox, J. P., Goldberg, D. P.
Catalytic sulfoxidation and epoxidation with a Mn(III) triazacorrole: Evidence for a “third
oxidant” in high-valent porphyrinoid oxidations. J. Am. Chem. Soc. 2004, 18-19.

116
Experimental Section
General methods
All reactions were run under inert atmospheres unless otherwise noted. All organic solvents
(CH2Cl2, hexane and diethyl ether) used in metallation reaction were purchased from Fisher
Scientific, stored over sodium benzophenone ketyl or calcium hydride, and degassed prior to
transfer via high-vacuum line technique. Other organic solvents (methanol, CH3CN and
spectroscopic grade THF) used in characterization was purchased from Fisher Scientific and
used as received. Argon gases (LINWELD INC, Lincoln NE) and oxygen gases (Metheson tri-
gas INC, Basking ridge NJ) were purifed by passing through 4 Å molecular sieves and an
Engelhard Q5 catalyst bed.
IR spectra were collected on Nicolet 380 FT-IR (Thermo Scientific, Madison MN) at room
temperature. UV-Vis spectra were obtained on a Varian Cary 500 scan UV-Vis-NIR
spectrophotometer (Agilent Technologies) in acetonitrile, and CD spectra on a JASCO J-815
spectropolarimeter (Jasco, Tokyo Japan) in spectroscopic grade tetrahydrofuran (THF). The
solution samples for UV-Vis and CD were prepared at room temperature, with the concentrations
ranged between 1.5 and 2.5 × 10⁻⁵
M. A 1.00 cm path length quartz cell was employed for both
analyses. HR-ESI-Mass spectra were collected by Quattro Ultima (Micromass Ltd, Manchester
UK) in methanol (for Ti(salen) complexes 1-8) and CH3CN (for Mn(salen) complexes 9-15). LR-
ESI-Mass Spectra were acquired on Bruker Esquire 3000 Plus ion trap mass spectrometer
(Bruker Daltonics Inc, Milford MA) in CH2Cl2. 1H NMR spectra were obtained at ambient
temperature on a Varian Unity 400 MHz spectrometer employing residual solvent protons as an
internal standard. Crystallographic data were collected using either either a Bruker SMART 1000
117
CCD or a Bruker-AXS SMART APEX CCD. Gas chromatography was carried out using a
Varian 3900 fitted with an FDI detector ans using hydrogen gas as the carrier gas. The
enantiometric excess was determined by GC using a chiral Supelco -Dex 120 column (30 m
0.25 mm). With an initial temperature of 100 ℃ for 20 min, followed by a ramp rate of
20 ℃/min to a final temperature of 180 ℃ for 15.5 min. (S)-trans--methyl styrene oxide has a
retention time of 22.3 min, and (R)-trans--methyl styrene oxide has a retention time of 24.1 min.
Manganese(II) chloride anhydrous 97% was purchased from Strem Chemicals.
Manganese(II) acetate anhydrous 98% was purchased from Aldrich Chemicals. Manganese(II)
nitrate hydrate (98%, Aldrich) was dried under vacuum for one week with heating before using.
Titanium(IV) tetrachloride (97%) and titanium(IV) tetra(isopropoxide) (99.9%) was purchased
from Aldrich Chemicals. CDCl3 is purchased from Cambridge Isotope Labotories, INC and dried
over 4Å molecular sieves before using. 30% aqueous H2O2 is purchased from Fisher Scientific.
Iodosylbenzene (PhIO) was prepared according to the reported proceducre.1 Pyridine N-oxide
(98%) and sodium methoxide were purchased from Acros Chemicals. tert-butyl hydroperoxide
(t-BuOOH) (70% solution in water) and di-tert-butyl peroxide (t-BuOOBu-t) were purchased
from Acros Organics. trans--methyl styrene (stabilized 97%), styrene from (stabilized 99%),
and indene (stabilized 90%) were all purchase from Acros Chemicals.
Ligands: the salen ligands (H2S1, H2S2, H2S3, H2S4) used for this study were prepared
according to the reported procedures.2
General synthetic procedure for titanium-salen complexes A solution of titanium(IV)
tetrachloride (0.11 mmol) [or titanium(IV) tetraisopropoxide (0.11 mmol)] in CH2Cl2 was added
to the salen ligand (0.10 mmol) solution in 3 mL CH2Cl2 in a drop wise manner. After stirring 3

118
hrs the reaction mixture was concentrated. The solid was decanted by hexane (5 mL×2) to
obtain a powder.
Ti(IV)-S1 complex (1). Dark reddish brown powder. (0.061 g, 85%). 1H NMR (CDCl3, 400
MHz): δ 1.68-1.84 (m, 2H, CH), 2.67-2.73 (m, 2H, CH), 3.72-3.78 (m, 4H, CH), 4.16-4.21 (m,
2H, CH), 7.50-7.53 (m, 2H, CH), 7.57-7.62 (m, 4H, CH), 7.65-7.76 (m, 10H, CH), 7.80-7.86 (m,
2H, CH), 7.92 (s, 2H, CH), 7.93-7.98 (m, 4H, CH), 8.57 (s, 2H, CH), 10.18 (d, 2H, CH). X-ray
quality crystals of the partially hydrolyzed product were obtained by heating-cooling method of
CH2Cl2 solution of complex 1. ESI-MS (MeOH) m/z: [Ti(S1)(OMe)]+, calcd for C37H31N2O3Ti
+,
599.1814; found 599.1810 (0.7 ppm).
Ti(IV)-S1 complex (2). Dark reddish brown powder. (0.067 g, 74%). 1H NMR (CDCl3, 400
MHz): δ 1.49-1.57 (m, 1H, CH), 1.59-1.64 (m, 2H, CH), 1.69-1.78 (m, 3H, CH), 1.82-1.92 (m,
2H, CH), 2.15-2.22 (m, 1H, CH), 2.67-2.75 (m, 1H, CH), 4.18-4.25 (m, 1H, CH), 6.15-6.21 (t,
1H, CH), 6.89 (d, 2H, CH), 6.99-7.05 (m, 2H, CH), 7.17-7.21 (m, 3H, CH), 7.37 (s, 1H, CH),
7.52-7.62 (m, 4H, CH), 7.76 (m, 2H, CH), 7.99 (d, 1H, CH), 8.33 (s, 1H, CH), 8.60 (s, 1H, CH),
10.49 (s, 1H, CH). ESI-MS (MeOH) m/z: [Ti(S2)(OMe)]+, calcd for C45H35N2O3Ti
+, 699.2127;
found 699.2112 (2.1 ppm).
Ti(IV)-S1 complex (3). Dark reddish brown powder. (0.069 g, 79%). 1H NMR (CDCl3, 400
MHz): δ 6.98-7.04 (d/m, 1H, CH), 7.08-7.15 (d/m, 1H, CH), 7.29-7.48 (m, 7H, CH), 7.49-7.56
(m, 1H, CH), 7.60-7.67 (m, 5H, CH), 7.71-7.77 (m, 3H, CH), 7.80-8.03 (m, 7H, CH), 8.07-8.14
(m, 1H, CH), 8.40 (s, 1H, CH), 8.66 (s, 1H, CH), 10.13 (d, 1H, CH), 10.25 (d, 1H, CH). Crystals
suitable for X-ray analysis were grown from dichloromethane over which was layered diethyl

119
ether. ESI-MS (MeOH) m/z: [Ti(S3)(OMe)]+, calcd for C51H33N2O3Ti
+, 769.1917; found
769.1985 (1.8 ppm).
Ti(IV)-S1 complex (4). Dark reddish brown powder. (0.063 g, 65%). 1H NMR (CDCl3, 400
MHz): δ 6.27-6.37 (m, 1H, CH), 6.96 (d, 1H, CH), 7.03-7.14 (m, 3H, CH), 7.30-7.34 (m, 4H,
CH), 7.37-7.41 (m, 2H, CH), 7.41-7.44 (m, 1H, CH), 7.50-7.54 (m, 2H, CH), 7.56-7.64 (m, 4H,
CH), 7.66-7.72 (m, 3H, CH), 7.87-7.92 (m, 3H, CH), 7.99-8.07 (m, 3H, CH), 8.10-8.15 (m, 1H,
CH), 8.16-8.20 (m, 1H, CH), 8.21-8.26 (m, 1H, CH), 8.36 (s, 1H, CH), 8.66 (s, 1H, CH), 10.59
(s, 1H, CH), 10.85 (s, 1H, CH). ESI-MS (MeOH) m/z: [Ti(S4)(OMe)]+, calcd for C59H37N2O3Ti
+,
869.2284; found 869.2278 (0.7 ppm).
Ti(IV)-S1 complex (5). Greenish yellow powder. (0.062 g, 77%). 1H NMR (CDCl3, 400 MHz):
δ 0.80 (d, 3H, CH3), 0.85 (d, 3H, CH3), 1.13 (d, 3H, CH3), 1.18 (d, 3H, CH3), 1.43-1.53 (m, 1H,
CH), 1.59-1.66 (m, H, CH), 1.70-1.80 (m, 2H, CH), 2.03-2.16 (m, 2H, CH), 2.40-2.48 (m, 1H,
CH), 2.51-2.59 (m, 1H, CH), 2.89-2.97 (m, 1H, CH), 4.62 (sep, 1H, CH), 4.81-4.90 (m, 2H, CH),
5.72 (t, 1H, CH), 6.95 (t, 1H, CH), 7.17-7.20 (m, 1H, CH), 7.36-7.40 (m, 1H, CH), 7.47-7.58 (m,
6H, CH), 7.65-7.69 (m, 1H, CH), 7.75-7.79 (m, 1H, CH), 7.93-7.97 (m, 2H, CH), 8.41 (s, 1H,
CH), 8.49 (s, 1H, CH), 10.06 (d, 1H, CH), 10.62 (d, 1H, CH). ESI-MS (MeOH) m/z:
[Ti(S1)(OMe)]+, calcd for C37H31N2O3Ti
+, 599.1814; found 599.1804 (1.7 ppm).
Ti(IV)-S1 complex (6). Greenish yellow powder. (0.057 g, 63%). 1H NMR (CDCl3, 400 MHz):
δ 0.71-0.78 (m, 9H, CH3), 1.14 (d, 3H, CH3), 1.69-1.78 (m, 3H, CH), 2.02-2.14 (m, 3H, CH),
2.40-2.47 (m, 1H, CH), 2.49-2.56 (m, 1H, CH), 2.94-3.02 (m, 1H, CH), 4.58 (sep, 1H, CH),
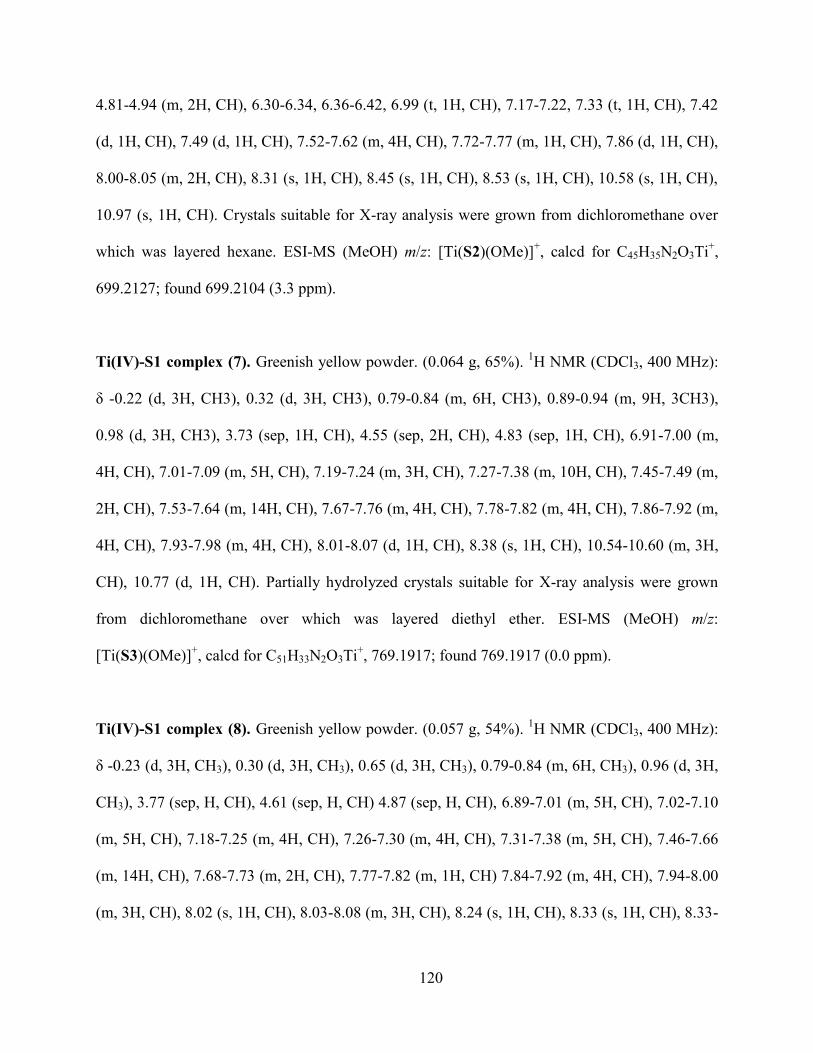
120
4.81-4.94 (m, 2H, CH), 6.30-6.34, 6.36-6.42, 6.99 (t, 1H, CH), 7.17-7.22, 7.33 (t, 1H, CH), 7.42
(d, 1H, CH), 7.49 (d, 1H, CH), 7.52-7.62 (m, 4H, CH), 7.72-7.77 (m, 1H, CH), 7.86 (d, 1H, CH),
8.00-8.05 (m, 2H, CH), 8.31 (s, 1H, CH), 8.45 (s, 1H, CH), 8.53 (s, 1H, CH), 10.58 (s, 1H, CH),
10.97 (s, 1H, CH). Crystals suitable for X-ray analysis were grown from dichloromethane over
which was layered hexane. ESI-MS (MeOH) m/z: [Ti(S2)(OMe)]+, calcd for C45H35N2O3Ti
+,
699.2127; found 699.2104 (3.3 ppm).
Ti(IV)-S1 complex (7). Greenish yellow powder. (0.064 g, 65%). 1H NMR (CDCl3, 400 MHz):
δ -0.22 (d, 3H, CH3), 0.32 (d, 3H, CH3), 0.79-0.84 (m, 6H, CH3), 0.89-0.94 (m, 9H, 3CH3),
0.98 (d, 3H, CH3), 3.73 (sep, 1H, CH), 4.55 (sep, 2H, CH), 4.83 (sep, 1H, CH), 6.91-7.00 (m,
4H, CH), 7.01-7.09 (m, 5H, CH), 7.19-7.24 (m, 3H, CH), 7.27-7.38 (m, 10H, CH), 7.45-7.49 (m,
2H, CH), 7.53-7.64 (m, 14H, CH), 7.67-7.76 (m, 4H, CH), 7.78-7.82 (m, 4H, CH), 7.86-7.92 (m,
4H, CH), 7.93-7.98 (m, 4H, CH), 8.01-8.07 (d, 1H, CH), 8.38 (s, 1H, CH), 10.54-10.60 (m, 3H,
CH), 10.77 (d, 1H, CH). Partially hydrolyzed crystals suitable for X-ray analysis were grown
from dichloromethane over which was layered diethyl ether. ESI-MS (MeOH) m/z:
[Ti(S3)(OMe)]+, calcd for C51H33N2O3Ti
+, 769.1917; found 769.1917 (0.0 ppm).
Ti(IV)-S1 complex (8). Greenish yellow powder. (0.057 g, 54%). 1H NMR (CDCl3, 400 MHz):
δ -0.23 (d, 3H, CH3), 0.30 (d, 3H, CH3), 0.65 (d, 3H, CH3), 0.79-0.84 (m, 6H, CH3), 0.96 (d, 3H,
CH3), 3.77 (sep, H, CH), 4.61 (sep, H, CH) 4.87 (sep, H, CH), 6.89-7.01 (m, 5H, CH), 7.02-7.10
(m, 5H, CH), 7.18-7.25 (m, 4H, CH), 7.26-7.30 (m, 4H, CH), 7.31-7.38 (m, 5H, CH), 7.46-7.66
(m, 14H, CH), 7.68-7.73 (m, 2H, CH), 7.77-7.82 (m, 1H, CH) 7.84-7.92 (m, 4H, CH), 7.94-8.00
(m, 3H, CH), 8.02 (s, 1H, CH), 8.03-8.08 (m, 3H, CH), 8.24 (s, 1H, CH), 8.33 (s, 1H, CH), 8.33-

121
8.37 (m, 2H, CH), 8.46 (s, 1H, CH), 11.05 (s, 2H, CH), 11.43 (s, 1H, CH). ESI-MS (MeOH) m/z:
[Ti(S4)(OMe)]+, calcd for C59H37N2O3Ti
+, 869.2284; found 869.2292 (0.9 ppm).
Mn(IV)-S1 complex (9). Manganese(II) chloride (0.12 g, 0.96 mmol), sodium methoxide (0.10
g, 1.9 mmol) and H2S1 (0.26 g, 0.502 mmol) were suspended into a 2:1 mixture of
dichloromethane/ethanol (15 mL) and stirred overnight. The reaction mixture was oxidized by
oxygen gas for 2 hours followed by soxhletation in dichloromethane (100 mL). The filtrate was
concentrated to yield a blackish brown powder (0.16 g, 42 %). ESI-MS (CH3CN) m/z:
[Mn(S1)(CH3CN)]+, calcd for C38H31N3O2Mn
+, 616.1797; found 616.1754.
Mn(IV)-S1 complex (10) and Mn(IV)-S1 complex (11). These compounds were prepared as
above, starting with manganese(II) acetate, manganese(II) nitrate in the place of manganese(II)
chloride. The yields were 38% and 24%, respectively. Single crystals suitable for X-ray analysis
were grown by slow diffusion of ether into a solution of 10/11 in dichloroethane. ESI-MS of 10
(CH3CN) m/z: [Mn(S1)(CH3CN)]+, calcd for C38H31N3O2Mn
+, 616.1797; found 616.1760 (1.9
ppm). ESI-MS of 11 (CH3CN) m/z: [Mn(S1)(CH3CN)]+, calcd for C38H31N3O2Mn
+, 616.1797;
found 616.1718.
Mn(III)-S3 complex (12). Manganese(II) chloride (0.10 g, 0.81 mmol), sodium methoxide (0.11
g, 2.1 mmol) and H2S3 (0.30 g, 0.43 mmol) were suspended into a 2:1 mixture of
dichloromethane/ethanol (15 mL) and stirred overnight. The reaction mixture was oxidized by
oxygen gas for 2 hours followed by soxhletation in dichloromethane (100 mL). The filtrate was
concentrated to yield a blackish brown powder (0.10 g, 25 %). Single crystals suitable for X-ray

122
analysis were grown by heating-cooling in a solution of 12 in dichloroethane. ESI-MS (CH3CN)
m/z: [Mn(S3)]+, calcd for C50H30N2O2Mn
+, 745.1688; found 745.1630.
Mn(III)-S3 complex (13) and Mn(III)-S3 complex (14). These compounds were prepared as
above, starting with manganese(II) acetate, manganese(II) nitrate in the place of manganese(II)
chloride. The yields were 60% and 18%, respectively. ESI-MS of 13 (CH3CN) m/z: [Mn(S3)]+,
calcd for C50H30N2O2Mn+, 745.1688; found 745.1574 (3.8 ppm). ESI-MS of 14 (CH3CN) m/z:
[Mn(S3)]+, calcd for C50H30N2O2Mn
+, 745.1588; found 745.1630.
Mn(III)-S2 complex (15). Manganese(II) chloride (0.08 g, 0.64 mmol), sodium methoxide (0.11
g, 2.1 mmol) and H2S2 (0.36 g, 0.59 mmol) were suspended into a 2:1 mixture of
dichloromethane/ethanol (15 mL) and stirred overnight. The reaction mixture was oxidized by
oxygen gas for 2 hours followed by soxhletation in dichloromethane (100 mL). The filtrate was
concentrated to yield a blackish brown powder (0.14 g, 32%). Single crystals suitable for X-ray
analysis were grown by slow diffusion of ether into a solution of 15 in dichloroethane. ESI-MS
(CH3CN) m/z: [Mn(S3)]+, calcd for C50H30N2O2Mn
+, 716.2110; found 716.2059 (0.1 ppm).
Epoxidation with different co-catalysts. Mn complex 9 (2-10 mol%), co-catalyst (0.16-0.23
mmol) and olefin substrate (1.0 mmol) were dissolved in acetonitrile (5 mL). The resultant
mixture was stirred at room temperature after PhIO (0.16-0.31 mmol) had been added. The
reaction medium was extracted with hexane (5 mL×2), and the hexane layer was concentrated
after dried over MgSO4. The oily residue was analyzed by 1H NMR in CDCl3.

123
Kinetic studies: To a 25 mL round-bottom flask was added 9/12 (~3 mol%), pyridine N-oxide
(0.17 mmol), and trans-β-methyl styrene (0.10 mL) in 10 mL acetonitrile. After PhIO (1.1
mmol) was added, the aliquot of 0.2 mL was taken at indicated interval when the reaction was
briefly stopped to allow phase separation. The sample was washed by 10-15 drops of hexane,
quenched by Na2SO3, dried over anhydrous MgSO4 for 15 min. The ee value and yield were
determined by GC analysis on a chiral column. GC conditions: Supelco β-Dex 120 0.25 mm×30
m column, 100 ℃ for 20 min followed by a ramp of 20 ℃ /min to 180 ℃ which is kept for 15.50
min. The temperatures of FID and injector are 200 ℃ and 135 ℃, respectively.
Epoxidation with different oxidants: To the solution of 9 (1.5-2.5 mol%), pyridine N-oxide
(0.15-0.20 mmol), alkene substrate (0.1 mL) in 6 ml CH2Cl2 was added oxidant (aqueous H2O2,
PhIO, t-BuOOH or t-BuOOBu, 1.0 mmol). After 18 hours, the reaction medium was diluted with
dichloromethane and the organic phase was washed by water (5 mL×2) and brine (5 mL) before
dried over MgSO4. The filtrate was concentrated and analyzed by 1H NMR in CDCl3.
In the case of Clorox®, 1.0 mL 0.5 M Na2B4O7 •10 H2O buffer solution was applied and the
pH was adjusted to 10 by adding a few drops of 10 M NaOH. The CH2Cl2 solution of substrate
and co-catalyst is added into the bleach drop by drop.
References
1. Blackmond, D. G., Hodnett, N. S., Lloyd-Jones, G. C. Mechanistic implication of zero-order
kinetic resolution. J. Am. Chem. Soc. 2006, 7450-7451.
2. Wiznycia, A. V., Desper, J., Levy, C. J. Iron(II) and zinc(II) monohelical binaphthyl salen
complexes. Chem. Comm. 2005, 37, 4693

124
Appendix A - 1H NMR spectra
10 9 8 7 6 5 4 3 2 1
C hemic a l Shift (ppm)
0
0.05
0.10
0.15
0.20
0.25
0.30
0.35
0.40
0.45
0.50
0.55
0.60
0.65
0.70
No
rma
lize
d In
ten
sity
Complex 1
10 9 8 7 6 5 4 3 2 1
C hemic a l Shift (ppm)
0.1
0.2
0.3
0.4
0.5
0.6
0.7
0.8
0.9
1.0
No
rma
lize
d In
ten
sity
Complex 2
N
O
N
O
Ti
Cl
Cl
1
N
O
N
O
Ti
Cl
Cl
2
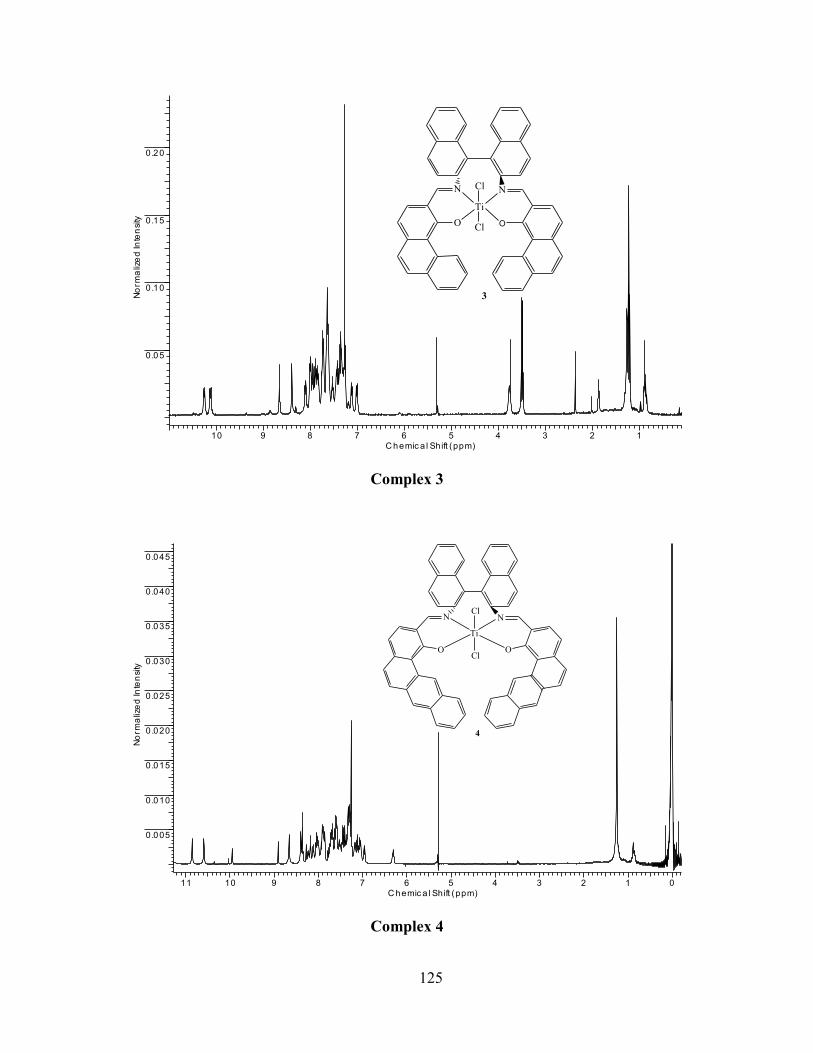
125
10 9 8 7 6 5 4 3 2 1
C hemic a l Shift (ppm)
0.05
0.10
0.15
0.20
No
rma
lize
d In
ten
sity
Complex 3
11 10 9 8 7 6 5 4 3 2 1 0
C hemic a l Shift (ppm)
0.005
0.010
0.015
0.020
0.025
0.030
0.035
0.040
0.045
No
rma
lize
d In
ten
sity
Complex 4
N
O
N
O
Ti
Cl
Cl
3
N
O
N
O
Ti
Cl
Cl
4

126
10 9 8 7 6 5 4 3 2 1 0
C hemic a l Shift (ppm)
0.05
0.10
0.15
0.20
0.25
0.30
0.35
0.40
0.45
0.50
0.55
No
rma
lize
d In
ten
sity
Complex 5
11 10 9 8 7 6 5 4 3 2 1 0
C hemic a l Shift (ppm)
0.1
0.2
0.3
0.4
0.5
0.6
0.7
0.8
0.9
1.0
No
rma
lize
d In
ten
sity
Complex 6
N
O
N
O
Ti
OiPr
OiPr
5
N
O
N
O
Ti
OiPr
OiPr
6

127
11 10 9 8 7 6 5 4 3 2 1 0
C hemic a l Shift (ppm)
0.05
0.10
0.15
0.20
No
rma
lize
d In
ten
sity
Complex 7
11 10 9 8 7 6 5 4 3 2 1 0
C hemic a l Shift (ppm)
0.05
0.10
0.15
0.20
0.25
0.30
0.35
0.40
No
rma
lize
d In
ten
sity
Complex 8
N
O
N
O
Ti
OiPr
OiPr
7
N
O
N
O
Ti
OiPr
OiPr
8

128
Appendix B - IR, UV and ECD spectra
0
0.2
0.4
0.6
0.8
1
1.2
200 300 400 500 600 700 800 900
wavelength/nm
Δε
IR and UV-Vis of complex 1

129
0
0.2
0.4
0.6
0.8
1
1.2
1.4
1.6
200 250 300 350 400 450 500 550 600
wavelength/nm
Δε
IR and UV-Vis of complex 2
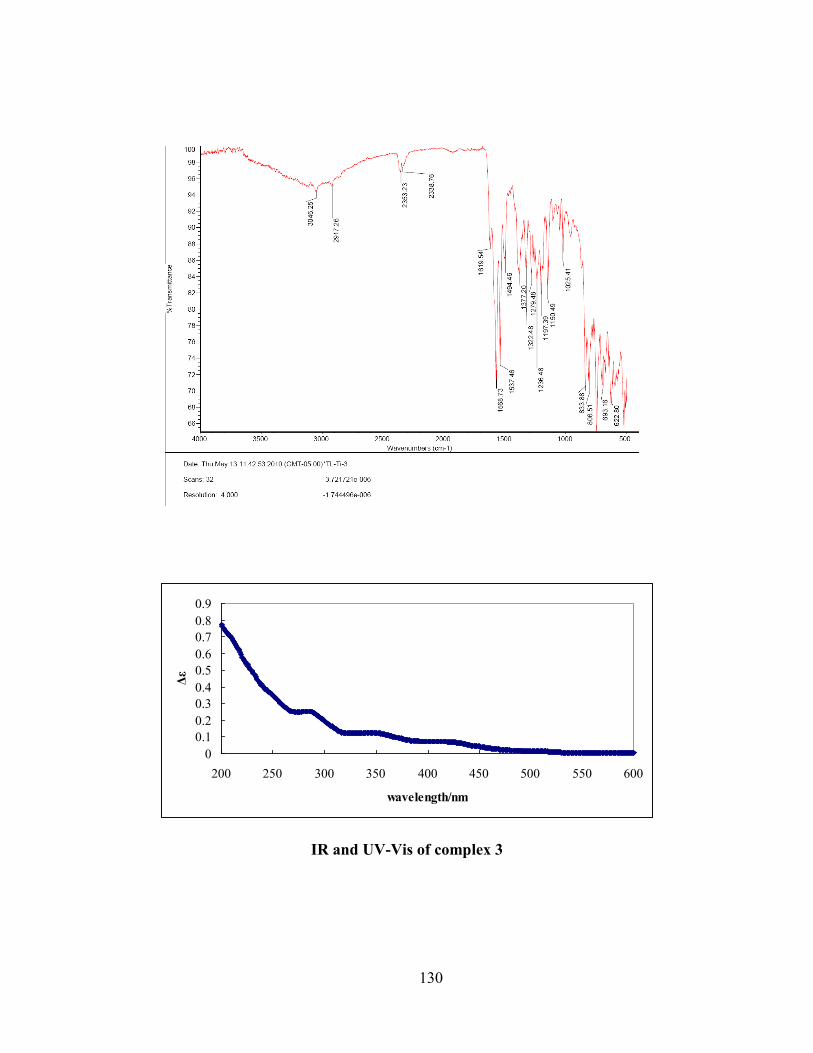
130
0
0.1
0.2
0.3
0.4
0.5
0.6
0.7
0.8
0.9
200 250 300 350 400 450 500 550 600
wavelength/nm
Δε
IR and UV-Vis of complex 3

131
0
0.1
0.2
0.3
0.4
0.5
0.6
0.7
0.8
200 250 300 350 400 450 500 550 600
wavelength/nm
Δε
IR and UV-Vis of complex 4

132
0
0.2
0.4
0.6
0.8
1
1.2
1.4
200 250 300 350 400 450 500 550 600
wavelength/nm
Δε
IR and UV-Vis of complex 5

133
0
0.1
0.2
0.3
0.4
0.5
0.6
0.7
200 250 300 350 400 450 500 550 600
wavelength/nm
Δε
IR and UV-Vis of complex 6

134
0
0.1
0.2
0.3
0.4
0.5
0.6
0.7
0.8
0.9
200 250 300 350 400 450 500 550 600
wavelength/nm
Δε
IR and UV-Vis of complex 7
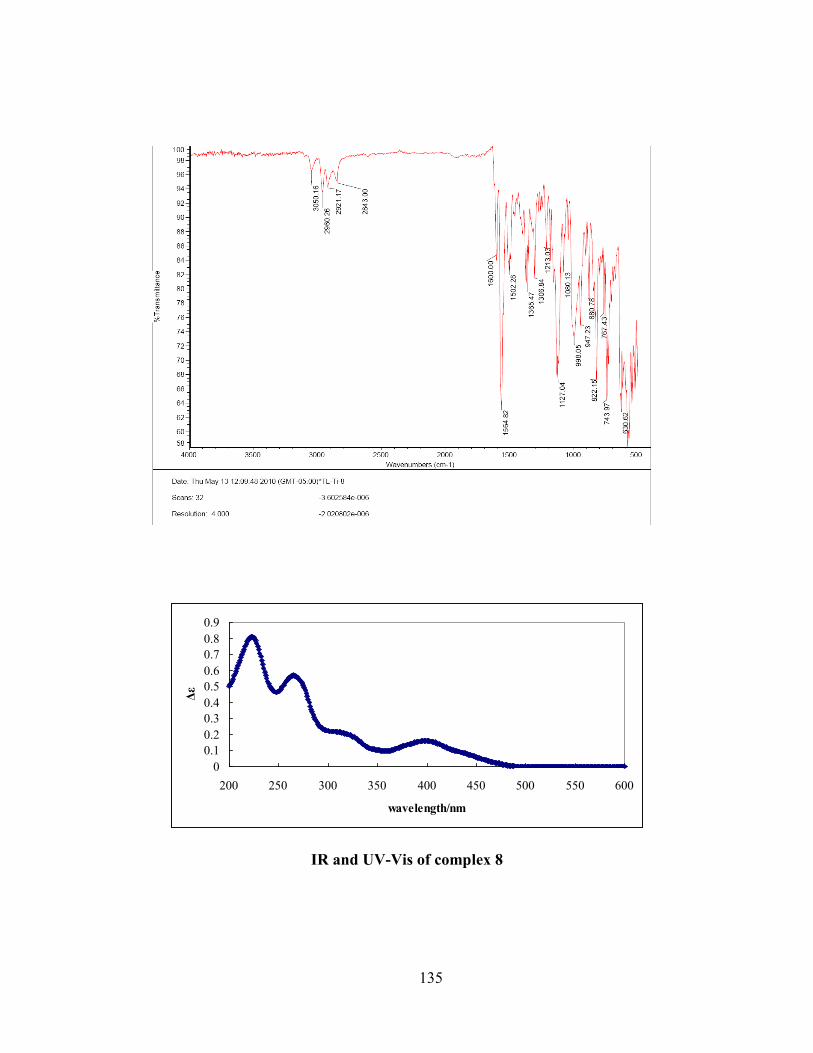
135
0
0.1
0.2
0.3
0.4
0.5
0.6
0.7
0.8
0.9
200 250 300 350 400 450 500 550 600
wavelength/nm
Δε
IR and UV-Vis of complex 8

136
0
0.5
1
1.5
2
2.5
3
200 300 400 500 600 700
wavelength/nm
Δε
-40
-30
-20
-10
0
10
20
30
40
200 250 300 350 400 450 500
wavelength/nm
Δε
IR, UV-Vis and CD of complex 9

137
-50
-40
-30
-20
-10
0
10
20
30
40
200 250 300 350 400 450 500
wavelength/nm
Δε
IR and CD of complex 10

138
-60
-40
-20
0
20
40
60
80
200 250 300 350 400 450 500
wavelength/nm
Δε/
M-1
cm
-1
IR and CD of complex 11

139
0
0.5
1
1.5
2
2.5
3
200 300 400 500 600 700
wavelength/nm
Δε
-30
-20
-10
0
10
20
30
200 250 300 350 400 450 500 550
wavelength/nm
Δε/
M-1
cm
-1
IR, UV-Vis and CD of complex 12

140
-60
-40
-20
0
20
40
60
200 250 300 350 400 450 500
wavelength/nm
Δε
IR and CD of complex 13

141
-80
-60
-40
-20
0
20
40
60
200 250 300 350 400 450 500
wavelength/nm
Δε
IR and CD of complex 14

142
0
0.5
1
1.5
2
2.5
3
200 300 400 500 600 700
wavelength/nm
Δε
UV-Vis of complex 15
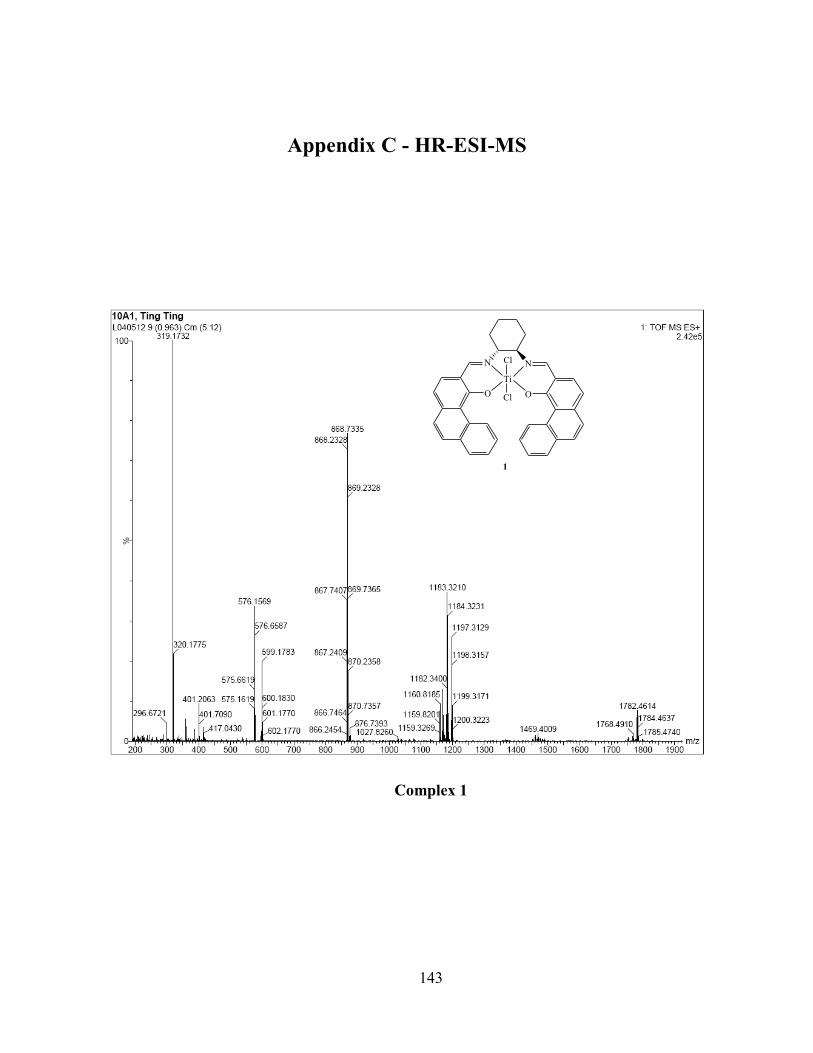
143
Appendix C - HR-ESI-MS
Complex 1
N
O
N
O
Ti
Cl
Cl
1

144
Complex 2
N
O
N
O
Ti
Cl
Cl
2
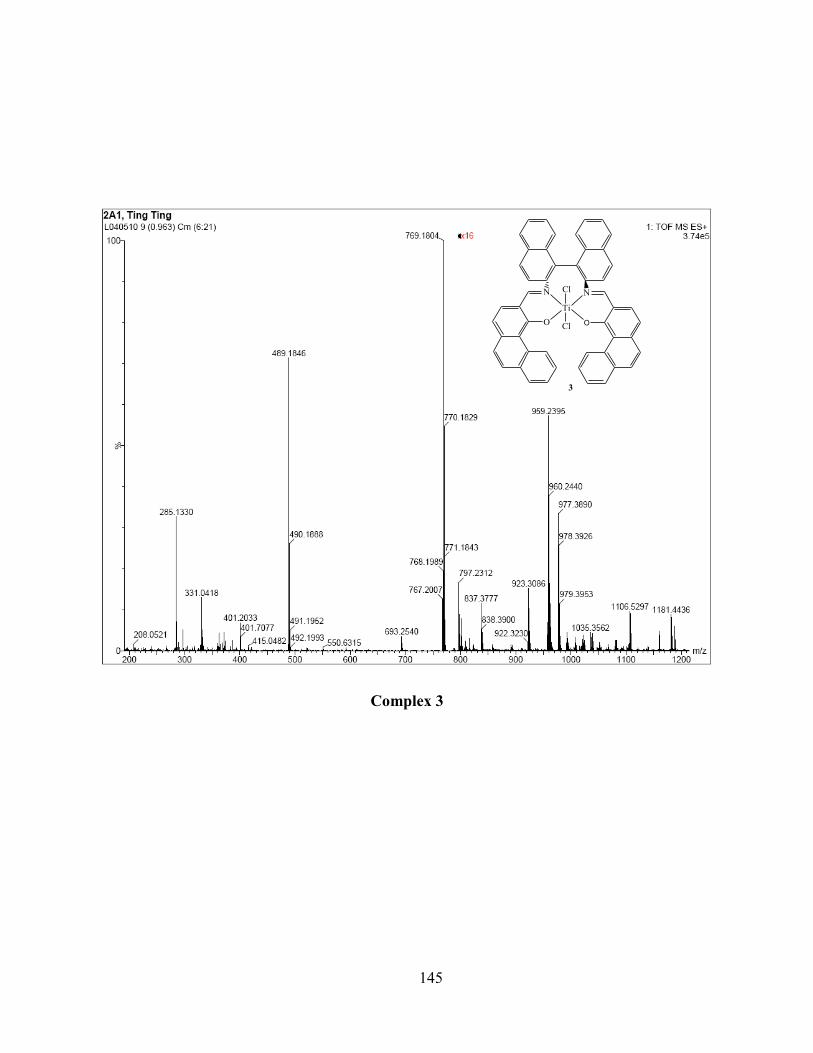
145
Complex 3
N
O
N
O
Ti
Cl
Cl
3

146
Complex 4
N
O
N
O
Ti
Cl
Cl
4
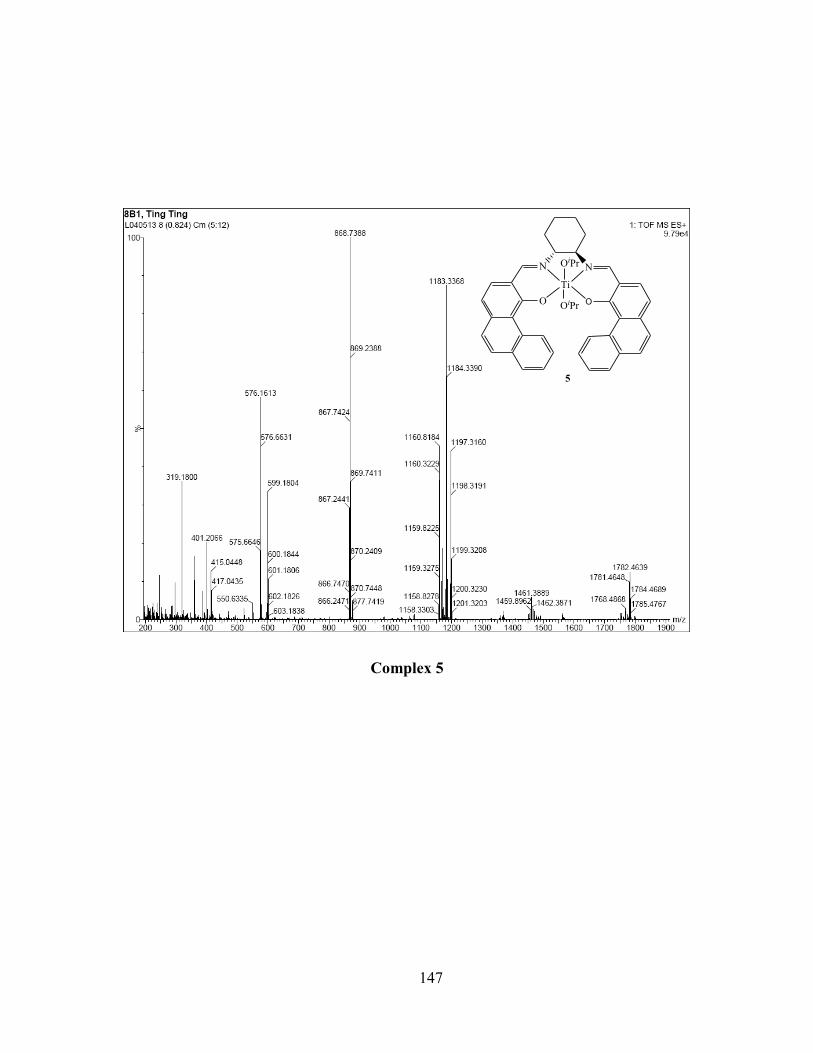
147
Complex 5
N
O
N
O
Ti
OiPr
OiPr
5

148
Complex 6
N
O
N
O
Ti
OiPr
OiPr
6
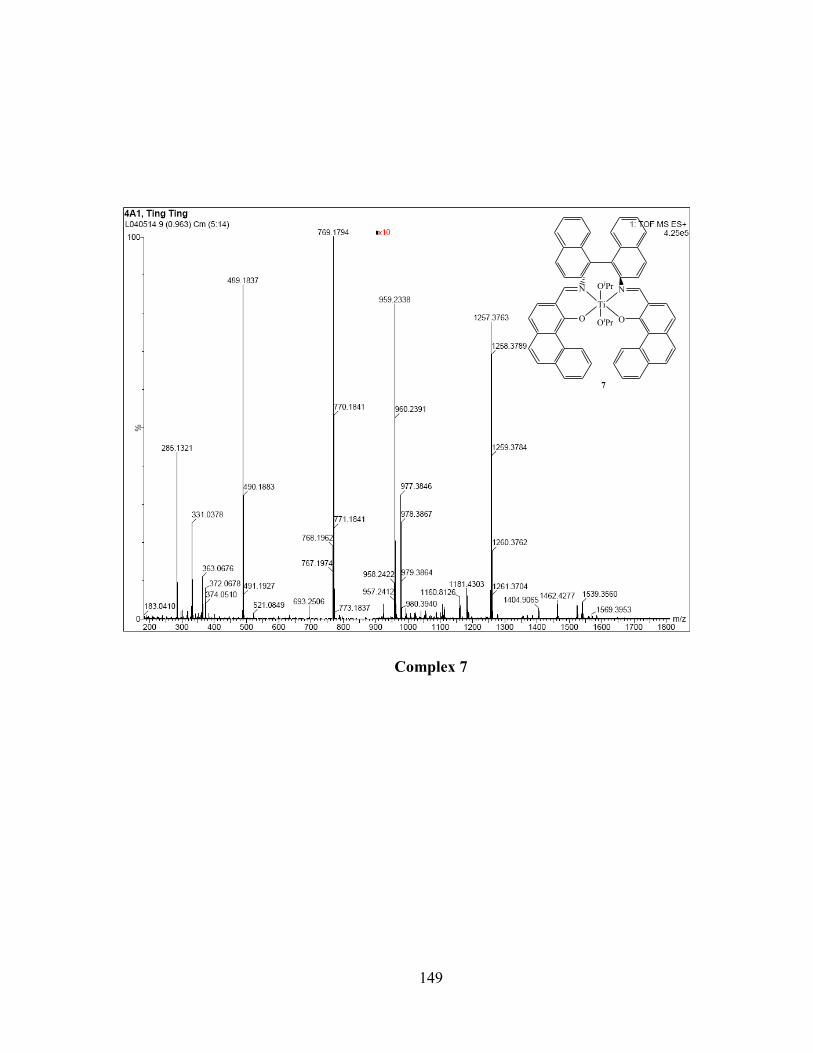
149
Complex 7
N
O
N
O
Ti
OiPr
OiPr
7

150
Complex 8
N
O
N
O
Ti
OiPr
OiPr
8

151
Complex 9
N
O
N
O
Mn
9
Cl

152
Complex 10
N
O
N
O
Mn
OAc
10

153
Complex 11
N
O
N
O
Mn
NO3
11
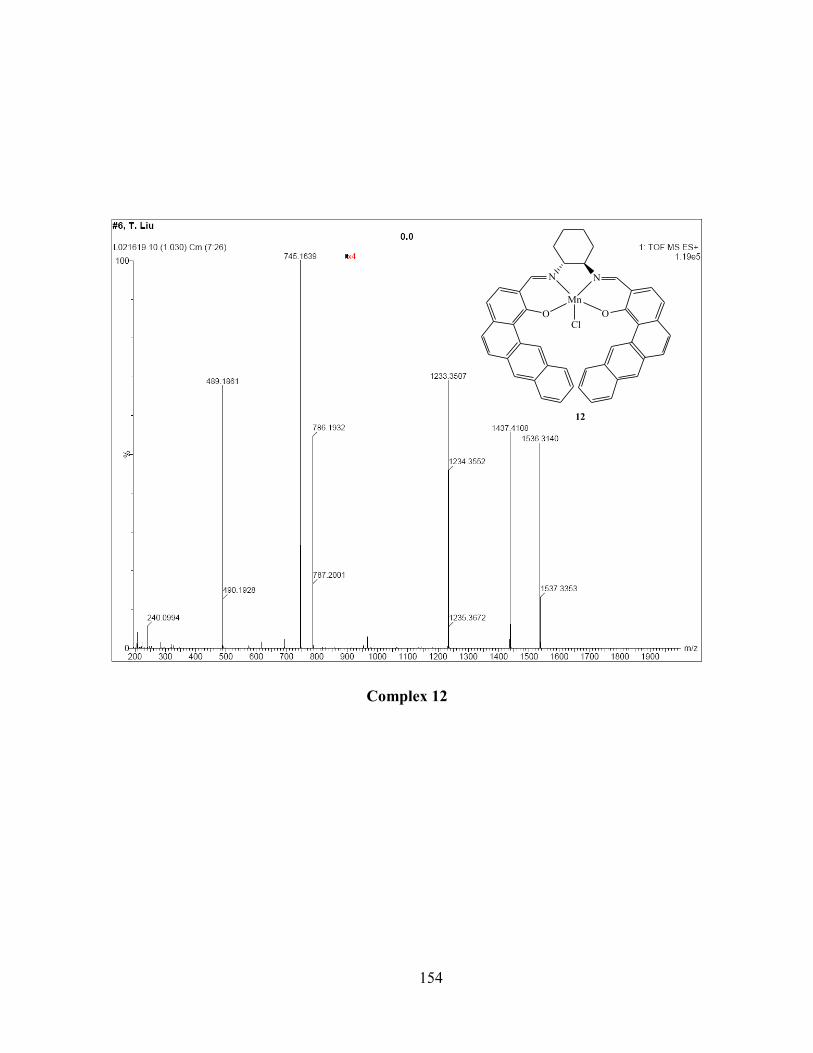
154
Complex 12
N
O
N
O
Mn
Cl
12

155
Complex 13
N
O
N
O
Mn
OAc
13

156
Complex 14
N
O
N
O
Mn
NO3
14

157
Complex 15
N
O
N
O
Mn
Cl
15

158
Appendix D - Crystal data
Table 1. Crystal data and structure refinement for complex 1 (tl0903m).
Identification code tl0903m
Empirical formula C75 H62 Cl8 N4 O5 Ti2
Formula weight 1478.69
Temperature 120(2) K
Wavelength 0.71073 Å
Crystal system Orthorhombic
Space group P2(1)2(1)2(1)
Unit cell dimensions a = 14.5966(7) Å = 90°.
b = 14.6674(8) Å = 90°.
c = 30.3466(15) Å = 90°.
Volume 6497.0(6) Å3
Z 4
Density (calculated) 1.512 g/cm3
Absorption coefficient 0.633 mm-1
F(000) 3040
Crystal size 0.30 x 0.24 x 0.14 mm3
Theta range for data collection 1.55 to 32.03°.
Index ranges -10<=h<=21, -16<=k<=21, -45<=l<=32
Reflections collected 45898
Independent reflections 19548 [R(int) = 0.0360]
Completeness to theta = 32.03° 99.2 %
Absorption correction Semi-empirical from equivalents
Max. and min. transmission 0.9166 and 0.8327
Refinement method Full-matrix least-squares on F2
Data / restraints / parameters 19548 / 45 / 869
Goodness-of-fit on F2 1.046
Final R indices [I>2sigma(I)] R1 = 0.0555, wR2 = 0.1320
R indices (all data) R1 = 0.0777, wR2 = 0.1472
Absolute structure parameter 0.05(2)
Largest diff. peak and hole 0.976 and -0.837 e.Å-3

159
Table 2. Crystal data and structure refinement for complex 3 (tl1001m).
Identification code tl1001m
Empirical formula C54 H40 Cl2 N2 O3 Ti
Formula weight 883.68
Temperature 120(2) K
Wavelength 0.71073 Å
Crystal system Monoclinic
Space group P2(1)
Unit cell dimensions a = 13.5996(9) Å = 90°.
b = 22.3064(16) Å = 98.469(4)°.
c = 14.2640(10) Å = 90°.
Volume 4279.9(5) Å3
Z 4
Density (calculated) 1.371 Mg/m3
Absorption coefficient 0.374 mm-1
F(000) 1832
Crystal size 0.22 x 0.14 x 0.08 mm3
Theta range for data collection 1.51 to 29.57°.
Index ranges -18<=h<=11, -30<=k<=28, -19<=l<=19
Reflections collected 42735
Independent reflections 18624 [R(int) = 0.1142]
Completeness to theta = 29.57° 97.9 %
Absorption correction Semi-empirical from equivalents
Max. and min. transmission 0.9707 and 0.9223
Refinement method Full-matrix least-squares on F2
Data / restraints / parameters 18624 / 1 / 1117
Goodness-of-fit on F2 0.956
Final R indices [I>2sigma(I)] R1 = 0.0841, wR2 = 0.1738
R indices (all data) R1 = 0.2031, wR2 = 0.2313
Absolute structure parameter 0.02(4)
Largest diff. peak and hole 0.594 and -0.681 e.Å-3

160
Table 3. Crystal data and structure refinement for complex 6 (tl1004m).
Identification code tl1004m
Empirical formula C90 H64 Cl4 N4 O6 Ti2
Formula weight 1535.05
Temperature 120(2) K
Wavelength 0.71073 Å
Crystal system Orthorhombic
Space group P2(1)2(1)2(1)
Unit cell dimensions a = 11.602(3) Å = 90°.
b = 22.055(5) Å = 90°.
c = 28.245(8) Å = 90°.
Volume 7227(3) Å3
Z 4
Density (calculated) 1.411 g/cm3
Absorption coefficient 0.431 mm-1
F(000) 3168
Crystal size 0.28 x 0.14 x 0.06 mm3
Theta range for data collection 1.90 to 27.88°.
Index ranges -7<=h<=15, -29<=k<=22, -35<=l<=37
Reflections collected 41031
Independent reflections 9342 [R(int) = 0.2707]
Completeness to theta = 27.88° 99.2 %
Absorption correction Semi-empirical from equivalents
Max. and min. transmission 0.9746 and 0.8889
Refinement method Full-matrix least-squares on F2
Data / restraints / parameters 9342 / 369 / 936
Goodness-of-fit on F2 1.140
Final R indices [I>2sigma(I)] R1 = 0.1194, wR2 = 0.2278
R indices (all data) R1 = 0.2792, wR2 = 0.2867
Absolute structure parameter 0.44(7)
Largest diff. peak and hole 0.937 and -0.800 e.Å-3

161
Table 4. Crystal data and structure refinement for complex 7 (tl1002m).
Identification code tl1002m
Empirical formula C51 H32 Cl2 N2 O3 Ti
Formula weight 839.59
Temperature 120(2) K
Wavelength 0.71073 Å
Crystal system Orthorhombic
Space group P2(1)2(1)2
Unit cell dimensions a = 17.1580(16) Å = 90°.
b = 17.5684(17) Å = 90°.
c = 13.2935(11) Å = 90°.
Volume 4007.2(6) Å3
Z 4
Density (calculated) 1.392 g/cm3
Absorption coefficient 0.395 mm-1
F(000) 1728
Crystal size 0.26 x 0.20 x 0.14 mm3
Theta range for data collection 1.53 to 30.03°.
Index ranges -14<=h<=24, -24<=k<=19, -18<=l<=18
Reflections collected 25151
Independent reflections 11131 [R(int) = 0.0688]
Completeness to theta = 30.03° 99.8 %
Absorption correction Semi-empirical from equivalents
Max. and min. transmission 0.9467 and 0.9042
Refinement method Full-matrix least-squares on F2
Data / restraints / parameters 11131 / 0 / 424
Goodness-of-fit on F2 1.554
Final R indices [I>2sigma(I)] R1 = 0.1055, wR2 = 0.2678
R indices (all data) R1 = 0.1459, wR2 = 0.2820
Absolute structure parameter 0.18(5)
Largest diff. peak and hole 1.103 and -0.952 e.Å-3

162
Table 5. Crystal data and structure refinement for complex 10 grown in N2 (tl0802).
Identification code tl0802m
Empirical formula C80 H74 Cl4 Mn2 N4 O7
Formula weight 1455.11
Temperature 120(2) K
Wavelength 0.71073 Å
Crystal system Orthorhombic
Space group P2(1)2(1)2(1)
Unit cell dimensions a = 15.9291(6) Å = 90°.
b = 19.5228(7) Å = 90°.
c = 21.8734(9) Å = 90°.
Volume 6802.2(5) Å3
Z 4
Density (calculated) 1.421 g/cm3
Absorption coefficient 0.589 mm-1
F(000) 3024
Crystal size 0.30 x 0.25 x 0.15 mm3
Theta range for data collection 1.86 to 34.97°.
Index ranges -21<=h<=25, -26<=k<=30, -33<=l<=35
Reflections collected 81345
Independent reflections 28405 [R(int) = 0.0298]
Completeness to theta = 34.97° 99.2 %
Absorption correction None
Max. and min. transmission 0.9168 and 0.8430
Refinement method Full-matrix least-squares on F2
Data / restraints / parameters 28405 / 0 / 849
Goodness-of-fit on F2 1.054
Final R indices [I>2sigma(I)] R1 = 0.0486, wR2 = 0.1274
R indices (all data) R1 = 0.0672, wR2 = 0.1384
Absolute structure parameter -0.006(9)
Largest diff. peak and hole 1.024 and -0.953 e.Å-3
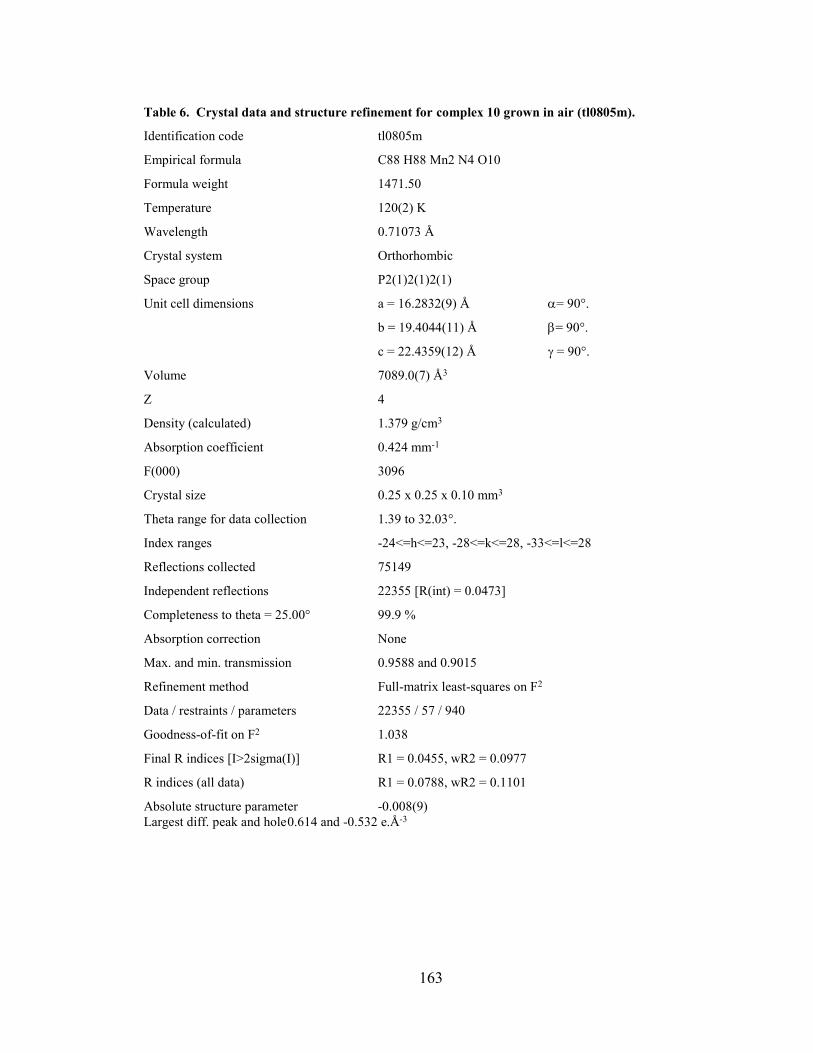
163
Table 6. Crystal data and structure refinement for complex 10 grown in air (tl0805m).
Identification code tl0805m
Empirical formula C88 H88 Mn2 N4 O10
Formula weight 1471.50
Temperature 120(2) K
Wavelength 0.71073 Å
Crystal system Orthorhombic
Space group P2(1)2(1)2(1)
Unit cell dimensions a = 16.2832(9) Å = 90°.
b = 19.4044(11) Å = 90°.
c = 22.4359(12) Å = 90°.
Volume 7089.0(7) Å3
Z 4
Density (calculated) 1.379 g/cm3
Absorption coefficient 0.424 mm-1
F(000) 3096
Crystal size 0.25 x 0.25 x 0.10 mm3
Theta range for data collection 1.39 to 32.03°.
Index ranges -24<=h<=23, -28<=k<=28, -33<=l<=28
Reflections collected 75149
Independent reflections 22355 [R(int) = 0.0473]
Completeness to theta = 25.00° 99.9 %
Absorption correction None
Max. and min. transmission 0.9588 and 0.9015
Refinement method Full-matrix least-squares on F2
Data / restraints / parameters 22355 / 57 / 940
Goodness-of-fit on F2 1.038
Final R indices [I>2sigma(I)] R1 = 0.0455, wR2 = 0.0977
R indices (all data) R1 = 0.0788, wR2 = 0.1101
Absolute structure parameter -0.008(9)
Largest diff. peak and hole 0.614 and -0.532 e.Å-3

164
Table 7. Crystal data and structure refinement for complex 11 (tl0902m).
Identification code tl0902m
Empirical formula C76 H64 Cl8 Mn2 N4 O6
Formula weight 1522.79
Temperature 120(2) K
Wavelength 0.71073 Å
Crystal system Orthorhombic
Space group P2(1)2(1)2(1)
Unit cell dimensions a = 15.6830(13) Å = 90°.
b = 19.5846(16) Å = 90°.
c = 21.8586(19) Å = 90°.
Volume 6713.8(10) Å3
Z 4
Density (calculated) 1.507 g/cm3
Absorption coefficient 0.754 mm-1
F(000) 3128
Crystal size 0.24 x 0.12 x 0.06 mm3
Theta range for data collection 1.86 to 32.03°.
Index ranges -23<=h<=22, -20<=k<=29, -16<=l<=32
Reflections collected 55121
Independent reflections 21993 [R(int) = 0.0687]
Completeness to theta = 32.03° 98.2 %
Absorption correction None
Max. and min. transmission 0.9562 and 0.8398
Refinement method Full-matrix least-squares on F2
Data / restraints / parameters 21993 / 45 / 880
Goodness-of-fit on F2 1.007
Final R indices [I>2sigma(I)] R1 = 0.0642, wR2 = 0.1541
R indices (all data) R1 = 0.1118, wR2 = 0.1794
Absolute structure parameter -0.001(16)
Largest diff. peak and hole 1.174 and -0.861 e.Å-3
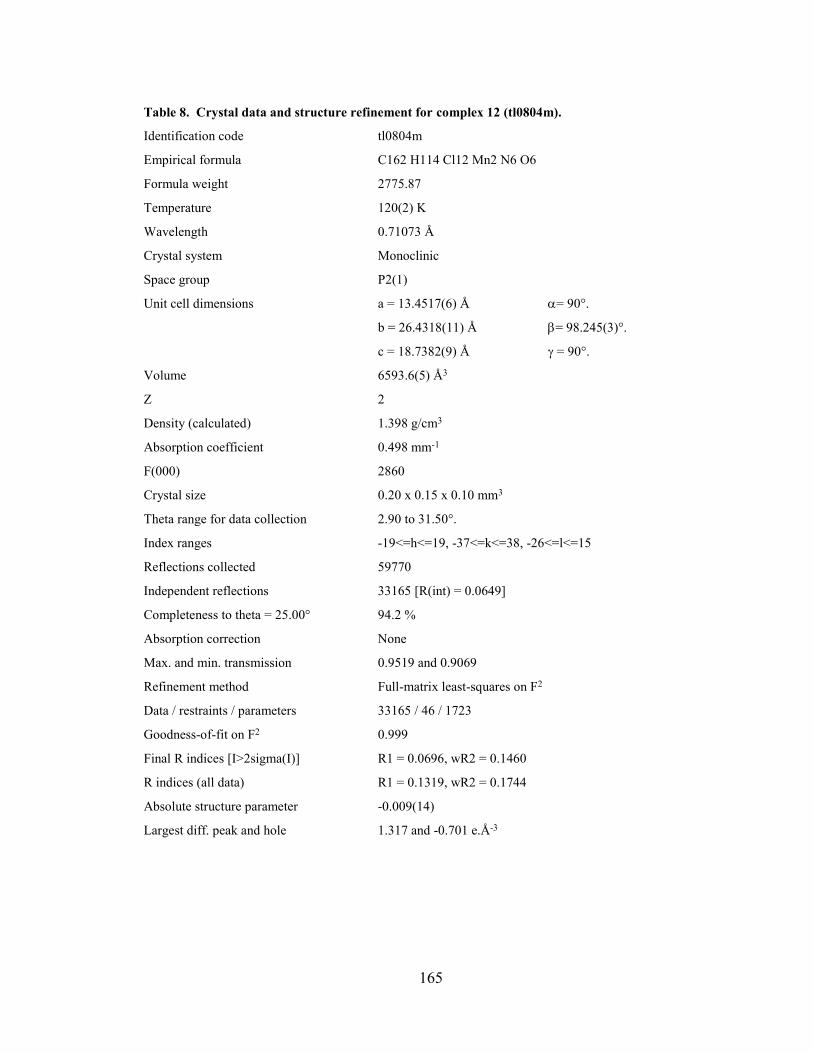
165
Table 8. Crystal data and structure refinement for complex 12 (tl0804m).
Identification code tl0804m
Empirical formula C162 H114 Cl12 Mn2 N6 O6
Formula weight 2775.87
Temperature 120(2) K
Wavelength 0.71073 Å
Crystal system Monoclinic
Space group P2(1)
Unit cell dimensions a = 13.4517(6) Å = 90°.
b = 26.4318(11) Å = 98.245(3)°.
c = 18.7382(9) Å = 90°.
Volume 6593.6(5) Å3
Z 2
Density (calculated) 1.398 g/cm3
Absorption coefficient 0.498 mm-1
F(000) 2860
Crystal size 0.20 x 0.15 x 0.10 mm3
Theta range for data collection 2.90 to 31.50°.
Index ranges -19<=h<=19, -37<=k<=38, -26<=l<=15
Reflections collected 59770
Independent reflections 33165 [R(int) = 0.0649]
Completeness to theta = 25.00° 94.2 %
Absorption correction None
Max. and min. transmission 0.9519 and 0.9069
Refinement method Full-matrix least-squares on F2
Data / restraints / parameters 33165 / 46 / 1723
Goodness-of-fit on F2 0.999
Final R indices [I>2sigma(I)] R1 = 0.0696, wR2 = 0.1460
R indices (all data) R1 = 0.1319, wR2 = 0.1744
Absolute structure parameter -0.009(14)
Largest diff. peak and hole 1.317 and -0.701 e.Å-3

166
Table 9. Crystal data and structure refinement for complex 15 (tl0901m).
Identification code tl0901m
Empirical formula C118 H94 Mn2 N4 O6
Formula weight 1773.85
Temperature 120(2) K
Wavelength 0.71073 Å
Crystal system Orthorhombic
Space group P2(1)2(1)2(1)
Unit cell dimensions a = 15.0530(7) Å = 90°.
b = 16.0863(7) Å = 90°.
c = 36.6821(16) Å = 90°.
Volume 8882.5(7) Å3
Z 4
Density (calculated) 1.326 Mg/m3
Absorption coefficient 0.348 mm-1
F(000) 3712
Crystal size 0.25 x 0.20 x 0.15 mm3
Theta range for data collection 1.38 to 31.51°.
Index ranges -20<=h<=19, -22<=k<=23, -53<=l<=52
Reflections collected 82634
Independent reflections 27947 [R(int) = 0.0528]
Completeness to theta = 31.51° 96.1 %
Absorption correction None
Max. and min. transmission 0.9496 and 0.9180
Refinement method Full-matrix least-squares on F2
Data / restraints / parameters 27947 / 0 / 1132
Goodness-of-fit on F2 1.052
Final R indices [I>2sigma(I)] R1 = 0.0479, wR2 = 0.1000
R indices (all data) R1 = 0.0695, wR2 = 0.1094
Absolute structure parameter -0.013(8)
Largest diff. peak and hole 0.410 and -0.369 e.Å-3