Embed Size (px)
Citation preview

1
B.C. JOURNAL OF ECOSYSTEMS AND MANAGEMENT
Volume 1, Number 1, 2001http://www.siferp.org/jem/2001/vol1/no1/art5.pdf
SplechtnaHeight growth and site index models for Pacific
silver fir in southwestern British Columbia
Height growth and site indexmodels for Pacific silver fir insouthwestern British Columbia
AbstractFollowing an exploratory examination of the variation in the height growth pattern using a single-valued ratio, conventional polymorphic and climate-specific height growth and site index modelswere developed for Pacific silver fir (Abies amabilis [Dougl. ex Loud.] Forbes). The models weredeveloped from stem analysis data obtained from 67 study plots, which were located over theentire elevation-continentality range of the species in southern coastal British Columbia. Whentested against an independent data set consisting of 31 plots, the climate-specific models improvedheight and site index prediction compared to the conventional polymorphic models. The previ-ously available model for Pacific silver fir was biased. It overestimated height before, and underes-timated it beyond, the index age. It also underestimated height on low-productivity sites and over-estimated it on high-productivity sites. In consequence, when this model was used to estimate siteindex from top-height and breast-height age, it underestimated site index before, and overestimatedit beyond, the index age. Similarly, site index was overestimated on low-productivity sites andunderestimated on high-productivity sites. The climate-specific models developed in this study arerecommended for height and site index estimation of Pacific silver fir stands within a range ofbreast-height age from 15 to 160 years in southern coastal British Columbia.
Contact Information
1 Institute of Forest Ecology, BOKU University, Peter Jordan Strasse 82, A-1190 Vienna, AustriaE-mail: [email protected]
Bernhard Erich Splechtna1
B.C. Journal of Ecosystems and ManagementResearch ReportResearch ReportResearch ReportResearch ReportResearch Report
© Southern Interior Forest Extensionand Research Partnership
2
B.C. JOURNAL OF ECOSYSTEMS AND MANAGEMENT
Volume 1, Number 1, 2001http://www.siferp.org/jem/2001/vol1/no1/art5.pdf
SplechtnaHeight growth and site index models for Pacific
silver fir in southwestern British Columbia
IntroductionAccurate estimates of forest productivity are neededfor sustainable forest management in order todetermine annual allowable cut and rotation period,and to make tree species selection decisions. Asharvesting progresses increasingly into high-elevation forests, growth and yield information forthese forests is urgently needed to accommodateforestry decision making.
Despite climatically unfavourable conditions,high timber volumes have accumulated in thehigh-elevation old-growth coastal forest of BritishColumbia over several centuries. However, the timeneeded to produce economically feasible and eco-logically sustainable second-growth timber crops isunknown. Existing growth and yield information forthese forests is limited to investigations of earlygrowth performance (Arnott et al. 1995) or todifferent geographic areas (Hoyer and Herman1989; Murray et al. 1991).
Notwithstanding recognized limitations (e.g.,Monserud 1984a), site index (top height at referenceage 50 years at breast height) is the most commonlyused index of forest productivity in North America.Together with height growth models, site index iswidely used in models designed to estimate forest-and stand-level yields (e.g., Mitchell 1975; Wykoffand Monserud 1987; Pretzsch 1994; Sterba 1995).Accurate estimates for site index and height dependon how well the models estimate the height growthpattern (i.e., the trajectory of height over age) of thetop-height trees of a stand. However, height growthpatterns vary with site (e.g., Carmean 1956, 1972;Assmann 1970; Beck 1971; Marschall 1976).
To account for differences in height growthpattern with site, height growth is commonly mod-elled by polymorphic functions. These functionsallow different shapes of height growth curves foreach site index (e.g., Curtis 1964; Heger 1968; Beck1971; Carmean 1972; Curtis et al. 1974a; Alemdag1991; Thrower and Goudie 1992; Chen et al. 1998).This approach assumes that the same height growthpattern will be followed regardless of which factorslead to a certain level of height growth (site indexclass). However, some studies found different heightgrowth patterns for the same site-index class of thesame tree species (e.g., Monserud 1984b; Klinka etal. 1996). Hence, site factors were incorporated intopolymorphic models to make them site-specific
(e.g., Monserud 1984b; Milner 1988). Such site-specific models showed increased precision com-pared to conventional polymorphic models(Monserud 1984b; Vander Ploeg and Moore 1989),and indicated that height growth patterns variedwith climate, soils, or genetics (Monserud 1984b;Monserud and Rehfeldt 1990; Wang et al. 1994). Incontrast, some authors concluded that conventionalpolymorphic curves described height growth pat-terns sufficiently (e.g., Beck 1971; Carmean 1972;Alemdag 1991). Therefore, a decision on whether ornot to develop and use site-specific curves must bebased on:
• the observed differences in height growthpattern,
• the improved performance of site-specificmodels compared to conventional polymorphicmodels, and
• the desired level of precision.
. . .[this research] develops accurateheight growth and site index models
for Pacific silver fir in coastal southernBritish Columbia and . . . evaluates
the improvement of height and site index estimates over the currently
used model.
Pacific silver fir (Abies amabilis [Dougl. ex Loud.]Forbes) is a major component of the high-elevationcoastal forests together with mountain hemlock(Tsuga mertensiana [Bong.] Carr.) and yellow-cedar(Chamaecyparis nootkatensis [D. Don in Lamb.]Spach). In contrast to the latter two species, Pacificsilver fir also occurs on low-elevation sites. Theheight growth curves that have been used in BritishColumbia for both height and site index estimationof Pacific silver fir were developed from low-elevation data (191 sectioned trees) on VancouverIsland (Kurucz 1982). Since the height growthpattern may be significantly different between low-and high-elevation sites, the validity of these curvesfor low site-index classes (15 and below) is uncer-tain. The only existing curves developed for high-elevation sites are from a different (warmer) climatic
3
B.C. JOURNAL OF ECOSYSTEMS AND MANAGEMENT
Volume 1, Number 1, 2001http://www.siferp.org/jem/2001/vol1/no1/art5.pdf
SplechtnaHeight growth and site index models for Pacific
silver fir in southwestern British Columbia
region in the Washington and Oregon Cascades,and are based on data from only 40 sectioned trees(Hoyer and Herman 1989). Considering the smallsample size, it is uncertain whether the data re-flected the “true” variability of Pacific silver firheight growth pattern. Moreover, the validity ofthese curves for British Columbia is questionable asmany studies have shown that the transferability ofcurves of the same species from one region toanother is limited (e.g., Marschall 1976; Monserud1985; Thrower and Goudie 1992; Chen et al. 1998).
The objectives of this study were to developaccurate height growth and site index models forPacific silver fir in coastal southern British Columbiaand to evaluate the improvement of height and siteindex estimates over the currently used model. Toachieve these objectives, I:
• examined the changes in height growth patternwith soil and climate,
• developed conventional polymorphic modelsand site-specific models according to exploratoryheight growth pattern analysis, and
• compared performance of site-specific models toconventional polymorphic models and thecurrently used model using a set of independentdata.
Materials and MethodsSampling
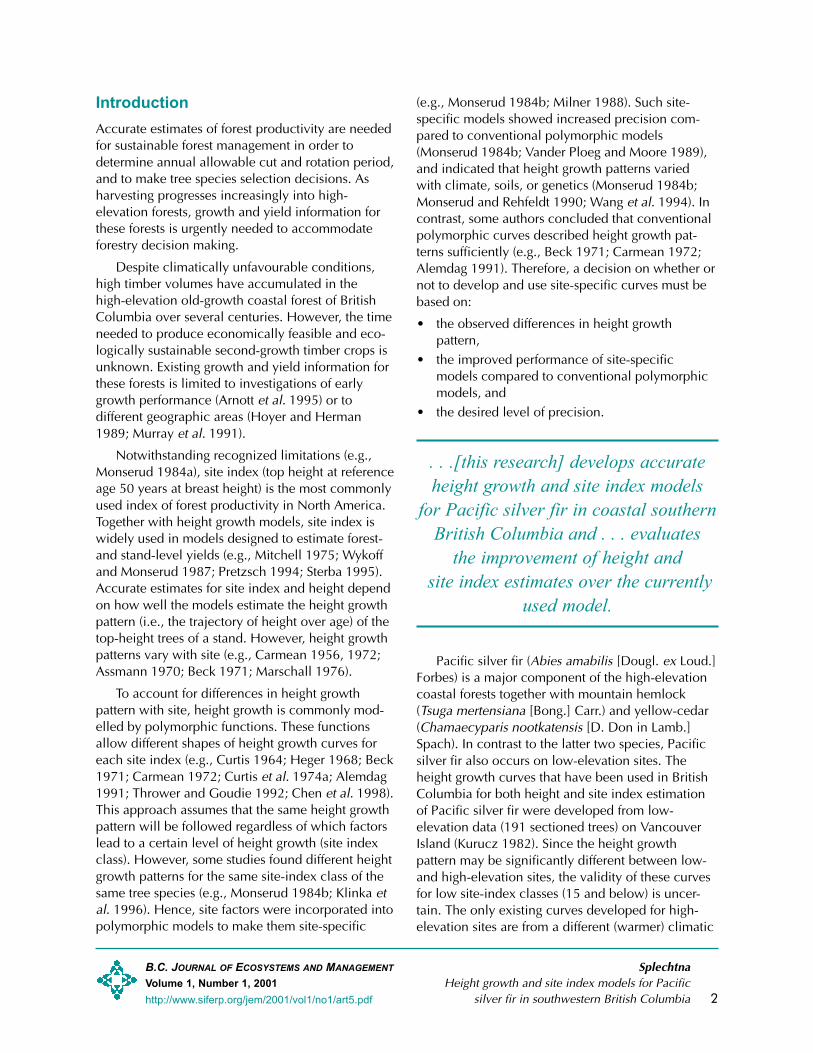
The study area was restricted to the southern portionof the coastal forest south of the Port McNeill–Lillooett line (50o30'N) and west of Boston Bar(121o20'W), and included the entire native range ofPacific silver fir in southwestern British Columbia(Figure 1). Within the study area, the Insular andCoast Mountains extend in a north–south direction.These mountain ranges create an effective barrier toair movement between coastal and interior sites.Therefore, both a temperature gradient (with eleva-tion) and a relatively steep continentality gradient(measured as difference between summer and wintertemperature) exist (Klinka et al. 1989; Klinka et al.1991; Nuszdorfer and Boettger 1994). Within the
FIGURE 1. Continentality strata in the study area and general locations of study plots (dots represent location ofmore than one plot).

4
B.C. JOURNAL OF ECOSYSTEMS AND MANAGEMENT
Volume 1, Number 1, 2001http://www.siferp.org/jem/2001/vol1/no1/art5.pdf
SplechtnaHeight growth and site index models for Pacific
silver fir in southwestern British Columbia
study area, Pacific silver fir extends from sea level toalmost timber line, and from the hypermaritimeregion on the west coast of Vancouver Island to thesubcontinental region on the leeward side of theCoast Mountains (Krajina 1969; Brooke et al. 1970;Klinka et al. 1989). Climatic differences associatedwith continentality are evident; for example, Pacificsilver fir does not grow below 800 m on subconti-nental sites of the study area, but occurs at sea levelon hypermaritime sites.
Study stands were located in four continentalitystrata following the biogeoclimatic ecosystemclassification system (Krajina 1965; Pojar et al. 1987)given in Klinka et al. (1989). However, in addition tosubcontinental (SC), submaritime (SM), and maritime(M) strata, a fourth stratum (maritime leeward: ML)was defined. Located on the leeward side of theInsular Mountains, the ML stratum is characterizedby warmer and drier summers than other maritimeareas (Figure 1). Consequently, the maritime (M)stratum was designated as the maritime-windward(MW) stratum.
All study stands were naturally regenerated,unmanaged, fully stocked, relatively even-aged(ranging in age from 40 to about 300 years at breastheight), and did not have a history of damage. Theywere distributed over a wide range of climaticconditions (measured by continentality stratum,elevation, and aspect) and soil moisture and nutrientconditions. The selected stands had an unknown,but obvious, history of stand-initiating disturbanceby fire, wind, avalanche, or less frequently by timberharvesting. I assumed that the selected stands hadgrown under full light conditions except in theearliest stages, when competing vegetation or deepsnow cover might have influenced tree growth.Many candidate stands were rejected from thesample because increment cores taken at breastheight from dominant trees suggested suppressionbeyond breast height age. Despite these difficulties,123 sample plots were established.
After randomly locating a sample plot of 0.04 hain each stand, soil moisture regime (SMR) and soilnutrient regime (SNR) were estimated using acombination of topographic and soil morphologicalproperties, as well as understorey vegetation (Greenand Klinka 1994). Elevation was measured using aThommen pocket altimeter, slope using a clinom-eter, and aspect using a compass. In each sample
plot, the three largest diameter Pacific silver fir treeswithout observable damage were felled. Total heightand length of the live crown were measured for eachsample tree. Stem discs were cut at 30, 80, 130 cmabove the ground, and then equally spaced discs at100-cm intervals were taken to the top of each tree.
Data Analysis
Carmean’s (1972) formula (see Dyer and Bailey1987) was used to estimate the ”true” tree heightcorresponding to the ring counts at the crosscuts.Height-over-age plots of every sampled tree werevisually examined for patterns of suppression andrelease and growth anomalies beyond breast-heightage. Suppressed trees were deleted from the analy-sis, and only the sample plots with two or three sitetrees were kept in the database. Consequently, 25sample plots were deleted from the data set leavingdata from 98 plots for model construction andtesting (Table 1). The relatively high number ofrejected plots emphasize that shade-tolerant Pacificsilver fir is a very difficult species for site indexestimation (Curtis et al. 1974a). Slight suppression,especially when subsequent release was gradual,was not always recognized when trees were coredbefore felling, but became apparent on height-over-age plots. The effect of a deep snowpack on theearly growth of Pacific silver fir located on high-elevation sites added to the difficulties in distinguish-ing true suppression. I considered snow as a sitefactor, and retained a few plots where site treesshowed release above breast height in the database.This was done only when:
• a deep and long-lasting snowpack was evident inthe area (inferred from topography, height ofepiphytic lichens, and observations of snowpackin late spring),
• a similar height growth pattern was observed inall site trees within the same plot, and
• similar stands in the same area showed a similarheight growth pattern.
For every site tree, I obtained a record of heightsat 5-year breast-height-age intervals by linearlyinterpolating between the height and age pairs thatresulted from Carmean’s formula. Average plotcurves were computed as the arithmetic mean ofthese values. This provided height versus age data at5-year intervals starting from age 5 years for eachplot, and site index values for each plot as the

5
B.C. JOURNAL OF ECOSYSTEMS AND MANAGEMENT
Volume 1, Number 1, 2001http://www.siferp.org/jem/2001/vol1/no1/art5.pdf
SplechtnaHeight growth and site index models for Pacific
silver fir in southwestern British Columbia
corresponding height at breast-height-age 50. Asingle, quantitative measure of height growth patternfor each plot was calculated as the ratio (z-ratio)between heights at breast height age 60 and 30(Hoyer and Chawes 1980). This ratio was proposedby Zeide (1978) and has been used in numerousstudies to characterize curve shape (Hoyer andChawes 1980; Milner 1988; Wang et al. 1994). Iused the z-ratio in an exploratory analysis to identifysite factors that were related to height growthpatterns. As not all trees had reached 60 years breastheight age, the data set used contained data from43 plots. Linear models were used to test the effectof climate (measured by elevation and continentalitystratum) and edatope (any given combination of soilmoisture regime and soil nutrient regime) on heightgrowth pattern.
The height growth data beyond 100 years atbreast height age were mainly from medium- andlow-productivity, high-elevation plots. To achieve amore balanced sample distribution, I included onlydata up to 100 years of breast height age in the dataset used to calibrate the height and site indexmodels. This was a compromise between a com-pletely balanced distribution and the desired rangeof data. Since validation of height and site indexmodels is preferably done by using an independent
data set (Marshall and Northway 1993; Nigh and Sit1996), 31 plots were set aside as a test data set and67 plots were used for model calibration (Table 1).
To find the most suitable function for estimatingheight growth, the three main types of functionscommonly used to describe height growth of treeswere fitted to the calibration data. These functions are:
• a conditioned logistic function (Thrower andGoudie 1992; Wang and Klinka 1995; Chen etal. 1998),
• a Chapman-Richards’ function (Payandeh 1974;Carmean and Lenthall 1989; Thrower andGoudie 1992; Chen et al. 1998), and
• a conditioned Weibull function (Payandeh andWang 1995).
Since two different least square problems aresolved for height growth and site index models(Curtis et al. 1974b), two separate polymorphicmodels were fitted for estimating the height growthand site index of Pacific silver fir, respectively. Whenfitting the site index models, the data points associ-ated with ages 5 and 10 were excluded because astrong relationship between top height and site indexbefore breast height age 15 was not expected(Carmean and Lenthall 1989; Thrower and Goudie1992). All non-linear models were fitted using the
TABLE 1. General statistics for study plots according to the calibration, test, and all plots
Breast height age Top height Site index at 50 years(years) (m) (m)
Calibration dataN 67 67 67Minimum 37 7.7 4.8Mean 92 23.7 17.6Maximum 312 55.0 36.7Std. Deviation 51 8.6 7.9
Test dataN 31 31 31Minimum 36 8.9 4.6Mean 82 22.0 18.2Maximum 173 32.3 36.4Std. Deviation 38 5.1 8.4
All dataN 98 98 98Minimum 36 7.7 4.6Mean 89 23.1 17.8Maximum 312 55.0 36.7Std. Deviation 48 7.7 8.0
6
B.C. JOURNAL OF ECOSYSTEMS AND MANAGEMENT
Volume 1, Number 1, 2001http://www.siferp.org/jem/2001/vol1/no1/art5.pdf
SplechtnaHeight growth and site index models for Pacific
silver fir in southwestern British Columbia
least square Marquart-Levenberg procedure of theSPSS™ program (SPSS Inc. 1993). The best polymor-phic model was chosen based on fitting statistics (R2
and MSE) and bias. Results from the height growthpattern analysis and the best height growth and siteindex model, were used to develop climate-specificheight growth curves.
Three criteria were used to compare perform-ance of polymorphic models to climate-specificmodels and currently used models: precision, bias,and potential for extrapolation beyond the calibra-tion range. Precision was evaluated by the predictedmean squared error (PMSE); bias and extrapolationpotential were assessed by examining residual plotsby age and site index. The common procedure fortesting site index models is to use every known pairof height and age to estimate site index; this isanalogous to the procedure used for height models(e.g., Thrower and Goudie 1992; Chen et al. 1998).However, I decided to use only the originallymeasured top height of the trees at the time ofsampling. This approach yields only one estimateper plot and eliminates the known problems causedby autocorrelation (Monserud 1984b; Nigh and Sit1996). As this approach is closest to their applica-tion, I considered this to be the ultimate test for siteindex models, providing that a wide range in topheight and age test data exists. In addition to thegraphical examination of residuals, paired t-testswere used to detect significant differences betweenpredicted and measured site indices.
ResultsExamination of the Variationin Height Growth Patterns
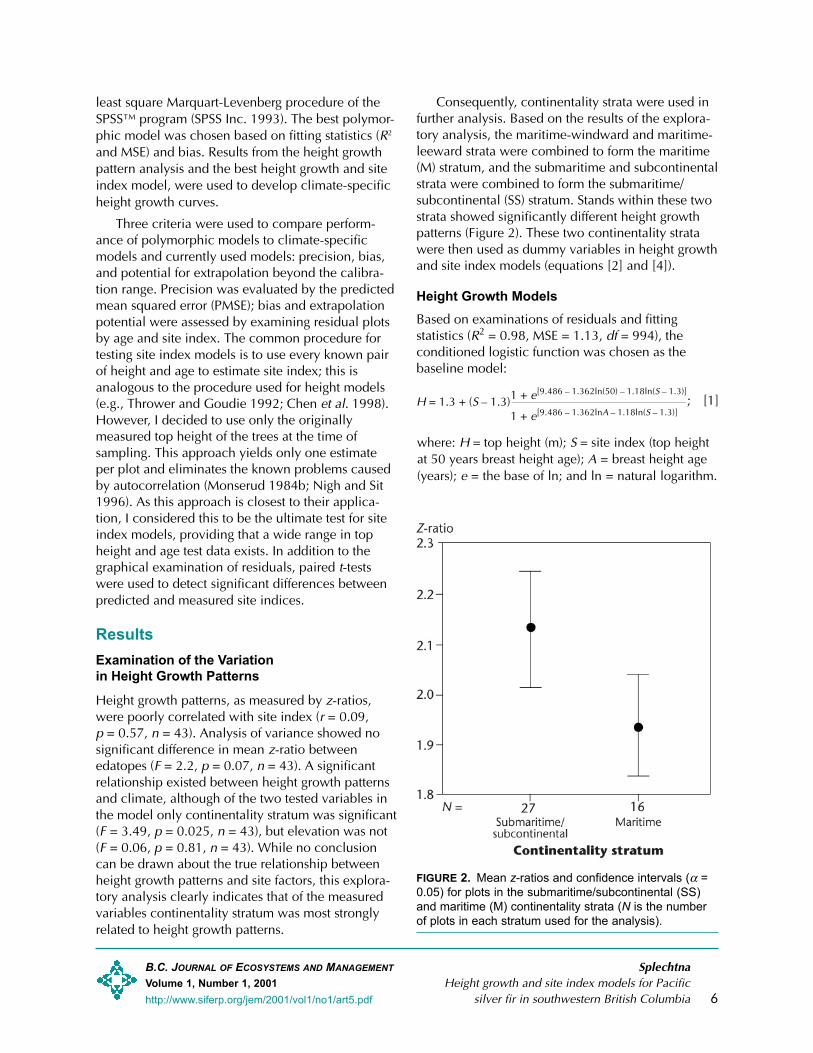
Height growth patterns, as measured by z-ratios,were poorly correlated with site index (r = 0.09,p = 0.57, n = 43). Analysis of variance showed nosignificant difference in mean z-ratio betweenedatopes (F = 2.2, p = 0.07, n = 43). A significantrelationship existed between height growth patternsand climate, although of the two tested variables inthe model only continentality stratum was significant(F = 3.49, p = 0.025, n = 43), but elevation was not(F = 0.06, p = 0.81, n = 43). While no conclusioncan be drawn about the true relationship betweenheight growth patterns and site factors, this explora-tory analysis clearly indicates that of the measuredvariables continentality stratum was most stronglyrelated to height growth patterns.
Consequently, continentality strata were used infurther analysis. Based on the results of the explora-tory analysis, the maritime-windward and maritime-leeward strata were combined to form the maritime(M) stratum, and the submaritime and subcontinentalstrata were combined to form the submaritime/subcontinental (SS) stratum. Stands within these twostrata showed significantly different height growthpatterns (Figure 2). These two continentality stratawere then used as dummy variables in height growthand site index models (equations [2] and [4]).
Height Growth ModelsBased on examinations of residuals and fittingstatistics (R2 = 0.98, MSE = 1.13, df = 994), theconditioned logistic function was chosen as thebaseline model:
FIGURE 2. Mean z-ratios and confidence intervals (α =0.05) for plots in the submaritime/subcontinental (SS)and maritime (M) continentality strata (N is the numberof plots in each stratum used for the analysis).
H = 1.3 + (S – 1.3)1 + e[9.486 – 1.362ln(50) – 1.18ln(S – 1.3)]
1 + e[9.486 – 1.362lnA – 1.18ln(S – 1.3)]; [1]
where: H = top height (m); S = site index (top heightat 50 years breast height age); A = breast height age(years); e = the base of ln; and ln = natural logarithm.

7
B.C. JOURNAL OF ECOSYSTEMS AND MANAGEMENT
Volume 1, Number 1, 2001http://www.siferp.org/jem/2001/vol1/no1/art5.pdf
SplechtnaHeight growth and site index models for Pacific
silver fir in southwestern British Columbia
Equation [1] was extended to accommodatevariation in height growth pattern with continentalityby using the two continentality strata as dummyvariables, which resulted in:
underestimated height for most age classes; how-ever, this underestimation was only greater than twostandard errors of the mean at age class 5 years.When residuals were plotted over site index classes,the climate-specific model [2] was only slightlybiased for site index class 10 (mean bias = 0.1 m)(Figure 4B). Equation [1] was significantly negativelybiased for site index classes 5 and positively biasedfor site index class 30 (Figure 4B). Model [2] (PMSE= 0.50, N = 486) was also slightly more precise thanmodel [1] (PMSE = 0.69, N = 486).
Past the calibration range, the climate-specificmodel (equation [2]) performed better than theconventional polymorphic model (equation [1]). Themean residuals never deviated from zero by morethan 0.6 m and lay within two standard errors of themean for all age classes. The conventional polymor-phic model (equation [1]) yielded a large negativebias past 110 years (Figure 4A).
where: H = top height (m); S = site index (top heightat 50 years breast height age); A = breast height age(years); e = the base of ln; and ln = natural loga-rithm; and M and SS are either 0 or 1 depending onthe plot location.
This climate-specific model showed a similar R2
(0.98) to equation [1] and a slightly lower MSE(1.07, df = 991), indicating only a slight increase inprecision. It yielded two sets of curves, one for eachcontinentality stratum which displayed the greatestdifferences past the calibration range (> 100 yearsbreast height age) (Figure 3). For all site-indexclasses, curves of the SS stratum were more sigmoi-dal than the curves of the M stratum. This impliesthat culmination of height growth occurs earlier and(potential) maximum heights reached for a givensite-index class are lower in the SS stratum com-pared to the M stratum. Prior to the index age,height estimates in the SS stratum were alwayslower compared to the M stratum. Beyond the indexage, however, differences in estimated heightsvaried with site-index class. For low site-indexclasses of 5 and 10 m, height estimates for the SSstratum were higher than for the M stratum; for siteindex classes of 15 and 20 m, little difference wasevident between the curves of the two strata; andfor site-index classes of greater than 25 m, thepredicted heights were increasingly higher for the Mthan for the SS stratum. Within the tested range, thelargest difference in top height between the twostrata given by the model was about 4 m for site-index class 35 and breast height age of 160 years(Figure 3).
When tested against independent data within thecalibration range, little difference in bias was evi-dent between the models. The patterns of residualsversus age were similar for all four models up to theage class of 100 years (Figure 4A). Both models
FIGURE 3. The plot of the climate-specific height growthcurves from the selected model (equation [2]). Solidlines refer to the submaritime/subcontinental (SS)continentality stratum and dashed lines refer to themaritime (M) continentality stratum.
1 + e[8.704 – 1.306ln(50) – 0.980ln(S – 1.3)]
1 + e[8.704 – 1.306lnA – 0.980ln(S – 1.3)]H = 1.3 + M (S – 1.3){{{{{
1 + e[9.761 – 1.549ln(50) – 1.109ln(S – 1.3)]
1 + e[9.761 – 1.549lnA – 1.109ln(S – 1.3)]+ SS (S – 1.3) ; [2]{{{{{
}}}}}
}}}}}

8
B.C. JOURNAL OF ECOSYSTEMS AND MANAGEMENT
Volume 1, Number 1, 2001http://www.siferp.org/jem/2001/vol1/no1/art5.pdf
SplechtnaHeight growth and site index models for Pacific
silver fir in southwestern British Columbia
Site Index Models
After fitting the initially selected functions to thecalibration data, the residuals for all the modelsshowed a cubic pattern with breast height age.Therefore, several other functions were tried andfinally an equation, previously used by Carmean andLenthall (1989) and Thrower and Goudie (1992),was selected:
more than two standard errors from zero for any ageclass. Therefore, equation [3] was selected as the“best” conventional polymorphic model (R2 = 0.96,MSE = 2.43, df = 859).
Using continentality strata, a climate-specificmodel was developed:
FIGURE 4. Validation of height models using the test data set. Mean and two standard errors by (A) breast heightage and (B) site-index class for residuals of height models fitted by conditioned logistic (equation [1]) and theclimate-specific function (equation [2]).
A
B
S = 1.3 + 0.694(50 – A)A–0.558 + 0.368(H – 1.3)+ 31.771(H – 1.3)A–1 ; [3]
where: S = site index (top height at 50 years breastheight age); A = breast height age (years); and H =top height (m); .
Although equation [3] also showed a slight cubicpattern with age, the mean residuals never deviated
where: S = site index (top height at 50 years breastheight age); A = breast height age (years); H = topheight (m); and M and SS are either 0 or 1 depend-ing on the plot location.
S = 1.3 + M 0.694(50 – A)A–0.558 + 0.368(H – 1.3)
+ 31.771(H – 1.3)A–1 + SS 0.592(50 – A)A–0.578}}}}}{{{{{
{{{{{; [4]+ 0.183(H – 1.3) + 41.659(H – 1.3)A–1}}}}}
9
B.C. JOURNAL OF ECOSYSTEMS AND MANAGEMENT
Volume 1, Number 1, 2001http://www.siferp.org/jem/2001/vol1/no1/art5.pdf
SplechtnaHeight growth and site index models for Pacific
silver fir in southwestern British Columbia
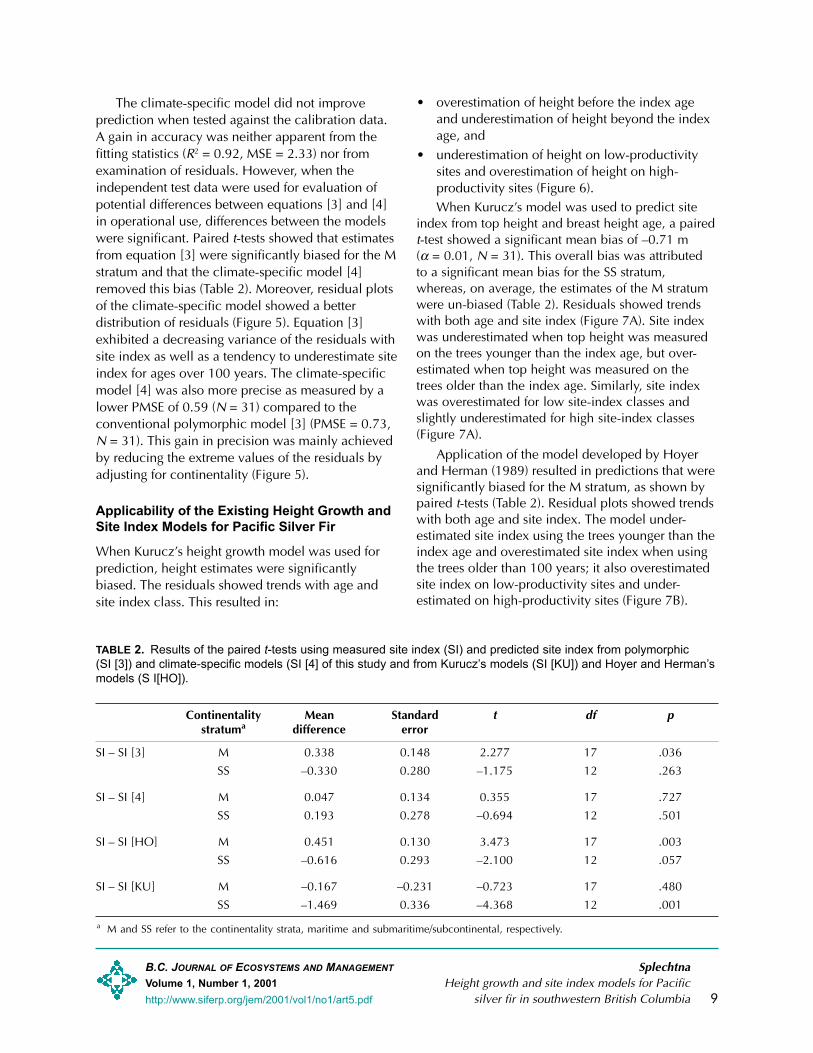
The climate-specific model did not improveprediction when tested against the calibration data.A gain in accuracy was neither apparent from thefitting statistics (R2 = 0.92, MSE = 2.33) nor fromexamination of residuals. However, when theindependent test data were used for evaluation ofpotential differences between equations [3] and [4]in operational use, differences between the modelswere significant. Paired t-tests showed that estimatesfrom equation [3] were significantly biased for the Mstratum and that the climate-specific model [4]removed this bias (Table 2). Moreover, residual plotsof the climate-specific model showed a betterdistribution of residuals (Figure 5). Equation [3]exhibited a decreasing variance of the residuals withsite index as well as a tendency to underestimate siteindex for ages over 100 years. The climate-specificmodel [4] was also more precise as measured by alower PMSE of 0.59 (N = 31) compared to theconventional polymorphic model [3] (PMSE = 0.73,N = 31). This gain in precision was mainly achievedby reducing the extreme values of the residuals byadjusting for continentality (Figure 5).
Applicability of the Existing Height Growth andSite Index Models for Pacific Silver Fir
When Kurucz’s height growth model was used forprediction, height estimates were significantlybiased. The residuals showed trends with age andsite index class. This resulted in:
TABLE 2. Results of the paired t-tests using measured site index (SI) and predicted site index from polymorphic(SI [3]) and climate-specific models (SI [4] of this study and from Kurucz�s models (SI [KU]) and Hoyer and Herman�smodels (S I[HO]).
Continentality Mean Standard t df pstratuma difference error
SI – SI [3] M 0.338 0.148 2.277 17 .036
SS –0.330 0.280 –1.175 12 .263
SI – SI [4] M 0.047 0.134 0.355 17 .727
SS 0.193 0.278 –0.694 12 .501
SI – SI [HO] M 0.451 0.130 3.473 17 .003
SS –0.616 0.293 –2.100 12 .057
SI – SI [KU] M –0.167 –0.231 –0.723 17 .480
SS –1.469 0.336 –4.368 12 .001
a M and SS refer to the continentality strata, maritime and submaritime/subcontinental, respectively.
• overestimation of height before the index ageand underestimation of height beyond the indexage, and
• underestimation of height on low-productivitysites and overestimation of height on high-productivity sites (Figure 6).When Kurucz’s model was used to predict site
index from top height and breast height age, a pairedt-test showed a significant mean bias of –0.71 m(α = 0.01, N = 31). This overall bias was attributedto a significant mean bias for the SS stratum,whereas, on average, the estimates of the M stratumwere un-biased (Table 2). Residuals showed trendswith both age and site index (Figure 7A). Site indexwas underestimated when top height was measuredon the trees younger than the index age, but over-estimated when top height was measured on thetrees older than the index age. Similarly, site indexwas overestimated for low site-index classes andslightly underestimated for high site-index classes(Figure 7A).
Application of the model developed by Hoyerand Herman (1989) resulted in predictions that weresignificantly biased for the M stratum, as shown bypaired t-tests (Table 2). Residual plots showed trendswith both age and site index. The model under-estimated site index using the trees younger than theindex age and overestimated site index when usingthe trees older than 100 years; it also overestimatedsite index on low-productivity sites and under-estimated on high-productivity sites (Figure 7B).

10
B.C. JOURNAL OF ECOSYSTEMS AND MANAGEMENT
Volume 1, Number 1, 2001http://www.siferp.org/jem/2001/vol1/no1/art5.pdf
SplechtnaHeight growth and site index models for Pacific
silver fir in southwestern British Columbia
FIGURE 5. Residuals plotted by (A) breast height age and (B) site index for the polymorphic function (equation [3])and the climate-specific function (equation [4]).
B
A
FIGURE 6. Mean and two standard errors of residuals (of predicted top height) by breast-height-age and site-indexclass as calculated from Kurucz�s curve using the test data set.

11
B.C. JOURNAL OF ECOSYSTEMS AND MANAGEMENT
Volume 1, Number 1, 2001http://www.siferp.org/jem/2001/vol1/no1/art5.pdf
SplechtnaHeight growth and site index models for Pacific
silver fir in southwestern British Columbia
DiscussionDifferences in Height Growth Pattern betweenContinentality Strata
Differences in the height growth pattern betweenmaritime and submaritime/subcontinentalcontinentality strata were observed when heightgrowth pattern was measured as a single-valuedratio (z-ratio). When the two continentality stratawere used as dummy variables in climate-specificheight growth and site index models, the resultingcurves showed obvious differences in height growthpattern (Figure 3) and improved the accuracy ofheight and site index estimates (Figures 4 and 5,Table 2). A relationship between regional climateand height growth pattern was suggested for several
tree species as height growth patterns have beenfound to vary from region to region (e.g., Marschall1976; Monserud 1985; Thrower and Goudie 1992;Chen et al. 1998). The results also agree with severalstudies that reported relationships between climaticvariables and height growth patterns (Hoyer andChawes 1980; Milner 1988; Wang et al. 1994;Klinka et al. 1996).
However, numerous climatic and non-climaticfactors may act and interact to produce heightgrowth patterns. The association of continentalitystrata with variation in height growth pattern ofPacific silver fir may be indirect. Non-climaticfactors that are associated with continentality stratamay cause differences in height growth pattern; forexample, differences in continentality may be
FIGURE 7. Residuals of predicted site index plotted by breast-height-age and site index calculated from (A) Kurucz�sfunction and (B) the function from Hoyer and Herman.
A
B

12
B.C. JOURNAL OF ECOSYSTEMS AND MANAGEMENT
Volume 1, Number 1, 2001http://www.siferp.org/jem/2001/vol1/no1/art5.pdf
SplechtnaHeight growth and site index models for Pacific
silver fir in southwestern British Columbia
associated with different populations of Pacific silverfir, which may have adapted different height growthpatterns (Monserud and Rehfeldt 1990).
Application of Height and Site Index Models
The previously existing models to estimate heightand site index for Pacific silver fir were significantlybiased when applied to the entire study area (Figures6 and 7). Consequently, estimates of yield for thecoastal high-elevation forest based on these curvesare likely to be incorrect. When the performance ofthe conventional polymorphic and climate-specificheight growth and site index models was comparedusing an independent set of data, residual plots andthe PMSE statistics showed that the climate-specificmodels were more accurate. The improvement overthe conventional polymorphic models was mainlyattributed to a reduced bias past the calibrationrange (Figures 4 and 5). This is consistent with thefinding that differences between the height growthcurves for the two continentality strata were largestbetween 100 and 160 years of age (Figure 3).
For Pacific silver fir stands growing in south-western British Columbia, I recommend the applica-tion of the climate-specific models for height andsite index estimation. The models should only beused within the age range of 15 to 160 years. Sincethe results of this study indicate that height growthpatterns of Pacific silver fir vary with climate,caution must be used when the models are appliedto stands growing in central or northern coastalBritish Columbia.
AcknowledgementsI thank James Thrower (J. Thrower and Associates),Peter L. Marshall, Han Y. H. Chen, and Karel Klinka(Faculty of Forestry, University of British Columbia)for useful comments and advice. I also thank thereviewers Robert Green, Al Wienscyk (SIFERP),Gordon Weetman, and John E. Barker (Faculty ofForestry, University of British Columbia) for theircomments on the manuscript. I am grateful to D.Brisco, G. Bustard, and David New, University ofBritish Columbia, for field assistance, as well asLucia Gussner for assistance in laboratory analysis.Financial support for this study provided by ForestRenewal BC is gratefully acknowledged.
References
Alemdag, I.S. 1991. National site-index and height-growth curves for white spruce growing in naturalstands in Canada. Canadian Journal of ForestResearch 21:1466–1474.
Arnott, J.T., R.K. Scagel, R.C. Evans, and F.T. Pendl.1995. High elevation regeneration strategies forsubalpine and montane forests of coastal BritishColumbia. Can. For. Serv. and B.C. Min. For.,Victoria, B.C. FRDA Report No. 229.
Assmann, E. 1970. The principles of forest yieldstudy. Pergamon Press, New York, N.Y.
Beck, D.E. 1971. Height growth pattern and siteindex of white pine in the southern Appalachians.Forest Science 17:252–260.
Brooke, R.C., E.B. Peterson, and V.J. Krajina. 1970.The subalpine Mountain Hemlock zone. Ecology ofWestern North America 2:148–349.
Carmean, W.H. 1956. Suggested modifications ofthe standard Douglas-fir site curves for certain soilsin southwestern Washington. Forest Science 2:242–250.
_______. 1972. Site index curve for upland oak incentral states. Forest Science 18:109–120.
Carmean, W.H. and D.J. Lenthall. 1989. Height-growth and site-index curves for jack pine in northcentral Ontario. Canadian Journal of Forestry Re-search 19:215–224.
Chen, H.Y.H, K. Klinka, and R.D. Kabzems. 1998.Height growth and site index models for tremblingaspen (Populus tremuloides Michx.) in northernBritish Columbia. Forest Ecology and Management102:157–165.
Curtis, R.O. 1964. A stem analysis approach to site-index curves. Forest Science 10:241–256.
Curtis, R.O., F.R. Herman, and D.J. DeMars. 1974a.Height growth and site index for Douglas-fir in high-elevation forests of the Oregon-Washington Cas-cades. Forest Science 20:307–316.
Curtis, R.O., D.J. DeMars, and F.R. Herman. 1974b.Which dependent variable in site index-heightregressions? Forest Science 20:74–87.

13
B.C. JOURNAL OF ECOSYSTEMS AND MANAGEMENT
Volume 1, Number 1, 2001http://www.siferp.org/jem/2001/vol1/no1/art5.pdf
SplechtnaHeight growth and site index models for Pacific
silver fir in southwestern British Columbia
Dyer, M.E. and R.L. Bailey. 1987. A test of sixmethods for estimating true heights from stemanalysis data. Forest Science 33:3–13.
Green, R.N. and K. Klinka. 1994. A field guide forsite identification and interpretation for the Vancou-ver Forest Region. B.C. Min. For., Victoria, B.C. LandManagement Handbook No. 28.
Heger, L. 1968. A method of constructing site-indexcurves from stem analysis. Forest Chronicle44:11–15.
Hoyer, G.E. and R. Chawes. 1980. Application ofZeide´s standardized growth curves and the two-point curve form estimation system to Pacific North-west species. Department of Natural Resources,Olympia, Washington. Rep. No. 40.
Hoyer, G.E. and F.R. Herman. 1989. Height-age andsite index curves for Pacific silver fir in the PacificNorthwest. U.S. Department of Agriculture ForestService, Pacific Northwest Research Station, Port-land, Oreg. Research Paper PNW-RP-418.
Klinka, K, V.J. Krajina, A. Ceska, and M. Scagel.1989. Indicator plants of coastal British Columbia.University of British Columbia Press, Vancouver,B.C.
Klinka, K., J. Pojar, and D.V. Meidinger. 1991.Revision of biogeoclimatic units of coastal BritishColumbia. Northwest Science 65:32–47.
Klinka, K., Q. Wang, R.E. Carter, and H.Y.H. Chen.1996. Height growth/elevation relationships insubalpine forests of interior British Columbia. ForestChronicle 72:1–6.
Krajina, V.J. 1965. Biogeoclimatic zones in BritishColumbia. Ecology of Western North America1:1–17.
________. 1969. Ecology of forest trees of BritishColumbia. Ecology of Western North America2:1–146.
Kurucz, J.F. 1982. Polymorphic site-index curves forbalsam-Abies amabilis in coastal British Columbia.Woodlands Service Division, MacMillan BloedelLtd., Nanaimo, B.C. Research Project 933-3.
Marschall, J. 1976. Die neuen Fichtenertragstafelnfür Österreich. AFZ 87:195–200.
Marshall, P. and S. Northway. 1993. Suggestedminimum procedure for validation of growth andyield models and yield tables to be used in BritishColumbia. Report to the Forest Productivity Councilsof B.C.
Milner, K.S. 1988. Constructing site specific heightgrowth curves. In Proceedings IUFRO forest growthmodelling and prediction conference. U.S. Depart-ment of Agriculture Forest Service, North CentralForest Experiment Station, St. Paul, Minn. GeneralTechnical Report NC-120.
Mitchell, K.J. 1975. Dynamics and simulated yield ofDouglas-fir. Forest Science Monograph No. 17.
Monserud, R.A. 1984a. Problems with site index: anopinionated review. In Symposium Proceedings:Forest land classification: experiences, problems,perspectives. J. Bockheim (editor). University ofWisconsin, Madison, Wis. pp. 167–180.
_______. 1984b. Height growth and site index curvesfor inland Douglas-fir based on stem analysis dataand forest habitat type. Forest Science 30:943–965.
_______. 1985. Comparison of Douglas-fir site indexand height growth curves in the Pacific Northwest.Canadian Journal of Forest Research 15:673–679.
Monserud, R.A. and G.E. Rehfeldt. 1990. Geneticand environmental components of variation of siteindex in inland Douglas-fir. Forest Science 36:1–9.
Murray, D.M., D. Coble, and R.O. Curtis. 1991.Height growth of young Pacific silver fir and noblefir established on clearcuts in the Pacific silver firzone of western Washington. Canadian Journal ofForest Research 21:1213–1221.
Nigh, G.D. and V. Sit. 1996. Validation of forestheight-age models. Canadian Journal of ForestResearch 26:810–818.
Nuszdorfer, F.C. and R. Boettger. 1994.Biogeoclimatic units of the Vancouver Forest Re-gion. B.C. Min. For., Victoria, B.C. 1:250 000 map.
Payandeh, B. 1974. Nonlinear site index equationsfor several major timber species. Forest Chronicle50:194–196.
Payandeh, B. and Y. Wang. 1995. Comparison of themodified Weibull and Richards growth function for

14
B.C. JOURNAL OF ECOSYSTEMS AND MANAGEMENT
Volume 1, Number 1, 2001http://www.siferp.org/jem/2001/vol1/no1/art5.pdf
SplechtnaHeight growth and site index models for Pacific
silver fir in southwestern British Columbia
developing site index equations. New Forests9:147–155.
Pojar, J., K. Klinka, and D.V. Meidinger. 1987.Biogeoclimatic ecosystem classification in BritishColumbia. Forest Ecology and Management22:119–154.
Pretzsch, H. 1994. Prospects of a model orientedforest yield science. ForstwissenschaftlichesCentralblat 114:188–209.
SPSS Inc. 1993. SPSS for Windows™: Base SystemUser’s Guide, Release 6.0, Chicago, Ill.
Sterba, H. 1995. Forest decline and increasingincrements: a simulation study. Forestry 68:153–163.
Thrower, J.S. and J.W. Goudie. 1992. Developmentof height-age and site-index functions for even-agedinterior Douglas-fir in British Columbia. B.C. Min.For., Victoria, B.C. Research Note No. 109.
Vander Ploeg, J.L. and J.A. Moore. 1989. Compari-son and development of height growth and site
© Southern Interior Forest Extension and Research Partnership. ISSN 1488-4674. This article is the property of thePartnership. It may be reproduced in electronic or print form for use in educational, training,and not-for-profit activities. Electronic or written permission is required from the Partnership to include thisarticle in other publications or electronic sources, or to use this article for systematic large-scale distribution orfor-profit purposes. For these purposes contact: Editor, 478 St. Paul Street, Kamloops BC, V2C 2J6.
index curves for Douglas-fir in the Inland Northwest.Western Journal of Applied Forestry 4:85–88.
Wang, G.G.and K. Klinka 1995. Site specific heightcurves for white spruce stands based on stemanalysis and site classification. Annales des sciencesforestiéres 52:607–618.
Wang, G.G., P.L. Marshall, and K. Klinka. 1994.Height growth pattern of white spruce in relation tosite quality. Forest Ecology and Management68:137–147.
Wykoff, W.R. and R.A. Monserud. 1987. Represent-ing site quality in increment models: a comparisonof methods. In Forest growth modelling and predic-tion, Vol. 1, U.S. Department of Agriculture ForestService, North Central Forest Experiment Station, St.Paul, Minn. General Technical Report NC-120.
Zeide, B. 1978. Standardization of growth curves.Journal of Forestry 75:289–292.


![Generating Virtual Even-Aged Silver Fir Stand … Virtual Even-Aged Silver Fir Stand Structure Based on the Measured Sample Plots ... [32], Weibull’s function [33] or](https://img.dokumen.tips/doc/110x75/5aca74f97f8b9aa1298db5f0/generating-virtual-even-aged-silver-fir-stand-virtual-even-aged-silver-fir-stand.jpg)