Embed Size (px)
Citation preview
- 1 -
HEDS Discussion Paper 10/02
Disclaimer: This is a Discussion Paper produced and published by the Health Economics and Decision Science (HEDS) Section at the School of Health and Related Research (ScHARR), University of Sheffield. HEDS Discussion Papers are intended to provide information and encourage discussion on a topic in advance of formal publication. They represent only the views of the authors, and do not necessarily reflect the views or approval of the sponsors. White Rose Repository URL for this paper: http://eprints.whiterose.ac.uk/42974/ Once a version of Discussion Paper content is published in a peer-reviewed journal, this typically supersedes the Discussion Paper and readers are invited to cite the published version in preference to the original version. Published paper Stevens KJ. Assessing the performance of a new generic measure of health related quality of life for children and refining it for use in health state valuation. Applied Health Economics and Health Policy 2011;9(3):157-69.
White Rose Research Online [email protected]
A new generic measure of health-related quality of life for children
2
A new generic measure of health-related quality of life for children
3
Assessing the performance of a new generic measure of health related quality of life for children and refining it for use
in health state valuation
Stevens K
School of Health and Related Research, University of Sheffield, Sheffield S1 4DA, UK
Correspondence to: Katherine Stevens, Health Economics and Decision Science, University of Sheffield, Regent Court, 30 Regent Street, Sheffield S1 4DA, UK
Telephone: +44 (0)114 222 0841 Fax: +44 (0)114 272 4095
E-mail: [email protected]
A new generic measure of health-related quality of life for children
4
Abstract Purpose: The aims of this research were to pilot and assess the performance of a new generic paediatric health related quality of life measure and to refine the measure to be amenable to health state valuation to make it suitable for use in economic evaluation. Methods: A sample of 247 children was recruited from general and clinical paediatric populations. Each child completed the measure and data was collected to allow assessment of practicality, validity, whether the child could self complete and preferences for alternative wordings that could be used. The measure was refined in light of the results and also to make it amenable to health state valuation. Results: The measure demonstrated good practicality and validity in both the general and clinical paediatric populations with excellent completion rates, a low time to complete and evidence of face, content and construct validity. To make it suitable for health state valuation, the number of dimensions of health related quality of life was reduced from 11 to 9. Conclusions: The measure performed well and the final measure generates health states which should be feasible for valuation. Further research is needed to value the final descriptive system. Key words: Economic evaluation, quality of life, paediatrics, preference based measures Abbreviations DS Descriptive system HRQoL Health-related quality of life
* * * * * Acknowledgements: This research was funded as part of a UK Medical Research Council Special Training Fellowship in Health Services and Health of the Public Research. Thanks go to the staff of Firs Hill Community Primary School and Hunter's Bar Junior School, the parents who gave their consent and all the children who took part. The Clinical Research Facility at Sheffield Children’s NHS Trust hosted the clinical study and thanks go to the staff on the wards, the parents who gave their consent and the children who took part.
A new generic measure of health-related quality of life for children
5
Introduction Previous research by Stevens [1],[2] developed a descriptive system (DS) for a new paediatric generic measure of health related quality of life (HRQoL). This contains 17 questions and covers 11 dimensions of HRQoL as some of the questions are alternative wordings for dimensions. The measure was developed with children age 7-11 years and is intended to be preference based so that it can be used in economic evaluation. Before using a new measure, it is important to assess the psychometric performance to ensure it is practical, valid and reliable. It has also been noted that for a paediatric measure it is important to carry out pilot testing and cognitive debriefing so that you can determine whether children understand the questions and provide reliable and valid responses [3]. Research was therefore needed to test out the alternative wordings for the dimensions, to assess the psychometric performance, to pilot the measure on a paediatric population and to refine the measure to be amenable to health state valuation so that it can be preference based. This paper reports on this research. The aim was to assess the performance of the DS in a paediatric sample and to refine the DS to be suitable for health state valuation. Methods Sampling The aim was to recruit a sample of 7-11 year old children with a wide range of health problems. Children of this age were recruited as this is the age range the dimensions were originally developed for [1]. Two different populations were accessed. Firstly, a general paediatric population was recruited from two schools in Sheffield, UK where the original work had been carried out to develop the DS [1]. All children age 7-11 years were eligible. Secondly, a clinical paediatric population was recruited from the Sheffield Children’s Hospital in order to test the measure in a population with a much wider range and severity of health problems. Several different care areas within Sheffield Children’s Hospital were recruited so as to access children with a wide range of acute and chronic health problems. These included a medical ward, two surgical wards, the day care unit and the Clinical Research Facility (an outpatient research facility). The medical ward cares for children with a wide range of acute and chronic medical conditions. One surgical ward covers children with a range of renal, gastrointestinal and neuro-surgery, and the other surgical ward covers orthopaedic, limb reconstruction, and spinal surgery. The day care unit cares for children undertaking surgical and medical day procedures (including urology, gastroenterology, endocrinology, neurology, oncology, orthopaedic, general surgery, dental, ENT (ear nose and throat) and allergy patients as well as patients coming for investigational procedures) and the Clinical Research
A new generic measure of health-related quality of life for children
6
Facility cares for a range of children involved in research projects, including those with brittle bone disease. Children attending the hospital come from throughout South Yorkshire and some come from slightly further afield such as Lincolnshire. Children were eligible for the study if they were being cared for on one of the recruited areas and they were age 7-11 years. Children whose parents did not speak English had to be excluded as they were not able to understand the information leaflet or consent process and resources were not available for translation. Any children the medical team thought were unsuitable to be approached, for example if they were too ill, were not approached. Parents/Guardians of all children were approached to gain consent for the researcher to ask their child if they would like to take part and then children were asked for their assent. Information leaflets were provided and parents/guardians and children were given the opportunity to ask questions. Those children who assented were given the DS to complete which contained the 17 questions plus an additional question asking for a general rating of their health. The full DS is given in Appendix 1. The children completed the DS in a quiet place on their own, either in the school library or the dining room or in the case of the clinical population, in hospital. The researcher sat next to them for the duration to be available to help with any questions. The researcher explained that all data would remain confidential, there were no right or wrong answers and they could ask for help at any time. The start and end times were recorded. In addition to the completion of the DS, a data collection form was completed by the parents/guardians of the clinical population which asked about previous hospital stays of the child, whether their child had any long standing illness or disability, whether this affected their activities and a rating of their child’s health. Children in the school population were asked whether they had been off school ill in the previous week. This data was obtained in order to obtain a rough proxy for how sick children were, in order to test the validity of the DS. Information was also collected on gender, age and ethnicity of the child. All children were asked questions on whether they thought there was anything missing from the content of the DS, whether any questions were the same and if they were, which wording they preferred. They were also asked if there were any questions they did not understand, found difficult and whether they had any overall comments. The researcher also documented whether children read and understood the instructions and questions themselves, whether they needed help on particular questions, the nature of that help and whether they were able to self complete the DS. For the clinical study, ethical approval was obtained from South Sheffield Research Ethics Committee and R&D Approval from Sheffield Children’s NHS
A new generic measure of health-related quality of life for children
7
Foundation Trust, reference number: 07/H1309/74. For the school study, ethical approval was obtained from The University of Sheffield ethics committee. Analysis To assess the psychometric performance of an instrument, the most commonly used criteria are practicality, reliability and validity [4]. They are useful for assessing both the performance of and refining an instrument. Two of the criteria – practicality and validity were assessed in this study. It was not possible to assess reliability due to time and resource constraints. Practicality was assessed by looking at the mean time taken to complete, the response rate, the completion rate and distribution across levels by question and whether the child read and understood the instructions. Content validity was assessed by whether children identified things missing from the content of the DS. Face validity was assessed according to whether children were able to read and understand the questions and what they found difficult or needed help on and why. Construct validity was assessed by splitting the data according to whether children had been absent from school or not due to illness in the last week and comparing their scores on the DS. The score was also compared with the child’s rating of their own health (q18) to see if this correlated. Each question was scored so that the highest level was 1 and the next level down was 2 and so on. A total score was then generated for each child by summing the scores across the questions. Only one form of wording (question) for each dimension was used for this so as not to double count. The questions included were worrying, sad, pain, schoolwork, tired, annoyed, sleep, embarrassed, jealous, daily routine and joining in activities. When comparing the score to the child’s rating of their own health, if these correlate in that a higher score is associated with a lower level of health then this provides some evidence of construct validity. For the clinical sample, the score was calculated for those who had had a previous hospital stay in the last 6 months, those who had had a previous outpatient appointment in the last 6 months, those who had a long standing illness that limited their activities and compared with those who did not. These scores were tested to see if the differences were significant. A final test of construct validity looked at the differences in mean score between the school and clinical samples. Ability to self complete was assessed by looking at the proportion who were able to self complete. This question was recorded as ‘yes’ if the child was able to select the level that applied to them and tick the appropriate box themselves. Questions identified as the same by children were examined to see if there was a substantial preference for one form of wording. Refinement of the descriptive system To be amenable to health state valuation, there is a limit to the number of dimensions that can be included in a DS. Previous valuation work of generic

A new generic measure of health-related quality of life for children
8
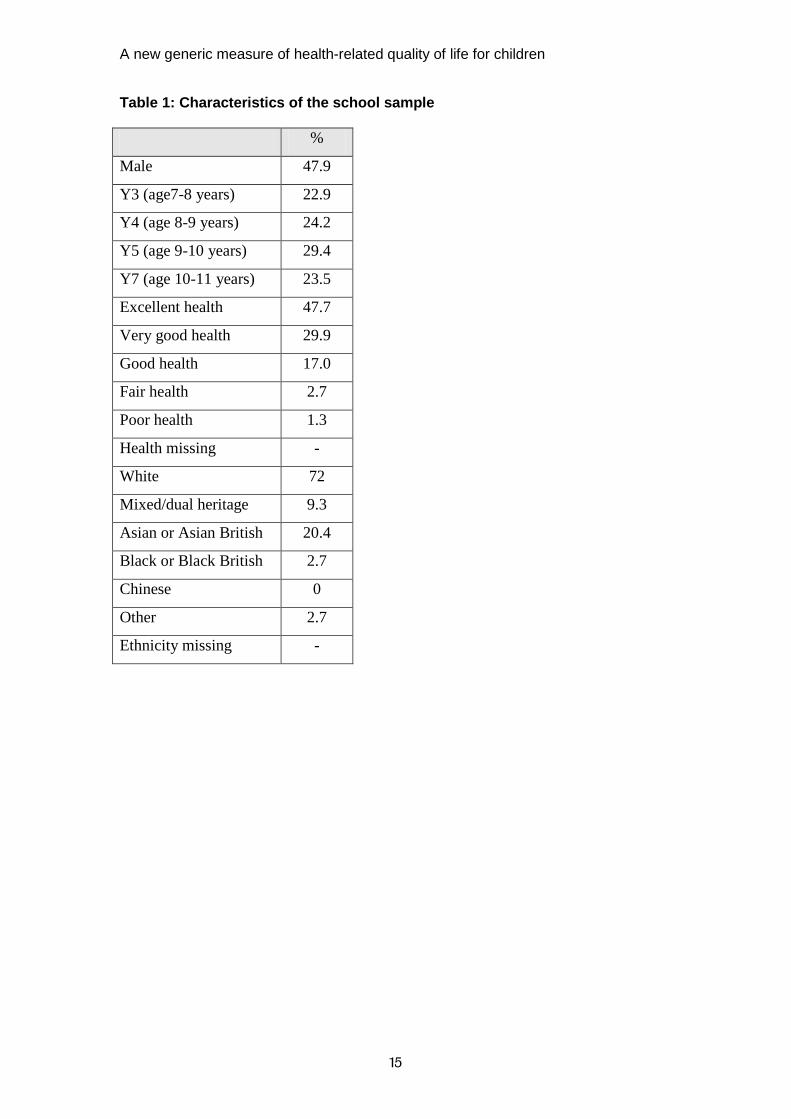
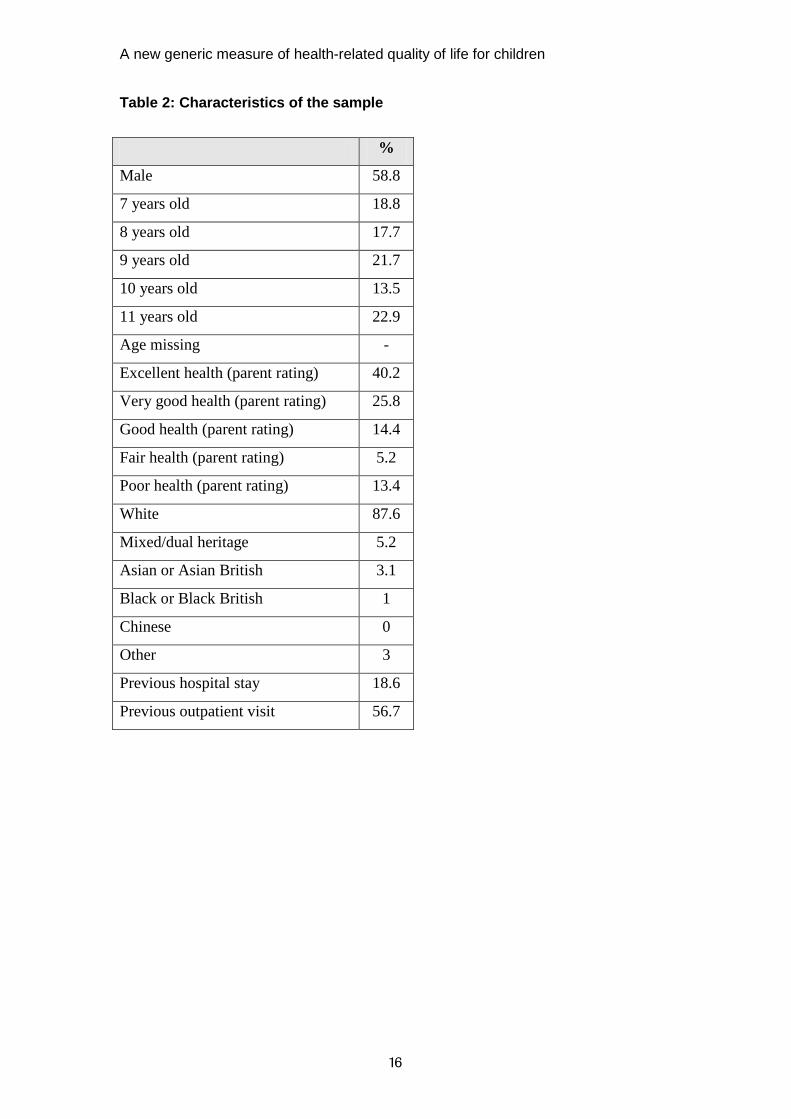
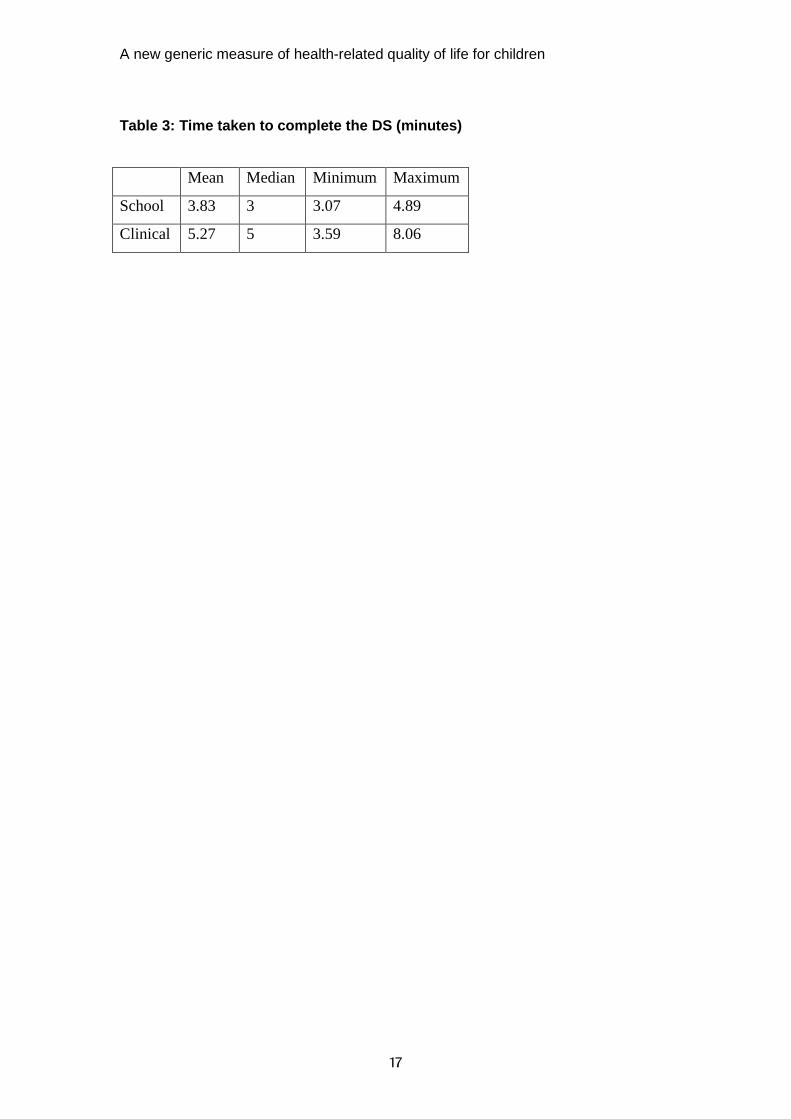
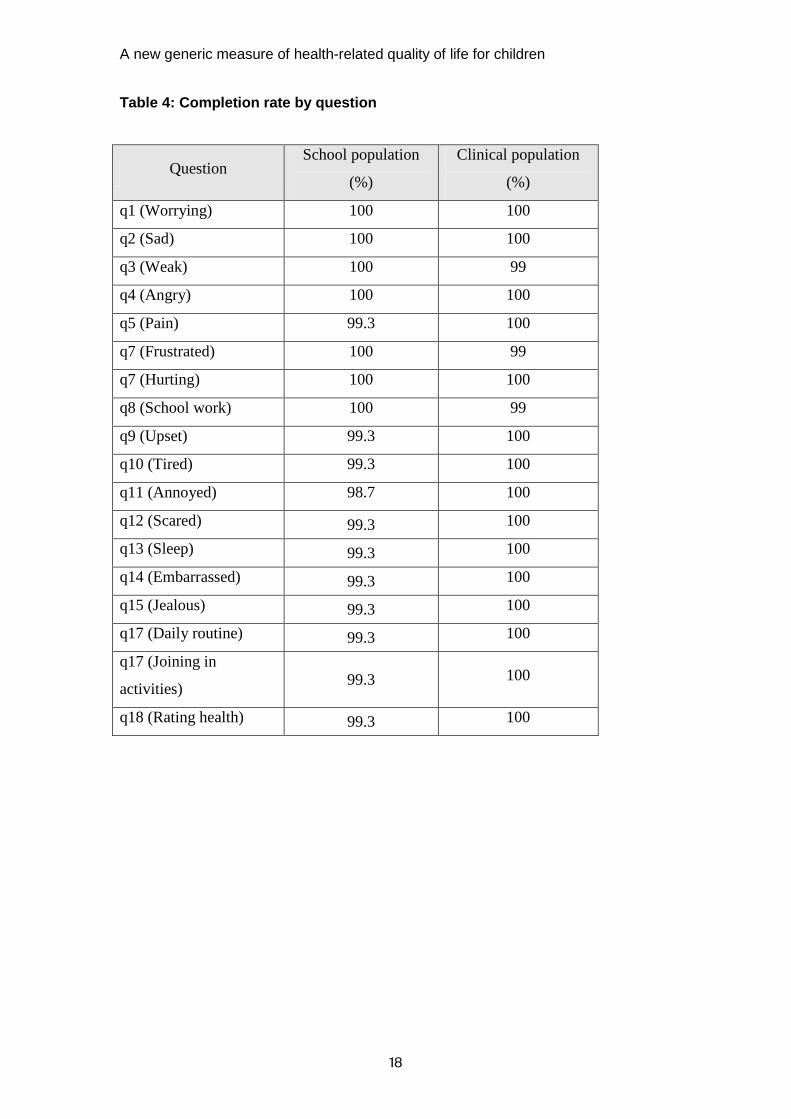
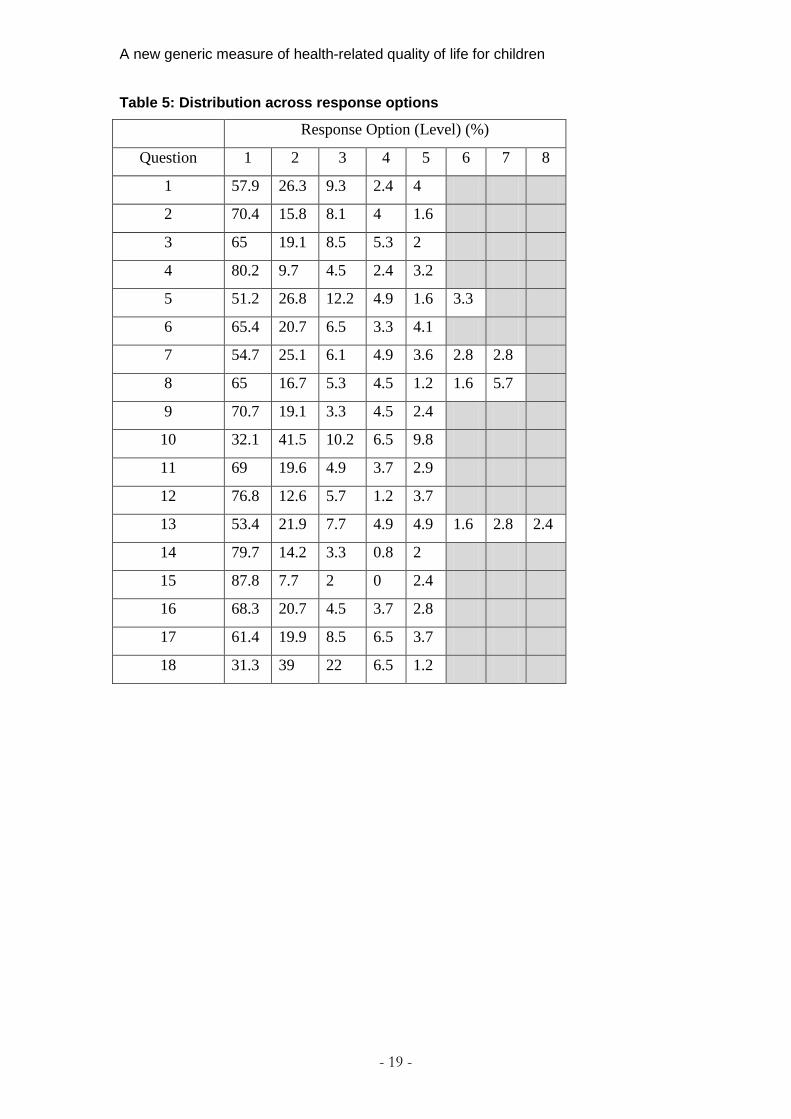
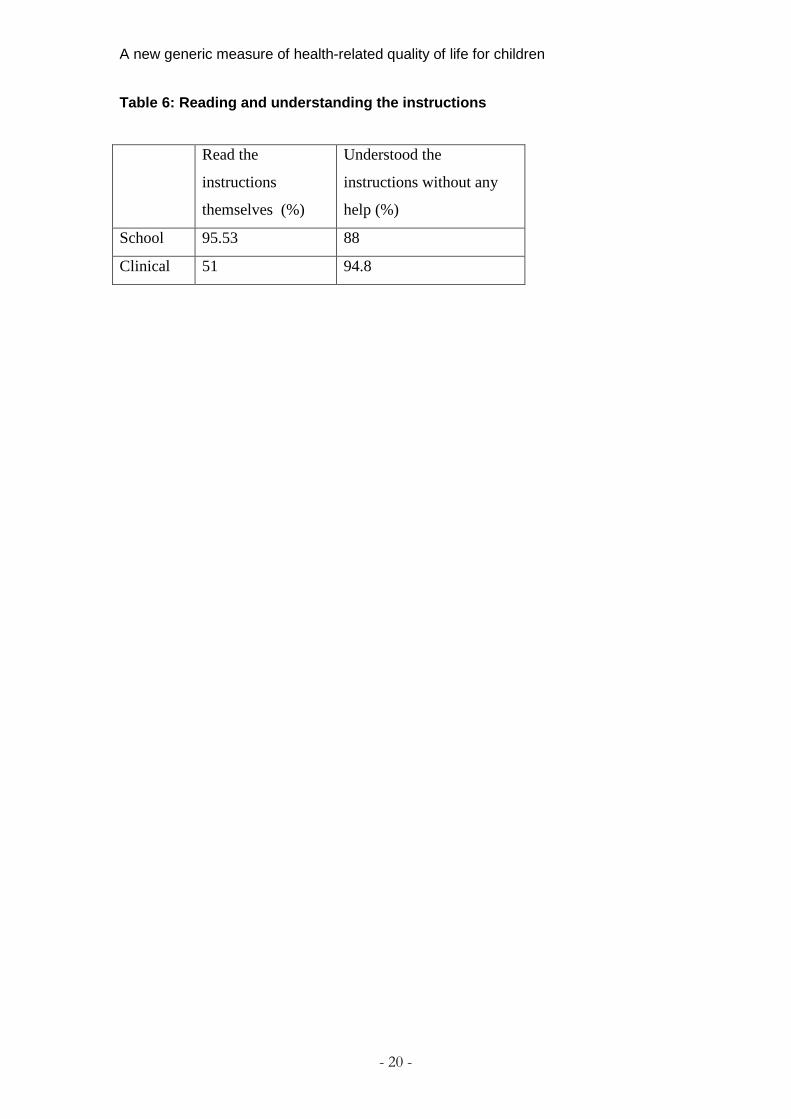
instruments has varied in the number of dimensions contained, from 8 in the HUI3, 6/7 dimensions in the HUI2, 6 in the SF-6D and 5 in the EQ-5D [5]. The conventional view that is often cited in this type of valuation work is that individuals can process around 7 (plus or minus two) separate pieces of information in making a single decision [6]. Ideally a descriptive system should therefore contain around 7 dimensions and certainly no more than 9. The 11 dimensions of the DS originally developed [1] were clearly too many to be suitable for valuation so after selecting the final wording choice for each dimension, these were reduced to meet the constraints of health state valuation. Results Sample 153 children were approached across the two schools of whom 150 gave assent. The characteristics of the sample are shown in Table 1. A good balance across year group and gender was achieved. The level of health was less balanced, with more children in the excellent and very good categories. In the clinical population, 154 admissions were identified as eligible, 98 consented, 56 did not consent and 1 child was withdrawn. Four of the admissions were the same 2 children consenting twice but in a different location on a different date, therefore data on 97 child admissions from 95 children were analysed. A good balance of medical and surgical patients was achieved. The characteristics of the sample are shown in Table 2. A good balance of acute and chronic conditions was achieved, as about 65% of children had a longstanding illness and in about 62% of these cases it limited their activities. Practicality The time taken to complete the DS is shown in table 3. For both groups, the time taken decreased by age. The response rate was 98% for the school sample and 64% for the clinical sample. Table 4 shows the completion rates by question. This was extremely high for both groups. Table 5 shows the distribution across the response options for both samples combined. The distribution across the response options for each question was good although the majority of respondents in the school sample were responding with the top levels of each question, which is not surprising given the nature of
A new generic measure of health-related quality of life for children
9
the population. Across the distribution of response options, the clinical population generally had a greater proportion of people at the lower levels and a lower proportion at the higher levels than the school population, especially for the pain, school work, daily routine and activities questions. The exceptions were the angry and embarrassed questions where they were fairly similar and the annoyed question where it was mixed across the levels. Table 6 shows how many children were able to read and understand the instructions themselves. The percentage of children who read the instructions themselves was much greater in the school population. In many cases this was because the clinical population were based in a hospital bed and some were too tired or felt too unwell to read and asked that the instructions be read to them. It was not because they did not have the ability to read. The percentage able to read and understand the instructions generally increased with age. Validity The percentage of children identifying something as missing from the content of the DS was around 10% for the school sample and 11% for the clinical sample. Items identified by the school population included symptoms such as breathing, headaches or itching and also how much you can eat. Items identified by the clinical population included daily functions, such as eating, going to the toilet, getting in and out of bed and lifting things. Face validity 92% of children in the school sample read the questions themselves and ranged from 80% to 100%, increasing with age. This was lower in the clinical sample, with a mean of 51%, ranging from 11.1% to 76%. This was not necessarily because the children could not read; in most cases the children were too poorly or tired and asked for someone to read the questions to them. Some children could also not sit up very well and so they asked for the questions to be read to them. In the school sample 23% of children had question(s) that they didn’t understand (ranging from 18.9% to 44%). This generally decreased with age. In the clinical sample 25% of children had question(s) that they did not understand and this also generally decreased with age. 35.6% of children in the school sample needed help on particular questions. The nature of this help varied. Many children asked for clarification about Q7, as to what exactly hurt and a couple of children asked if it was the same as the pain question. One child asked if it meant emotional hurt and another asked if it was physical or emotional pain. Twelve children asked what ‘affected’ meant in the context of school work and sleep. Seven children asked what the word ‘frustrated’ meant. A few children asked what jealous and embarrassed meant and some queried why it was included in a health questionnaire.
A new generic measure of health-related quality of life for children
10
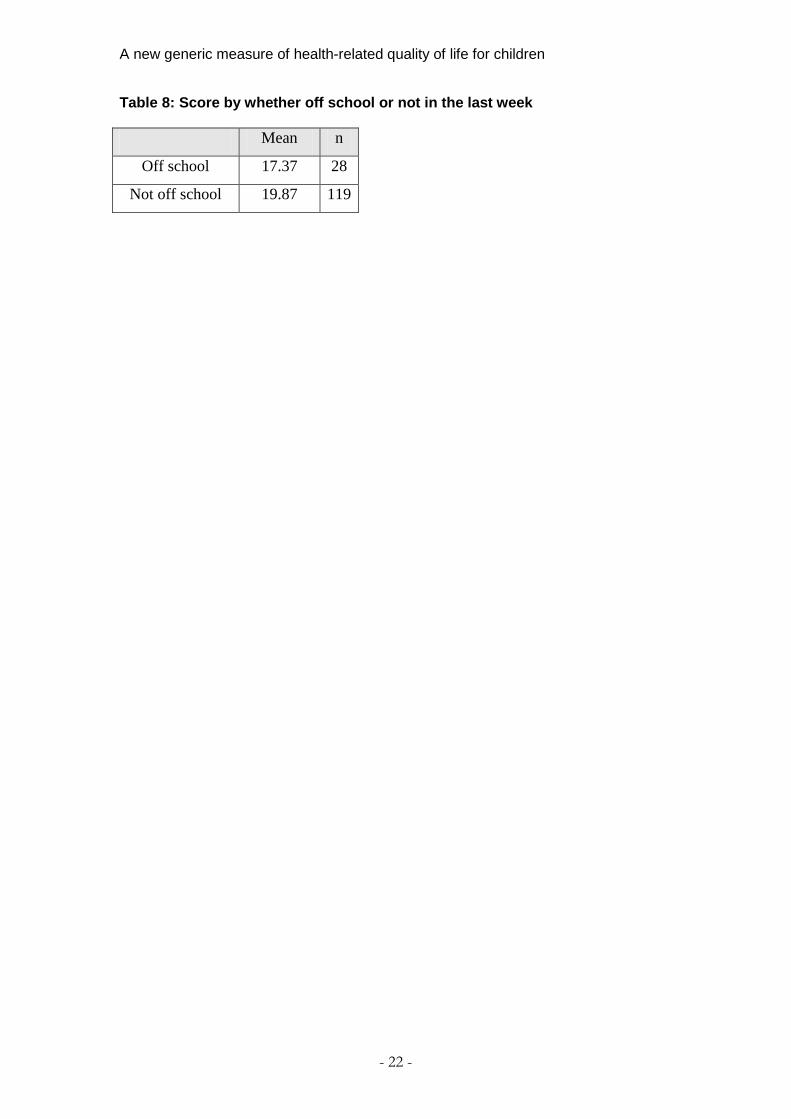
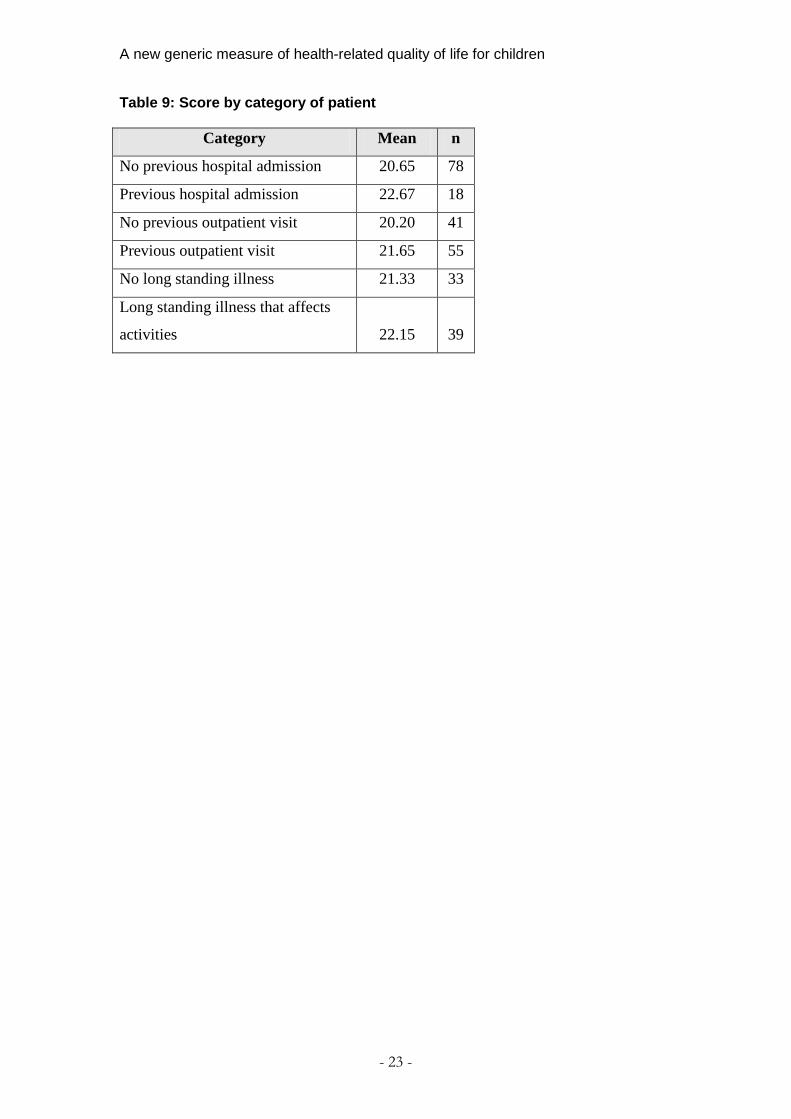
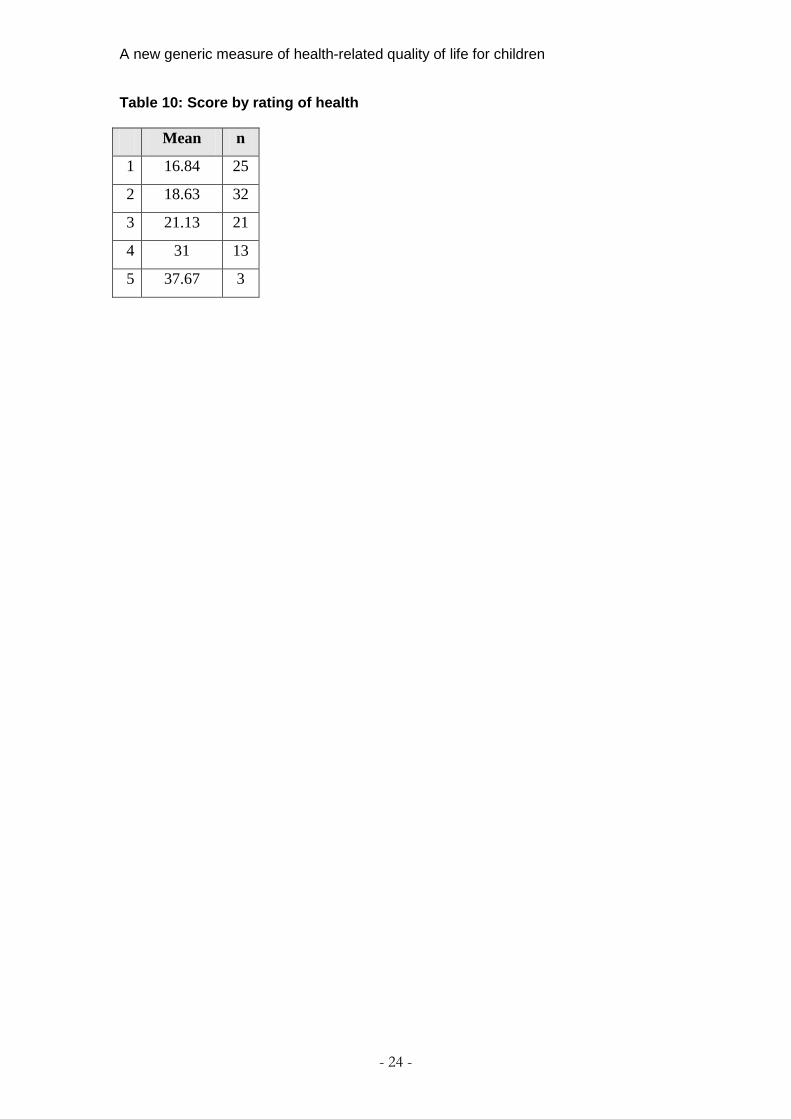
In the clinical sample, about 60% of children needed some help with questions. This generally decreased by age. The main areas were meanings of words including weak, frustrated, embarrassed and affected. They also needed more explanation for some questions, including which part of you hurts, why you might feel jealous and more explanation on daily routine. Some children were confused about schoolwork as they were in hospital at the time and asked how they should answer the question. Some children also needed help deciding which level they were on q18. Approximately 34% of the school sample judged one or more of the questions as difficult (ranging from 25% to 41% and generally decreasing with age). The main problem was that they had to think about which level they were. This occurred in questions 7, 8, 13,16 and 17. Several children found it difficult to judge what level they were when rating their health. Three children asked how or why you would feel jealous because of your health. Similarly 2 children asked why you would feel embarrassed because of your health. About 25% of children in the clinical sample said they found one or more questions difficult, varying from about 15% to 30%. Most often the difficulty was in deciding which level to choose. Children were still able to answer the questions, but said it was difficult to choose. Construct validity 28 (18%) of school children had days off school due to illness in the week prior to completion of the questionnaire. The scores correlated well with the child’s rating of their health, in that a lower rating of health correlated with a higher score. Table 7 shows the mean score for each group. A one way ANOVA test showed a significant difference in mean score by level of health (F=2.076, 0.087) at p<0.1. Those children who were off school in the last week had a lower mean score than those who were not, and this is shown in Table 8. The difference in mean score was significant at p=0.05 and gives evidence of construct validity. Table 9 shows the score by category of patient in the clinical sample. Although there were small differences in the direction expected, none of these differences were significant, possibly because the sample sizes were too small. Table 10 shows the mean score for each rating of health for the clinical sample. The score increases as the level of health decreases demonstrating that the DS can distinguish between different levels of health and therefore gives evidence of construct validity.
A new generic measure of health-related quality of life for children
11
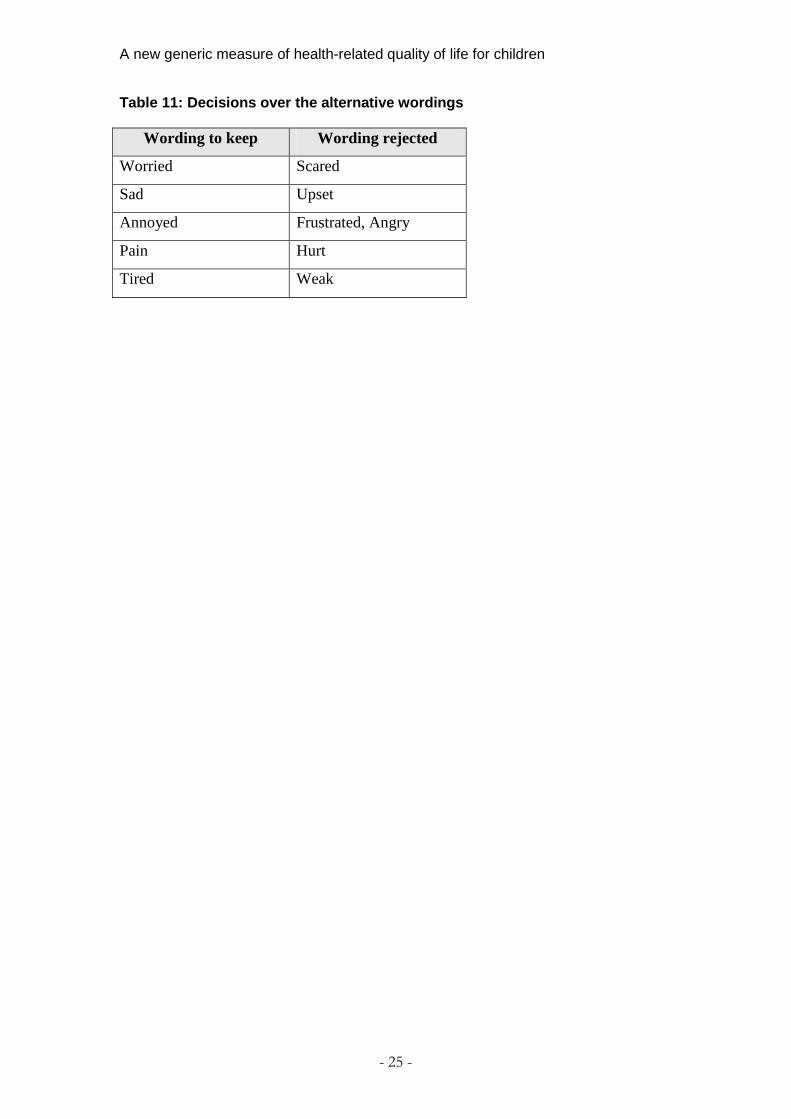
The mean score for the school population was 17.03 and 21.03 for the clinical population. This difference was significant at p=0.01. Self completion 96% of children in the school sample who were able to self complete and 85.4%. of the clinical sample. The most common reason for not being able to in the clinical sample was the child’s medical condition rather than their ability. For example, if both arms were in plaster, or they had a drip in their hand. Wording and refinement of the questionnaire Approximately two thirds of the school sample and half of the clinical sample judged one or more questions to be the same. One of the most frequently mentioned pairs of questions was 10 (tired) and 13 (sleep); however when children were asked which they preferred, on reflection the majority said to keep them both as they realised they were different. Question 5 (pain) and (7) hurting were the most frequently mentioned pair and there was a strong preference for pain. Questions 2 (sad) and 9 (upset) were another pair and sad was strongly preferred. Questions 4 (angry) and 11 (annoyed) were another frequently mentioned pair, with a preference shown for annoyed. Questions 7 (frustrated) and 11 (annoyed) were stated as the same, with a preference for annoyed. Based on these preferences and comments of both samples, decisions about the wording to keep are shown in table 11. The weakest dimensions from the original qualitative research were jealous and embarrassed. They were the weakest in the sense that they were not strongly put forward by children in comparison to other dimensions such as pain and feeling sad which emerged clearly for many different reasons, in many different contexts and situations[1]. In this research several children asked why jealous was included in the questionnaire and why your health might cause you to be jealous. Jealous was also the only dimension to contain an unused level (level 4). This dimension was also the dimension where the least problems were reported as 87.8% of children reported no problem with this dimension. Therefore these 2 dimensions were removed. One of the most common problems identified was the use of the word affected, which occurred in both q8 and q13. The two questions containing this term were therefore changed to use the scales from q16 (daily routine) and q17 (activities) which had worked well. Discussion The response and completion rates were high, with the only missing data appearing in the youngest children. The response rate in the clinical population was lower, perhaps due to the nature of recruiting from a sick population in a hospital environment. The mean time to complete was under 5 minutes for both samples and decreased with age, which is what might be
A new generic measure of health-related quality of life for children
12
expected. This compares very favourably with other generic paediatric measures [7]. The percentage able to read the instructions was high and mainly increased with age. The percentage of children able to understand the instructions was slightly lower, as some children asked for an explanation after they had read the instructions. The distribution across the response levels was good. The percentage of children able to self complete was high, and whilst a lot of children had the instructions read to them in the clinical sample, nearly all children were able to understand the instructions. The practicality was therefore good. The DS demonstrated good content validity in that only about 11% of children felt there was something missing from the content and what they identified as missing were either specific symptoms, which feed into existing dimensions, or daily activities which could feed into the daily routine question. There was evidence of face validity, with the percentage of children able to read the questions being high and increasing with age. Questions that had to be read were mainly to the younger children. There was good evidence of construct validity, demonstrated by differences in score between those who were and were not off school ill in the last week. A larger sample would have allowed formal non parametric testing of the differences between the distributions of the groups and this is a weakness of this study however this is something that could be undertaken in future psychometric testing. Good construct validity was demonstrated as the child rated level of health correlated well with the score for the DS, in that the lower the children rated their health, the higher their score. Whilst this scoring method was very crude and was not based on any preference data, you would still expect to see this correlation as it demonstrates that the DS can discriminate between different levels of health. Similarly, there are differences in scores between patients based on whether they had previous hospital admissions or not and whether they had a long standing illness. Those who had a previous hospital stay, outpatient visit or had a longstanding illness affecting their activities all had lower mean scores than those who did not, however these differences were not significant which may be due to the small sample size. The strongest identifications of wordings being similar were sad and upset, pain and hurt and frustrated and annoyed and clear preferences from the children allowed a decision to be made over the final wording to keep. Overall, the number of children identifying questions as being the same was quite low but this may be in part due to children not expecting questions on a questionnaire to be similar and thinking they may be being tested on differences in meanings between words. Generally the questionnaire performed well in both these populations and demonstrated good practicality and evidence of content, face and construct
A new generic measure of health-related quality of life for children
13
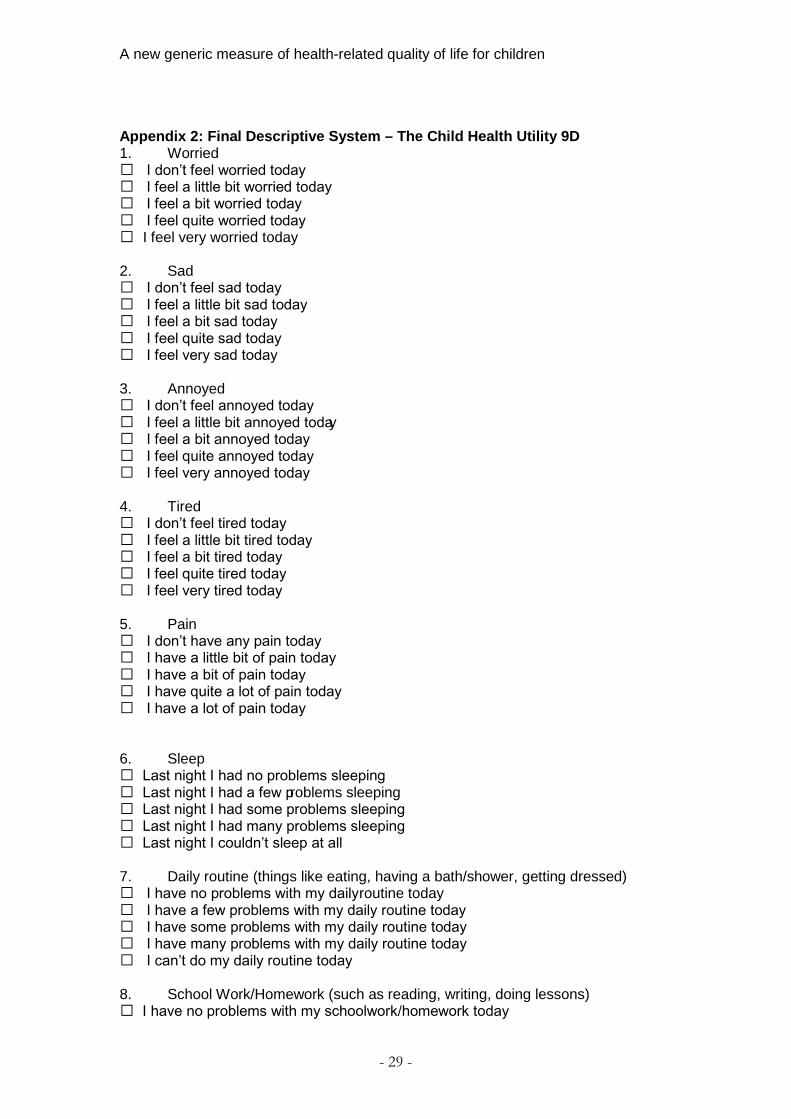
validity. Further testing in larger samples is desirable to provide more evidence of psychometric performance including reliability. Whilst there has had to be some reduction, by removing embarrassed and jealous, these were weak dimensions and so the vast majority of ways in which children’s health is affected is still contained within the DS. To reduce the number of dimensions further would be a big compromise on this strength of the DS. Because the statements in each response option are so short, the overall amount of information contained in a health state with these 9 dimensions was felt to be no more than that contained in other generic measures. Some descriptive systems also combine dimensions, such as the EQ-5D [8], which combines anxiety and depression, which is actually two pieces of information, but counts as one. Conclusions Overall, this research has demonstrated that the DS demonstrates good practicality and validity in both the school and clinical paediatric populations and the majority of children are able to self complete provided there is an adult on hand to give clarification when required. Sometimes it is necessary to have an adult present to help with reading the instructions or questions, especially if the child is quite unwell. The final descriptive system for the CHU9D is shown in Appendix 2. The overall reduction in dimensions was small and whilst the number remaining is still reasonably large for valuation work, the overall amount of information contained in a health state should be feasible for valuation. The strength of the minimal amount of reduction done is the presentation of the breadth of coverage of the descriptive system which is a key strength for a generic measure. Further research is needed to value the final descriptive system. The final descriptive system was given the name Child Health Utility 9D (CHU 9D) to represent the 9 dimensions contained within it.
A new generic measure of health-related quality of life for children
14
References 1. Stevens KJ (2010). Working with children to develop dimensions for a preference-based, generic, pediatric health-related quality-of-life measure. Qualitative Health Research 20:340-51. 2. Stevens KJ (2009). Developing a descriptive system for a new preference-based measure of health-related quality of life for children. Quality of Life Research 18(8):1105-13. 3. Matza LS, Swensen AR, Flood EM, Secnik K, Leidy NK (2004). Assessment of health related quality of life in children: a review of conceptual, methodological, and regulatory issues. Value in Health 7(1):79-92. 4. Brazier JE, Deverill M, Green C, Harper R, Booth A (1999). A review of the use of health status measures in economic evaluation. Health Technology Assessment 3(9). 5. Brazier JE, Ratcliffe J, Salomon J, Tsuchiya A (2007). Measuring and valuing health benefits for economic evaluation. Oxford: Oxford University Press. 6. Miller GA (1956). The magical number seven plus or minus two: some limits on our capacity to process information. Psychological Review 63:81-7. Cited in: Fischer GW (1978). Utility models for multiple objective decisions: do they represent human preferences? Decision Sciences 10:451-79. 7. Landgraf JM (2005). Practical considerations in the measurement of HRQoL in child/adolescent clinical trials. In: Fayers P, Hays R. (eds), Assessing Quality of Life in Clinical Trials. 2nd edition. Oxford University Press. 8. Dolan P (1997). Modelling valuations for EuroQol health states. Medical Care 35:1095-108.
A new generic measure of health-related quality of life for children
15
Table 1: Characteristics of the school sample
%
Male 47.9
Y3 (age7-8 years) 22.9
Y4 (age 8-9 years) 24.2
Y5 (age 9-10 years) 29.4
Y7 (age 10-11 years) 23.5
Excellent health 47.7
Very good health 29.9
Good health 17.0
Fair health 2.7
Poor health 1.3
Health missing -
White 72
Mixed/dual heritage 9.3
Asian or Asian British 20.4
Black or Black British 2.7
Chinese 0
Other 2.7
Ethnicity missing -
A new generic measure of health-related quality of life for children
16
Table 2: Characteristics of the sample
%
Male 58.8
7 years old 18.8
8 years old 17.7
9 years old 21.7
10 years old 13.5
11 years old 22.9
Age missing -
Excellent health (parent rating) 40.2
Very good health (parent rating) 25.8
Good health (parent rating) 14.4
Fair health (parent rating) 5.2
Poor health (parent rating) 13.4
White 87.6
Mixed/dual heritage 5.2
Asian or Asian British 3.1
Black or Black British 1
Chinese 0
Other 3
Previous hospital stay 18.6
Previous outpatient visit 56.7
A new generic measure of health-related quality of life for children
17
Table 3: Time taken to complete the DS (minutes)
Mean Median Minimum Maximum
School 3.83 3 3.07 4.89
Clinical 5.27 5 3.59 8.06
A new generic measure of health-related quality of life for children
18
Table 4: Completion rate by question
Question School population
(%)
Clinical population
(%)
q1 (Worrying) 100 100
q2 (Sad) 100 100
q3 (Weak) 100 99
q4 (Angry) 100 100
q5 (Pain) 99.3 100
q7 (Frustrated) 100 99
q7 (Hurting) 100 100
q8 (School work) 100 99
q9 (Upset) 99.3 100
q10 (Tired) 99.3 100
q11 (Annoyed) 98.7 100
q12 (Scared) 99.3 100
q13 (Sleep) 99.3 100
q14 (Embarrassed) 99.3 100
q15 (Jealous) 99.3 100
q17 (Daily routine) 99.3 100
q17 (Joining in
activities) 99.3 100
q18 (Rating health) 99.3 100
A new generic measure of health-related quality of life for children
- 19 -
Table 5: Distribution across response options
Response Option (Level) (%)
Question 1 2 3 4 5 6 7 8
1 57.9 26.3 9.3 2.4 4
2 70.4 15.8 8.1 4 1.6
3 65 19.1 8.5 5.3 2
4 80.2 9.7 4.5 2.4 3.2
5 51.2 26.8 12.2 4.9 1.6 3.3
6 65.4 20.7 6.5 3.3 4.1
7 54.7 25.1 6.1 4.9 3.6 2.8 2.8
8 65 16.7 5.3 4.5 1.2 1.6 5.7
9 70.7 19.1 3.3 4.5 2.4
10 32.1 41.5 10.2 6.5 9.8
11 69 19.6 4.9 3.7 2.9
12 76.8 12.6 5.7 1.2 3.7
13 53.4 21.9 7.7 4.9 4.9 1.6 2.8 2.4
14 79.7 14.2 3.3 0.8 2
15 87.8 7.7 2 0 2.4
16 68.3 20.7 4.5 3.7 2.8
17 61.4 19.9 8.5 6.5 3.7
18 31.3 39 22 6.5 1.2
A new generic measure of health-related quality of life for children
- 20 -
Table 6: Reading and understanding the instructions
Read the
instructions
themselves (%)
Understood the
instructions without any
help (%)
School 95.53 88
Clinical 51 94.8

A new generic measure of health-related quality of life for children
- 21 -
Table 7: Score by rating of health Level of health Mean n
1 23.3 51
2 29.3 74
3 30.2 30
4 54 2
5 - 0
A new generic measure of health-related quality of life for children
- 22 -
Table 8: Score by whether off school or not in the last week
Mean n
Off school 17.37 28
Not off school 19.87 119
A new generic measure of health-related quality of life for children
- 23 -
Table 9: Score by category of patient
Category Mean n
No previous hospital admission 20.65 78
Previous hospital admission 22.67 18
No previous outpatient visit 20.20 41
Previous outpatient visit 21.65 55
No long standing illness 21.33 33
Long standing illness that affects
activities 22.15 39
A new generic measure of health-related quality of life for children
- 24 -
Table 10: Score by rating of health Mean n
1 16.84 25
2 18.63 32
3 21.13 21
4 31 13
5 37.67 3
A new generic measure of health-related quality of life for children
- 25 -
Table 11: Decisions over the alternative wordings
Wording to keep Wording rejected
Worried Scared
Sad Upset
Annoyed Frustrated, Angry
Pain Hurt
Tired Weak
A new generic measure of health-related quality of life for children
- 26 -
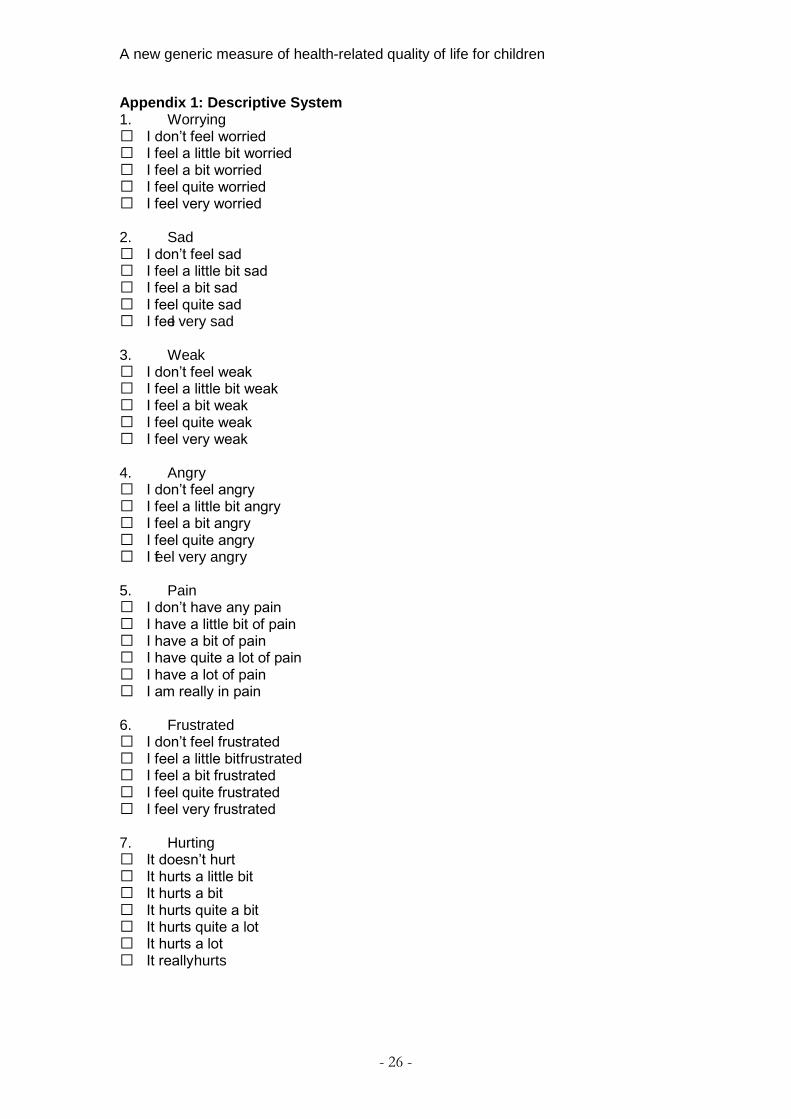
Appendix 1: Descriptive System 1. Worrying I don’t feel worried I feel a little bit worried I feel a bit worried I feel quite worried I feel very worried 2. Sad I don’t feel sad I feel a little bit sad I feel a bit sad I feel quite sad I feel very sad 3. Weak I don’t feel weak I feel a little bit weak I feel a bit weak I feel quite weak I feel very weak 4. Angry I don’t feel angry I feel a little bit angry I feel a bit angry I feel quite angry I feel very angry 5. Pain I don’t have any pain I have a little bit of pain I have a bit of pain I have quite a lot of pain I have a lot of pain I am really in pain 6. Frustrated I don’t feel frustrated I feel a little bit frustrated I feel a bit frustrated I feel quite frustrated I feel very frustrated 7. Hurting It doesn’t hurt It hurts a little bit It hurts a bit It hurts quite a bit It hurts quite a lot It hurts a lot It really hurts
A new generic measure of health-related quality of life for children
- 27 -
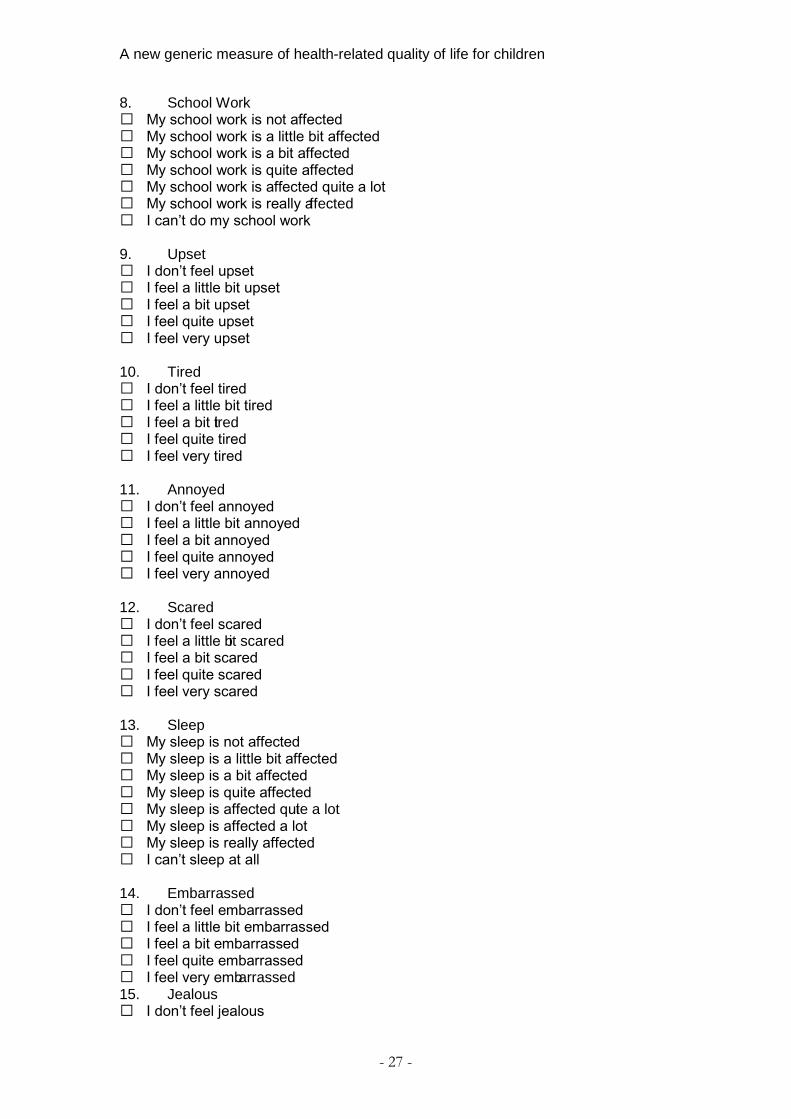
8. School Work My school work is not affected My school work is a little bit affected My school work is a bit affected My school work is quite affected My school work is affected quite a lot My school work is really affected I can’t do my school work 9. Upset I don’t feel upset I feel a little bit upset I feel a bit upset I feel quite upset I feel very upset 10. Tired I don’t feel tired I feel a little bit tired I feel a bit tired I feel quite tired I feel very tired 11. Annoyed I don’t feel annoyed I feel a little bit annoyed I feel a bit annoyed I feel quite annoyed I feel very annoyed 12. Scared I don’t feel scared I feel a little bit scared I feel a bit scared I feel quite scared I feel very scared 13. Sleep My sleep is not affected My sleep is a little bit affected My sleep is a bit affected My sleep is quite affected My sleep is affected quite a lot My sleep is affected a lot My sleep is really affected I can’t sleep at all 14. Embarrassed I don’t feel embarrassed I feel a little bit embarrassed I feel a bit embarrassed I feel quite embarrassed I feel very embarrassed 15. Jealous I don’t feel jealous
A new generic measure of health-related quality of life for children
- 28 -
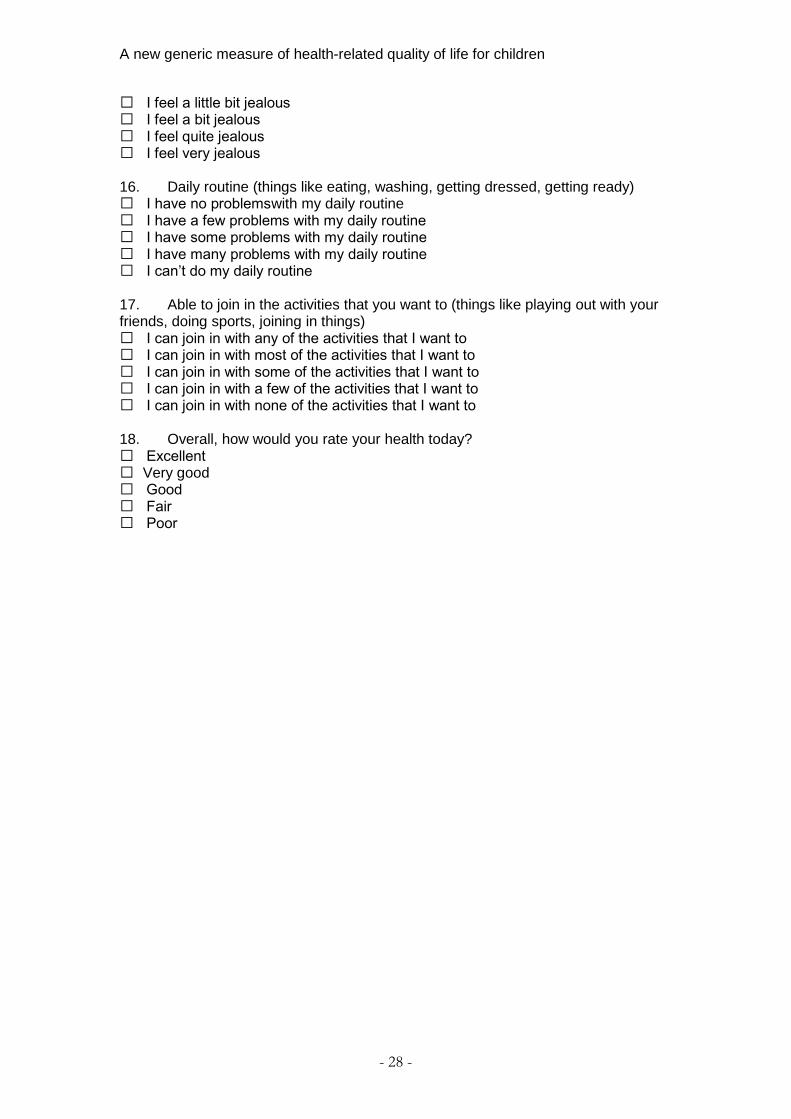
I feel a little bit jealous I feel a bit jealous I feel quite jealous I feel very jealous 16. Daily routine (things like eating, washing, getting dressed, getting ready) I have no problems with my daily routine I have a few problems with my daily routine I have some problems with my daily routine I have many problems with my daily routine I can’t do my daily routine 17. Able to join in the activities that you want to (things like playing out with your friends, doing sports, joining in things) I can join in with any of the activities that I want to I can join in with most of the activities that I want to I can join in with some of the activities that I want to I can join in with a few of the activities that I want to I can join in with none of the activities that I want to 18. Overall, how would you rate your health today? Excellent Very good Good Fair Poor
A new generic measure of health-related quality of life for children
- 29 -
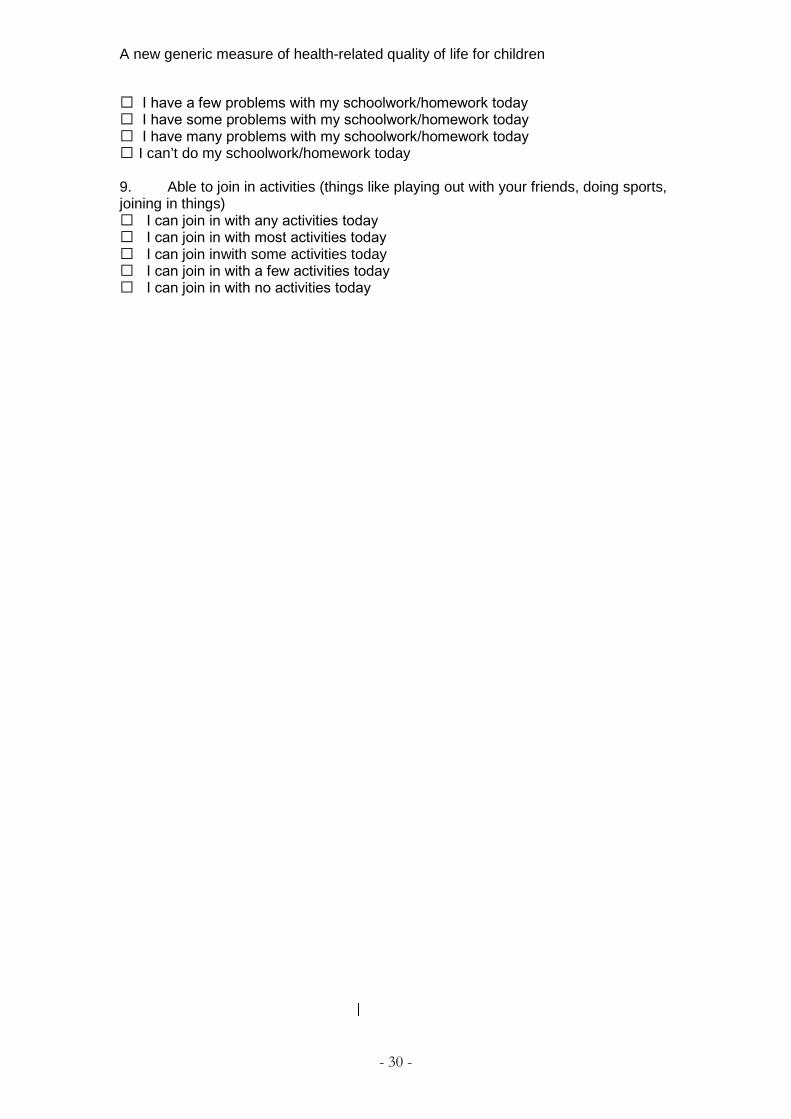
Appendix 2: Final Descriptive System – The Child Health Utility 9D 1. Worried I don’t feel worried today I feel a little bit worried today I feel a bit worried today I feel quite worried today I feel very worried today 2. Sad I don’t feel sad today I feel a little bit sad today I feel a bit sad today I feel quite sad today I feel very sad today 3. Annoyed I don’t feel annoyed today I feel a little bit annoyed today I feel a bit annoyed today I feel quite annoyed today I feel very annoyed today 4. Tired I don’t feel tired today I feel a little bit tired today I feel a bit tired today I feel quite tired today I feel very tired today 5. Pain I don’t have any pain today I have a little bit of pain today I have a bit of pain today I have quite a lot of pain today I have a lot of pain today 6. Sleep Last night I had no problems sleeping Last night I had a few problems sleeping Last night I had some problems sleeping Last night I had many problems sleeping Last night I couldn’t sleep at all 7. Daily routine (things like eating, having a bath/shower, getting dressed) I have no problems with my daily routine today I have a few problems with my daily routine today I have some problems with my daily routine today I have many problems with my daily routine today I can’t do my daily routine today 8. School Work/Homework (such as reading, writing, doing lessons) I have no problems with my schoolwork/homework today
A new generic measure of health-related quality of life for children
- 30 -
I have a few problems with my schoolwork/homework today I have some problems with my schoolwork/homework today I have many problems with my schoolwork/homework today I can’t do my schoolwork/homework today 9. Able to join in activities (things like playing out with your friends, doing sports, joining in things) I can join in with any activities today I can join in with most activities today I can join in with some activities today I can join in with a few activities today I can join in with no activities today